Evaluating Eight Global Reanalysis Products for Atmospheric Correction of Thermal Infrared Sensor—Application to Landsat 8 TIRS10 Data


1
State Key Laboratory of Remote Sensing Science, Jointly Sponsored by Beijing Normal University and Institute of Remote Sensing and Digital Earth of Chinese Academy of Sciences, Beijing 100875, China
2
Institute of Remote Sensing Science and Engineering, Faculty of Geographical Science, Beijing Normal University, Beijing 100875, China
3
U. S. Department of Agriculture, Agricultural Research Service, Hydrology and Remote Sensing Laboratory, Beltsville, MD 20705, USA
*
Author to whom correspondence should be addressed.
Remote Sens. 2018, 10(3), 474; https://doi.org/10.3390/rs10030474
Submission received: 1 February 2018
/
Revised: 12 March 2018
/
Accepted: 14 March 2018
/
Published: 19 March 2018
(This article belongs to the Special Issue Remote Sensing for Land Surface Temperature (LST) Estimation, Generation, and Analysis)
Abstract
:Global reanalysis products have been widely used for correcting the atmospheric effects of thermal infrared data, but their performances have not been comprehensively evaluated. In this paper, we evaluate eight global reanalysis products (NCEP/FNL; NCEP/DOE Reanalysis2; MERRA-3; MERRA-6; MERRA2-3; MERRA2-6; JRA-55; and ERA-Interim) commonly used in the atmospheric correction of Landsat 8 TIRS10 data by referencing global radiosonde observations collected from 163 stations. The atmospheric parameters (atmospheric transmittance, upward radiance, and downward radiance) simulated with MERRA-6 and ERA-Interim were accurate than those simulated with other reanalysis products for different water vapor contents and surface elevations. When global reanalysis products were applied to retrieve land surface temperature (LST) from simulated Landsat 8 TIRS10 data, ERA-Interim and MERRA-6 were accurate than other reanalysis products. The overall LST biases and RMSEs between the retrieved LSTs and LSTs that were used to generate the top-of-atmosphere radiances were less than 0.2 K and 1.09 K, respectively. When eight reanalysis products were used to estimate LSTs from thirty-two Landsat 8 TIRS10 images covering the Heihe River basin in China, the various reanalysis products showed similar validation accuracies for LSTs with low water vapor contents. The biases ranged from 0.07 K to 0.24 K, and the STDs (RMSEs) ranged from 1.93 K (1.93 K) to 2.02 K (2.04 K). Considering the above evaluation results, MERRA-6 and ERA-Interim are recommended for thermal infrared data atmospheric corrections.
1. Introduction
Land surface temperature (LST) plays an important role in Earth–atmosphere interactions, as well as the process of surface energy exchange [1,2,3,4]. LST has been widely used in weather forecasting, ocean circulation, drought monitoring, energy balance, and many other research areas [5,6,7]. Remote sensing is a unique way of obtaining the LST at regional and global scales. According to the radiative transfer theory, the at-sensor radiance received by a thermal infrared channel consists of three parts: the radiance emitted from the ground; the upward radiance emitted from the atmosphere towards the sensor; and the downward radiance emitted from the atmosphere, which reaches the Earth’s surface and is reflected towards the sensor [8]. Thus, atmospheric effects must be corrected before LST inversion.
Atmospheric corrections are usually required during LST retrieval by the radiative transfer equation method, single channel algorithm and multi-channel algorithm [9,10,11,12]. Atmospheric profiles are required to calculate three atmospheric parameters: atmospheric transmittance, atmospheric upward radiance, and atmospheric downward radiance. Radiosonde profiles synchronously acquired during satellite data overpass are ideal for atmospheric correction. However, this kind of profile is unavailable under most realistic conditions [13,14]. Therefore, various types of atmospheric profile products are used as radiosonde surrogates to perform atmospheric corrections, and the accuracies of LSTs are acceptable [8,13,14,15,16,17,18]. For example, Barsi et al. [15] developed an atmospheric correction tool for Landsat-5 and Landsat-7 using National Centers for Environmental Prediction (NCEP). The biases of LSTs were less than 0.5 ± 0.8 K [19]. A software tool based on the European Centre for Medium-Range Weather Forecasts (ECMWF) Interim Reanalysis (ERA-Interim) was developed by Tardy et al. [17] for atmospheric corrections of Landsat thermal infrared data. The validation of retrieved LSTs yielded an RMSE of 2.55 K (1.84 K) and a mean bias of −1.77 K (1.24 K) for a French (Tunisian) site. In addition, the researchers also investigated the efficacy of different reanalysis products for atmospheric corrections [13,14,18,20,21].
The accuracy of NCEP and Moderate Resolution Imaging Spectroradiometer (MODIS) atmospheric profile products (MOD07) for the atmospheric correction of different thermal sensors were compared at two field sites in China [14], three field sites in Spain [18], and other two Spanish sites [21]. The RMSEs of HJ-1B IRS (Infrared Scanner) LSTs were 1.16 K and 1.21 K for NCEP and MOD07, respectively [14]. The RMSEs of LSTs calculated from MODIS band 31 were 0.6 K and 1.5 K for NCEP and MOD07, respectively [18]. The RMSEs of Landsat 7 LSTs derived from the radiative transfer equation method were 1.2 K for NCEP and 1.3 K (1.6 K) for MOD07 version 5 (version 6) [21]. Moreover, Coll et al. [13] investigated the efficacy of MOD07, NCEP, Atmospheric Infrared Sounder (AIRS), and radiosonde profiles for LST retrieval in Spain. The RMSEs of LSTs were approximately 1.0 K for NCEP and MOD07, whereas the values were between −1 and −2 K for AIRS. Rosas et al. [20] assessed the impact of atmospheric correction on LST estimations using four atmospheric profiles at two sites in Saudi Arabia. Their results indicated that mean absolute errors over bare soil (alfalfa) were approximately 1.2 K (3.3 K) to 1.8 K (3.8 K) for MOD07, AIRS, NCEP/National Center for Atmospheric Research (NCAR) Reanalysis and ERA-Interim.
Although global atmospheric reanalysis products or satellite-based atmospheric profile products have been widely used in atmospheric corrections, there are still some problems that need to be resolved. First, existing studies lack representativeness. Many of these studies mainly focus on the comparison between MOD07, NCEP, and AIRS, but they lack comparisons between other products such as Modern Era Retrospective-Analysis for Research and Applications (MERRA), Japanese Reanalysis (JRA), or ECMWF using different resolutions. Second, no unified conclusions have been derived. Most investigations have been performed over individual sites and specific regions. Third, the global atmospheric reanalysis products differ in many ways, including horizontal and vertical resolutions, numerical schemes, and physical parameterizations [22,23]. For example, the study by Decker et al. [24] showed that 40-yr ECMWF reanalysis (ERA-40) had lower overall biases for latent heat flux, 6-hourly sensible heat, and precipitation than NCEP–NCAR Reanalysis, Climate Forecast System Reanalysis (CFSR), ERA-Interim, MERRA, and Global Land Data Assimilation System (GLDAS). Zhang et al. [25] revealed that ERA-Interim, CFSR, and 55-yr Japanese Reanalysis (JRA-55) were more accurate for solar radiation incidence than NCEP–NCAR, NCEP-Department of Energy (DOE) and MERRA, with biases of 11.25 W/m2, 18.57 W/m2, and 19.15 W/m2, respectively. Therefore, comprehensive investigations are urgently needed to facilitate the atmospheric correction of thermal infrared data.
According to previous studies, comparing the measured LSTs, the accuracies of retrieved LSTs using MOD07 and AIRS were lower than that using NCEP in China and Spain [13,14,18]. In addition, it is difficult to collect synchronized AIRS and MOD07 data with global radiosonde observations. Thus, satellite atmospheric profile products such as MODIS and AIRS are not considered in this study. Taking Landsat 8 TIRS10 data as an example, the aim in this study is to comprehensively investigate the utility of eight global reanalysis products in the atmospheric correction of thermal infrared using global radiosonde observations. The results will also guide the use of these reanalysis data for the atmospheric correction of other thermal infrared bands. The structure of this paper is arranged as follows: in Section 2, the data and data processing method used are described, which includes global radiosonde observations and global reanalysis products. The results, analysis, and discussion are presented in Section 3 and Section 4. Section 5 concludes.
2. Data Descriptions and Processing
2.1. Global Radiosonde Observations
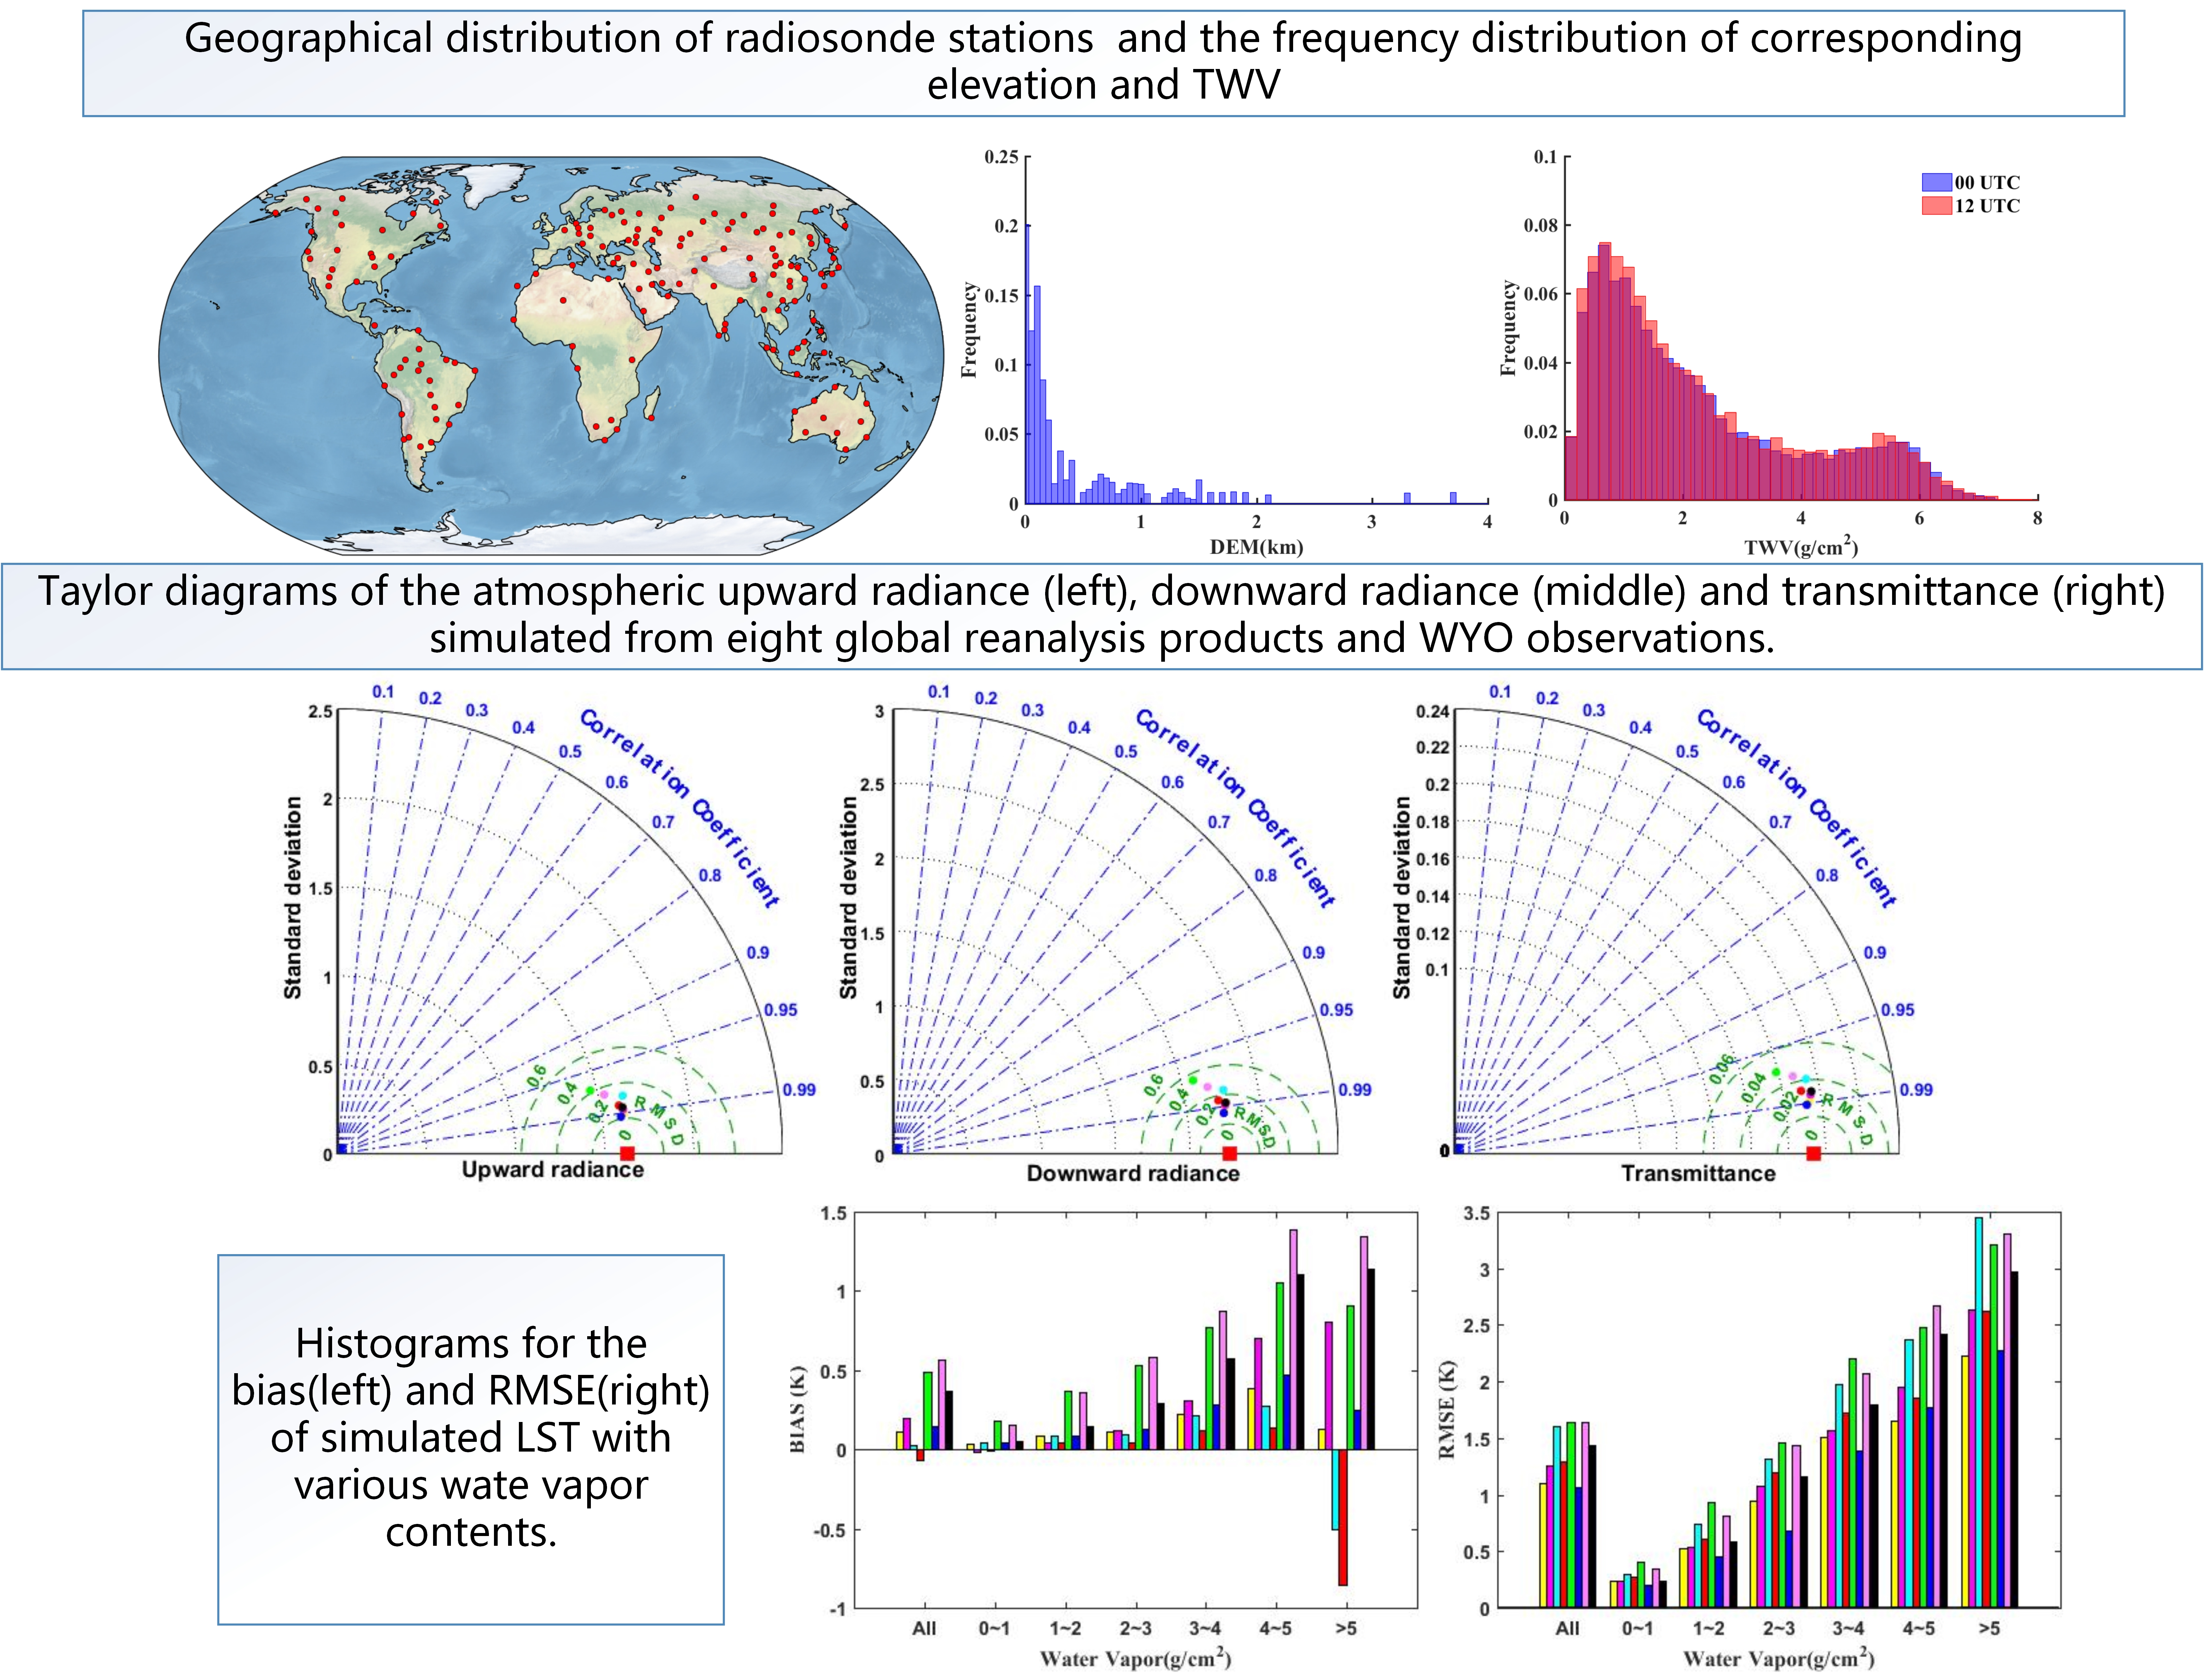
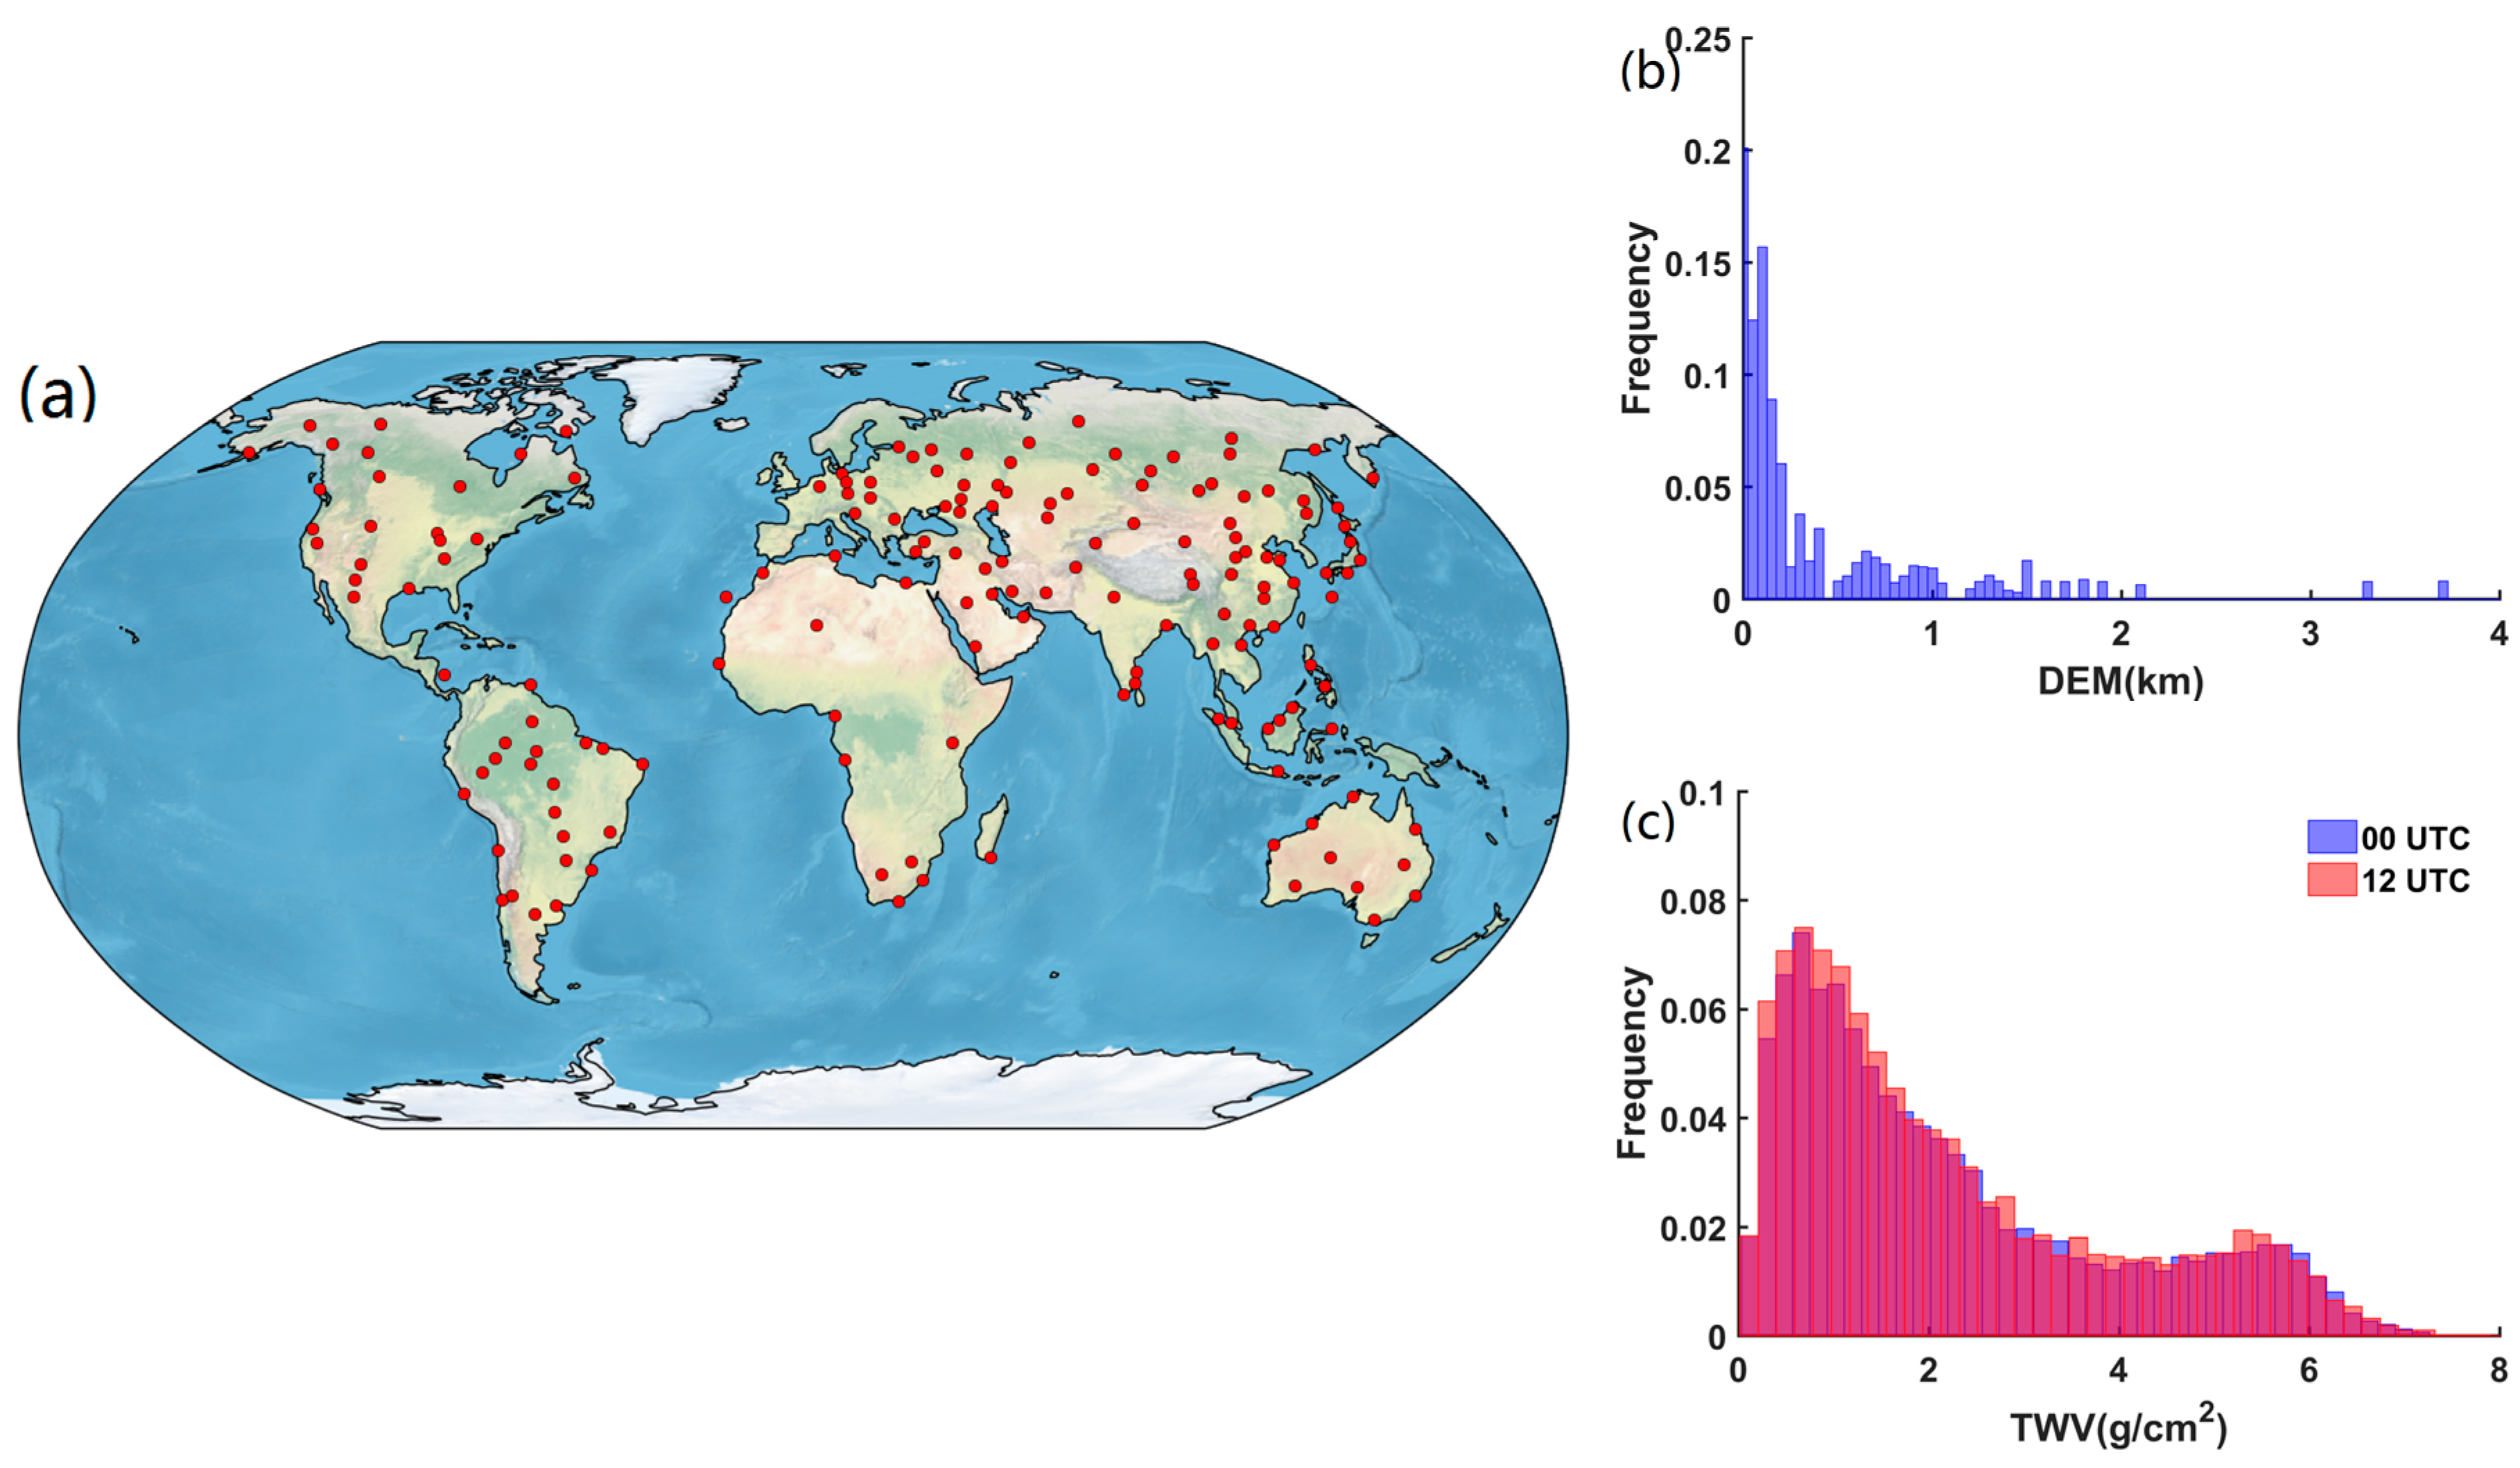
Atmospheric variables including pressure, temperature, geopotential height, relative humidity, and total precipitable water vapor content (TWV) were collected from 163 global radiosonde stations. Station information such as elevation, longitude, and latitude were also extracted. Global radiosonde observations were obtained from the University of Wyoming (WYO) website (http://weather.uwyo.edu/upperair/sounding.html). Figure 1 shows the distribution of radiosonde stations, as well as the frequency distribution of corresponding elevation and TWV.
2.2. MERRA and MERRA2
MERRA is the National Aeronautics and Space Administration (NASA) atmospheric reanalysis for the satellite era using the Goddard Earth Observing System Model, version 5 (GEOS-5) with Atmospheric Data Assimilation System (ADAS), version 5.2.0 [26]. Data are archived in HDF-5 or HDF-EOS format, which is available for 1979 to 2016. In this paper, the MAI3CPASM (inst3_3d_asm_Cp) [27] and the MAI6NPANA (inst6_3d_ana_Np) [28] data products are used. The MAI3CPASM (hereafter MERRA-3) is the MERRA Data Assimilation System 3-Dimensional assimilated state for 42 pressure levels (from the surface to 0.1 hPa) at a reduced resolution of 1.25° × 1.25°. The files contain the following times compacted into a daily file: 00, 03, 06, 09, 12, 15, 18, and 21 UTC. The MAI6NPANA (hereafter MERRA-6) is the MERRA Data Assimilation System 3-Dimensional instantaneous for 42 pressure levels at the native resolution of 2/3° longitude × 1/2° latitude. The files contain the following times compacted into a daily file: 00, 06, 12, and 18 UTC.
MERRA version 2 (MERRA-2) is a NASA atmospheric reanalysis that begins in 1980, and it replaces the original MERRA reanalysis using an upgraded version of the GEOS-5 data assimilation system version 5.12.4. MERRA-2 covers the period of 1980–present, and it continues to be an ongoing climate analysis product as resources allow. MERRA-2 data files are provided in netCDF-4 format. In this paper, M2I3NPASM (inst3_3d_asm_Cp) [29] and M2I6NPANA (inst6_3d_ana_Np) [30] data products are used. The M2I3NPASM (hereafter MERRA2-3) is the assimilation of meteorological fields for 42 pressure levels (from the surface to 0.1 hPa) at the native resolution of 0.625° longitude × 0.5° latitude. The files contain the following times compacted into a daily file: 00, 03, 06, 09, 12, 15, 18, and 21 UTC. M2I6NPANA (hereafter MERRA2-6) is the analyzed meteorological fields for 42 pressure levels at the native resolution of 0.625° longitude × 0.5° latitude. The files contain the following times compacted into a daily file: 00, 06, 12, and 18 UTC.
2.3. ERA-Interim
ERA-Interim is a global atmosphere reanalysis covering the data-rich period since 1979; it was produced by the ECMWF, and is continuously updated in real-time [31]. The data assimilation system includes a four-dimensional variational data assimilation (4D-Var) with a 12-hour time window. The spatial resolution of the dataset is approximately 80 km (T255 spectral) for 60 model layers (from the surface to 0.1 hPa) or for 37 pressure levels (from the surface to 1 hPa). ERA-Interim data files are provided in GRIB format. The ERA-Interim dataset [31,32] used in this paper is produced every 6 h (00, 06, 12, and 18 UTC) for 37 pressure levels with a spatial resolution of 0.75°, which are bi-linearly interpolated from the reduced Gaussian grid (N128).
2.4. NCEP/FNL and NCEP/R2
The archived NCEP Final Global Data Assimilation System Operational Global Analysis data (hereafter NCEP/FNL) were produced by NCEP’s Global Forecast System (GFS), which are on 1° × 1° grids prepared operationally every six hours: 00, 06, 12, and 18 UTC, from 1999 to present [33]. The dataset has 26 mandatory levels from 1000 hPa to 10 hPa, but fields at 21 mandatory levels from 1000 to 100 hPa are extracted only in this study, because relative humidity from 70 to 10 hPa are not included in this dataset.
The NCEP/DOE Reanalysis 2 (hereafter NCEP/R2) project, which was created in cooperation with the Department of Energy (DOE), is a global reanalysis of atmospheric data spanning 1979 to 2016 [34,35]. The temporal resolution of the NCEP/R2 dataset is the same as NCEP/FNL, which is 6 h (00, 06, 12, and 18 UTC) and with a spatial resolution of 2.5°. This dataset has 17 pressure levels from 1000 hPa to 10 hPa: 1000, 925, 850, 700, 600, 500, 400, 300, 250, 200, 150, 100, 70, 50, 30, 20, and 10 hPa. NCEP/FNL and NCEP/R2 data files are in GRIB format.
2.5. JRA-55
The Japan Meteorological Agency (JMA) carried out the second reanalysis project (known as JRA-55) using a more sophisticated data assimilation system and a newly prepared dataset of past observations [36,37]. As a result, the JRA-55 project produced a high-quality homogeneous climate dataset covering 55 years since 1958, which is when regular radiosonde observations began on a global basis. JRA-55 data files are provided in GRIB format. Isobaric fields are produced for 37 isobaric surfaces (from 1000 to 1 hPa) except for dew-point depression, specific humidity, and relative humidity, which are only produced for 27 levels from 1000 to 100 hPa, and thus the 27 isobaric fields from 1000 to 100 hPa are used in this paper. These fields are produced every six hours at 00, 06, 12, and 18 UTC with a spatial resolution of 1.25°. Table 1 summarizes the main characteristics of these global reanalysis data.
2.6. Atmospheric Parameter Simulation with MODTRAN
For the WYO radiosonde observations, there are some identical pressure layers in the data, which were removed before calculation. The geopotential heights were converted to geometric heights by given latitude. In addition, the number of layers greater than 126 were removed because the maximum number of layers that MODTRAN can process is 126. In total, we obtained 30,715 atmosphere profiles including 16,033 for 00 UTC and 14,682 for 12 UTC. The selected atmosphere profiles and the Landsat 8 TIRS10 spectral response function were put into the MODTRAN 5.2.1 radiative transfer code to compute three atmospheric parameters (transmittance, upward radiance, and downward radiance). The calculated atmospheric parameters were treated as ground truth data.
We followed the method proposed by Barsi et al. [15] and Li et al. [14] to extract the profiles from the global reanalysis data. First, the atmosphere profiles were extracted according to the observation time (00 UTC or 12 UTC) and the four grid corners surrounding the radiosonde stations. Then, according to the atmospheric profiles above and below the station elevation, a linear interpolation method was used to extract the atmospheric profile at the station elevation. If the radiosonde station elevation was lower than the first level altitude, the elevation interpolation was not performed. Finally, the extracted atmosphere profiles and Landsat 8 TIRS10 spectral response function were put into the MODTRAN 5.2.1 radiative transfer code to compute three atmospheric parameters. A complete calculation of the reflection term requires the evaluation of atmospheric downward radiance at all view angles covering the hemisphere [14]. According to the research of Li et al., Kondratiev, and Ellicott et al. [14,38,39], assuming the atmospheric downward radiance is isotropic [39], the atmospheric downward radiance at 53° gave a close value of the hemispherical irradiance of the atmosphere. García-Santos et al. [40] also indicated that hemispherical downward irradiance values provided by the method of Kondratiev and from NCEP profiles were all close to each other. To minimize the computational time, the downward radiance at 53° was used in place of the hemispheric value.
3. Results
3.1. Atmospheric Parameters Evaluation
3.1.1. Overall Validation Results
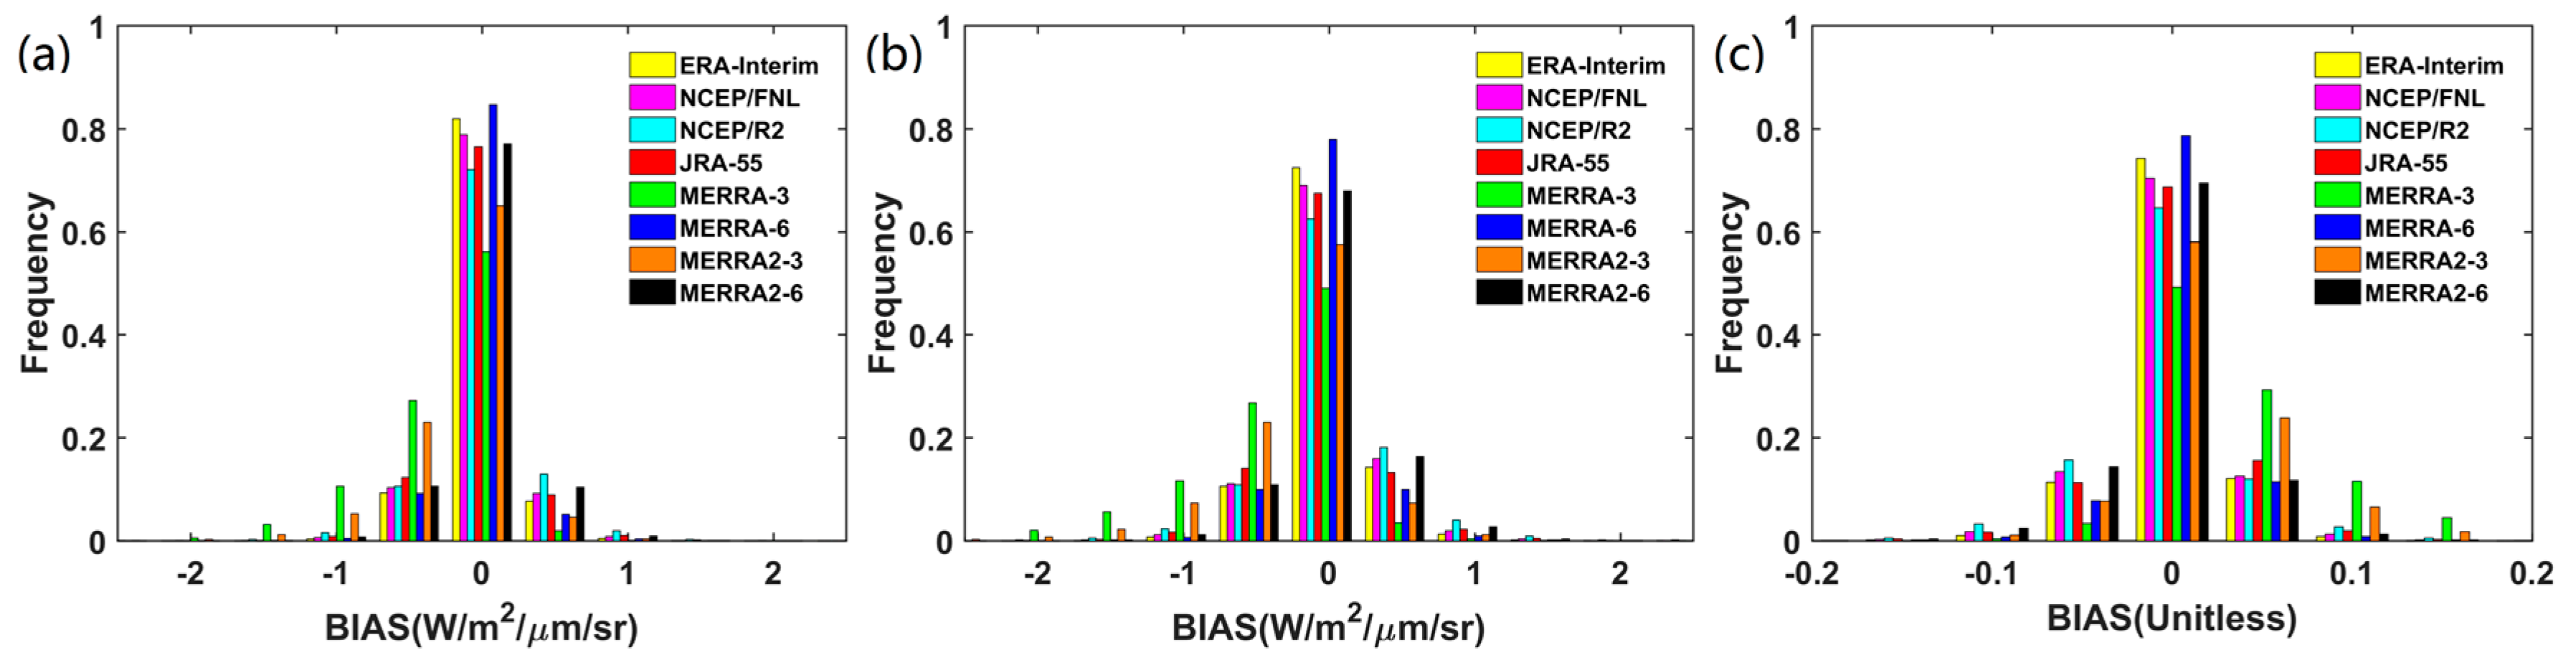
Figure 2 shows histograms of biases between the atmospheric upward radiance, downward radiance, and transmittance simulated from WYO observations, as well as eight global reanalysis products. The overestimated transmittance fraction calculated from MERRA-3 and MERRA2-3 were larger than other reanalysis products. The overall transmittance biases for MERRA-3 and MERRA2-3 were 0.04 and 0.02 (unitless), whereas the overall biases for the other six reanalysis products were less than 0.01 (unitless). The atmospheric upward radiance and downward radiance calculated from MERRA-3 and MERRA2-3 were underestimated, and their fractions were larger than other reanalysis products. The atmospheric upward radiance and downward radiance calculated from the remaining six reanalysis products exhibited similar characteristics in terms of the deviation distributions between the WYO observations and six global reanalysis products. The overall biases of simulated atmospheric upward radiance and downward radiance for MERRA-3 (MERRA2-3) were −0.31 (−0.18) and −0.43 (−0.25) , whereas the values for the remaining six reanalysis products were less than 0.03 .
Taylor diagrams of the atmospheric upward radiance, downward radiance, and transmittance simulated from eight global reanalysis products and WYO observations are shown in Figure 3. Three evaluation criteria were used to characterize the performance of the eight reanalysis products: standard deviation (STD), root mean squared deviation (RMSD), and correlation coefficient (R). As indicated in Figure 3, the MERRA-6 and ERA-Interim had similar accuracies and obtained better results than other reanalysis products. Both RMSDs of atmospheric transmittance were less than 0.03, both RMSDs of the atmospheric upward radiance and downward radiance were less than 0.23 and 0.3 , respectively, and both Rs were larger than 0.99. The RMSD and STD for MERRA-6 were slightly smaller than for ERA-Interim, but the overall biases were slightly higher than for ERA-Interim. Next, for NCEP/FNL, MERRA2-6, and JRA-55, the RMSDs of the atmospheric transmittance ranged from 0.032 to 0.035, the RMSDs of the atmospheric upward radiance ranged from 0.251 to 0.276 , the RMSDs of the atmospheric downward radiance ranged from 0.331 to 0.368 , and the Rs were greater than 0.984. The MERRA-3, MERRA2-3, and NCEP/R2 had larger deviations, the RMSDs of the atmospheric transmittance were larger than 0.04, the RMSDs of the atmospheric upward radiance and downward radiance were larger than 0.33 and 0.43 , and the Rs were less than 0.98.
Based on the aforementioned analysis, MERRA-6 and ERA-Interim obtained better results than other reanalysis products. The accuracy of NCEP/FNL, MERRA2-6, JRA-55, NCEP/R2, MERRA2-3, and MERRA-3 gradually decreased. The missing lower and warmer atmospheric layers under the near-surface layer in the MERRA-3 and MERRA2-3 profiles may explain why the transmittances of MERRA-3 and MERRA2-3 were higher than the radiosondes. The spatial resolution of NCEP/R2 is 2.5°, and the vertical resolutions only have 17 pressure levels at the same time, which may be responsible for the large deviation in the simulation results.
3.1.2. Validation Results for Various Water Vapor Contents
The atmospheric correction accuracies in the TIR data are dominated by water vapor content [13]. To investigate the accuracy of eight reanalysis products, we divided the atmospheric parameters into six groups based on water vapor content: 0~1 g/cm2 (9303), 1~2 g/cm2 (8209), 2~3 g/cm2 (4716), 3~4 g/cm2 (2626), 4~5 g/cm2 (2277), and >5 g/cm2 (3584). The histograms of the biases and RMSDs for the atmospheric upward radiance, downward radiance, and transmittance with various water vapor contents are shown in Figure 4.
The biases of the three atmospheric parameters for MERRA-3 and MERRA2-3 were higher than other reanalysis products with various water vapor contents. The biases of the atmospheric transmittance were between 0.007 (0.012) and 0.042 (0.069) for MERRA2-3 (MERRA-3). The biases of the atmospheric upward radiance were between −0.05 (−0.08) and −0.45 (−0.67) for MERRA2-3 (MERRA-3). The biases of the atmospheric downward radiance were between −0.09 (−0.13) and −0.52 (−0.8) for MERRA2-3 (MERRA-3). The biases of the atmospheric transmittance for other reanalysis products were between −0.009 and 0.019. The biases of the atmospheric upward radiance for other reanalysis products were between −0.13 and 0.05 . The biases of the atmospheric downward radiance for other reanalysis products were between −0.21 and 0.07 . The atmospheric transmittance for MERRA-3, MERRA2-3, and MERRA-6 with various water vapor contents were all overestimated; the corresponding atmospheric upward radiance and downward radiance biases were underestimated, except the atmospheric upward radiance and downward radiance for MERRA-6 regarding water vapor content was less than 1 g/cm2.
MERRA-3 had maximum RMSD values for the three atmospheric parameters with various water vapor contents, followed by MERRA2-3 and NCEP/R2. The RMSDs of the three atmospheric parameters for the remaining reanalysis products showed no apparent differences, but MERRA-6 or ERA-Interim had the minimum RMSD with various water vapor contents. When the water vapor content was lower than 1 g/cm2, the RMSDs of the atmospheric upward radiance, downward radiance, and transmittance for all reanalysis products were less than 0.11 , 0.18 , and 0.015, respectively. When the water vapor content was between 1 g/cm2 and 4 g/cm2, the RMSDs of three atmospheric parameters for MERRA-6, ERA-Interim, NCEP/FNL, MERRA2-6, JRA-55, NCEP/R2, MERRA2-3, and MERRA-3 gradually increased. When the water vapor content was larger than 4 g/cm2, the RMSDs of the atmospheric upward radiance, downward radiance, and transmittance for all reanalysis products gradually decreased with the water vapor content. Moreover, the RMSDs of the three atmospheric parameters for MERRA-6 and ERA-Interim were lower than other reanalysis products with high water vapor contents.
3.1.3. Validation Results for Different Elevations
It is well known that the near-surface air temperature and precipitable water vapor distribution are affected by topography [41,42]. The differences between reanalysis products may change with an increase in surface elevation because various reanalysis products have different pressure levels. To illustrate the accuracy of eight reanalysis products, we divided the atmospheric parameters into four groups by surface elevation: 0~0.5 km (22,494), 0.5~1 km (4452), 1~2 km (3099), and >2 km (670). The relative errors of the atmospheric upward radiance, downward radiance, and transmittance for different surface elevations are shown in Table 2.
MERRA-3 and MERRA2-3 had larger biases for the three atmospheric parameters than the other reanalysis products for different elevations. The absolute values of the relative biases of transmittance were between 1.93% (3.52%) and 3.01% (5.3%) for MERRA2-3 (MERRA-3), and those values were less than 1.9% for other reanalysis products at different elevations. The absolute values of relative biases of atmospheric upward radiance were all larger than 8.76% (15.67%) for MERRA2-3 (MERRA-3), and the relative biases of the atmospheric upward radiance were between −2.94% and 17.61% for other reanalysis products. The absolute values of relative biases of the atmospheric downward radiance were all larger than 7.73% (14.32%) for MERRA2-3 (MERRA-3), and the relative biases of the atmospheric downward radiance were between −2.42% and 16.2% for other reanalysis products.
When the elevation was less than 2 km, MERRA-6 had the lowest relative RMSDs of the atmospheric upward radiance, downward radiance, and transmittance compared to other reanalysis products, which was followed by ERA-Interim, NCEP/FNL, and MERRA2-6. The relative RMSDs of transmittance were between 2.5% and 2.98% for all reanalysis products, and the Rs of three atmospheric parameters were larger than 0.9 for all reanalysis products when the elevation was less than 2 km. When the elevation changed from 0~0.5 km or 0.5~1.0 km to 1.0~2.0 km, the relative RMSDs of the atmospheric upward radiance were 10.14% (11.06%), 15.52% (15.52%), and 20.05% (21.23%) for MERRA-6 (ERA-Interim), the relative RMSDs of the atmospheric downward radiance were 8.83% (9.78%), 14.3% (14.81%), and 19.17% (20.15%) for MERRA-6 (ERA-Interim). The NCEP/FNL (MERRA2-6) had relative RMSDs of 12.45% (12.91%), 18.1% (18.1%), and 22.41% (22.41%) for the atmospheric upward radiance, whereas those values were 10.82% (11.36%), 17.01% (16.96%), and 20.76% (21.59%) for downward radiance when the elevation changed from 0~0.5 km or 0.5~1.0 km to 1.0~2.0 km. The relative RMSDs of upward radiance and downward radiance were all larger than 12.91% and 11.32% for the remaining reanalysis products when the elevation was less than 2 km.
When the elevation was greater than 2 km, ERA-Interim, JRA-55, MERRA-6, MERRA2-6, and NCEP/FNL had similar relative RMSDs, and the relative RMSDs were all less than 35.23%, 31.74%, and 3.46% for the atmospheric upward radiance, downward radiance, and transmittance, respectively. Although the relative bias and RMSD of JRA-55 for high surface elevation were less than those values for low surface elevation, the Rs of the atmospheric upward radiance (transmittance) changed from 0.987 (0.985) to 0.895 (0.907). The relative RMSDs of the atmospheric upward radiance for NCEP/R2, MERRA-3, and MERRA2-3 were 42.57%, 55.78%, and 55.78%, respectively, whereas those values were 38.82%, 52.69%, and 53.25%, respectively, for the atmospheric downward radiance. The relative RMSDs of the atmospheric transmittance for NCEP/R2, MERRA-3, and MERRA2-3 were 4.24%, 5.69%, and 5.69%, respectively.
3.2. Application to Landsat 8 LST Retrieval
3.2.1. Simulation Data
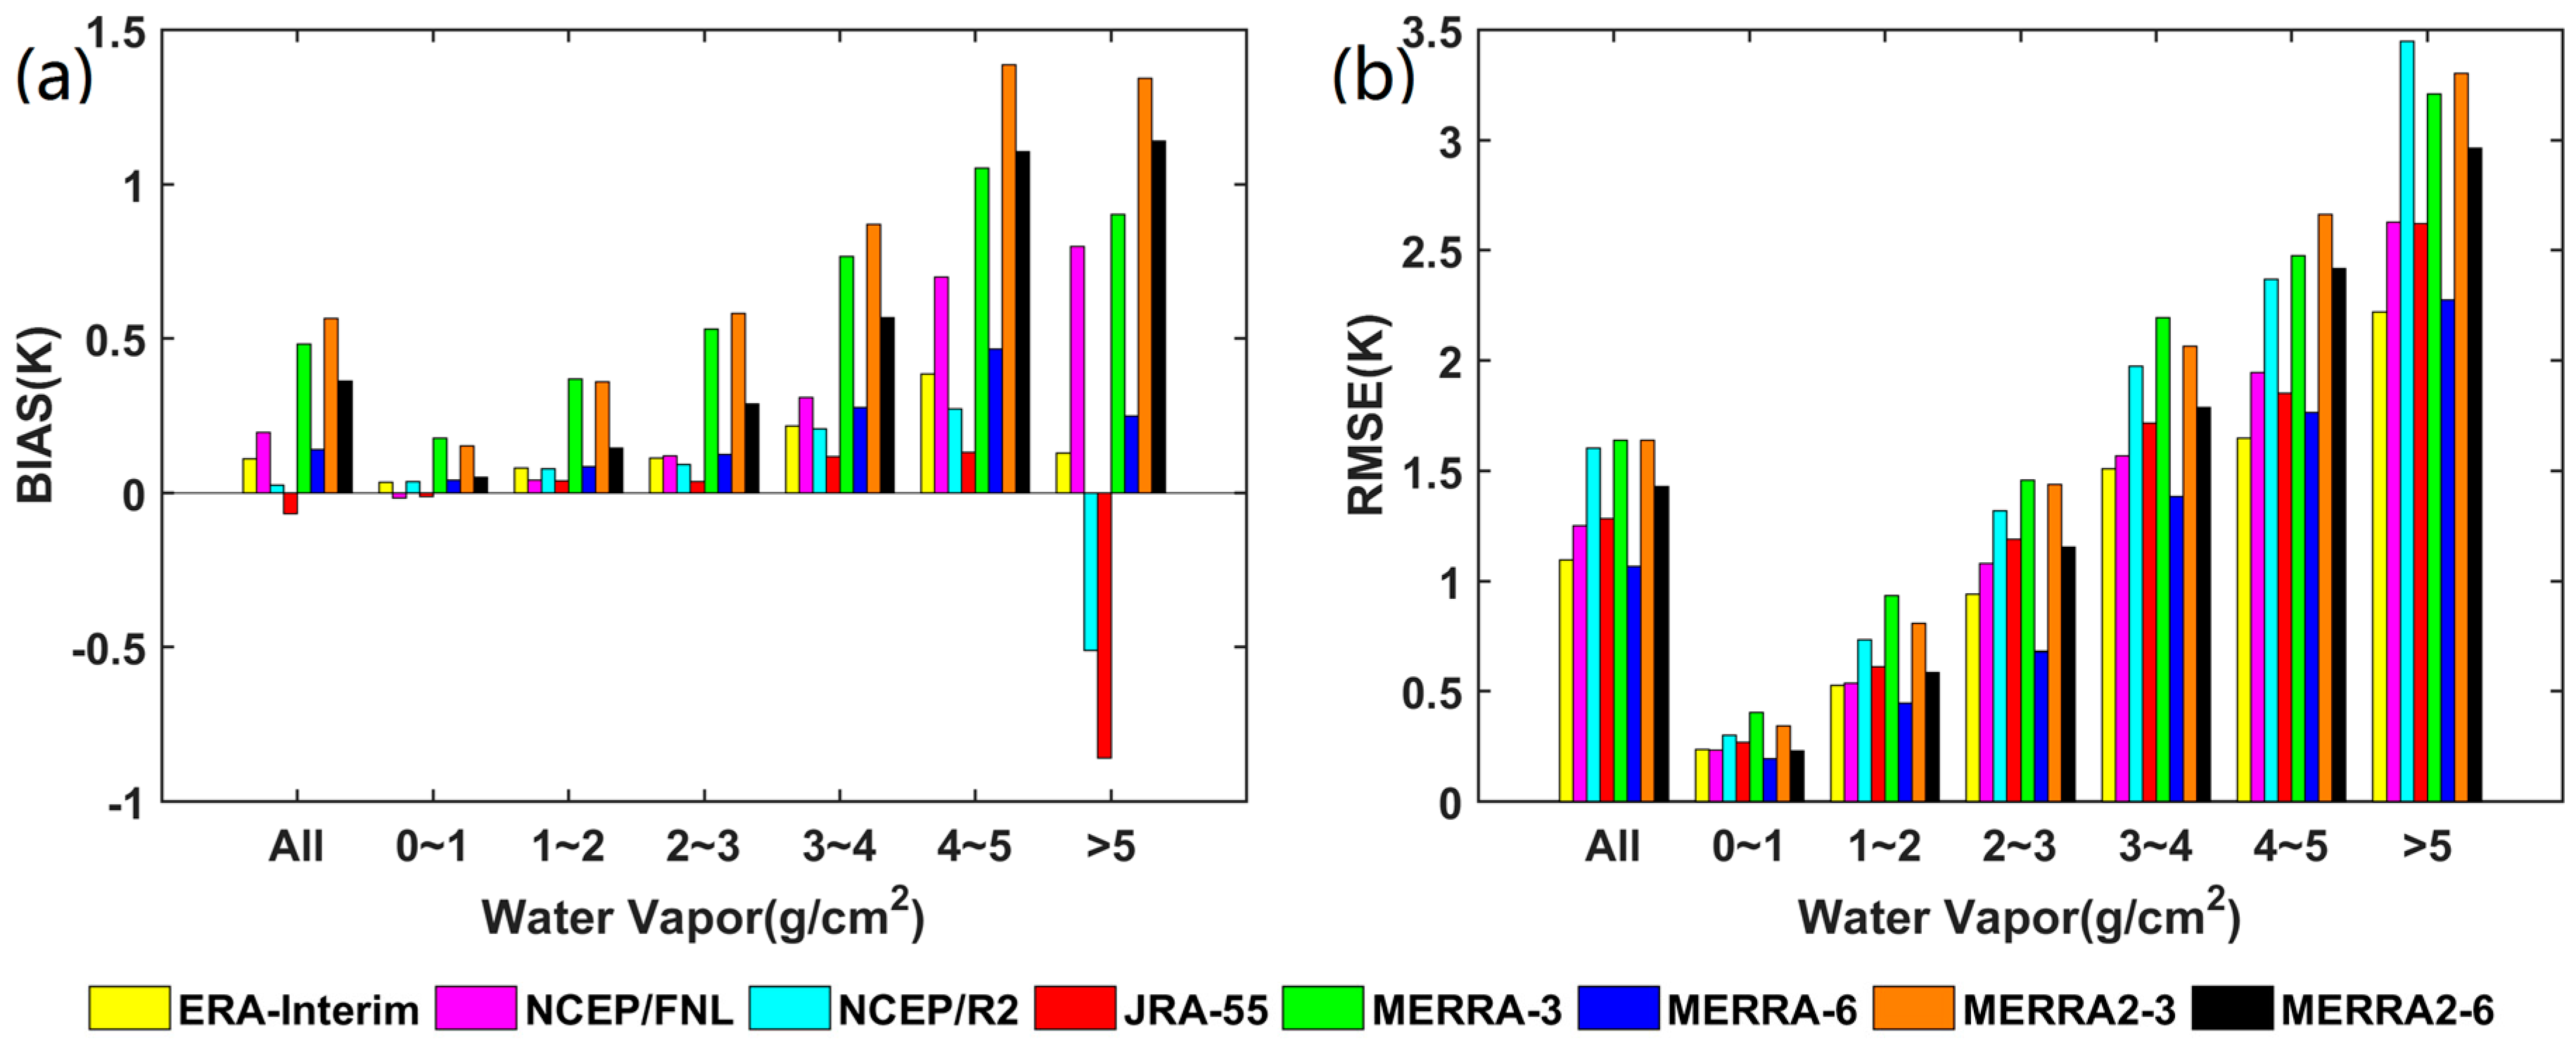
First, land surface radiances were calculated based on the Planck function using the temperature (T0) of the global radiosonde profiles’ first layer as the initial LST, and then the top of the atmospheric radiance was simulated with a radiative transfer equation (RTE) using the atmospheric parameters calculated from the global radiosonde profiles, which is combined with the Landsat 8 TIRS10 spectral response. LSTs were retrieved with the RTE method using the atmospheric parameters calculated from different reanalysis products. In the simulation, the initial LSTs varied from T0 − 20 K to T0 + 20 K in steps of 5 K. The land surface emissivity varied from 0.89 to 1.0 with a step of 0.01. Finally, the retrieved LSTs were compared to the true values. To illustrate the accuracy of eight reanalysis products, we divided the retrieval results into six groups based on water vapor content: 0~1 g/cm2, 1~2 g/cm2, 2~3 g/cm2, 3~4 g/cm2, 4~5 g/cm2, and >5 g/cm2. The histograms of the LST RMSE and bias values with various water vapor contents are shown in Figure 5.
The overall LST biases were less than 0.2 K for ERA-Interim, NCEP/R2, NCEP/FNL, JRA-55, and MERRA-6, and the overall LST biases were 0.48 K, 0.57 K, and 0.36 K for MERRA-3, MERRA2-3, and MERRA2-6, respectively. MERRA-3 and MERRA2-3 had the maximum overall LST RMSE, followed by NCEP/R2, and the RMSEs were all larger than 1.60 K. ERA-Interim and MERRA-6 showed lower RMSEs than other reanalysis products, with overall LST RMSEs of 1.09 K and 1.07 K, respectively. The overall LST RMSEs calculated from NCEP/FNL, JRA-55, and MERRA2-6 were 1.25 K, 1.28 K, and 1.43 K, respectively. The ERA-Interim and MERRA-6 were accurate than the other reanalysis products with various water vapor contents. The LST RMSEs were both less than 2.28 K, and LST biases were both less than 0.47 K.
The LST RMSEs for all reanalysis products gradually increased with water vapor contents. MERRA-3 and MERRA2-3 had high biases and RMSEs at all water vapor content ranges. MERRA2-6 showed a high bias when the water vapor content was greater than 4 g/cm2. When the water vapor content was greater than 5 g/cm2, the growth rate of the biases were obvious for MERRA2-6, MERRA-3, and MERRA2-3; JRA-55 had the largest negative bias and NCEP/R2 had the largest RMSE. From the results, we can conclude that ERA-Interim and MERRA-6 are suitable for the atmospheric correction of the thermal infrared channel and accurate LSTs can be obtained with overall bias values better than 0.15 K and overall RMSEs less than 1.1 K.
3.2.2. Real Data
Thirty-two Landsat 8 TIRS images were acquired from the Heihe River basin (Gansu province, China) between April 2013 and October 2015. The estimated LSTs determined using the RTE method were evaluated with the ground measurements from six in situ sites during the Heihe Watershed Allied Telemetry Experimental Research (HiWATER) experiment [43]. There were two in situ sites over the vegetation surfaces and four in situ sites over bare soil, and detailed information about the in situ sites can be found in Meng et al. [44]. The land surface emissivity were determined using the method proposed by Meng et al. [8], which used the ASTER Global Emissivity Dataset (GED) and Vegetation Cover Method (VCM) to improve land surface emissivity accuracy. Following the method proposed by Barsi et al. [15] and Li et al. [14], three atmospheric parameters over the in situ sites were calculated with spatial-temporal interpolation. The emissivities measured by BOMEM MR304 [45] or calculated from Global LAnd Surface Satellite (GLASS) broadband emissivity (BBE) [46,47,48] were used to calculate the in situ LSTs from the ground measurements equipped with one Kipp & Zonen CNR1 net radiometer or Apogee SI-111 thermal infrared radiometers [49]. The bias, root mean squared error (RMSE), and STD between in situ LSTs and estimated LSTs from the eight reanalysis products are shown in Table 3. The LST estimated from the ERA-Interim was slightly accurate than LSTs estimated from other reanalysis products, with a bias of 0.07 K, STD and RMSE were equal to 1.93 K. The LST estimated from JRA-55 was the least accurate, with a bias, STD, and RMSE of 0.32 K, 2.02 K, and 2.04 K, respectively. The other six reanalysis products showed a similar accuracy, with a bias range of 0.16 K to 0.24 K and STD (RMSE) range of 1.96 K (1.96 K) to 1.98 K (1.99 K). According to the MOD05 product statistics, most of the water vapor content in this area was less than 2 g/cm2. The small LST difference is acceptable, which is similar to the results of the simulation data under low water vapor content. In addition, the precision of LST retrieval can be influenced by many factors, such as atmospheric correction error, ground measurement error, emissivity error, water vapor content, cloud contamination, etc.
4. Discussion
4.1. Intercomparison of Water Vapor Content
It is import to analyze the representativeness of TWV calculated from reanalysis products, since water vapor is the most relevant absorbing gas in the thermal window region [50]. According to the method used in Mattar et al. [51], TWV can be calculated from the reanalysis profiles. Figure 6a shows the TWV biases between reanalysis profiles and radiosondes. The height differences between the interpolated model heights and the radiosonde station elevations are shown in Figure 6b. Figure 6 indicates that MERRA-6, ERA-Interim, NCEP/FNL, and MERRA2-6 could well represent the distribution of water vapor content, followed by NCEP/R2 and JRA-55. The fraction of TWV biases less than 1.0 g/cm2 calculated from MERRA-6, NCEP/FNL, MERRA2-6, ERA-Interim, NCEP/R2, and JRA-55 all exceeded 98%. The fraction of TWV biases less than 1.0 g/cm2 was only 93% and 96% for MERRA-3 and MERRA2-3. Height differences were between 0 and 200 m for MERRA-6, NCEP/FNL, MERRA2-6, ERA-Interim, NCEP/R2, and JRA-55. MERRA3 and MERRA2-3 overestimated the heights, and the height differences could reach up to 2500 m (3000 m) for MERRA2-3 (MERRA-3). Ninety-four percent of the height differences were less than 100 m for the other six reanalysis products. Those results may partially explain the overestimated transmittances and the underestimated upward (downward) radiances in Figure 2.
TWV biases greater than 1.0 g/cm2 mainly existed in the region of 2.0–8.0 g/cm2 for the eight reanalysis products. The large TWV biases also mainly appeared in the low elevation regions where elevations were lower than 500 m. These sites with large TWV biases were mainly located in the tropical region of Southeast Asia and South America, and had high water vapor content and high cloud cover. These circumstances may introduce large errors into three atmospheric parameters and LST retrievals. First, the interpolated model height of reanalysis products can only reach up to the elevation of the 1000 hPa pressure level. The missing lower and warmer atmospheric layers under the near-surface layer may explain the large TWV biases in Figure 6a, especially in the MERRA-3 and MERRA2-3 profiles. Second, the temperature and humidity profiles of low spatial resolution reanalysis products are more likely to be affected by cloud-contamination in Southeast Asia and South America. As indicated by Simmons et al. [52], correlations of mean monthly specific and relative humidity between the reference dataset and ERA-Interim in South America are lower than in other continents. Gomis-Cebolla et al. [53] also indicated cloud-contamination introduced the possibility of temperature alterations in the Amazonian tropical forests.
4.2. Comparison with Previous Studies
Based on the aforementioned analysis, MERRA-6 and ERA-Interim obtained better results than other reanalysis products. The accuracy of NCEP/FNL, MERRA2-6, JRA-55, NCEP/R2, MERRA2-3, and MERRA-3 gradually decreased. First, MERRA-6 and ERA-Interim were slightly accurate than the other reanalysis products, whether in high or low water vapor content conditions. When the water vapor content was greater than 5 g/cm2, the RMSDs of three atmospheric parameters for ERA-Interim were lower than that for MERRA-6, there is an assertation that ERA-Interim has better accuracy than MERRA-6 in high water vapor content conditions. Second, MERRA-6 and ERA-Interim had lower RMSDs of the three atmospheric parameters compared to the other reanalysis products at different elevations. In conclusion, both MERRA-6 and ERA-Interim are recommended for the atmospheric correction of thermal infrared data for different water vapor contents and surface elevations. Moreover, ERA-Interim is recommended for use with the atmospheric correction of thermal infrared data in high water vapor content conditions.
The accuracy of NCEP/FNL in Europe was similar to the research of Pérez-Planells et al. [18] in Spain. According to the validation of MODIS TIR bands by Pérez-Planells et al. [18] using global radiosonde profiles, the biases (RMSEs) of atmospheric transmittances for NCEP/FNL were between −0.019 (±0.02) and 0.007 (±0.04). The biases (RMSEs) of atmospheric upward radiance for NCEP/FNL were between −0.07 (±0.13) and 0.15 (±0.3) , and the values were −0.014 (±0.2) and 0.23 (±0.4) for downward radiance. In this study, the bias and RMSE of atmospheric transmittance in Europe were 0.002 and 0.024. The bias and RMSE of atmospheric upward radiance in Europe were 0.012 and 0.17 , whereas the values were 0.018 and 0.248 for atmospheric downward radiance. NCEP/FNL showed a large bias when the water vapor content was greater than 5 g/cm2, which is consistent with the research of Barsi et al. [19] showing that NCEP/FNL is expected to be less accurate in wetter conditions.
It appears that the overall results of the simulation data and real data are inconsistent, but this result can be explained by the following reasons. First, the small LST difference is consistent with the results in Section 3.1.2 when the water vapor content was less than 2 g/cm2. In Section 3.1.2, when the water vapor content was less than 2 g/cm2, the atmospheric upward radiance difference, downward radiance difference, and transmittance difference among the different reanalysis products were less than 0.3 , 0.4 , and 0.03, respectively. Second, when the water vapor content was less than 2 g/cm2, LST biases were between 0.04 K and 0.37 K for simulation data, and the values were between 0.07 K and 0.32 K for real data. According to the MOD05 product statistics, most of the water vapor content in this area was less than 2 g/cm2; thus, the small LST difference in the real data is reasonable. In addition, the validation results are also consistent with the study by Rosas et al. [20]; the LST RMSEs were 1.58 K and 1.56 K for ERA-Interim and NCEP/NCAR Reanalysis 1 over the arid land irrigation region. Although the overall biases (RMSEs) at validation sites between different reanalysis products were less than 0.25 K (0.1 K), the difference across the entire scene is more noticeable. For example, the overall bias of atmospheric transmittance on 24 July 2014 between ERA-Interim and MERRA2-6, JRA-55, and NCEP/R2 were −0.03, −0.02, and 0.01, respectively, and the overall LST biases were 0.58 K, 0.12 K, and −0.06 K, respectively. The research of Tardy et al. [17] also indicated that the LST bias (RMSE) difference could reach up to 1.49 K (1.49 K) between using the minimum and the maximum atmospheric parameters for the entire footprint.
We also classified the LSTs estimated from real data by month to investigate the efficacy of the reanalysis products. The data collected from May to August are called summer data; the data collected from November to March of the following year are called winter data. The biases of summer data were between 0.74 K and 1.21 K, and the RMSEs of summer data were between 2.18 K and 2.56 K. The biases of winter data were between −0.26 K and −0.35 K, and the RMSEs of winter data were between 1.89 K and 1.91 K. Most of the water vapor content in this area is lower than 2 g/cm2; however, the results are consistent with the research of Windahl et al. [54]. In their study, NCEP/FNL was used to calculate three atmospheric parameters, and the overall LST RMSEs retrieved from the radiative transfer equation method were 2.35 K for all Landsat datasets. When the TWV was below 2 g/cm2, the RMSE was 2.13 K, whereas the RMSE was 2.68 K when the TWV was greater than 2 g/cm2.
From the two validation results, we can conclude that ERA-Interim and MERRA-6 are suitable for the atmospheric correction of the thermal infrared channel with various water vapor contents. When the water vapor content is less than 4 g/cm2, NCEP/FNL, MERRA2-6, and JRA-55 can also be used for atmospheric correction of the thermal infrared channel, with LST biases (RMSEs) less than 0.57 K (1.79 K). When the water vapor content is higher than 4 g/cm2, ERA-Interim is recommended for atmospheric correction of the thermal infrared channel due to a smaller bias and RMSE than MERRA-6. The precision of atmospheric correction can be influenced by many factors, such as the accuracy of the reanalysis products, spatio-temporal interpolation, water vapor content, cloud contamination, etc. The cloud contamination not only affects the brightness temperature of the thermal infrared channel, but also influences the spatio-temporal interpolation because various reanalysis products have different temporal, spatial and vertical resolutions. Windahl et al. [54] indicated that the overall LST RMSE retrieved from radiative transfer equation method for all Landsat datasets were 0.44 K larger than those values for the cloud-free Landsat dataset. Meng et al. [44] also indicated the LST calculated from the radiative transfer equation method was underestimated when the study area was covered by clouds.
4.3. Effects of Parameter Settings in Radiative Transfer Model
This work follows previous studies, but discrepancies also exist: (1) The upper atmosphere layers (approximately 30~100 km) are not considered in our calculation, but Barsi et al. [15,19] and Tardy et al. [17] used a surface-to-space profile for air temperature, water vapor, and pressure to derive three atmospheric parameters. (2) Rural extinction with default visibility equal to 23 km was selected as the boundary layer aerosol models to describe the extinction type and default meteorological range. (3) Atmospheric trace gases (ozone, carbon monoxide, methane, etc.) are also not considered in our calculation. Those parameter settings may introduce some deviations into the results, and therefore we examined the deviations based on the following three aspects.
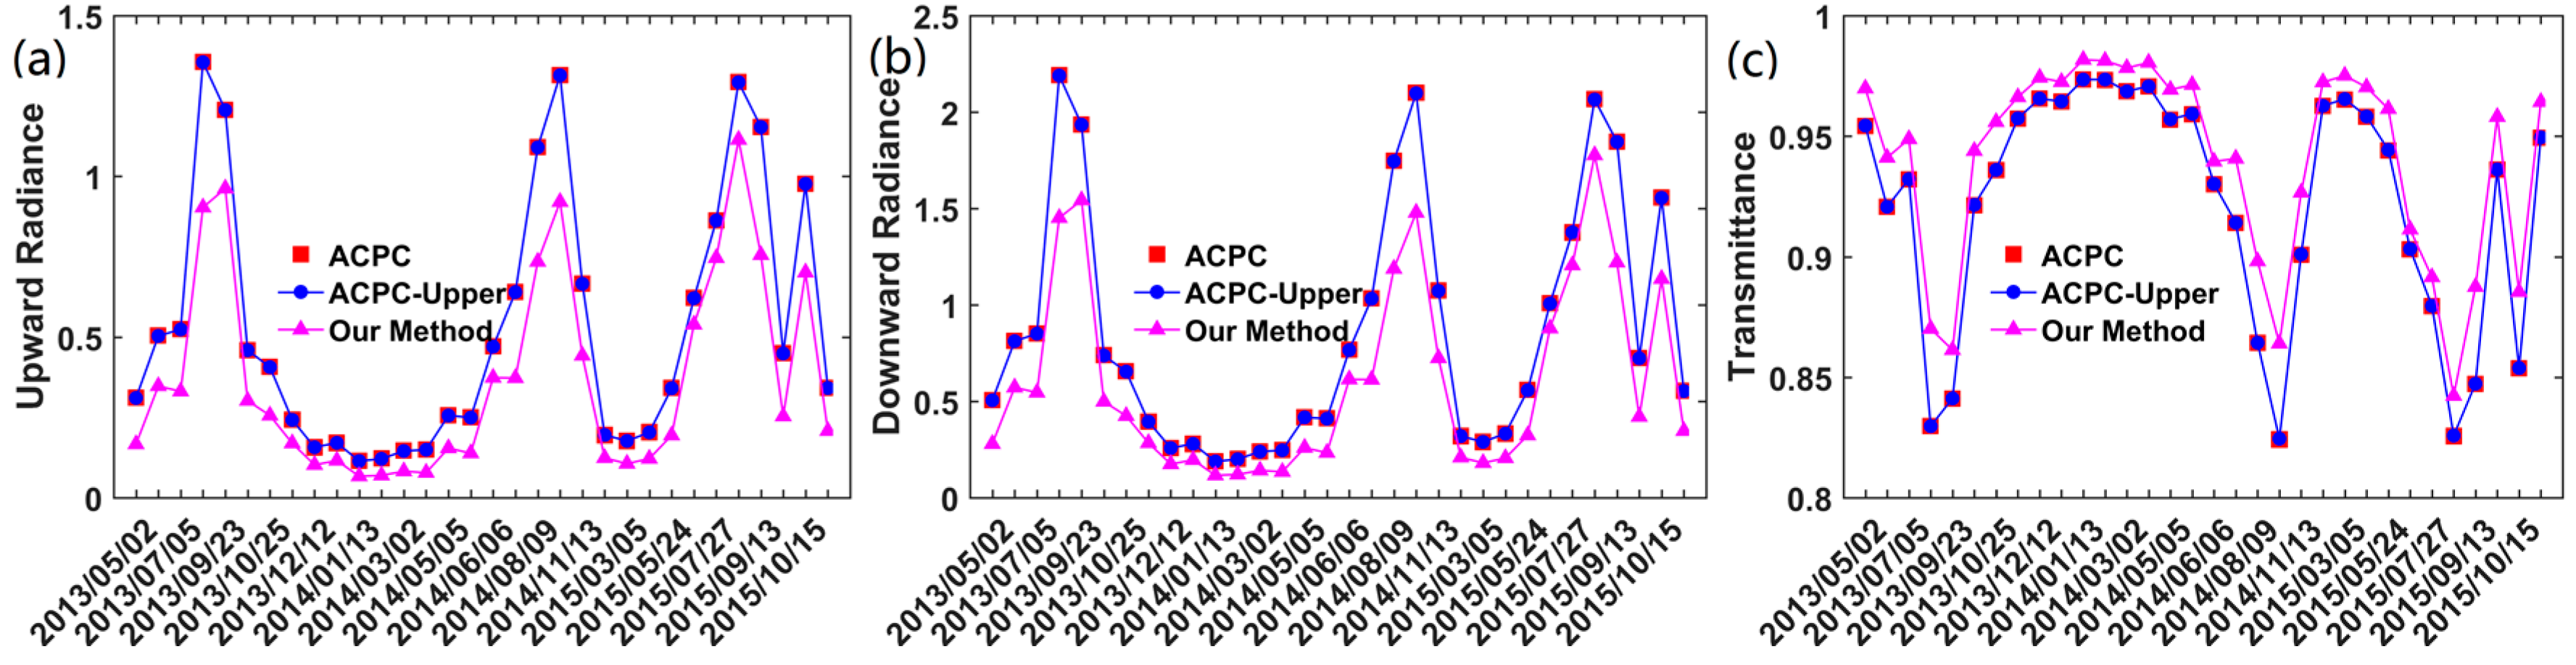
First, we compared two sets of results for three atmospheric parameters where the calculation considered upper atmosphere layers, or not. Three atmospheric parameters of one vegetated site were calculated with the Atmospheric Correction Parameter Calculator (ACPC) developed by Barsi et al. [15,19], which considered the upper atmosphere layers. At the same time, the profiles used by the ACPC excluded the upper atmosphere layers (ACPC-Upper) that were used to calculate the three atmospheric parameters. In addition, three atmospheric parameters were calculated from our method using NCEP/FNL without considering the upper atmosphere layers. As shown in Figure 7, the three atmospheric parameters between ACPC and ACPC-Upper are almost the same, which indicates that the effect of the upper atmosphere layers can be neglected at lower water vapor contents. However, those values have a large deviation in our method from May to September, and this deviation may be caused by the interpolation method, because the interpolations in time and space are both linear. For example, there are two interpolation methods used in ACPC. When using the profile extracts from the grid corner that is closest to the site, the atmospheric transmittance, upward radiance, and downward radiance are 0.88, 0.89 , and 1.52 on 9 August 2014. When using the profile generated by interpolating between the surrounding four profiles, the atmospheric transmittance, upward radiance, and downward radiance are 0.84, 1.2 , and 2.06 on 9 August 2014. Moreover, the elevation interpolation was not performed when the atmospheric parameters were interpolated to Landsat pixel scale. Bento et al. [55] indicated the problem of water vapor misestimation when using ERA-Interim over mountainous regions, and the accuracy of LST retrievals improved with the corrected water vapor profile. This result is very good news for LST retrieval at high elevation.
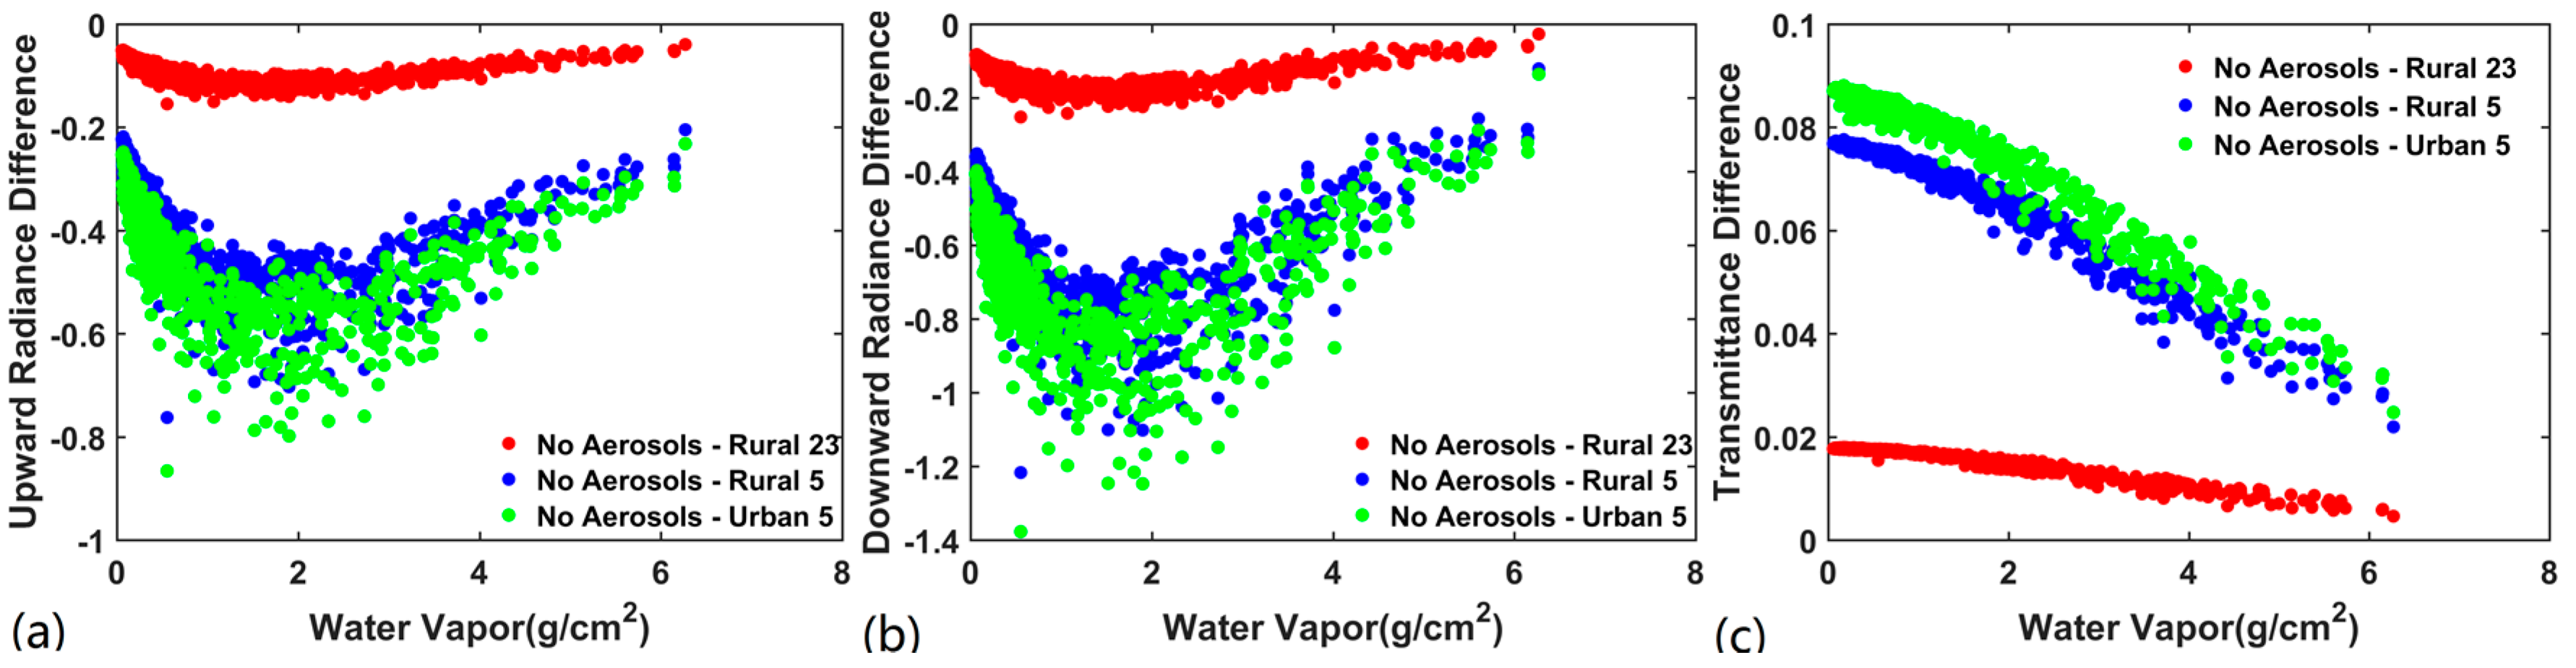
Second, four boundary layer aerosol models were used to describe the effects of different aerosol models on the three atmospheric parameters: No aerosol or cloud attenuation (No aerosol), Rural (23 km visibility) aerosols (Rural 23), Rural (5 km visibility) aerosols (Rural 5), and Urban (5 km visibility) aerosols (Urban 5). According to the method used by Galve et al. [56], 946 Thermodynamic Initial Guess Retrieval (TIGR) profiles [57] under clear sky conditions were chosen for the simulation. As shown in Figure 8, the atmospheric transmittance differences between No aerosol and Rural 23 were from 0.005 to 0.018, and the atmospheric transmittance differences between No aerosol and Rural 5 (Urban 5) were from 0.022 (0.025) to 0.078 (0.088). When the water vapor content was less than 2 g/cm2, the atmospheric upward radiance and downward radiance differences under the four boundary layer aerosol models increased with an increase of water vapor content, and the trend was the opposite when the water vapor content was greater than 2 g/cm2. The four boundary layer aerosol models have different effects on three atmospheric parameters, which is consistent with the research of Rosas et al. [20], showing that aerosol optical depth content had an impact on LST estimations over arid land irrigation regions. If the visibility (e.g., Rural 5) is lower than the settings (e.g., Rural 23) when running MODTRAN, the atmospheric transmittance will be overestimated, and this may lead to an underestimation of LST. Therefore, the calculation of three atmospheric parameters without considering the aerosol optical depth content affects the results, especially in lower water vapor content regions.
Third, the atmospheric upward/downward radiance and transmittance under four boundary layer aerosol models were calculated using TIGR profiles with or without trace gases. Figure 9 shows the differences in three atmospheric parameters with or without considering trace gas under the four boundary layer aerosol models. Though the three atmospheric parameters under the four boundary layer aerosol models have some deviations, the difference between the results considering trace gases and the results without trace gases is so small that it can be neglected. Therefore, the calculation of the three atmospheric parameters without considering the trace gases have no effect on the results.
Although there are some discoveries in this study, some limitations are worth mentioning: (1) As noted by Barsi et al. [15,19], the linear interpolation in time and space may not be the most appropriate method for sampling weather fronts or the diurnal heating cycle. (2) As indicated by Coll et al. [58], when surface elevation is lower than the surface levels of the reanalysis products, the method may misestimate three atmospheric parameters; this occurs because the lowest layer of the atmosphere—which typically has the largest water vapor content and warmest temperature—was neglected in the atmospheric correction calculations. These limitations may be reduced by using higher temporal/spatial resolution reanalysis products or a downscaling method for the reanalysis products.
5. Conclusions
Atmospheric correction is a key step for estimating land surface temperature using a single-channel algorithm. Global reanalysis products are widely used as surrogates for radiosonde data to perform atmospheric correction. In this paper, we evaluated the accuracy of eight global reanalysis products (NCEP/FNL; NCEP/DOE Reanalysis 2; MERRA-3; MERRA-6; MERRA2-3; MERRA2-6; JRA-55; and ERA-Interim) in the atmospheric correction of Landsat 8 TIRS10 data using atmospheric profiles collected from 163 global radiosonde stations. First, three atmospheric parameters for Landsat 8 TIRS10 were simulated by radiative transfer code MODTRAN 5.2.1. Then, the accuracy of the simulated atmospheric parameters from eight global reanalysis products were evaluated using the simulated atmospheric parameters from global radiosonde stations. Finally, the accuracy of eight global reanalysis products for LST retrieval was evaluated using the simulated and real Landsat 8 TIRS10 data.
Overall, the simulated atmospheric parameters from MERRA-6 and ERA-Interim were accurate than those simulated from other global reanalysis products. Under low water vapor contents, the impact of various reanalysis products on real data was less than that of simulated data. The overall LST biases and RMSEs between simulated LSTs and actual LSTs were less than 0.2 K and 1.09 K, respectively, for simulated data. The LST biases between retrieved LSTs and in situ LSTs ranged from 0.07 K to 0.24 K, and LST STD (RMSE) ranged from 1.93 K (1.93 K) to 2.02 K (2.04 K) for real data. The reason is that many influencing factors exist in LST retrieval, not only water vapor content. Under high water vapor contents, ERA-Interim and MERRA-6 get lower LST RMSEs than other reanalysis products. The LST RMSEs difference between MERRA-6 (ERA-Interim) and other reanalysis products ranged from 0.3 K (0.4 K) to 1.1 K (1.2 K). From the above results, MERRA-6 and ERA-Interim are recommended for atmospheric corrections of the thermal infrared channel under different water vapor contents and surface elevations.
Acknowledgments
The authors thank anonymous reviewers for their helpful comments and suggestions that have significantly improved this article. The ground data used in this study is provided by Cold and Arid Regions Science Data Center at Lanzhou (http://westdc.westgis.ac.cn). The global radiosonde observations are obtained from University of Wyoming website (http://weather.uwyo.edu/upperair/sounding.html). The NCEP products are downloaded from https://rda.ucar.edu/. The MERRA and MERRA2 products are downloaded from Goddard Earth Sciences Data and Information Systems (https://disc.sci.gsfc.nasa.gov/). The ERA-Interim product is downloaded from ECMWF (https://www.ecmwf.int/). The JRA-55 product is downloaded from http://jra.kishou.go.jp/JRA-55/. This work was partly supported by the National Natural Science Foundation of China via grant 41771365, the National Key Research and Development Program of China via grant 2016YFA0600101, the Special Fund for Young Talents of the State Key Laboratory of Remote Sensing Sciences via grant 17ZY-02, and Chinese Scholarship Council.
Author Contributions
Jie Cheng conceived and designed the algorithm; Xiangchen Meng performed the algorithm, analyzed the data and wrote the paper. All authors participated in the editing of the paper.
Conflicts of Interest
The authors declare no conflict of interest.
References
- Wan, Z.; Dozier, J. A generalized split-window algorithm for retrieving land-surface temperature form space. IEEE Trans. Geosci. Remote Sens. 1996, 34, 892–905. [Google Scholar]
- Li, Z.; Tang, B.; Wu, H.; Ren, H.; Yan, G.; Wan, Z.; Trigo, I.F.; Sobrino, J.A. Satellite-derived land surface temperature: Current status and prespectives. Remote Sens. Environ. 2013, 131, 14–37. [Google Scholar] [CrossRef]
- Cheng, J.; Liang, S.; Wang, J.; Li, X. A stepwise refining algorithm of temperature and emissivity separation for hyperspectral thermal infrared data. IEEE Trans. Geosci. Remote Sens. 2010, 48, 1588–1597. [Google Scholar] [CrossRef]
- Sobrino, J.A.; Frate, F.D.; Drusch, M.; Jimenez-Munoz, J.C.; Manunta, P.; Regan, A. Review of thermal infrared applications and requirements for future high-resolution sensors. IEEE Trans. Geosci. Remote Sens. 2016, 54, 2963–2972. [Google Scholar] [CrossRef]
- Kalma, J.D.; McVicar, T.R.; McCabe, M.F. Estimating land surface evaporation: A review of methods using remotely sensed surface temperature data. Surv. Geophys. 2008, 29, 421–469. [Google Scholar] [CrossRef]
- Weng, Q.; Fu, P.; Gao, F. Generating daily land surface temperature at landsat resolution by fusing landsat and modis data. Remote Sens. Environ. 2014, 145, 55–67. [Google Scholar] [CrossRef]
- Wan, Z.; Li, Z.L. A physics-based algorithm for retrieving land-surface emissivity and temperature from eos/modis data. IEEE Trans. Geosci. Remote Sens. 1997, 35, 980–996. [Google Scholar]
- Meng, X.; Li, H.; Du, Y.; Liu, Q.; Zhu, J.; Sun, L. Retrieving land surface temperature from landsat 8 TIRS data using RTTOV and ASTER GED. In Proceedings of the IEEE International Geoscience and Remote Sensing Symposium, Beijing, China, 10–15 July 2016; pp. 4302–4305. [Google Scholar]
- Cheng, J.; Ren, H. Land-surface temperature and thermal-infrared emissivity. In Advanced Remote Sensing: Terrestrial Information Extraction and Applications; Liang, S., Li, X., Wang, J., Eds.; Academic Press: Cambridge, MA, USA, 2012; pp. 235–271. [Google Scholar]
- Jimenez-Munoz, J.C.; Sobrino, J.A. A generalized single-channel method for retrieving land surface temperature from remote sensing data. J. Geophys. Res. 2003, 108, 4688. [Google Scholar] [CrossRef]
- Gillespie, A.R.; Rokugawa, S.; Matsunaga, T.; Cothern, J.S.; Hook, S.J.; Kahle, A.B. A temperature and emissivity separation algorithm for advanced spaceborne thermal emission and reflection radiometer (aster) images. IEEE Trans. Geosci. Remote Sens. 1998, 36, 1113–1126. [Google Scholar] [CrossRef]
- Qin, Z.; Karnieli, A. Mono-window algorithm for retrieving land surface temperature from landsat tm data and its application to the Israel-Egype border region. Int. J. Remote Sens. 2001, 22, 3719–3746. [Google Scholar] [CrossRef]
- Coll, C.; Caselles, V.; Valor, E.; Niclòs, R. Comparison between different sources of atmospheric profiles for land surface temperature retrieval from single channel thermal infrared data. Remote Sens. Environ. 2012, 117, 199–210. [Google Scholar] [CrossRef]
- Li, H.; Liu, Q.; Du, Y.; Jiang, J.; Wang, H. Evaluation of the NCEP and MODIS atmospheric products for single channel land surface temperature retrieval with ground measurements: A case study of hj-1b IRS data. IEEE J. Sel. Top. Appl. Earth Obs. Remote Sens. 2013, 6, 1399–1408. [Google Scholar] [CrossRef]
- Barsi, J.A.; Barker, J.L.; Schott, J.R. An atmospheric correction parameter calculator for a single thermal band earth-sensing instrument. In Proceedings of the IEEE International Geoscience and Remote Sensing Symposium, Toulouse, France, 21–25 July 2003; pp. 3014–3016. [Google Scholar]
- Cook, M.; Schott, J.; Mandel, J.; Raqueno, N. Development of an operational calibration methodology for the landsat thermal data archive and initial testing of the atmospheric compensation component of a land surface temperature (lst) product from the archive. Remote Sens. 2014, 6, 11244–11266. [Google Scholar] [CrossRef]
- Tardy, B.; Rivalland, V.; Huc, M.; Hagolle, O.; Marcq, S.; Boulet, G. A software tool for atmospheric correction and surface temperature estimation of landsat infrared thermal data. Remote Sens. 2016, 8, 696. [Google Scholar] [CrossRef] [Green Version]
- Pérez-Planells, L.; García-Santos, V.; Caselles, V. Comparing different profiles to characterize the atmosphere for three modis tir bands. Atmos. Res. 2015, 161–162, 108–115. [Google Scholar] [CrossRef]
- Barsi, J.A.; Schott, J.R.; Palluconi, F.D.; Hook, S.J. In Validation of a web-based atmospheric correction tool for single thermal band instruments. Earth Obs. Syst. 2005, 5882, 136–142. [Google Scholar]
- Rosas, J.; Houborg, R.; McCabe, M. Sensitivity of landsat 8 surface temperature estimates to atmospheric profile data: A study using modtran in dryland irrigated systems. Remote Sens. 2017, 9, 988. [Google Scholar] [CrossRef]
- Skokovic, D.; Sobrino, J.A.; Jimenez-Munoz, J.C. Vicarious calibration of the landsat 7 thermal infrared band and lst algorithm validation of the etm+ instrument using three global atmospheric profiles. IEEE Trans. Geosci. Remote Sens. 2017, 55, 1804–1811. [Google Scholar] [CrossRef]
- Ma, L.; Zhang, T.; Li, Q.; Frauenfeld, O.W.; Qin, D. Evaluation of ERA-40, NCEP-1, and NCEP-2 reanalysis air temperatures with ground-based measurements in China. J. Geophys. Res. 2008, 113, D15115. [Google Scholar] [CrossRef]
- Wang, A.; Zeng, X. Evaluation of multireanalysis products with in situ observations over the Tibetan Plateau. J. Geophys. Res. Atmos. 2012, 117, D05102. [Google Scholar] [CrossRef]
- Decker, M.; Brunke, M.A.; Wang, Z.; Sakaguchi, K.; Zeng, X.; Bosilovich, M.G. Evaluation of the reanalysis products from GSFC, NCEP, and ECMWF using flux tower observations. J. Clim. 2012, 25, 1916–1944. [Google Scholar] [CrossRef]
- Zhang, X.; Liang, S.; Wang, G.; Yao, Y.; Jiang, B.; Cheng, J. Evaluation of the reanalysis surface incident shortwave radiation products from NCEP, ECMWF, GSFC, and JMA using satellite and surface observations. Remote Sens. 2016, 8, 225. [Google Scholar] [CrossRef]
- Rienecker, M.M.; Suarez, M.J.; Gelaro, R.; Todling, R.; Bacmeister, J.; Liu, E.; Bosilovich, M.G.; Schubert, S.D.; Takacs, L.; Kim, G.K. MERRA: NASA’S modern-era retrospective analysis for research and applications. J. Clim. 2011, 24, 3624–3648. [Google Scholar] [CrossRef]
- Global Modeling and Assimilation Office (GMAO). MAI3CPASM: Inst3_3D_Asm_Cp: MERRA 3D IAU State, Meteorology Instantaneous 3-Hourly V5.2.0, Greenbelt, MD, USA, Goddard Earth Sciences Data and Information Services Center (GES DISC). 2008. Available online: https://doi.org/10.5067/8D4LU4390C4S (accessed on 31 December 2016).
- Global Modeling and Assimilation Office (GMAO). MAI6NPANA: inst6_3d_ana_Np: MERRA 3D Analyzed State, Meteorology Instantaneous 6-Hourly V5.2.0, Greenbelt, MD, USA, Goddard Earth Sciences Data and Information Services Center (GES DISC). 2008. Available online: https://doi.org/10.5067/ADAWH64DCRU0 (accessed on 31 December 2016).
- Global Modeling and Assimilation Office (GMAO). MERRA-2 inst3_3d_asm_Np: 3d,3-Hourly, Instantaneous, Pressure-Level, Assimilation, Assimilated Meteorological Fields V5.12.4, Greenbelt, MD, USA, Goddard Earth Sciences Data and Information Services Center (GES DISC). 2015. Available online: https://doi.org/10.5067/QBZ6MG944HW0 (accessed on 31 December 2016).
- Global Modeling and Assimilation Office (GMAO). MERRA-2 inst6_3d_ana_Np: 3d,6-Hourly, Instantaneous, Pressure-Level, Analysis, Analyzed Meteorological Fields V5.12.4, Greenbelt, MD, USA, Goddard Earth Sciences Data and Information Services Center (GES DISC). 2015. Available online: https://doi.org/10.5067/A7S6XP56VZWS (accessed on 31 December 2016).
- Dee, D.P.; Uppala, S.M.; Simmons, A.J.; Berrisford, P.; Poli, P.; Kobayashi, S.; Andrae, U.; Balmaseda, M.A.; Balsamo, G.; Bauer, P. The era-interim reanalysis: Configuration and performance of the data assimilation system. Q. J. R. Meteorol. Soc. 2011, 137, 553–597. [Google Scholar] [CrossRef]
- European Centre for Medium-Range Weather Forecasts. ERA-Interim Project. Research Data Archive at the National Center for Atmospheric Research, Computational and Information Systems Laboratory. Dataset. 2009. Available online: https://doi.org/10.5065/D6CR5RD9 (accessed on 31 December 2016).
- National Centers for Environmental Prediction; National Weather Service; NOAA; US Department of commerce. NCEP FNL Operational Model Global Tropospheric Analyses, Continuing from July 1999. Research Data Archive at the National Center for Atmospheric Research, Computational and Information Systems Laboratory. Dataset; 2000. Available online: https://doi.org/10.5065/D6M043C6 (accessed on 31 December 2016).
- National Centers for Environmental Prediction; National Weather Service; NOAA/US Department of Commerce. NCEP/DOE Reanalysis 2 (R2). Research Data Archive at the National Center for Atmospheric Research, Computational and Information Systems Laboratory. Dataset; 2000. Available online: http://rda.ucar.edu/datasets/ds091.0/ (accessed on 31 December 2016).
- Kanamitsu, M.; Ebisuzaki, W.; Woollen, J.; Yang, S.K.; Hnilo, J.J.; Fiorino, M.; Potter, G.L. NCEP-DOE AMIP-II reanalysis (r-2). Bull. Am. Meteorol. Soc. 2002, 83, 1631–1643. [Google Scholar] [CrossRef]
- Japan Meteorological Agency/Japan. Jra-55: Japanese 55-Year Reanalysis, Daily 3-Hourly and 6-Hourly Data. Research Data Archive at the National Center for Atmospheric Research, Computational and Information Systems Laboratory. Dataset; 2013. Available online: https://doi.org/10.5065/D6HH6H41 (accessed on 31 December 2016).
- Kobayashi, S.; Ota, Y.; Harada, Y.; Ebita, A.; Moriya, M.; Onoda, H.; Onogi, K.; Kamahori, H.; Kobayashi, C.; Endo, H. The jra-55 reanalysis: General specifications and basic characteristics. J. Meteorol. Soc. Jpn. Ser. II 2015, 93, 5–48. [Google Scholar] [CrossRef]
- Kondratiev, K.Y.A. Radiation in the Atmosphere. In International Geophysics Series; Academic Press: New York, NY, USA, 1969; p. 911. [Google Scholar]
- Ellicott, E.; Vermote, E.; Petitcolin, F.; Hook, S.J. Validation of a new parametric model for atmospheric correction of thermal infrared data. IEEE Trans. Geosci. Remote Sens. 2009, 47, 295–311. [Google Scholar] [CrossRef]
- Garcia-Santos, V.; Valor, E.; Caselles, V.; Mira, M.; Galve, J.M.; Coll, C. Evaluation of different methods to retrieve the hemispherical downwelling irradiance in the thermal infrared region for field measurements. IEEE Trans. Geosci. Remote Sens. 2013, 51, 2155–2165. [Google Scholar] [CrossRef]
- Zhai, P.; Eskridge, R.E. Atmospheric water vapor over china. J. Clim. 1997, 10, 2643–2652. [Google Scholar] [CrossRef]
- Gao, L.; Bernhardt, M.; Schulz, K. Elevation correction of era-interim temperature data in complex terrain. Hydrol. Earth Syst. Sci. 2012, 16, 4661–4673. [Google Scholar] [CrossRef] [Green Version]
- Li, X.; Cheng, G.; Liu, S.; Xiao, Q.; Ma, M.; Jin, R.; Che, T.; Liu, Q.; Wang, W.; Qi, Y.; et al. Heihe watershed allied telemetry experimental research (hiwater): Scientific objectives and experimental design. Bull. Am. Meteorol. Soc. 2013, 94, 1145–1160. [Google Scholar] [CrossRef]
- Meng, X.; Cheng, J.; Liang, S. Estimating land surface temperature from feng yun-3c/mersi data using a new land surface emissivity scheme. Remote Sens. 2017, 9, 1247. [Google Scholar] [CrossRef]
- Wang, H.; Li, H.; Cao, B.; Du, Y.; Xiao, Q.; Liu, Q. Hiwater: Dataset of Thermal Infrared Spectrum Observed by Bomem mr304 in the Middle Reaches of the Heihe River Basin. Available online: http://card.westgis.ac.cn/data/488378f9-543b-496b-8fb7-e209b1dc34f3 (accessed on 17 June 2017).
- Liang, S.; Zhao, X.; Liu, S.; Yuan, W.; Cheng, X.; Xiao, Z.; Zhang, X.; Liu, Q.; Cheng, J.; Tang, H.; et al. A long-term global land surface satellite (glass) data-set for environmental studies. Int. J. Digit. Earth 2013, 6, 5–33. [Google Scholar] [CrossRef]
- Cheng, J.; Liang, S. Estimating global land surface broadband thermal-infrared emissivity using advanced very high resolution radiometer optical data. Int. J. Digit. Earth 2013, 6, 34–49. [Google Scholar] [CrossRef]
- Cheng, J.; Liang, S. Estimating the broadband longwave emissivity of global bare soil from the MODIS shortwave albedo product. J. Geophys. Res. Atmos. 2014, 119, 614–634. [Google Scholar] [CrossRef]
- Li, H.; Sun, D.; Yu, Y.; Wang, H.; Liu, Y.; Liu, Q.; Du, Y.; Wang, H.; Cao, B. Evaluation of the VIIRS and MODIS lst products in an arid area of northwest china. Remote Sens. Environ. 2014, 142, 111–121. [Google Scholar] [CrossRef]
- Mattar, C.; Sobrino, J.A.; Julien, Y.; Morales, L. Trends in column integrated water vapour over europe from 1973 to 2003. Int. J. Climatol. 2011, 31, 1749–1757. [Google Scholar] [CrossRef]
- Mattar, C.; Durán-Alarcón, C.; Jiménez-Muñoz, J.C.; Santamaría-Artigas, A.; Olivera-Guerra, L.; Sobrino, J.A. Global atmospheric profiles from reanalysis information (GAPRI): A new database for earth surface temperature retrieval. Int. J. Remote Sens. 2015, 36, 5045–5060. [Google Scholar] [CrossRef]
- Simmons, A.J.; Willett, K.M.; Jones, P.D.; Thorne, P.W.; Dee, D.P. Low-frequency variations in surface atmospheric humidity, temperature, and precipitation: Inferences from reanalyses and monthly gridded observational data sets. J. Geophys. Res. 2010, 115. [Google Scholar] [CrossRef]
- Gomis-Cebolla, J.; Jimenez, J.C.; Sobrino, J.A. Lst retrieval algorithm adapted to the amazon evergreen forests using MODIS data. Remote Sens. Environ. 2018, 204, 401–411. [Google Scholar] [CrossRef]
- Windahl, E.; Beurs, K.D. An intercomparison of landsat land surface temperature retrieval methods under variable atmospheric conditions using in situ skin temperature. Int. J. Appl. Earth Obs. Geoinf. 2016, 51, 11–27. [Google Scholar] [CrossRef]
- Bento, V.; DaCamara, C.; Trigo, I.; Martins, J.; Duguay-Tetzlaff, A. Improving land surface temperature retrievals over mountainous regions. Remote Sens. 2017, 9, 38. [Google Scholar] [CrossRef]
- Galve, J.M.; Coll, C.; Caselles, V.; Valor, E. An atmospheric radiosounding database for generating land surface temperature algorithms. IEEE Trans. Geosci. Remote Sens. 2008, 46, 1547–1557. [Google Scholar] [CrossRef]
- Chedin, A.; Scott, N.A.; Wahiche, C.; Moulinier, P. The improved initialization inversion method: A high resolution physical method for temperature retrievals from satellites of the tiros-n series. J. Appl. Meteorol. 1985, 24, 128–143. [Google Scholar] [CrossRef]
- Coll, C.; Galve, J.M.; Sanchez, J.M.; Caselles, V. Validation of landsat-7/etm+ thermal-band calibration and atmospheric correction with ground-based measurements. IEEE Trans. Geosci. Remote Sens. 2010, 48, 547–555. [Google Scholar] [CrossRef]
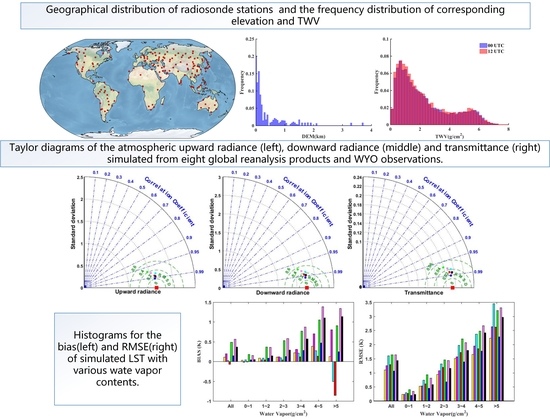
Figure 1.
(a) Geographical distribution of radiosonde stations used in this study and the frequency distribution of (b) corresponding elevation and (c) total precipitable water vapor content (TWV).
Figure 1.
(a) Geographical distribution of radiosonde stations used in this study and the frequency distribution of (b) corresponding elevation and (c) total precipitable water vapor content (TWV).

Figure 2.
Histograms of biases between (a) the atmospheric upward radiance; (b) downward radiance and (c) transmittance simulated from University of Wyoming (WYO) observations, as well as eight global reanalysis products.
Figure 2.
Histograms of biases between (a) the atmospheric upward radiance; (b) downward radiance and (c) transmittance simulated from University of Wyoming (WYO) observations, as well as eight global reanalysis products.

Figure 3.
Taylor diagrams of (a) the atmospheric upward radiance; (b) downward radiance; and (c) transmittance simulated from eight global reanalysis products and WYO observations. The black dotted lines represent the standard deviation (STD), the green dashed lines represent the root mean squared deviation (RMSD), and the blue dash-dot lines represent the R. The units of the atmospheric upward (downward) radiance and transmittance are and unitless, respectively.

Figure 4.
Histograms of (a–c) the biases and (d–f) RMSDs for (a,d) the atmospheric upward radiance, (b,e) downward radiance, and (c,f) transmittance with various water vapor contents. The units of the atmospheric upward (downward) radiance and transmittance are and unitless, respectively.
Figure 4.
Histograms of (a–c) the biases and (d–f) RMSDs for (a,d) the atmospheric upward radiance, (b,e) downward radiance, and (c,f) transmittance with various water vapor contents. The units of the atmospheric upward (downward) radiance and transmittance are and unitless, respectively.

Figure 5.
Histograms for (a) the bias and (b) root mean squared error (RMSE) of land surface temperature (LST) with various water vapor contents. From left to right are the histograms of the bias and RMSE, respectively.
Figure 5.
Histograms for (a) the bias and (b) root mean squared error (RMSE) of land surface temperature (LST) with various water vapor contents. From left to right are the histograms of the bias and RMSE, respectively.

Figure 6.
(a) The total precipitable water vapor content (TWV) biases between reanalysis profiles and radiosonde and (b) the height difference between the interpolated model height and the radiosonde station elevation.
Figure 6.
(a) The total precipitable water vapor content (TWV) biases between reanalysis profiles and radiosonde and (b) the height difference between the interpolated model height and the radiosonde station elevation.
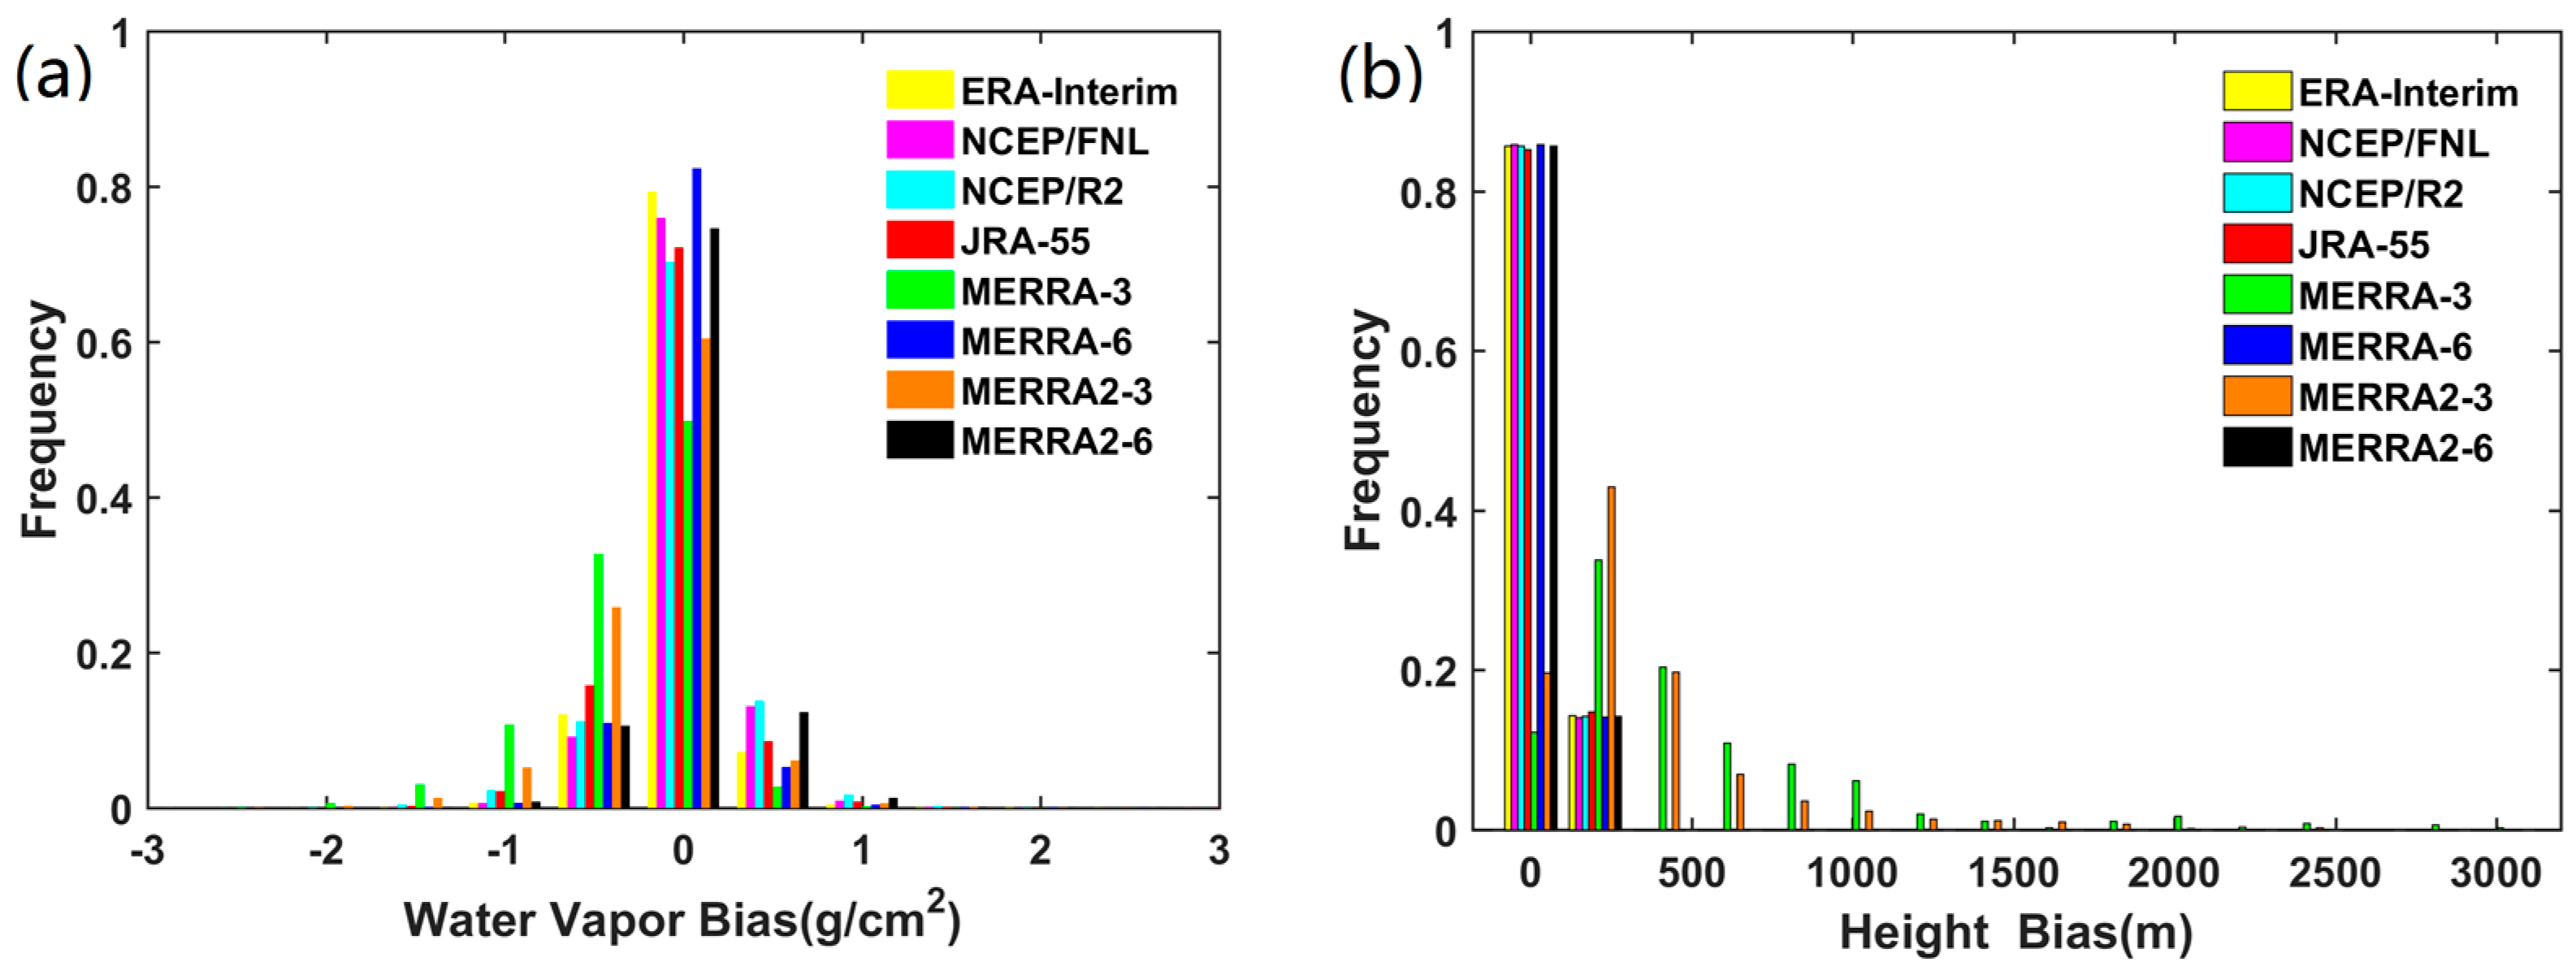
Figure 7.
The atmospheric (a) upward radiance; (b) downward radiance; and (c) transmittance of thirty-two Landsat 8 images calculated from the Atmospheric Correction Parameter Calculator (ACPC) and our method. The units of the atmospheric upward (downward) radiance and transmittance are and unitless, respectively.

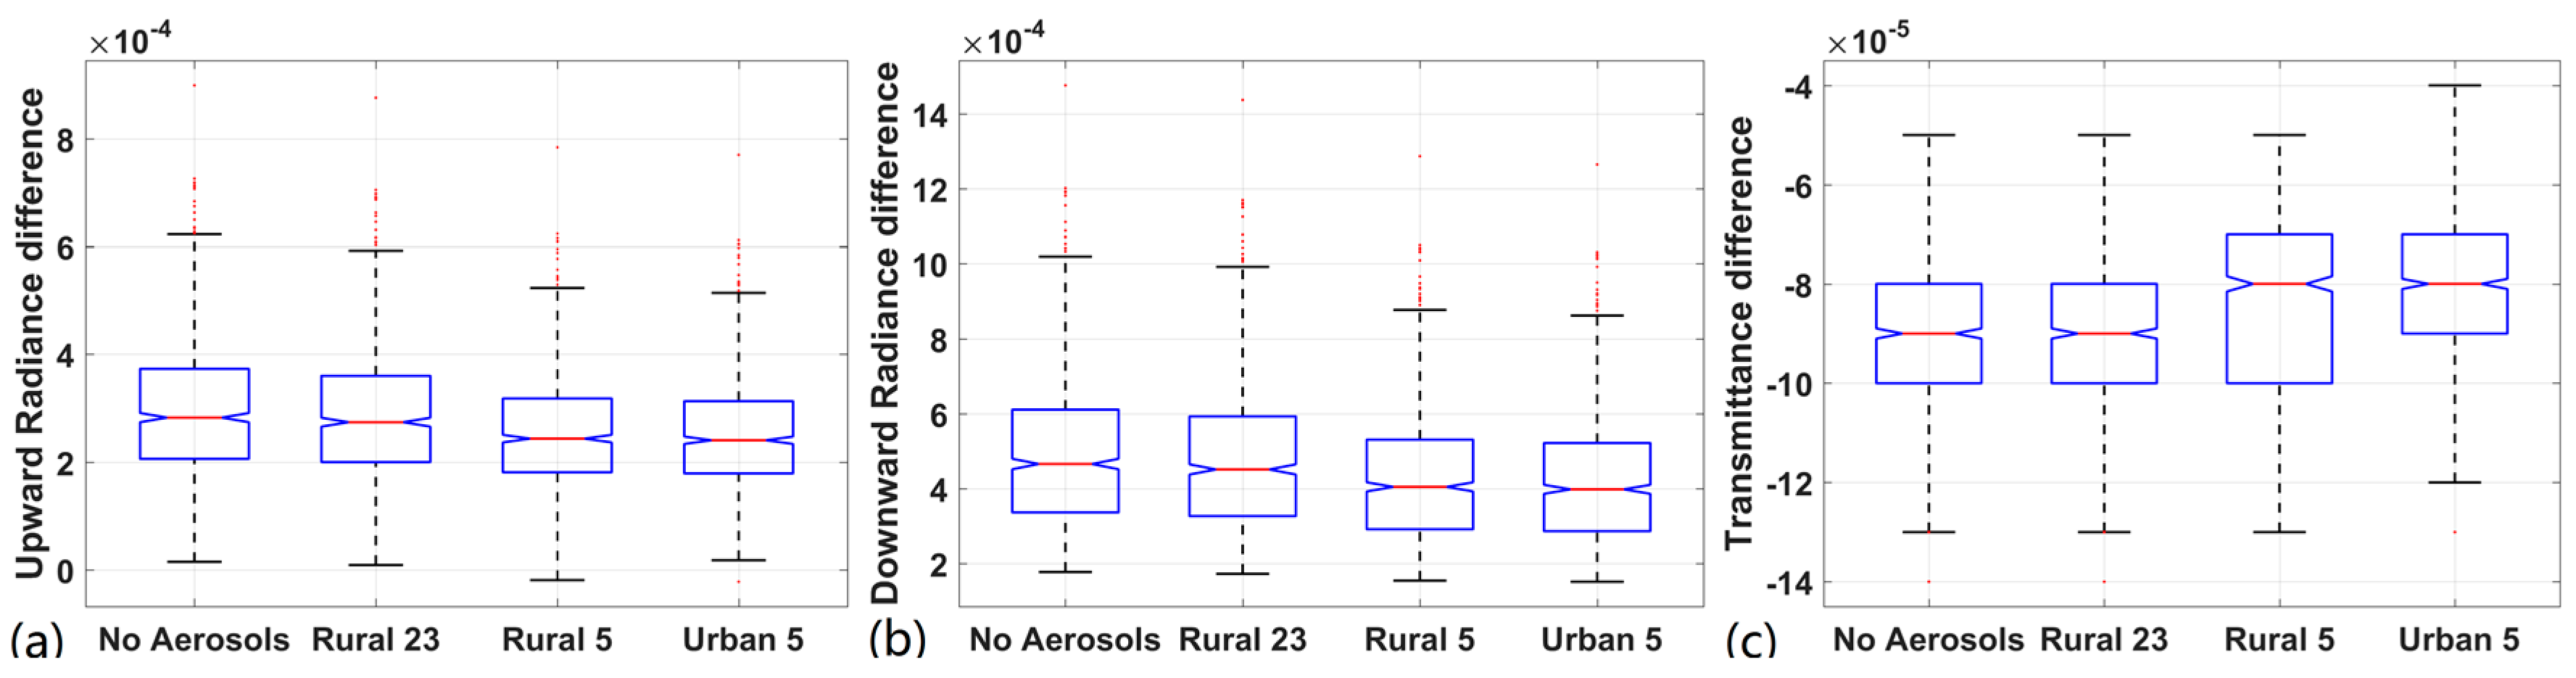
Figure 8.
The trend of atmospheric (a) upward radiance; (b) downward radiance; and (c) transmittance difference under four boundary-layer aerosol models vary with water vapor content. The units of the atmospheric upward (downward) radiance and transmittance are and unitless, respectively.
Figure 8.
The trend of atmospheric (a) upward radiance; (b) downward radiance; and (c) transmittance difference under four boundary-layer aerosol models vary with water vapor content. The units of the atmospheric upward (downward) radiance and transmittance are and unitless, respectively.

Figure 9.
(a) The upward radiance; (b) downward radiance; and (c) transmittance difference by considering trace gases or not under four boundary-layer aerosol models. The units of the atmospheric upward (downward) radiance and transmittance are and unitless, respectively.
Figure 9.
(a) The upward radiance; (b) downward radiance; and (c) transmittance difference by considering trace gases or not under four boundary-layer aerosol models. The units of the atmospheric upward (downward) radiance and transmittance are and unitless, respectively.


Table 1.
Summary of the main characteristics of global reanalysis data.
| Data Source | Data Periods | Temporal Resolution | Spatial Resolution | Vertical Resolution | Download Link | Data Availability |
|---|---|---|---|---|---|---|
| MERRA-3 | 1979 to 2016 | 3 hourly | 1.25° × 1.25° | 42 pressure levels | https://disc.sci.gsfc.nasa.gov/ | All data is available for free |
| MERRA-6 | 6 hourly | 1/2° × 2/3° | ||||
| MERRA2-3 | 1980 to Present | 3 hourly | 0.5° × 0.625° | 42 pressure levels | ||
| MERRA2-6 | 6 hourly | |||||
| ERA-Interim | 1979 to Present | 6 hourly | 0.75° × 0.75° | 37 pressure levels | http://apps.ecmwf.int/datasets/ | |
| NCEP/DOE Reanalysis 2 | 1979 to Present | 6 hourly | 2.5° × 2.5° | 17 pressure levels | https://rda.ucar.edu/datasets/ds091.0/ | |
| NCEP/FNL | 1999 to Present | 6 hourly | 1.0° × 1.0° | 21 pressure levels | https://rda.ucar.edu/datasets/ds083.2/ | |
| JRA-55 | 1958 to Present | 6 hourly | 1.25° × 1.25° | 27 pressure levels | http://jra.kishou.go.jp/JRA-55/index_en.html |
Table 2.
Relative errors and R (in %) of three atmospheric parameters for different surface elevations.
Table 2.
Relative errors and R (in %) of three atmospheric parameters for different surface elevations.
| Surface Elevation | 0~0.5 km | 0.5~1 km | 1~2 km | >2 km | |||||||||
|---|---|---|---|---|---|---|---|---|---|---|---|---|---|
| bias | RMSD | R | bias | RMSD | R | bias | RMSD | R | bias | RMSD | R | ||
| Upward Radiance | ERA-Interim | −0.92 | 11.06 | 99.0 | 2.59 | 15.52 | 98.6 | 3.54 | 21.23 | 96.8 | 5.87 | 32.29 | 93.1 |
| NCEP/FNL | −0.46 | 12.45 | 98.8 | 1.72 | 18.10 | 98.1 | 2.36 | 22.41 | 96.6 | 1.47 | 32.29 | 91.0 | |
| NCEP/R2 | 0.46 | 15.67 | 98.0 | 1.72 | 24.14 | 96.7 | 5.90 | 33.03 | 92.4 | 17.61 | 42.57 | 90.1 | |
| JRA-55 | −1.84 | 12.91 | 98.7 | 2.59 | 21.55 | 97.3 | 8.26 | 33.03 | 93.0 | −2.94 | 35.23 | 89.5 | |
| MERRA-3 | −15.67 | 19.82 | 97.1 | −20.69 | 31.03 | 94.5 | −30.67 | 38.92 | 89.4 | −35.23 | 55.78 | 69.1 | |
| MERRA-6 | −1.84 | 10.14 | 99.2 | 0.86 | 15.52 | 98.7 | 3.54 | 20.05 | 97.2 | 4.40 | 33.76 | 90.6 | |
| MERRA2-3 | −8.76 | 17.06 | 97.7 | −14.66 | 28.45 | 95.2 | −18.87 | 31.85 | 92.4 | −27.89 | 55.78 | 71.4 | |
| MERRA2-6 | −0.46 | 12.91 | 98.7 | 3.45 | 18.10 | 98.2 | 4.72 | 22.41 | 96.6 | 8.81 | 32.29 | 92.3 | |
| Downward Radiance | ERA-Interim | −0.79 | 9.78 | 99.1 | 2.43 | 14.81 | 98.6 | 3.55 | 20.15 | 96.9 | 4.93 | 28.39 | 94.2 |
| NCEP/FNL | −0.22 | 10.82 | 99.0 | 1.75 | 17.01 | 98.1 | 2.49 | 20.76 | 96.7 | 1.77 | 29.32 | 92.3 | |
| NCEP/R2 | 0.60 | 13.91 | 98.3 | 2.03 | 22.27 | 96.8 | 5.13 | 31.17 | 92.7 | 16.20 | 38.82 | 91.0 | |
| JRA-55 | −1.96 | 11.32 | 98.9 | 2.71 | 20.18 | 97.3 | 8.08 | 30.87 | 93.3 | −2.42 | 31.74 | 90.7 | |
| MERRA-3 | −14.32 | 17.95 | 97.3 | −20.46 | 28.49 | 94.7 | −30.04 | 37.36 | 89.3 | −34.82 | 52.69 | 71.0 | |
| MERRA-6 | −1.73 | 8.83 | 99.3 | 1.13 | 14.30 | 98.7 | 4.15 | 19.17 | 97.3 | 4.93 | 30.35 | 91.8 | |
| MERRA2-3 | −7.73 | 15.20 | 98.0 | −14.02 | 26.23 | 95.4 | −18.72 | 30.87 | 92.5 | −28.21 | 53.25 | 73.0 | |
| MERRA2-6 | −0.28 | 11.36 | 98.9 | 3.17 | 16.96 | 98.2 | 4.83 | 21.59 | 96.7 | 8.47 | 29.51 | 93.3 | |
| Transmittance | ERA-Interim | 0.14 | 4.19 | 98.9 | −0.48 | 2.87 | 98.5 | −0.57 | 2.61 | 96.8 | −0.56 | 3.13 | 93.8 |
| NCEP/FNL | −0.14 | 4.75 | 98.6 | −0.36 | 3.35 | 97.8 | −0.34 | 2.73 | 96.7 | 0.00 | 3.24 | 91.7 | |
| NCEP/R2 | −0.28 | 5.86 | 97.8 | −0.48 | 4.18 | 96.5 | −0.91 | 4.09 | 92.5 | −1.90 | 4.24 | 90.8 | |
| JRA-55 | 0.70 | 4.88 | 98.5 | −0.48 | 3.71 | 97.2 | −1.14 | 4.09 | 93.1 | 0.33 | 3.46 | 90.7 | |
| MERRA-3 | 5.30 | 6.98 | 97.0 | 3.59 | 5.14 | 94.6 | 3.52 | 4.66 | 90.4 | 3.80 | 5.69 | 70.0 | |
| MERRA-6 | 0.56 | 3.91 | 99.1 | −0.24 | 2.75 | 98.6 | −0.68 | 2.50 | 97.3 | −0.56 | 3.35 | 91.4 | |
| MERRA2-3 | 2.51 | 6.28 | 97.5 | 2.27 | 4.90 | 95.1 | 1.93 | 3.86 | 92.8 | 3.01 | 5.69 | 71.8 | |
| MERRA2-6 | −0.14 | 5.02 | 98.5 | −0.72 | 3.35 | 97.9 | −0.80 | 2.84 | 96.7 | −1.00 | 3.24 | 92.7 | |
Table 3.
Validation result of retrieved LST from Landsat 8 data using the atmospheric parameters calculated from different reanalysis products.
Table 3.
Validation result of retrieved LST from Landsat 8 data using the atmospheric parameters calculated from different reanalysis products.
| MERRA-3 | MERRA-6 | MERRA2-3 | MERRA2-6 | ERA-Interim | NCEP/FNL | NCEP/R2 | JRA-55 | |
|---|---|---|---|---|---|---|---|---|
| bias (K) | 0.16 | 0.20 | 0.21 | 0.24 | 0.07 | 0.24 | 0.23 | 0.32 |
| STD (K) | 1.96 | 1.97 | 1.96 | 1.96 | 1.93 | 1.98 | 1.97 | 2.02 |
| RMSE (K) | 1.96 | 1.97 | 1.96 | 1.97 | 1.93 | 1.99 | 1.98 | 2.04 |
© 2018 by the authors. Licensee MDPI, Basel, Switzerland. This article is an open access article distributed under the terms and conditions of the Creative Commons Attribution (CC BY) license (http://creativecommons.org/licenses/by/4.0/).
Share and Cite
MDPI and ACS Style
Meng, X.; Cheng, J. Evaluating Eight Global Reanalysis Products for Atmospheric Correction of Thermal Infrared Sensor—Application to Landsat 8 TIRS10 Data. Remote Sens. 2018, 10, 474. https://doi.org/10.3390/rs10030474
AMA Style
Meng X, Cheng J. Evaluating Eight Global Reanalysis Products for Atmospheric Correction of Thermal Infrared Sensor—Application to Landsat 8 TIRS10 Data. Remote Sensing. 2018; 10(3):474. https://doi.org/10.3390/rs10030474
Chicago/Turabian StyleMeng, Xiangchen, and Jie Cheng. 2018. "Evaluating Eight Global Reanalysis Products for Atmospheric Correction of Thermal Infrared Sensor—Application to Landsat 8 TIRS10 Data" Remote Sensing 10, no. 3: 474. https://doi.org/10.3390/rs10030474
Note that from the first issue of 2016, this journal uses article numbers instead of page numbers. See further details here.