Next Issue
Volume 10, May
Previous Issue
Volume 10, March
 
 
remotesensing-logo

Journal Browser

Journal Browser

Remote Sens., Volume 10, Issue 4 (April 2018) – 170 articles

Cover Story (view full-size image): 
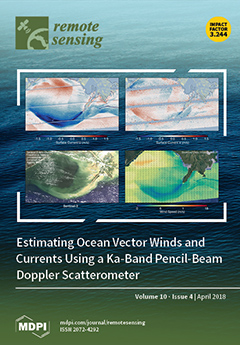
Ocean surface currents and winds are closely coupled essential climate variables and should be observed simultaneously to understand air–sea interactions. Under NASA’s Instrument Incubator Program (IIP), we have built a wide-swath Doppler scatterometer, DopplerScatt, intended to serve as an airborne prototype for a future wind and current spaceborne missions. The cover shows data collected at the outflow of the Mississippi River into Barataria Bay, where the river releases significant sediment, as shown in the lower-left Sentinel-3 image. The lower right image shows the DopplerScatt estimated neutral winds, which are noticeably modified by the currents. The upper panels show the east (left) and north (right) surface current components. In addition to the plume recirculation into Barataria Bay, one can observe a strong submesoscale front coinciding with a front in sediment concentration. View this paper.
  • Issues are regarded as officially published after their release is announced to the table of contents alert mailing list.
  • You may sign up for e-mail alerts to receive table of contents of newly released issues.
  • PDF is the official format for papers published in both, html and pdf forms. To view the papers in pdf format, click on the "PDF Full-text" link, and use the free Adobe Reader to open them.
Order results
Result details
Section
Select all
Export citation of selected articles as:
18 pages, 87543 KiB  
Article
A Novel Affine and Contrast Invariant Descriptor for Infrared and Visible Image Registration
by Xiangzeng Liu, Yunfeng Ai, Juli Zhang and Zhuping Wang
Remote Sens. 2018, 10(4), 658; https://doi.org/10.3390/rs10040658 - 23 Apr 2018
Cited by 33 | Viewed by 5820
Abstract
Infrared and visible image registration is a very challenging task due to the large geometric changes and the significant contrast differences caused by the inconsistent capture conditions. To address this problem, this paper proposes a novel affine and contrast invariant descriptor called maximally [...] Read more.
Infrared and visible image registration is a very challenging task due to the large geometric changes and the significant contrast differences caused by the inconsistent capture conditions. To address this problem, this paper proposes a novel affine and contrast invariant descriptor called maximally stable phase congruency (MSPC), which integrates the affine invariant region extraction with the structural features of images organically. First, to achieve the contrast invariance and ensure the significance of features, we detect feature points using moment ranking analysis and extract structural features via merging phase congruency images in multiple orientations. Then, coarse neighborhoods centered on the feature points are obtained based on Log-Gabor filter responses over scales and orientations. Subsequently, the affine invariant regions of feature points are determined by using maximally stable extremal regions. Finally, structural descriptors are constructed from those regions and the registration can be implemented according to the correspondence of the descriptors. The proposed method has been tested on various infrared and visible pairs acquired by different platforms. Experimental results demonstrate that our method outperforms several state-of-the-art methods in terms of robustness and precision with different image data and also show its effectiveness in the application of trajectory tracking. Full article
(This article belongs to the Special Issue Learning to Understand Remote Sensing Images)
Show Figures

Graphical abstract

15 pages, 5082 KiB  
Article
Using Satellite Altimetry to Calibrate the Simulation of Typhoon Seth Storm Surge off Southeast China
by Xiaohui Li, Guoqi Han, Jingsong Yang, Dake Chen, Gang Zheng and Nan Chen
Remote Sens. 2018, 10(4), 657; https://doi.org/10.3390/rs10040657 - 23 Apr 2018
Cited by 18 | Viewed by 5910
Abstract
Satellite altimeters can capture storm surges generated by typhoons and tropical storms, if the satellite flies over at the right time. In this study, we show TOPEX/Poseidon altimeter-observed storm surge features off Southeast China on 10 October 1994 during Typhoon Seth. We then [...] Read more.
Satellite altimeters can capture storm surges generated by typhoons and tropical storms, if the satellite flies over at the right time. In this study, we show TOPEX/Poseidon altimeter-observed storm surge features off Southeast China on 10 October 1994 during Typhoon Seth. We then use a three-dimensional, barotropic, finite-volume community ocean model (FVCOM) to simulate storm surges. An innovative aspect is that satellite data are used to calibrate the storm surge model to improve model performance, by adjusting model wind forcing fields (the National Center for Environment Prediction (NCEP) reanalysis product) in reference to the typhoon best-track data. The calibration reduces the along-track root-mean-square (RMS) difference between model and altimetric data from 0.15 to 0.10 m. It also reduces the RMS temporal difference from 0.21 to 0.18 m between the model results and independent tide-gauge data at Xiamen. In particular, the calibrated model produces a peak storm surge of 1.01 m at 6:00 10 October 1994 at Xiamen, agreeing with tide-gauge data; while the peak storm surge with the NCEP forcing is 0.71 m only. We further show that the interaction between storm surges and astronomical tides contributes to the peak storm surge by 34% and that the storm surge propagates southwestward as a coastally-trapped Kelvin wave. Full article
(This article belongs to the Special Issue Satellite Altimetry for Earth Sciences)
Show Figures

Figure 1

21 pages, 6399 KiB  
Article
Measurements on the Absolute 2-D and 3-D Localization Accuracy of TerraSAR-X
by Ulrich Balss, Christoph Gisinger and Michael Eineder
Remote Sens. 2018, 10(4), 656; https://doi.org/10.3390/rs10040656 - 23 Apr 2018
Cited by 32 | Viewed by 5200
Abstract
The German TerraSAR-X radar satellites TSX-1 and TDX-1 are well-regarded for their unprecedented geolocation accuracy. However, to access their full potential, Synthetic Aperture Radar (SAR)-based location measurements have to be carefully corrected for effects that are well-known in the area of geodesy but [...] Read more.
The German TerraSAR-X radar satellites TSX-1 and TDX-1 are well-regarded for their unprecedented geolocation accuracy. However, to access their full potential, Synthetic Aperture Radar (SAR)-based location measurements have to be carefully corrected for effects that are well-known in the area of geodesy but were previously often neglected in the area of SAR, such as wave propagation and Earth dynamics. Our measurements indicate that in this way, when SAR is handled as a geodetic measurement instrument, absolute localization accuracy at better than centimeter level with respect to a given geodetic reference frame is obtained in 2-D and, when using stereo SAR techniques, also in 3-D. The TerraSAR-X measurement results presented in this study are based on a network of three globally distributed geodetic observatories. Each is equipped with one or two trihedral corner reflectors with accurately (<5 mm) known reference coordinates, used as a reference for the verification of the SAR measured coordinates. Because these observatories are located in distant parts of the world, they give us evidence on the worldwide reproducibility of the obtained results. In this paper we report the achieved results of measurements performed over 6 1/2 years (from July 2011 to January 2018) and refer to some first new application areas for geodetic SAR. Full article
(This article belongs to the Special Issue Ten Years of TerraSAR-X—Scientific Results)
Show Figures

Figure 1

18 pages, 4321 KiB  
Article
Target Reconstruction Based on Attributed Scattering Centers with Application to Robust SAR ATR
by Jihong Fan and Andrew Tomas
Remote Sens. 2018, 10(4), 655; https://doi.org/10.3390/rs10040655 - 23 Apr 2018
Cited by 13 | Viewed by 4235
Abstract
This paper proposes a synthetic aperture radar (SAR) automatic target recognition (ATR) method by target reconstruction based on attributed scattering centers (ASCs). The extracted ASCs can effectively describe the electromagnetic scattering characteristics of the target, while eliminating the background clutters and noises. Therefore, [...] Read more.
This paper proposes a synthetic aperture radar (SAR) automatic target recognition (ATR) method by target reconstruction based on attributed scattering centers (ASCs). The extracted ASCs can effectively describe the electromagnetic scattering characteristics of the target, while eliminating the background clutters and noises. Therefore, the ASCs are discriminative features for SAR ATR. The neighbor matching algorithm was used to build the correspondence between the test ASC set and corresponding template ASC set. Afterwards, the selected template ASCs were used to reconstruct the template image, whereas all the test ASCs were used to reconstruct the test image based on the ASC model. A similarity measure was further designed based on the reconstructed images for target recognition. Compared with traditional ASC matching methods, the complex one-to-one correspondence between two ASC sets was avoided. Moreover, all the attributes of the ASCs were utilized during the target reconstruction. Therefore, the proposed method can better exploit the discriminability of ASCs to improve the ATR performance. To evaluate the effectiveness and robustness of the proposed method, extensive experiments on the moving and stationary target acquisition and recognition (MSTAR) dataset were conducted under both the standard operating condition (SOC) and typical extended operating conditions (EOCs). Full article
(This article belongs to the Section Remote Sensing Image Processing)
Show Figures

Graphical abstract

23 pages, 6898 KiB  
Article
Characterizing the Spatio-Temporal Pattern of Land Surface Temperature through Time Series Clustering: Based on the Latent Pattern and Morphology
by Huimin Liu, Qingming Zhan, Chen Yang and Jiong Wang
Remote Sens. 2018, 10(4), 654; https://doi.org/10.3390/rs10040654 - 23 Apr 2018
Cited by 35 | Viewed by 7768
Abstract
Land Surface Temperature (LST) is a critical component to understand the impact of urbanization on the urban thermal environment. Previous studies were inclined to apply only one snapshot to analyze the pattern and dynamics of LST without considering the non-stationarity in the temporal [...] Read more.
Land Surface Temperature (LST) is a critical component to understand the impact of urbanization on the urban thermal environment. Previous studies were inclined to apply only one snapshot to analyze the pattern and dynamics of LST without considering the non-stationarity in the temporal domain, or focus on the diurnal, seasonal, and annual pattern analysis of LST which has limited support for the understanding of how LST varies with the advancing of urbanization. This paper presents a workflow to extract the spatio-temporal pattern of LST through time series clustering by focusing on the LST of Wuhan, China, from 2002 to 2017 with a 3-year time interval with 8-day MODerate-resolution Imaging Spectroradiometer (MODIS) satellite image products. The Latent pattern of LST (LLST) generated by non-parametric Multi-Task Gaussian Process Modeling (MTGP) and the Multi-Scale Shape Index (MSSI) which characterizes the morphology of LLST are coupled for pattern recognition. Specifically, spatio-temporal patterns are discovered after the extraction of spatial patterns conducted by the incorporation of k -means and the Back-Propagation neural networks (BP-Net). The spatial patterns of the 6 years form a basic understanding about the corresponding temporal variances. For spatio-temporal pattern recognition, LLSTs and MSSIs of the 6 years are regarded as geo-referenced time series. Multiple algorithms including traditional k -means with Euclidean Distance (ED), shape-based k -means with the constrained Dynamic Time Warping ( c DTW) distance measure, and the Dynamic Time Warping Barycenter Averaging (DBA) centroid computation method ( k - c DBA) and k -shape are applied. Ten external indexes are employed to evaluate the performance of the three algorithms and reveal k - c DBA as the optimal time series clustering algorithm for our study. The study area is divided into 17 geographical time series clusters which respectively illustrate heterogeneous temporal dynamics of LST patterns. The homogeneous geographical clusters correspond to the zoning custom of urban planning and design, and thus, may efficiently bridge the urban and environmental systems in terms of research scope and scale. The proposed workflow can be utilized for other cities and potentially used for comparison among different cities. Full article
Show Figures

Graphical abstract

20 pages, 4192 KiB  
Article
Global MODIS Fraction of Green Vegetation Cover for Monitoring Abrupt and Gradual Vegetation Changes
by Federico Filipponi, Emiliana Valentini, Alessandra Nguyen Xuan, Carlos A. Guerra, Florian Wolf, Martin Andrzejak and Andrea Taramelli
Remote Sens. 2018, 10(4), 653; https://doi.org/10.3390/rs10040653 - 23 Apr 2018
Cited by 40 | Viewed by 7908
Abstract
The presence and distribution of green vegetation cover in the biosphere are of paramount importance in investigating cause-effect phenomena at the land/atmosphere interface, estimating primary production rates as part of global carbon and water cycle assessments and evaluating soil protection and land use [...] Read more.
The presence and distribution of green vegetation cover in the biosphere are of paramount importance in investigating cause-effect phenomena at the land/atmosphere interface, estimating primary production rates as part of global carbon and water cycle assessments and evaluating soil protection and land use change over time. The fraction of green vegetation cover (FCover) as estimated from satellite observations has already been demonstrated to be an extraordinarily useful product for understanding vegetation cover changes, for supporting ecosystem service assessments over areas with variable extents and for processes spanning a variable period of time (abrupt events or long-term processes). This study describes a methodology implemented to estimate global FCover (from 2001 to 2015) by applying a linear spectral mixture analysis with global endmembers to an entire temporal series of MODIS satellite observations and gap-filling missing FCover observations in temporal series using the DINEOF algorithm. The resulting global MODV1 FCover product was validated with two global validation datasets and showed an overall good thematic absolute accuracy (RMSE = 0.146) consistent with the validation performance of other FCover global products. Basic statistics performed on the product show changes in average and trend values and allow for the quantification of gross vegetation loss and gain over different temporal scales. To demonstrate the capacity of this global product to monitor specific dynamics, a multitemporal analysis was performed on selected sites and vegetation responses (i.e., cover changes), and specific dynamics resulting from cause-effect phenomena are briefly discussed. The product is intended to be used for monitoring vegetation dynamics, but it also has the potential to be integrated in other modeling frameworks (e.g., the carbon cycle, primary production, and soil erosion) in conjunction with other spatial datasets such as those on climate and soil type. Full article
(This article belongs to the Section Remote Sensing in Agriculture and Vegetation)
Show Figures

Figure 1

16 pages, 4420 KiB  
Article
Salient Object Detection via Recursive Sparse Representation
by Yongjun Zhang, Xiang Wang, Xunwei Xie and Yansheng Li
Remote Sens. 2018, 10(4), 652; https://doi.org/10.3390/rs10040652 - 23 Apr 2018
Cited by 14 | Viewed by 4884
Abstract
Object-level saliency detection is an attractive research field which is useful for many content-based computer vision and remote-sensing tasks. This paper introduces an efficient unsupervised approach to salient object detection from the perspective of recursive sparse representation. The reconstruction error determined by foreground [...] Read more.
Object-level saliency detection is an attractive research field which is useful for many content-based computer vision and remote-sensing tasks. This paper introduces an efficient unsupervised approach to salient object detection from the perspective of recursive sparse representation. The reconstruction error determined by foreground and background dictionaries other than common local and global contrasts is used as the saliency indication, by which the shortcomings of the object integrity can be effectively improved. The proposed method consists of the following four steps: (1) regional feature extraction; (2) background and foreground dictionaries extraction according to the initial saliency map and image boundary constraints; (3) sparse representation and saliency measurement; and (4) recursive processing with a current saliency map updating the initial saliency map in step 2 and repeating step 3. This paper also presents the experimental results of the proposed method compared with seven state-of-the-art saliency detection methods using three benchmark datasets, as well as some satellite and unmanned aerial vehicle remote-sensing images, which confirmed that the proposed method was more effective than current methods and could achieve more favorable performance in the detection of multiple objects as well as maintaining the integrity of the object area. Full article
(This article belongs to the Special Issue Pattern Analysis and Recognition in Remote Sensing)
Show Figures

Graphical abstract

17 pages, 5267 KiB  
Article
Impacts of 3D Aerosol, Cloud, and Water Vapor Variations on the Recent Brightening during the South Asian Monsoon Season
by Zengxin Pan, Feiyue Mao, Wei Wang, Bo Zhu, Xin Lu and Wei Gong
Remote Sens. 2018, 10(4), 651; https://doi.org/10.3390/rs10040651 - 23 Apr 2018
Cited by 13 | Viewed by 4638
Abstract
South Asia is experiencing a levelling-off trend in solar radiation and even a transition from dimming to brightening. Any change in incident solar radiation, which is the only significant energy source of the global ecosystem, profoundly affects our habitats. Here, we use multiple [...] Read more.
South Asia is experiencing a levelling-off trend in solar radiation and even a transition from dimming to brightening. Any change in incident solar radiation, which is the only significant energy source of the global ecosystem, profoundly affects our habitats. Here, we use multiple observations of the A-Train constellation to evaluate the impacts of three-dimensional (3D) aerosol, cloud, and water vapor variations on the changes in surface solar radiation during the monsoon season (June–September) in South Asia from 2006 to 2015. Results show that surface shortwave radiation (SSR) has possibly increased by 16.2 W m−2 during this period. However, an increase in aerosol loading is inconsistent with the SSR variations. Instead, clouds are generally reduced and thinned by approximately 8.8% and 280 m, respectively, with a decrease in both cloud water path (by 34.7 g m−2) and particle number concentration under cloudy conditions. Consequently, the shortwave cloud radiative effect decreases by approximately 45.5 W m−2 at the surface. Moreover, precipitable water in clear-sky conditions decreases by 2.8 mm (mainly below 2 km), and related solar brightening increases by 2.5 W m−2. Overall, the decreases in 3D water vapor and clouds distinctly result in increased absorption of SSR and subsequent surface brightening. Full article
(This article belongs to the Section Atmospheric Remote Sensing)
Show Figures

Figure 1

1 pages, 2626 KiB  
Article
Enhanced Modeling of Annual Temperature Cycles with Temporally Discrete Remotely Sensed Thermal Observations
by Zhaoxu Zou, Wenfeng Zhan, Zihan Liu, Benjamin Bechtel, Lun Gao, Falu Hong, Fan Huang and Jiameng Lai
Remote Sens. 2018, 10(4), 650; https://doi.org/10.3390/rs10040650 - 23 Apr 2018
Cited by 28 | Viewed by 5067
Abstract
Satellite thermal remote sensing provides land surface temperatures (LST) over extensive areas that are vital in various applications, but this technique suffers from its sampling style and the impenetrability of clouds, which frequently generates data gaps. Annual temperature cycle (ATC) models can fill [...] Read more.
Satellite thermal remote sensing provides land surface temperatures (LST) over extensive areas that are vital in various applications, but this technique suffers from its sampling style and the impenetrability of clouds, which frequently generates data gaps. Annual temperature cycle (ATC) models can fill these gaps and estimate continuous daily LST dynamics from a number of thermal observations. However, the standard ATC model (termed ATCS) remains incapable of quantifying the short-term LST variations caused by synoptic conditions. By incorporating in-situ surface air temperatures (SATs) and satellite-derived normalized difference vegetation indexes (NDVIs), here we proposed an enhanced ATC model (ATCE) to describe the daily LST fluctuations. With Aqua/MODIS LST products as validation data, we implemented and tested the ATCE over the Yangtze River Delta region of China. The results demonstrate that, when compared with the ATCS, the overall root mean square errors of the ATCE decrease by 1.0 and 0.8 K for the day and night, respectively. The accuracy improvements vary with land cover types with greater improvements over the forest, grassland, and built-up areas than over cropland and wetland. The assessments at different time scales further confirm that LST fluctuations can be better described by the ATCE. Though with limitations, we consider this new model and its associated parameters hold great potentials in various applications. Full article
Show Figures

Graphical abstract

16 pages, 2408 KiB  
Article
The Use of Three-Dimensional Convolutional Neural Networks to Interpret LiDAR for Forest Inventory
by Elias Ayrey and Daniel J. Hayes
Remote Sens. 2018, 10(4), 649; https://doi.org/10.3390/rs10040649 - 23 Apr 2018
Cited by 64 | Viewed by 13928
Abstract
As light detection and ranging (LiDAR) technology becomes more available, it has become common to use these datasets to generate remotely sensed forest inventories across landscapes. Traditional methods for generating these inventories employ the use of height and proportion metrics to measure LiDAR [...] Read more.
As light detection and ranging (LiDAR) technology becomes more available, it has become common to use these datasets to generate remotely sensed forest inventories across landscapes. Traditional methods for generating these inventories employ the use of height and proportion metrics to measure LiDAR returns and relate these back to field data using predictive models. Here, we employ a three-dimensional convolutional neural network (CNN), a deep learning technique that scans the LiDAR data and automatically generates useful features for predicting forest attributes. We test the accuracy in estimating forest attributes using the three-dimensional implementations of different CNN models commonly used in the field of image recognition. Using the best performing model architecture, we compared CNN performance to models developed using traditional height metrics. The results of this comparison show that CNNs produced 12% less prediction error when estimating biomass, 6% less in estimating tree count, and 2% less when estimating the percentage of needleleaf trees. We conclude that using CNNs can be a more accurate means of interpreting LiDAR data for forest inventories compared to standard approaches. Full article
(This article belongs to the Section Forest Remote Sensing)
Show Figures

Graphical abstract

14 pages, 26661 KiB  
Article
Evaluation of ISS-RapidScat Wind Vectors Using Buoys and ASCAT Data
by Jungang Yang and Jie Zhang
Remote Sens. 2018, 10(4), 648; https://doi.org/10.3390/rs10040648 - 23 Apr 2018
Cited by 10 | Viewed by 4215
Abstract
The International Space Station scatterometer (named ISS-RapidScat) was launched by NASA on 20 September 2014 as a continuation of the QuikSCAT climate data record to maintain the availability of Ku-band scatterometer data after the QuikSCAT missions ended. In this study, the overall archived [...] Read more.
The International Space Station scatterometer (named ISS-RapidScat) was launched by NASA on 20 September 2014 as a continuation of the QuikSCAT climate data record to maintain the availability of Ku-band scatterometer data after the QuikSCAT missions ended. In this study, the overall archived ISS-RapidScat wind vectors in the wind speed range of 0–24 m/s are evaluated by the global moored buoys’ wind observations, including the U.S. National Data Buoy Center (NDBC), the Tropical Atmosphere Ocean (TAO), and the Pilot Research Moored Array in the Tropical Atlantic (PIRATA), the Research Moored Array for African–Asian–Australian Monsoon Analysis and Prediction (RAMA), and Advanced Scatterometer (ASCAT) wind data in the same period of ISS-RapidScat by calculating the statistical parameters, namely, the root mean square error (RMSE), bias (mean of residuals), and correlation coefficient (R) between the collocated data. The comparisons with the global moored buoys show that the RapidScat wind vectors are consistent with buoys’ wind measurements. The average errors of the RapidScat wind vectors are 1.42 m/s and 19.5°. The analysis of the RapidScat wind vector errors at different buoy wind speeds in bins of 1 m/s indicates that the errors of the RapidScat wind speed reduce firstly, and then increase with the increasing buoy wind speed, and the errors of the RapidScat wind direction decrease with increasing buoy wind speed. The comparisons of the errors of the RapidScat wind speed and direction at different months from April 2015 to August 2016 show that the accuracies of the RapidScat wind vectors have no dependence on the time, and the biases of the RapidScat wind speed indicate that there is an annual periodic signal of wind speed errors which are due to the annual cycle variation of ocean winds. The accuracies of the RapidScat wind vectors at different times in one day are also analyzed and the results show that the accuracy of the RapidScat wind vectors at different times of the day is basically consistent and with no diurnal variation. In order to evaluate the ISS-RapidScat wind vectors of the global oceans, the differences (RapidScat-ASCAT) in the wind speed range of 0–30 m/s are analyzed in the different months from October 2014 to August 2016, and the average RMSEs of differences between ISS-RapidScat and ASCAT wind vectors are less than 1.15 m/s and 15.21°. In general, the evaluation of the all-over archived ISS-RapidScat wind vectors show that the accuracies of the ISS-RapidScat wind vectors satisfy the general scatterometer’s mission requirement and are consistent with ASCAT wind data. Full article
(This article belongs to the Special Issue Radar Remote Sensing of Oceans and Coastal Areas)
Show Figures

Graphical abstract

15 pages, 2622 KiB  
Article
Spatial Downscaling of Gross Primary Productivity Using Topographic and Vegetation Heterogeneity Information: A Case Study in the Gongga Mountain Region of China
by Xinyao Xie, Ainong Li, Huaan Jin, Gaofei Yin and Jinhu Bian
Remote Sens. 2018, 10(4), 647; https://doi.org/10.3390/rs10040647 - 22 Apr 2018
Cited by 13 | Viewed by 3699
Abstract
Due to the spatial heterogeneity of land surfaces, downscaling is an important issue in the development of carbon cycle models when evaluating the role of ecosystems in the global carbon cycle. In this study, a downscaling algorithm was developed to model gross primary [...] Read more.
Due to the spatial heterogeneity of land surfaces, downscaling is an important issue in the development of carbon cycle models when evaluating the role of ecosystems in the global carbon cycle. In this study, a downscaling algorithm was developed to model gross primary productivity (GPP) at 500 m in a time series over rugged terrain, which considered the effects of spatial heterogeneity on carbon flux simulations. This work was carried out for a mountainous area with an altitude ranging from 2606 to 4744 m over the Gongga Mountain (Sichuan Province, China). In addition, the Moderate Resolution Imaging Spectroradiometer (MODIS) GPP product at 1 km served as the primary dataset for the downscaling algorithm, and the 500 m MODIS GPP product was used as the reference dataset to evaluate the downscaled GPP results. Moreover, in order to illustrate the advantages and benefits of the proposed downscaling method, the downscaled results in this work, along with ordinary kriging downscaled results, spline downscaled results and inverse distance weighted (IDW) downscaled results, were compared to the MODIS GPP at 500 m. The results showed that (1) the GPP difference between the 500 m MODIS GPP and the proposed downscaled GPP results was primarily in the range of [−1, 1], showing that both vegetation heterogeneity factors (i.e., LAI) and topographic factors (i.e., altitude, slope and aspect) were useful for GPP downscaling; (2) the proposed downscaled results (R2 = 0.89, RMSE = 1.03) had a stronger consistency with the 500 m MODIS GPP than those of the ordinary kriging downscaled results (R2 = 0.43, RMSE = 1.36), the spline downscaled results (R2 = 0.40, RMSE = 1.50) and the IDW downscaled results (R2 = 0.42, RMSE = 1.10) for all Julian days; and (3) the inconsistency between MODIS GPP at 500 m and 1 km increased with the increase in altitude and slope. The proposed downscaling algorithm could provide a reference when considering the effects of spatial heterogeneity on carbon flux simulations and retrieving other fine resolution ecological-physiology parameters (e.g., net primary productivity and evaporation) over topographically complex terrains. Full article
Show Figures

Graphical abstract

25 pages, 3641 KiB  
Article
Evaluation of Heavy Precipitation Simulated by the WRF Model Using 4D-Var Data Assimilation with TRMM 3B42 and GPM IMERG over the Huaihe River Basin, China
by Lu Yi, Wanchang Zhang and Kai Wang
Remote Sens. 2018, 10(4), 646; https://doi.org/10.3390/rs10040646 - 22 Apr 2018
Cited by 32 | Viewed by 5816
Abstract
To obtain independent, consecutive, and high-resolution precipitation data, the four-dimensional variational (4D-Var) method was applied to directly assimilate satellite precipitation products into the Weather Research and Forecasting (WRF) model. The precipitation products of the Tropical Rainfall Measuring Mission 3B42 (TRMM 3B42) and its [...] Read more.
To obtain independent, consecutive, and high-resolution precipitation data, the four-dimensional variational (4D-Var) method was applied to directly assimilate satellite precipitation products into the Weather Research and Forecasting (WRF) model. The precipitation products of the Tropical Rainfall Measuring Mission 3B42 (TRMM 3B42) and its successor, the Integrated Multi-satellitE Retrievals for Global Precipitation Measurement (GPM IMERG) were assimilated in this study. Two heavy precipitation events that occurred over the Huaihe River basin in eastern China were studied. Before assimilation, the WRF model simulations were first performed with different forcing data to select more suitable forcing data and determine the control experiments for the subsequent assimilation experiments. Then, TRMM 3B42 and GPM IMERG were separately assimilated into the WRF. The simulated precipitation results in the outer domain (D01), with a 27-km resolution, and the inner domain (D02), with a 9-km resolution, were evaluated in detail. The assessments showed that (1) 4D-Var with TRMM 3B42 or GPM IMERG could both significantly improve WRF precipitation predictions at a time interval of approximately 12 h; (2) the WRF simulated precipitation assimilated with GPM IMERG outperformed the one with TRMM 3B42; (3) for the WRF output precipitation assimilated with GPM IMERG over D02, which has spatiotemporal resolutions of 9 km and 50 s, the correlation coefficients of the studied events in August and November were 0.74 and 0.51, respectively, at the point and daily scales, and the mean Heidke skill scores for the two studied events both reached 0.31 at the grid and hourly scales. This study can provide references for the assimilation of TRMM 3B42 or GPM IMERG into the WRF model using 4D-Var, which is especially valuable for hydrological applications of GPM IMERG during the transition period from the TRMM era into the GPM era. Full article
(This article belongs to the Special Issue Assimilation of Remote Sensing Data into Earth System Models)
Show Figures

Graphical abstract

21 pages, 37047 KiB  
Article
Pushbroom Hyperspectral Data Orientation by Combining Feature-Based and Area-Based Co-Registration Techniques
by Kévin Barbieux
Remote Sens. 2018, 10(4), 645; https://doi.org/10.3390/rs10040645 - 22 Apr 2018
Cited by 8 | Viewed by 5888
Abstract
Direct georeferencing of airborne pushbroom scanner data usually suffers from the limited precision of navigation sensors onboard of the aircraft. The bundle adjustment of images and orientation parameters, used to perform geocorrection of frame images during the post-processing phase, cannot be used for [...] Read more.
Direct georeferencing of airborne pushbroom scanner data usually suffers from the limited precision of navigation sensors onboard of the aircraft. The bundle adjustment of images and orientation parameters, used to perform geocorrection of frame images during the post-processing phase, cannot be used for pushbroom cameras without difficulties—it relies on matching corresponding points between scan lines, which is not feasible in the absence of sufficient overlap and texture information. We address this georeferencing problem by equipping our aircraft with both a frame camera and a pushbroom scanner: the frame images and the navigation parameters measured by a couple GPS/Inertial Measurement Unit (IMU) are input to a bundle adjustment algorithm; the output orientation parameters are used to project the scan lines on a Digital Elevation Model (DEM) and on an orthophoto generated during the bundle adjustment step; using the image feature matching algorithm Speeded Up Robust Features (SURF), corresponding points between the image formed by the projected scan lines and the orthophoto are matched, and through a least-squares method, the boresight between the two cameras is estimated and included in the calculation of the projection. Finally, using Particle Image Velocimetry (PIV) on the gradient image, the projection is deformed into a final image that fits the geometry of the orthophoto. We apply this algorithm to five test acquisitions over Lake Geneva region (Switzerland) and Lake Baikal region (Russia). The results are quantified in terms of Root Mean Square Error (RMSE) between matching points of the RGB orthophoto and the pushbroom projection. From a first projection where the Interior Orientation Parameters (IOP) are known with limited precision and the RMSE goes up to 41 pixels, our geocorrection estimates IOP, boresight and Exterior Orientation Parameters (EOP) and produces a new projection with an RMSE, with the reference orthophoto, around two pixels. Full article
Show Figures

Graphical abstract

14 pages, 2877 KiB  
Article
SAR Mode Altimetry Observations of Internal Solitary Waves in the Tropical Ocean Part 1: Case Studies
by Adriana M. Santos-Ferreira, José C. B. Da Silva and Jorge M. Magalhaes
Remote Sens. 2018, 10(4), 644; https://doi.org/10.3390/rs10040644 - 22 Apr 2018
Cited by 21 | Viewed by 5843
Abstract
It is well known that internal waves (IWs) of tidal frequency (i.e., internal tides) are successfully detected in sea surface height (SSH) by satellite altimetry. Shorter period internal solitary waves (ISWs), whose periods (and spatial scales) are an order of magnitude smaller than [...] Read more.
It is well known that internal waves (IWs) of tidal frequency (i.e., internal tides) are successfully detected in sea surface height (SSH) by satellite altimetry. Shorter period internal solitary waves (ISWs), whose periods (and spatial scales) are an order of magnitude smaller than tidal internal waves, have been generally assumed too small to be detected with conventional altimeters. This is because conventional (pulse-limited) radar altimeter footprints are somewhat larger than or of similar size, at best, as the typical wavelengths of the ISWs. Here we demonstrate that the synthetic aperture radar altimeter (SRAL) on board the Sentinel-3A can detect short-period ISWs. A variety of signatures owing to the surface manifestations of the ISWs are apparent in the SRAL Level-2 products over the ocean. These signatures are identified in several geophysical parameters, such as radar backscatter (sigma0), sea level anomaly (SLA), and significant wave height (SWH). Radar backscatter is the primary parameter in which ISWs can be identified owing to the measurable sea surface roughness perturbations in the along-track sharpened SRAL footprint. The SRAL footprint is sufficiently small to capture radar power fluctuations over successive wave crests and troughs, which produce rough and slick surface patterns arrayed in parallel bands with scales of a few kilometers. The ISW signatures are unambiguously identified in the SRAL because of the exact synergy with OLCI (Ocean Land Colour Imager) images, which in cloud-free conditions allow clear identification of the ISWs in the sunglint OLCI images. We show that both sigma0 and SLA yield realistic estimates for routine observation of ISWs with the SRAL, which is a significant improvement from previous observations recently reported for conventional pulse-limited altimeters (Jason-2). Several case studies of ISW signatures are interpreted in light of our knowledge of radar backscatter in the internal wave field. An analysis is presented for the tropical Atlantic Ocean off the Amazon shelf to infer the frequency of the phenomena, being consistent with previous satellite observations in the study region. Full article
(This article belongs to the Special Issue Radar Remote Sensing of Oceans and Coastal Areas)
Show Figures

Graphical abstract

22 pages, 4059 KiB  
Article
The Combined ASTER MODIS Emissivity over Land (CAMEL) Part 1: Methodology and High Spectral Resolution Application
by E. Eva Borbas, Glynn Hulley, Michelle Feltz, Robert Knuteson and Simon Hook
Remote Sens. 2018, 10(4), 643; https://doi.org/10.3390/rs10040643 - 21 Apr 2018
Cited by 36 | Viewed by 6171
Abstract
As part of a National Aeronautics and Space Administration (NASA) MEaSUREs (Making Earth System Data Records for Use in Research Environments) Land Surface Temperature and Emissivity project, the Space Science and Engineering Center (UW-Madison) and the NASA Jet Propulsion Laboratory (JPL) developed a [...] Read more.
As part of a National Aeronautics and Space Administration (NASA) MEaSUREs (Making Earth System Data Records for Use in Research Environments) Land Surface Temperature and Emissivity project, the Space Science and Engineering Center (UW-Madison) and the NASA Jet Propulsion Laboratory (JPL) developed a global monthly mean emissivity Earth System Data Record (ESDR). This new Combined ASTER (Advanced Spaceborne Thermal Emission and Reflection Radiometer) and MODIS (Moderate Resolution Imaging Spectroradiometer) Emissivity over Land (CAMEL) ESDR was produced by merging two current state-of-the-art emissivity datasets: the UW-Madison MODIS Infrared emissivity dataset (UW BF) and the JPL ASTER Global Emissivity Dataset Version 4 (GEDv4). The dataset includes monthly global records of emissivity and related uncertainties at 13 hinge points between 3.6–14.3 µm, as well as principal component analysis (PCA) coefficients at 5-km resolution for the years 2000 through 2016. A high spectral resolution (HSR) algorithm is provided for HSR applications. This paper describes the 13 hinge-points combination methodology and the high spectral resolutions algorithm, as well as reports the current status of the dataset. Full article
Show Figures

Graphical abstract

17 pages, 2784 KiB  
Article
NWP-Based Adjustment of IMERG Precipitation for Flood-Inducing Complex Terrain Storms: Evaluation over CONUS
by Xinxuan Zhang, Emmanouil N. Anagnostou and Craig S. Schwartz
Remote Sens. 2018, 10(4), 642; https://doi.org/10.3390/rs10040642 - 21 Apr 2018
Cited by 13 | Viewed by 4816
Abstract
This paper evaluates the use of precipitation forecasts from a numerical weather prediction (NWP) model for near-real-time satellite precipitation adjustment based on 81 flood-inducing heavy precipitation events in seven mountainous regions over the conterminous United States. The study is facilitated by the National [...] Read more.
This paper evaluates the use of precipitation forecasts from a numerical weather prediction (NWP) model for near-real-time satellite precipitation adjustment based on 81 flood-inducing heavy precipitation events in seven mountainous regions over the conterminous United States. The study is facilitated by the National Center for Atmospheric Research (NCAR) real-time ensemble forecasts (called model), the Integrated Multi-satellitE Retrievals for GPM (IMERG) near-real-time precipitation product (called raw IMERG) and the Stage IV multi-radar/multi-sensor precipitation product (called Stage IV) used as a reference. We evaluated four precipitation datasets (the model forecasts, raw IMERG, gauge-adjusted IMERG and model-adjusted IMERG) through comparisons against Stage IV at six-hourly and event length scales. The raw IMERG product consistently underestimated heavy precipitation in all study regions, while the domain average rainfall magnitudes exhibited by the model were fairly accurate. The model exhibited error in the locations of intense precipitation over inland regions, however, while the IMERG product generally showed correct spatial precipitation patterns. Overall, the model-adjusted IMERG product performed best over inland regions by taking advantage of the more accurate rainfall magnitude from NWP and the spatial distribution from IMERG. In coastal regions, although model-based adjustment effectively improved the performance of the raw IMERG product, the model forecast performed even better. The IMERG product could benefit from gauge-based adjustment, as well, but the improvement from model-based adjustment was consistently more significant. Full article
(This article belongs to the Special Issue Remote Sensing of Precipitation)
Show Figures

Figure 1

28 pages, 17324 KiB  
Review
On the Use of Unmanned Aerial Systems for Environmental Monitoring
by Salvatore Manfreda, Matthew F. McCabe, Pauline E. Miller, Richard Lucas, Victor Pajuelo Madrigal, Giorgos Mallinis, Eyal Ben Dor, David Helman, Lyndon Estes, Giuseppe Ciraolo, Jana Müllerová, Flavia Tauro, M. Isabel De Lima, João L. M. P. De Lima, Antonino Maltese, Felix Frances, Kelly Caylor, Marko Kohv, Matthew Perks, Guiomar Ruiz-Pérez, Zhongbo Su, Giulia Vico and Brigitta Tothadd Show full author list remove Hide full author list
Remote Sens. 2018, 10(4), 641; https://doi.org/10.3390/rs10040641 - 20 Apr 2018
Cited by 480 | Viewed by 34733
Abstract
Environmental monitoring plays a central role in diagnosing climate and management impacts on natural and agricultural systems; enhancing the understanding of hydrological processes; optimizing the allocation and distribution of water resources; and assessing, forecasting, and even preventing natural disasters. Nowadays, most monitoring and [...] Read more.
Environmental monitoring plays a central role in diagnosing climate and management impacts on natural and agricultural systems; enhancing the understanding of hydrological processes; optimizing the allocation and distribution of water resources; and assessing, forecasting, and even preventing natural disasters. Nowadays, most monitoring and data collection systems are based upon a combination of ground-based measurements, manned airborne sensors, and satellite observations. These data are utilized in describing both small- and large-scale processes, but have spatiotemporal constraints inherent to each respective collection system. Bridging the unique spatial and temporal divides that limit current monitoring platforms is key to improving our understanding of environmental systems. In this context, Unmanned Aerial Systems (UAS) have considerable potential to radically improve environmental monitoring. UAS-mounted sensors offer an extraordinary opportunity to bridge the existing gap between field observations and traditional air- and space-borne remote sensing, by providing high spatial detail over relatively large areas in a cost-effective way and an entirely new capacity for enhanced temporal retrieval. As well as showcasing recent advances in the field, there is also a need to identify and understand the potential limitations of UAS technology. For these platforms to reach their monitoring potential, a wide spectrum of unresolved issues and application-specific challenges require focused community attention. Indeed, to leverage the full potential of UAS-based approaches, sensing technologies, measurement protocols, postprocessing techniques, retrieval algorithms, and evaluation techniques need to be harmonized. The aim of this paper is to provide an overview of the existing research and applications of UAS in natural and agricultural ecosystem monitoring in order to identify future directions, applications, developments, and challenges. Full article
(This article belongs to the Section Remote Sensing in Agriculture and Vegetation)
Show Figures

Graphical abstract

12 pages, 3405 KiB  
Article
Influence of Tropical Instability Waves on Phytoplankton Biomass near the Marquesas Islands
by Elodie Martinez, Hirohiti Raapoto, Christophe Maes and Keitapu Maamaatuaihutapu
Remote Sens. 2018, 10(4), 640; https://doi.org/10.3390/rs10040640 - 20 Apr 2018
Cited by 8 | Viewed by 4550
Abstract
The Marquesas form an isolated group of small islands in the Central South Pacific where quasi-permanent biological activity is observed. During La Niña events, this biological activity, shown by a net increase of chlorophyll-a concentration (Chl, a proxy of phytoplankton biomass), is particularly [...] Read more.
The Marquesas form an isolated group of small islands in the Central South Pacific where quasi-permanent biological activity is observed. During La Niña events, this biological activity, shown by a net increase of chlorophyll-a concentration (Chl, a proxy of phytoplankton biomass), is particularly strong. It has been hypothesized that this strong activity is due to iron-rich waters advected from the equatorial region to the Marquesas by tropical instability waves (TIWs). Here we investigate this hypothesis over 18 years by combining satellite observations, re-analyses of ocean data, and Lagrangian diagnostics. Four La Niña events ranging from moderate to strong intensity occurred during this period, and our results show that the Chl plume within the archipelago can be indeed influenced by such equatorial advection, but this was observed during the strong 1998 and 2010 La Niña conditions only. Chl spatio-temporal patterns during the occurrence of other TIWs rather suggest the interaction of large-scale forcing events such as an uplift of the thermocline or the enhancement of coastal upwelling induced by the tropical strengthening of the trades with the islands leading to enhancement of phytoplankton biomass within the surface waters. Overall, whatever the conditions, our analyses suggest that the influence of the TIWs is to disperse, stir, and, therefore, modulate the shape of the existing phytoplankton plume. Full article
(This article belongs to the Special Issue Remote Sensing of Ocean Colour)
Show Figures

Graphical abstract

25 pages, 14915 KiB  
Article
Application of Ground Penetrating Radar Supported by Mineralogical-Geochemical Methods for Mapping Unroofed Cave Sediments
by Teja Čeru, Matej Dolenec and Andrej Gosar
Remote Sens. 2018, 10(4), 639; https://doi.org/10.3390/rs10040639 - 20 Apr 2018
Cited by 10 | Viewed by 7651
Abstract
Ground penetrating radar (GPR) using a special unshielded 50 MHz Rough Terrain Antenna (RTA) in combination with a shielded 250 MHz antenna was used to study the capability of this geophysical method for detecting cave sediments. Allochthonous cave sediments found in the study [...] Read more.
Ground penetrating radar (GPR) using a special unshielded 50 MHz Rough Terrain Antenna (RTA) in combination with a shielded 250 MHz antenna was used to study the capability of this geophysical method for detecting cave sediments. Allochthonous cave sediments found in the study area of Lanski vrh (W Slovenia) are now exposed on the karst surface in the so-called “unroofed caves” due to a general lowering of the surface (denudation of carbonate rocks) and can provide valuable evidence of the karst development. In the first phase, GPR profiles were measured at three test locations, where cave sediments are clearly evident on the surface and appear with flowstone. It turned out that cave sediments are clearly visible on GPR radargrams as areas of strong signal attenuation. Based on this finding, GPR profiling was used in several other places where direct indicators of unroofed caves or other indicators for speleogenesis are not present due to strong surface reshaping. The influence of various field conditions, especially water content, on GPR measurements was also analysed by comparing radargrams measured in various field conditions. Further mineralogical-geochemical analyses were conducted to better understand the factors that influence the attenuation in the area of cave sediments. Samples of cave sediments and soils on carbonate rocks (rendzina) were taken for X-ray diffraction (XRD) and X-ray fluorescence (XRF) analyses to compare the mineral and geochemical compositions of both sediments. Results show that cave sediments contain higher amounts of clay minerals and iron/aluminium oxides/hydroxides which, in addition to the thickness of cave sediments, can play an important role in the depth of penetration. Differences in the mineral composition also lead to water retention in cave sediments even through dry periods which additionally contribute to increased attenuation with respect to surrounding soils. The GPR method has proven to be reliable for locating areas of cave sediments at the surface and to determine their spatial extent, which is very important in delineating the geometry of unroofed cave systems. GPR thus proved to be a very valuable method in supporting geological and geomorphological mapping for a more comprehensive recognition of unroofed cave systems. These are important for understanding karstification and speleogenetic processes that influenced the formation of former underground caves and can help us reconstruct the direction of former underground water flows. Full article
(This article belongs to the Special Issue Recent Advances in GPR Imaging)
Show Figures

Graphical abstract

22 pages, 12316 KiB  
Article
Lithological Classification Using Sentinel-2A Data in the Shibanjing Ophiolite Complex in Inner Mongolia, China
by Wenyan Ge, Qiuming Cheng, Yunwei Tang, Linhai Jing and Chunsheng Gao
Remote Sens. 2018, 10(4), 638; https://doi.org/10.3390/rs10040638 - 20 Apr 2018
Cited by 72 | Viewed by 10452
Abstract
As a source of data continuity between Landsat and SPOT, Sentinel-2 is an Earth observation mission developed by the European Space Agency (ESA), which acquires 13 bands in the visible and near-infrared (VNIR) to shortwave infrared (SWIR) range. In this study, a Sentinel-2A [...] Read more.
As a source of data continuity between Landsat and SPOT, Sentinel-2 is an Earth observation mission developed by the European Space Agency (ESA), which acquires 13 bands in the visible and near-infrared (VNIR) to shortwave infrared (SWIR) range. In this study, a Sentinel-2A imager was utilized to assess its ability to perform lithological classification in the Shibanjing ophiolite complex in Inner Mongolia, China. Five conventional machine learning methods, including artificial neural network (ANN), k-nearest neighbor (k-NN), maximum likelihood classification (MLC), random forest classifier (RFC), and support vector machine (SVM), were compared in order to find an optimal classifier for lithological mapping. The experiment revealed that the MLC method offered the highest overall accuracy. After that, Sentinel-2A image was compared with common multispectral data ASTER and Landsat-8 OLI (operational land imager) for lithological mapping using the MLC method. The comparison results showed that the Sentinel-2A imagery yielded a classification accuracy of 74.5%, which was 2.5% and 5.08% higher than those of the ASTER and OLI imagery, respectively, indicating that Sentinel-2A imagery is adequate for lithological discrimination, due to its high spectral resolution in the VNIR to SWIR range. Moreover, different data combinations of Sentinel-2A + ASTER + DEM (digital elevation model) and OLI + ASTER + DEM data were tested on lithological mapping using the MLC method. The best mapping result was obtained from Sentinel-2A + ASTER + DEM dataset, demonstrating that OLI can be replaced by Sentinel-2A, which, when combined with ASTER, can achieve sufficient bandpasses for lithological classification. Full article
(This article belongs to the Collection Sentinel-2: Science and Applications)
Show Figures

Graphical abstract

21 pages, 4183 KiB  
Article
Reducing Uncertainty in Mapping of Mangrove Aboveground Biomass Using Airborne Discrete Return Lidar Data
by Francisca Rocha de Souza Pereira, Milton Kampel, Mário Luiz Gomes Soares, Gustavo Calderucio Duque Estrada, Cristina Bentz and Gregoire Vincent
Remote Sens. 2018, 10(4), 637; https://doi.org/10.3390/rs10040637 - 20 Apr 2018
Cited by 23 | Viewed by 6422
Abstract
Remote sensing techniques offer useful tools for estimating forest biomass to large extent, thereby contributing to the monitoring of land use and landcover dynamics and the effectiveness of environmental policies. The main goal of this study was to investigate the potential use of [...] Read more.
Remote sensing techniques offer useful tools for estimating forest biomass to large extent, thereby contributing to the monitoring of land use and landcover dynamics and the effectiveness of environmental policies. The main goal of this study was to investigate the potential use of discrete return light detection and ranging (lidar) data to produce accurate aboveground biomass (AGB) maps of mangrove forests. AGB was estimated in 34 small plots scatted over a 50 km2 mangrove forest in Rio de Janeiro, Brazil. Plot AGB was computed using either species-specific or non-species-specific allometric models. A total of 26 descriptive lidar metrics were extracted from the normalized height of the lidar point cloud data, and various model forms (random forest and partial least squares regression with backward selection of predictors (Auto-PLS)) were tested to predict the recorded AGB. The models developed using species-specific allometric models were distinctly more accurate (R2(calibration) = 0.89, R2(validation) = 0.80, root-mean-square error (RMSE, calibration) = 11.20 t·ha−1, and RMSE(validation) = 14.80 t·ha−1). The use of non-species-specific allometric models yielded large errors on a landscape scale (+14% or −18% bias depending on the allometry considered), indicating that using poor quality training data not only results in low precision but inaccuracy at all scales. It was concluded that under suitable sampling pattern and provided that accurate field data are used, discrete return lidar can accurately estimate and map the AGB in mangrove forests. Conversely this study underlines the potential bias affecting the estimates of AGB in other forested landscapes where only non-species-specific allometric equations are available. Full article
(This article belongs to the Special Issue Biomass Remote Sensing in Forest Landscapes)
Show Figures

Graphical abstract

15 pages, 5877 KiB  
Article
Soil Moisture and Vegetation Water Content Retrieval Using QuikSCAT Data
by Shadi Oveisgharan, Ziad Haddad, Joe Turk, Ernesto Rodriguez and Li Li
Remote Sens. 2018, 10(4), 636; https://doi.org/10.3390/rs10040636 - 20 Apr 2018
Cited by 17 | Viewed by 4521
Abstract
Climate change and hydrological cycles can critically impact future water resources. Uncertainties in current climate models result in disagreement on the amount of water resources. Soil moisture and vegetation water content are key environmental variables on evaporation and transpiration at the land–atmosphere boundary. [...] Read more.
Climate change and hydrological cycles can critically impact future water resources. Uncertainties in current climate models result in disagreement on the amount of water resources. Soil moisture and vegetation water content are key environmental variables on evaporation and transpiration at the land–atmosphere boundary. Radar remote sensing helps to improve our estimate of water resources spatially and temporally. This work proposes a backscattered power formulation for the Ku-band. Li et al. (2010) retrieved soil moisture and vegetation water content values using Windsat data and simultaneous collocated QuikSCAT backscattered power are used to estimate different parameters of backscatter formulation. These parameters are used to estimate soil moisture and vegetation water content using QuikSCAT power everywhere and every day during the summer season. The 2-folded cross validation method is used to evaluate the performance of soil moisture and vegetation water content retrieval. A relatively large correlation is observed between vegetation water content using WindSat and QuikSCAT data in land classes of Evergreen Needleleaf, Evergreen Broadleaf, Deciduous Broadleaf, and Mixed Forests. Similarly, the retrieved soil moisture using QuikSCAT in areas with bare surface fraction of greater than 60% shows relatively high correlation with WindSat values. QuikSCAT satellite collects data over land globally almost every day. Therefore, QuikSCAT data can be used to generate a global map of soil moisture and vegetation water content daily from 2000 to 2009. Full article
Show Figures

Graphical abstract

13 pages, 17492 KiB  
Article
A Method for Robust Estimation of Vegetation Seasonality from Landsat and Sentinel-2 Time Series Data
by Per Jönsson, Zhanzhang Cai, Eli Melaas, Mark A. Friedl and Lars Eklundh
Remote Sens. 2018, 10(4), 635; https://doi.org/10.3390/rs10040635 - 19 Apr 2018
Cited by 95 | Viewed by 11372
Abstract
Time series from Landsat and Sentinel-2 satellites have great potential for modeling vegetation seasonality. However, irregular time sampling and frequent data loss due to clouds, snow, and short growing seasons, makes this modeling a challenge. We describe a new method for modeling seasonal [...] Read more.
Time series from Landsat and Sentinel-2 satellites have great potential for modeling vegetation seasonality. However, irregular time sampling and frequent data loss due to clouds, snow, and short growing seasons, makes this modeling a challenge. We describe a new method for modeling seasonal vegetation index dynamics from satellite time series data. The method is based on box constrained separable least squares fits to logistic model functions combined with seasonal shape priors. To enable robust estimates, we extract a base level (i.e., the minimum dormant season value) from the frequency distribution of clear-sky vegetation index values. A seasonal shape prior is computed from several years of data, and in the final fits local parameters are box constrained. More specifically, if enough data values exist in a certain time period, the corresponding local parameters determining the shape of the model function over this period are relaxed and allowed to vary freely. If there are no observations in a period, the corresponding local parameters are locked to the parameters of the shape prior. The method is flexible enough to model interannual variations, yet robust enough when data are sparse. We test the method with Landsat, Sentinel-2, and MODIS data over a forested site in Sweden, demonstrating the feasibility and potential of the method for operational modeling of growing seasons. Full article
(This article belongs to the Special Issue Land Surface Phenology )
Show Figures

Graphical abstract

22 pages, 3247 KiB  
Article
Model Selection for Parametric Surfaces Approximating 3D Point Clouds for Deformation Analysis
by Xin Zhao, Boris Kargoll, Mohammad Omidalizarandi, Xiangyang Xu and Hamza Alkhatib
Remote Sens. 2018, 10(4), 634; https://doi.org/10.3390/rs10040634 - 19 Apr 2018
Cited by 22 | Viewed by 5156
Abstract
Deformation monitoring of structures is a common application and one of the major tasks of engineering surveying. Terrestrial laser scanning (TLS) has become a popular method for detecting deformations due to high precision and spatial resolution in capturing a number of three-dimensional point [...] Read more.
Deformation monitoring of structures is a common application and one of the major tasks of engineering surveying. Terrestrial laser scanning (TLS) has become a popular method for detecting deformations due to high precision and spatial resolution in capturing a number of three-dimensional point clouds. Surface-based methodology plays a prominent role in rigorous deformation analysis. Consequently, it is of great importance to select an appropriate regression model that reflects the geometrical features of each state or epoch. This paper aims at providing the practitioner some guidance in this regard. Different from standard model selection procedures for surface models based on information criteria, we adopted the hypothesis tests from D.R. Cox and Q.H. Vuong to discriminate statistically between parametric models. The methodology was instantiated in two numerical examples by discriminating between widely used polynomial and B-spline surfaces as models of given TLS point clouds. According to the test decisions, the B-spline surface model showed a slight advantage when both surface types had few parameters in the first example, while it performed significantly better for larger numbers of parameters. Within B-spline surface models, the optimal one for the specific segment was fixed by Vuong’s test whose result was quite consistent with the judgment of widely used Bayesian information criterion. The numerical instabilities of B-spline models due to data gap were clearly reflected by the model selection tests, which rejected inadequate B-spline models in another numerical example. Full article
(This article belongs to the Special Issue 3D Modelling from Point Clouds: Algorithms and Methods)
Show Figures

Graphical abstract

20 pages, 11622 KiB  
Article
Downscaling of ASTER Thermal Images Based on Geographically Weighted Regression Kriging
by Osvaldo José Ribeiro Pereira, Adolpho José Melfi, Célia Regina Montes and Yves Lucas
Remote Sens. 2018, 10(4), 633; https://doi.org/10.3390/rs10040633 - 19 Apr 2018
Cited by 26 | Viewed by 4551
Abstract
The lower spatial resolution of thermal infrared (TIR) satellite images and derived land surface temperature (LST) is one of the biggest challenges in mapping temperature at a detailed map scale. An extensive range of scientific and environmental applications depend on the availability of [...] Read more.
The lower spatial resolution of thermal infrared (TIR) satellite images and derived land surface temperature (LST) is one of the biggest challenges in mapping temperature at a detailed map scale. An extensive range of scientific and environmental applications depend on the availability of fine spatial resolution temperature data. All satellite-based sensor systems that are equipped with a TIR detector depict a spatial resolution that is coarser than most of the multispectral bands of the same system. Certain studies may therefore be not feasible if applied in areas that depict a high spatial variation in temperature at small spatial scales, such as urban centers and flooded pristine areas. To solve this problem, this study applied an image downscaling method to enhance the spatial resolution of LST data by combining TIR, multispectral images, and derived data, such as Normalized Difference Vegetation Index (NDVI), according to the geographically weighted regression (GWRK) and area-to-point kriging of regressed residuals. The resulting LST images of the natural and anthropogenic urban areas of the Brazilian Pantanal are very highly correlated to the reference LST images. The approach, combining ASTER TIR with ASTER visible/infrared (VNIR) and Sentinel-2 images according to the GWRK method, performed better than all of the remaining state-of-the-art downscaling methods. Full article
(This article belongs to the Section Remote Sensing Image Processing)
Show Figures

Graphical abstract

19 pages, 6508 KiB  
Article
Woody Cover Estimates in Oklahoma and Texas Using a Multi-Sensor Calibration and Validation Approach
by Kyle A. Hartfield and Willem J. D. Van Leeuwen
Remote Sens. 2018, 10(4), 632; https://doi.org/10.3390/rs10040632 - 19 Apr 2018
Cited by 7 | Viewed by 4065
Abstract
Woody cover encroachment/expansion/conversion is a complex phenomenon that has environmental and economic impacts around the world. This research demonstrates the development of highly accurate models for estimating percent woody cover using high spatial resolution image data in combination with multi-seasonal Landsat reflectance products. [...] Read more.
Woody cover encroachment/expansion/conversion is a complex phenomenon that has environmental and economic impacts around the world. This research demonstrates the development of highly accurate models for estimating percent woody cover using high spatial resolution image data in combination with multi-seasonal Landsat reflectance products. We use a classification and regression tree (CART) approach to classify woody cover using fine resolution multispectral National Agricultural Imaging Program (NAIP) data. A continuous classification and regression tree (Cubist) ingests the aggregated woody cover classification along with the seasonal Landsat data to create a continuous woody cover model. We applied the models, derived by Cubist, across several Landsat scenes to estimate the percentage of woody plant cover, within each Landsat pixel, over a larger regional extent. We measured an average absolute error of 12.1 percent and a correlation coefficient of 0.78 for the models performed. The method of modelling percent woody cover established in this manuscript outperforms currently available woody cover estimates including Landsat Vegetation Continuous Fields (VCF), on average by 26 percent, and Web-Enabled Landsat Data (WELD) products, on average by 16 percent, for the region of interest. Current woody cover products are also limited to certain years and not available pre-2000. This manuscript describes a novel Cubist-based technique to model woody cover for any area of the world, as long as fine (~1–2 m) spatial resolution and Landsat data are available. Full article
(This article belongs to the Section Forest Remote Sensing)
Show Figures

Graphical abstract

19 pages, 3174 KiB  
Article
Icing Detection over East Asia from Geostationary Satellite Data Using Machine Learning Approaches
by Seongmun Sim, Jungho Im, Sumin Park, Haemi Park, Myoung Hwan Ahn and Pak-wai Chan
Remote Sens. 2018, 10(4), 631; https://doi.org/10.3390/rs10040631 - 19 Apr 2018
Cited by 24 | Viewed by 6054
Abstract
Even though deicing or airframe coating technologies continue to develop, aircraft icing is still one of the critical threats to aviation. While the detection of potential icing clouds has been conducted using geostationary satellite data in the US and Europe, there is not [...] Read more.
Even though deicing or airframe coating technologies continue to develop, aircraft icing is still one of the critical threats to aviation. While the detection of potential icing clouds has been conducted using geostationary satellite data in the US and Europe, there is not yet a robust model that detects potential icing areas in East Asia. In this study, we proposed machine-learning-based icing detection models using data from two geostationary satellites—the Communication, Ocean, and Meteorological Satellite (COMS) Meteorological Imager (MI) and the Himawari-8 Advanced Himawari Imager (AHI)—over Northeast Asia. Two machine learning techniques—random forest (RF) and multinomial log-linear (MLL) models—were evaluated with quality-controlled pilot reports (PIREPs) as the reference data. The machine-learning-based models were compared to the existing models through five-fold cross-validation. The RF model for COMS MI produced the best performance, resulting in a mean probability of detection (POD) of 81.8%, a mean overall accuracy (OA) of 82.1%, and mean true skill statistics (TSS) of 64.0%. One of the existing models, flight icing threat (FIT), produced relatively poor performance, providing a mean POD of 36.4%, a mean OA of 61.0, and a mean TSS of 9.7%. The Himawari-8 based models also produced performance comparable to the COMS models. However, it should be noted that very limited PIREP reference data were available especially for the Himawari-8 models, which requires further evaluation in the future with more reference data. The spatio-temporal patterns of the icing areas detected using the developed models were also visually examined using time-series satellite data. Full article
(This article belongs to the Special Issue Remote Sensing Methods and Applications for Traffic Meteorology)
Show Figures

Graphical abstract

16 pages, 10301 KiB  
Article
Vegetation Response to the 2012–2014 California Drought from GPS and Optical Measurements
by Eric E. Small, Carolyn J. Roesler and Kristine M. Larson
Remote Sens. 2018, 10(4), 630; https://doi.org/10.3390/rs10040630 - 19 Apr 2018
Cited by 15 | Viewed by 5743
Abstract
We compare microwave GPS and optical-based remote sensing observations of the vegetation response to a recent drought in California, USA. The microwave data are based on reflected GPS signals that were collected by a geodetic network. These data are sensitive to temporal variations [...] Read more.
We compare microwave GPS and optical-based remote sensing observations of the vegetation response to a recent drought in California, USA. The microwave data are based on reflected GPS signals that were collected by a geodetic network. These data are sensitive to temporal variations in vegetation water content and are made available via the Normalized Microwave Reflection Index (NMRI). NMRI data are complementary to information of plant greenness provided by the Normalized Difference Vegetation Index (NDVI). NMRI data from 146 sites in California are compared to collocated NDVI observations, over the interval of 2007–2016. This period includes a severe, three-year drought (2012–2014). We quantify the seasonal variations in vegetation state by calculating a series of phenology metrics at each site, using both NMRI and NDVI. We examine how the phenology metrics vary from year-to-year, as related to the observed fluctuations in accumulated precipitation. The amplitude of seasonal vegetation growth exhibits the greatest sensitivity to prior accumulated precipitation. Above-normal precipitation from 4 to 12 months before peak growth yields a stronger seasonal growth pulse, and vice versa. The amplitude of seasonal growth, as determined from NDVI, varies linearly with precipitation during dry years, but is largely insensitive to precipitation amount in years with above-normal precipitation. In contrast, the amplitude of seasonal growth from NMRI varies approximately linearly with precipitation across the entire range of conditions observed. The length of season is positively correlated with prior accumulated precipitation, more strongly with NDVI than NMRI. The recovery from drought was similar for a one-year (2007) and the more severe three-year drought (2012–2014). In both cases, the amplitude of growth returned to typical values in the first year with near-normal precipitation. Growing season length, only based on NDVI, was greatly reduced in 2014, the driest and final year of the three-year California drought. Full article
(This article belongs to the Section Remote Sensing in Agriculture and Vegetation)
Show Figures

Graphical abstract

19 pages, 15447 KiB  
Article
Topography and Three-Dimensional Structure Can Estimate Tree Diversity along a Tropical Elevational Gradient in Costa Rica
by Chelsea Robinson, Sassan Saatchi, David Clark, Johanna Hurtado Astaiza, Anna F. Hubel and Thomas W. Gillespie
Remote Sens. 2018, 10(4), 629; https://doi.org/10.3390/rs10040629 - 18 Apr 2018
Cited by 10 | Viewed by 5200
Abstract
This research seeks to understand how tree species richness and diversity relates to field data (1-ha plots) on forest structure (stems, basal area) and lidar derived data on topography and three-dimensional forest structure along an elevational gradient in Braulio Carrillo National Park, Costa [...] Read more.
This research seeks to understand how tree species richness and diversity relates to field data (1-ha plots) on forest structure (stems, basal area) and lidar derived data on topography and three-dimensional forest structure along an elevational gradient in Braulio Carrillo National Park, Costa Rica. In 2016 we calculated tree species richness and diversity indices for twenty 1-ha plots located along a gradient ranging from 56 to 2814 m in elevation. Field inventory data were combined with large footprint (20 m) airborne lidar data over plots in 2005, in order to quantify variations in topography and three-dimensional structure across plots and landscapes. A distinct pattern revealing an increase in species’ richness and the Shannon diversity index was observed in correlation with increasing elevation, up to about 600 m; beyond that, at higher elevations, a decrease was observed. Stem density and basal area both peaked at the 2800 m site, with a mini-peak at 600 m, and were both negatively associated with species richness and diversity. Species richness and diversity were negatively correlated with elevation, while the two tallest relative height metrics (rh100, rh75) derived from lidar were both significantly positively correlated with species richness and diversity. The best lidar-derived topographical and three-dimensional forest structural models showed a strong relationship with the Shannon diversity index (r2 = 0.941, p < 0.01), with ten predictors; conversely, the best species richness model was weaker (r2 = 0.599, p < 0.01), with two predictors. We realize that our high r² has to be interpreted with caution due to possible overfitting, since we had so few ground plots in which to develop the relationship with the numerous topographical and structural explanatory variables. However, this is still an interesting analysis, even with the issue of overfitting. To reduce issues with overfitting we used ridge regression, which acted as a regularization method, shrinking coefficients in order to decrease their variability and multicollinearity. This study is unique because it uses paired 1-ha plot and airborne lidar data over a tropical elevation gradient, and suggests potential for mapping species richness and diversity across elevational gradients in tropical montane ecosystems using topography and relative height metrics from spaceborne lidar with greater spatial coverage (e.g., GEDI). Full article
(This article belongs to the Special Issue Remote Sensing of Tropical Forest Biodiversity)
Show Figures

Graphical abstract

Previous Issue
Next Issue
Back to TopTop