Article

Spatiotemporal Evolution of Land Subsidence in the Beijing Plain 2003–2015 Using Persistent Scatterer Interferometry (PSI) with Multi-Source SAR Data

1
Base of the Key Laboratory of Urban Environmental Process and Digital Modeling, Capital Normal University, Beijing 100048, China
2
Key Laboratory of 3D Information Acquisition and Application of Ministry, Capital Normal University, Beijing 100048, China
3
College of Resource Environment and Tourism, Capital Normal University, Beijing 100048, China
4
Department of Geology & Geography, West Virginia University, Morgantown, WV 26506-6300, USA
*
Author to whom correspondence should be addressed.
Remote Sens. 2018, 10(4), 552; https://doi.org/10.3390/rs10040552
Submission received: 17 January 2018 / Revised: 20 March 2018 / Accepted: 28 March 2018 / Published: 4 April 2018
(This article belongs to the Special Issue Radar Interferometry for Geohazards)

Abstract

:
Land subsidence is one of the most important geological hazards in Beijing, China, and its scope and magnitude have been growing rapidly over the past few decades, mainly due to long-term groundwater withdrawal. Interferometric Synthetic Aperture Radar (InSAR) has been used to monitor the deformation in Beijing, but there is a lack of analysis of the long-term spatiotemporal evolution of land subsidence. This study focused on detecting and characterizing spatiotemporal changes in subsidence in the Beijing Plain by using Persistent Scatterer Interferometry (PSI) and geographic spatial analysis. Land subsidence during 2003–2015 was monitored by using ENVISAT ASAR (2003–2010), RADARSAT-2 (2011–2015) and TerraSAR-X (2010–2015) images, with results that are consistent with independent leveling measurements. The radar-based deformation velocity ranged from −136.9 to +15.2 mm/year during 2003–2010, and −149.4 to +8.9 mm/year during 2011–2015 relative to the reference point. The main subsidence areas include Chaoyang, Tongzhou, Shunyi and Changping districts, where seven subsidence bowls were observed between 2003 and 2015. Equal Fan Analysis Method (EFAM) shows that the maximum extensive direction was eastward, with a growing speed of 11.30 km2/year. Areas of differential subsidence were mostly located at the boundaries of the seven subsidence bowls, as indicated by the subsidence rate slope. Notably, the area of greatest subsidence was generally consistent with the patterns of groundwater decline in the Beijing Plain.

Graphical Abstract

1. Introduction

Widespread surface deformation caused by over-exploitation of groundwater is a worldwide geological and environmental problem [1]. The potential consequences of urban land subsidence mainly include damage to the utility infrastructures, buildings, railroads, highways and bridges [2,3,4], as well as flooding in coastal cities [5,6]. Obtaining accurate information on the spatiotemporal evolution of subsidence is important to reduce the impact of the associated hazards.
Over the past decades, surface deformation monitoring has been rapidly improved thanks to conventional methods, such as precise leveling and GPS (Global Positioning System) [7,8,9], which are, however, time consuming, point-based and lacking in fine details. Since the beginning of the new millennium, space-borne observation techniques based on Interferometric Synthetic Aperture Radar (InSAR) have been applied to measure and map subsidence. The capability of InSAR to measure ground movement over large areas with an accuracy on the order of millimeters has significantly improved knowledge of the phenomenon. As a traditional InSAR method, Differential Interferometric SAR (D-InSAR) has been effective in arid regions and sparse vegetation areas [10,11]. However, the method has challenges for monitoring subtle surface deformation due to temporal and spatial decorrelation and atmospheric disturbances [12,13].
To overcome the limitations of conventional InSAR methods, Persistent Scatterers InSAR (PSI) techniques have been presented in recent years. Ferretti et al. (2001) developed the concept of Permanent Scatterer Interferometry, and Werner et al. (2003) improved Interferometric Point Target Analysis (IPTA), which can reduce spatial and temporal decorrelation, reduce the error that occurs as a result of atmospheric delay, and enhance temporal and spatial resolution [14,15,16]. Hooper et al. (2004) proposed the Stanford Method for Persistent Scatterers (StaMPS) to identify Persistent Scatterers (PS) pixels and analyzed the phase terms, which established a PS recognition algorithm by amplitude dispersion characteristics and spatially correlated features of interferometric phase [17,18]. PSI techniques have been applied in many regions to measure time series surface deformation by resolving general problems in interferometry, e.g., the difficulties in identifying long-term stable targets, increasing the available quantity of image pixels and improving the temporal resolution of the interference [19,20,21].
Land subsidence has been documented in many major cities in the Chinese mainland, including Shanghai [22,23], Tianjin [24,25] and Xi’an [20]. Beijing, the capital of China, is one of the largest cities in China with a population of 21,520,000 people and an area of 16,410 km2. It suffers from a serious water shortage. As reported by the China Geological Survey, groundwater has accounted for more than two-thirds of Beijing’s water supply in recent decades, and groundwater withdrawals have induced a rapid increase in land subsidence [26].
Land subsidence in Beijing has been studied using a variety of monitoring techniques. Gong et al. [27] employed the PS-InSAR method to monitor land subsidence in Beijing with ENVISAT ASAR data from 2003 to 2006. Their results showed that differential subsidence is affected by the quaternary sediment thickness. Zhang et al [28] integrated a leveling survey, borehole extensometers and multilayer monitoring of groundwater to characterize the land subsidence of the Beijing Plain. The results showed that the second (64.5–82.3 m) and third (102–117 m) aquitards contributed 39% of the total subsidence. Chen et al. [29] employed ENVISAT ASAR and TerraSAR-X images to investigate land deformation in Beijing region, and they found that the maximum subsidence occurs in the eastern part of Beijing with a rate more than 100 mm/year. Li et al. [30] analyzed land subsidence in Beijing with two adjacent tracks of C-band ENVISAT ASAR data from 2003 to 2006 using the InSAR method. Their results showed that the maximum subsidence rate is 110 mm/year. Zhu et al. [31] collected land subsidence from PSI, leveling survey, hydrogeological and Landsat TM images to detect the spatial and temporal features of land subsidence, and the results indicated that subsidence is unevenly distributed, but continuously increased from 2003 to 2010. Hu et al. [32] employed the techniques of multi-temporal InSAR with C-band ENVISAT ASAR images to produce a linear deformation rate map. They found there were three large subsidence funnels in the Beijing Plain area that are separately located in the Chaoyang and Shunyi districts. Zhang et al. [33] used multiple SAR stacks to characterize subsidence in the Beijing–Tianjin–Hebei region from 1992 to 2014, but their study lacks spatiotemporal analysis of the subsidence characteristic in Beijing. Ng et al. [7] used PSI techniques with ENVISAT ASAR and ALOS PALSAR images from 2003 to 2009 to investigate the ground deformation in Beijing, and the results indicate that the vertical deformation rates were in the range of −115 mm/year to 6 mm/year.
In summary, although previous investigations have employed different methods of monitoring land subsidence in Beijing [7,27,28,29,30,31,32,33,34], few studies have investigated the spatiotemporal evolution of land subsidence in the Beijing Plain using long time series data. This work aims to improve knowledge of the land subsidence in the Beijing Plain and provide a quantitative, long-term analysis of land displacement at regional and local scales. In our study, spatiotemporal evolution of the ground displacements is quantified by the PSI technique on multi-source SAR data (ENVISAR ASAR images from 2003 to 2010, RADARSAT-2 images from 2011 to 2015 and TerraSAR-X images from 2010 to 2015). Time series deformation is analyzed together with the geological structures using Geographic Information System (GIS) spatial analysis. The expansion of the subsidence region in different directions is quantified by the Equal Fan Analysis Method (EFAM). Last, the potential causes of the ground movements, as well as potential future advances in monitoring land subsidence in the Beijing Plain, are discussed.

2. Study Area and Data Sets

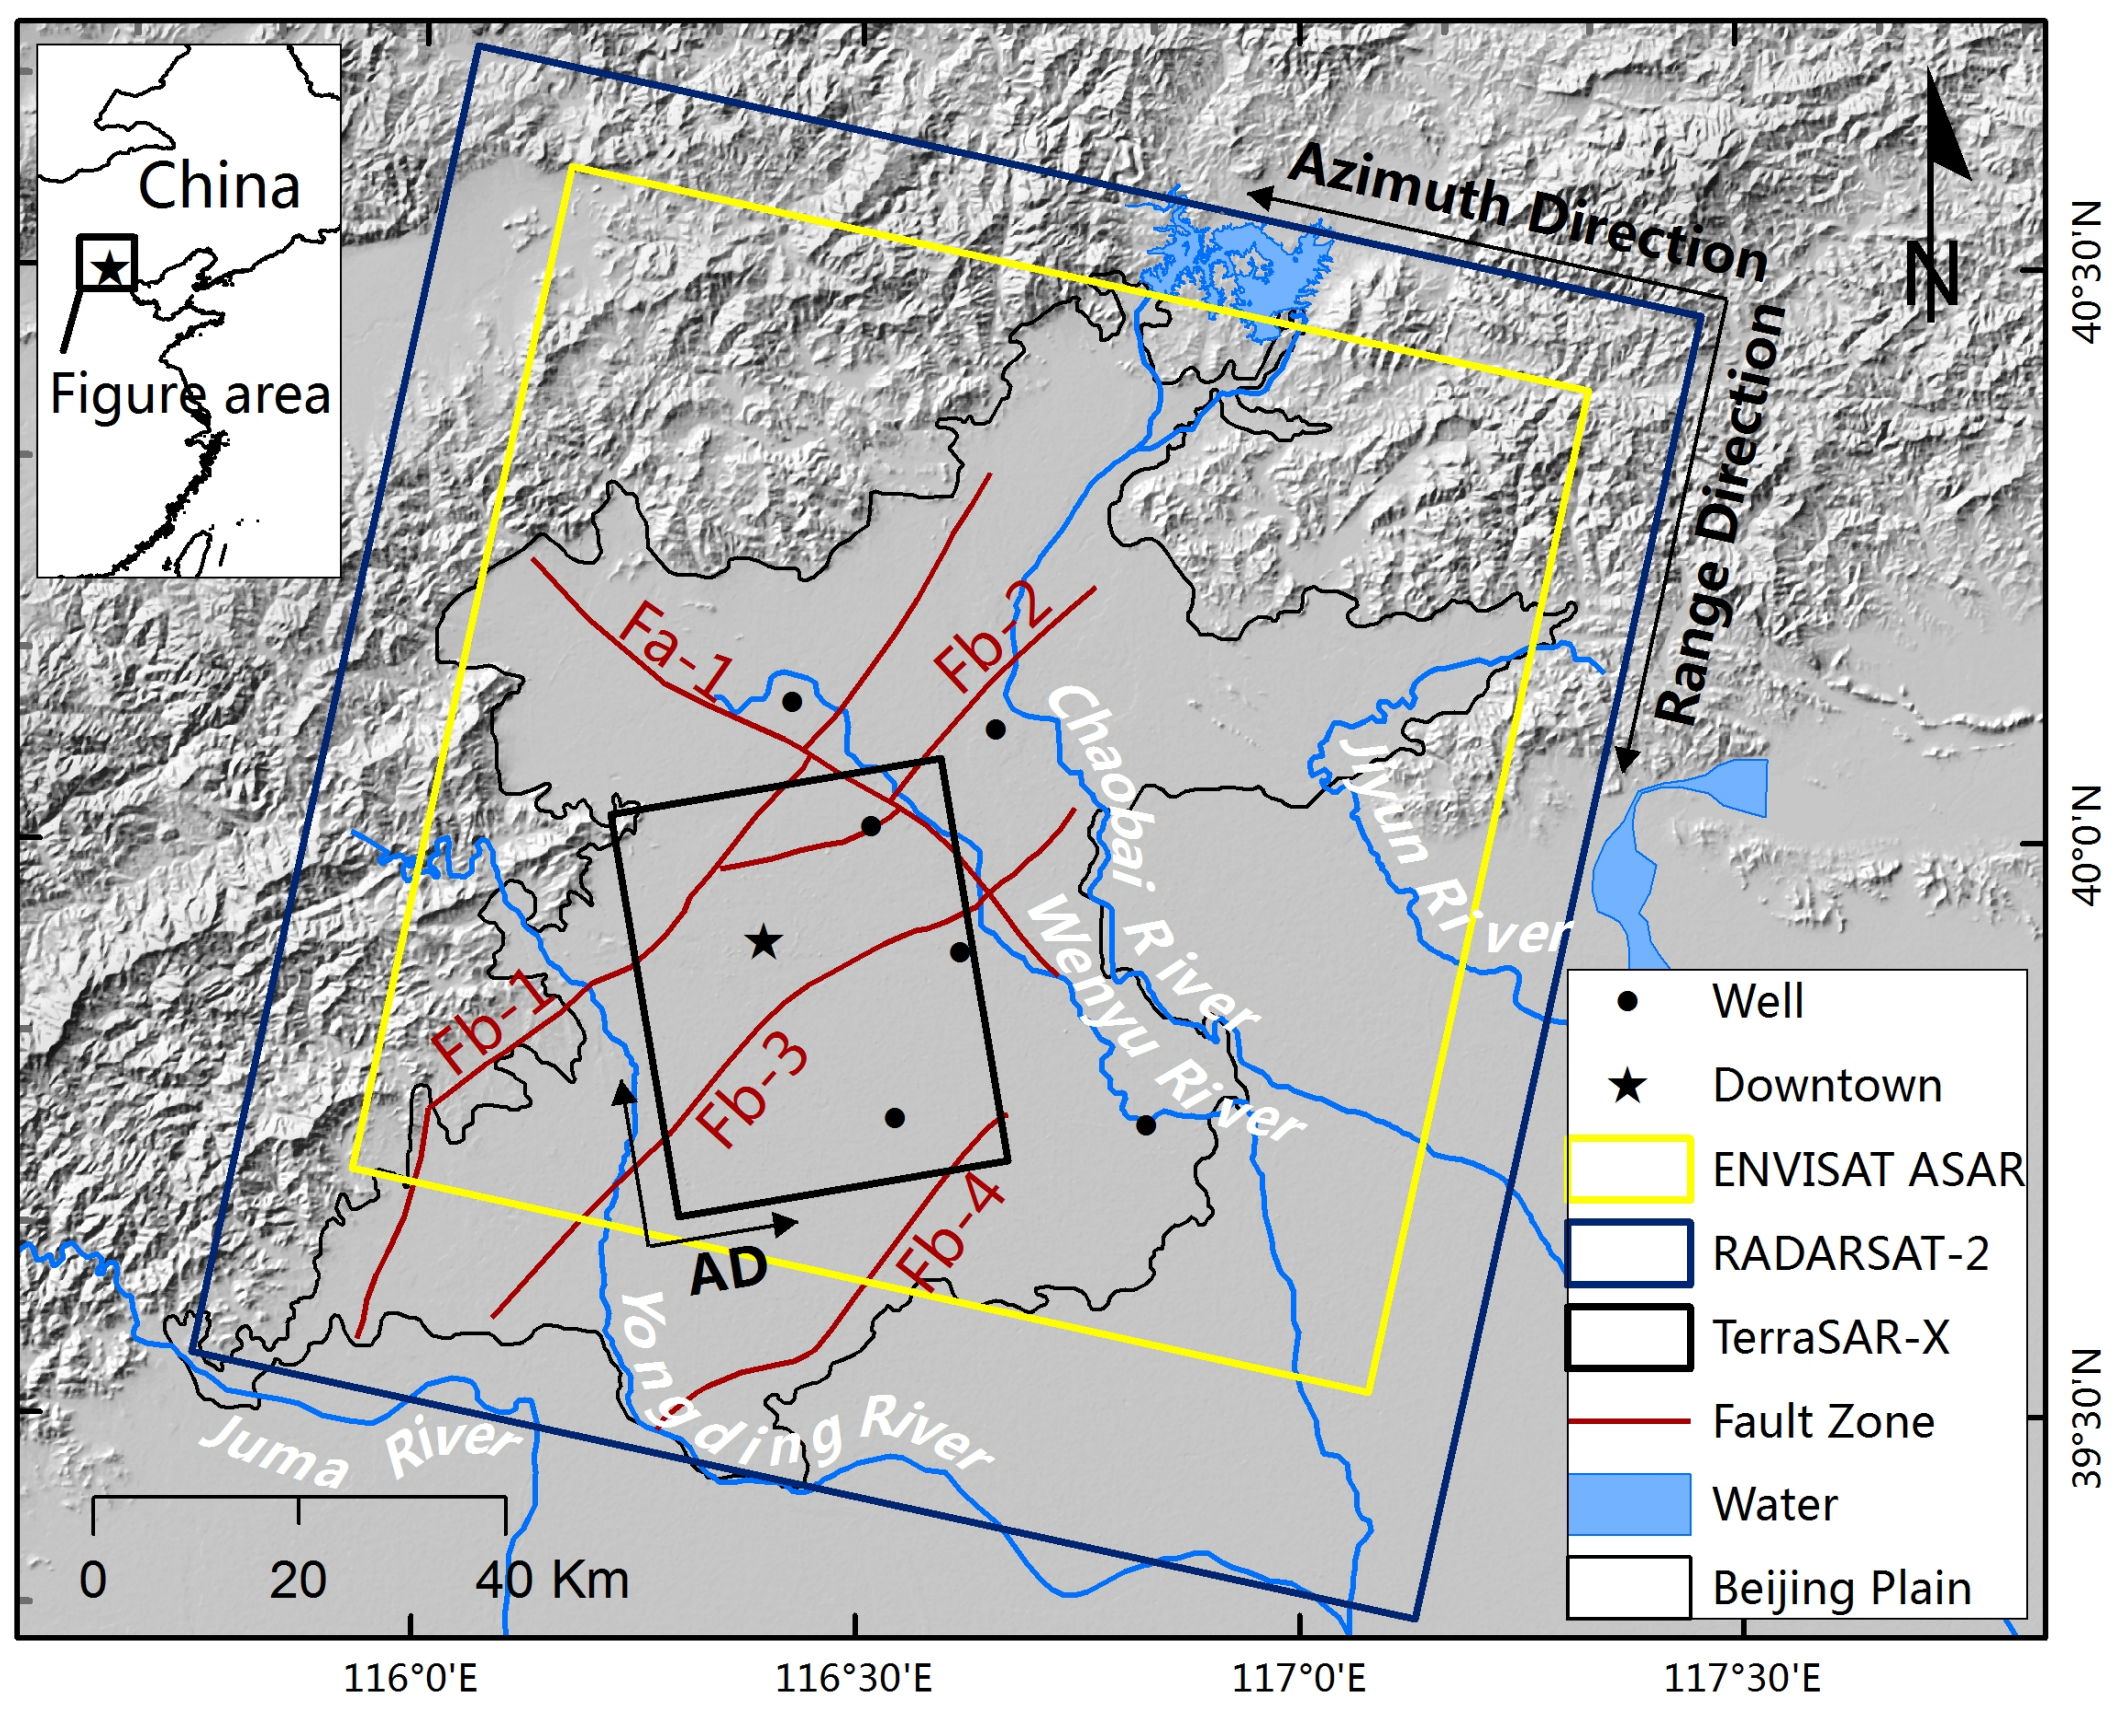
2.1. Description of the Beijing Plain

Beijing (115°25′–117°35′E and 39°28′–41°05′N) is located in the extreme northern part of the North China Plain, and is bordered by the Taihang Mountains to the west and Jundu Mountains to north and northeast. The study area includes Beijing and the surrounding plain, with a total area of approximately 6300 km2. The Beijing Plain is formed by the alluvial deposit of five rivers: Yongding, Chaobai, Wenyu, Jijun and Juma rivers, with a slight decrease in elevation from northwest to southeast. The elevations of the Beijing Plain ranges from about 20–60 m [29]. Climatically, Beijing has a monsoon-influenced semi-arid and semi-humid continental climate, characterized by high temperatures in the summer, low temperatures in the winter and abundant precipitation. The average annual precipitation is approximately 570 mm, concentrated in the summer season from June to September [35]. The thickness of quaternary deposits, with lithologies that include single gravel to multilayer structures of clay with sand interbeds and a grain-size that ranges from coarse to fine sand, varies from a few meters over the mountain-front area to hundreds of meters in the plain zone [28,31]. The basement rocks are Cambrian–Ordovician in age [28]. The North China Plain has been previously thought to be dominated in the Cenozoic by eastwest extension along north-northeast trending normal faults, creating a half-graben and host system [36]. However, recent work using GPS suggests interseismic deformation across a broad zone, about 1100 km wide, of left-lateral shear, with compensating right-lateral strike-slips along the NNE trending faults [37].
There are several active high angle normal faults in the Beijing Plain (Figure 1). The Nankou–Sunhe fault (Fa-1) is the single NW-striking active fault, which was precisely determined by shallow seismic method and drilling data [38]. The Nankou–Sunhe fault has shown both stick-slip and creep-slip characteristics, with a vertical movement rate of 0.31–0.67 mm/year in the Holocene. Huangzhuang–Gaoliying (Fb-1), Liangxiang–Shunyi (Fb-2), Nanyuan–Tongxian (Fb-3), Lixian–Niubaotun (Fb-4) faults follow a NE–SW direction. The Huangzhuang–Gaoliying fault dips to the SE with an angle of 55°–75°. The northern part of this fault is the largest, hidden and active fault in the Beijing Plain. The fault moved through the Holocene at an average rate of 0.035 mm/year [39]. Ground fissures with a throw of 15–30 cm have been observed in Beiqijia County, north of Beijing, and are assumed to be surface expressions of the Huangzhuang–Gaoliying fault [38]. The Liangxiang–Shunyi and Nanyuan–Tongxian faults dip to NW with an angle of 60°~80° and 50°~75°, respectively [40,41]. The northern part of the later fault is active fault which the rate of neotectonic activity is around 0.75 mm/year [42]. Overall, the Beijing Plain is generally divided into elongated areas by these active faults.

2.2. Datasets Used

Ground movements were measured with multi-source spaceborne SAR datasets: 48 C-band ENVISAT-ASAR, 40 C-band RADARSAT-2 and 51 X-band TerraSAR-X images, all collected in stripmap mode. The ENVISAT-ASAR images were acquired between 10 December 2003 and 7 August 2010. The RADARSAT-2 images were collected from 22 November 2010 to 14 December 2015. The TerraSAR-X images collected from 13 April 2010 to 11 December 2015. ENVISAT-ASAR and RADARSAT-2 data were used to monitor the land deformation information during 2003 to 2015, and the TerraSAR-X data were used to cross-validate the results. The coverage of the SAR images is shown in Figure 1. Additional more parameters of the SAR datasets are summarized in Table 1.
The DORIS precise orbit state vectors of the ENVISAT-ASAR images were provided by the European Space Research Institute Help Desk of the United Space in Europe (ESA), and used to calculate the initial estimation of interferometric baselines. Shuttle Radar Topography Mission (SRTM) DEM with a spatial resolution of 90 m is used to remove the topographic phase and geocode interferograms. The groundwater level contours was provided by Beijing Water Authority, which is used for comparing the relationship between groundwater and the subsidence.

3. PSI Methods and Data Processing

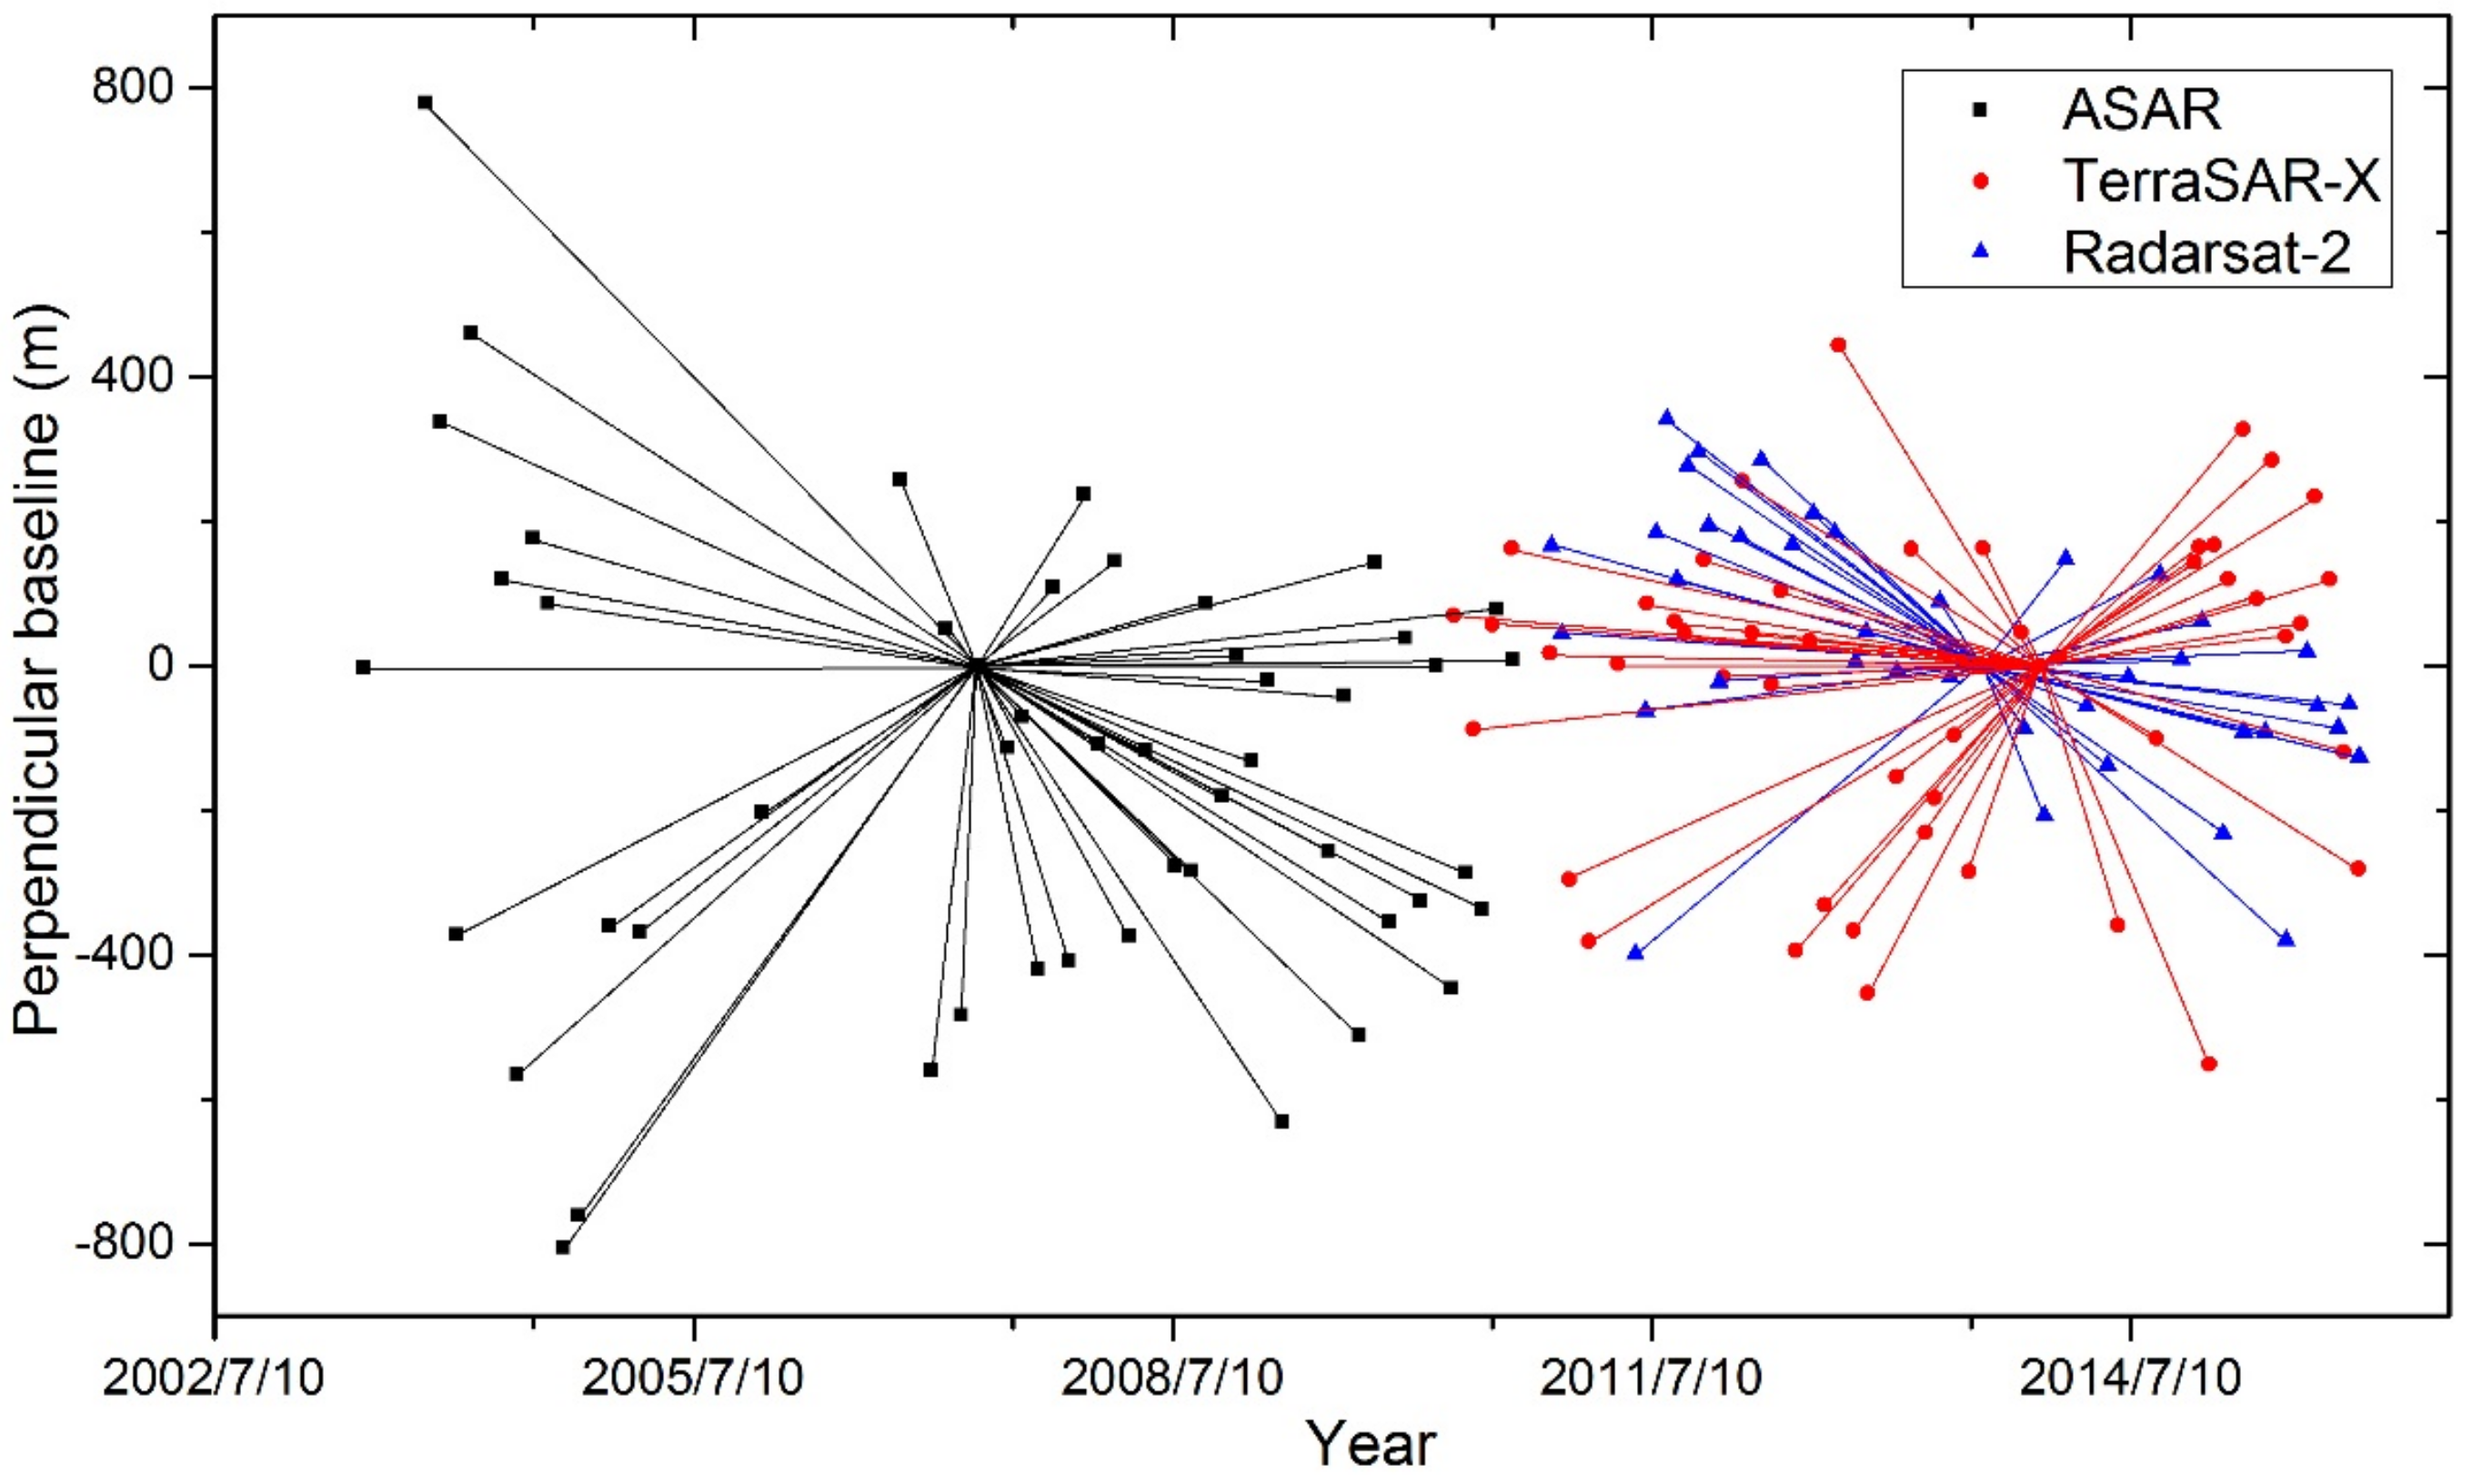
3.1. Selection of the Master Image and Co-Registration

The PSI technique employs a unique public master image for obtaining the interferometric phase. The choice of the best public master image from the multi-temporal images is important. The first procedure is to order the images by date of acquisition. Then, one image is selected as the unique master image, while the other images are used as the slave images. To guarantee the resulting quality of the interferograms, we select the optimal master image by maximizing the Joint Correlation Index (JCI) [43] of all the images, based on:
ρ m = 1 N k = 1 N c ( B k , m , B c ) c ( T k , m , T c ) c ( f D C k , m , f c ) ,
where the function c is defined as
c ( x , a ) = { 1 | x | a ( x < a ) 0 ( x a ) .
In Equation (1), ρ m denotes the JCI value when m is used as the master image, B k , m , T k , m and f D C k , m mean the Spatial Baseline (SB), the Temporal Baseline (TB) and the Doppler Centroid Difference (DCD) respectively between the image k and image m . In Equation (2), a denotes the evaluation index of SB, TB or DCD. We set the maximum SB, TB and DCD of all the interferograms as their respective critical values. We assumed every image can be the master image and calculated all of the JCI values by Equation (1).
The image corresponding to the maximum JCI value was chosen as the optimal master image. By using this method the images acquired on 27 June 2007 (ENVISAT ASAR), 2 August 2013 (RADARSAT-2) and 15 December 2013 (TerraSAR-X) were chosen as the master images.
The accurate co-registration of SAR imagery is a key prerequisite for any change detection; all the SAR images have to be co-registered into the same space with sub-pixel accuracy. With precise orbits and reference DEM data, the slave SAR images were co-registered on sampling grids of the selected master image by maximizing correlation of amplitude data between SAR acquisitions.

3.2. Interferogram Formation and PS Pixel Identification

In our study, the interferograms were generated from single-look complex (SLC) by using Delft Object-oriented Radar Interferometric Software (DORIS). The temporal and perpendicular baselines of the interferograms are shown in Figure 2. Then we used the 90 m resolution SRTM DEM to remove the topographic phase contribution from the interferometric phase and geocode the interferograms.
PSI techniques identify Permanent Scatterers (PS) based on the amplitude dispersion index of radar signals. Obtaining sufficiently large amount of PS pixels is critical to the success of this method. We used the software StaMPS/MTI (Stanford Method for Persistent Scatterers/Multi-Temporal InSAR) to identify PS pixels and extract deformation information [18]. StaMPS/MTI methods identify the PS candidates using the amplitude dispersion index (ADI):
D A = σ A μ A .
In Equation (3), D A is the ADI, σ A and μ A are the standard deviation (SD) and the mean of a series of amplitude values. In general, a threshold value of D A is adopted for potential PS candidates, and the number of PS candidates increases with the threshold value. Generally an ADI value of 0.4 or higher is chosen, as a higher threshold is better. In this study, we adopted D A with a value of 0.5 to generate the largest set of PS candidate pixels and guarantee the quality of them [44]. Then PS pixels were selected from the PS candidate pixels based on the noise levels.
The phase ϕ x , i of the x t h pixel in the i t h topographically corrected interferogram can be expressed as the sum of the phase changes due to surface deformation in the satellite line-of-sight (LOS) direction ϕ d e f , x , i , the atmosphere delay ϕ a t m , x , i , the residual phase due to orbit inaccuracies ϕ o r b , x , i , look angle error ϕ ε , x , i , and the noise term due to variability in scattering, thermal noise, co-registration errors uncertainty in the position of the phase center in azimuth ϕ n , x , i [18].
ϕ x , i = ϕ d e f , x , i + ϕ a t m , x , i + ϕ o r b , x , i + ϕ ε , x , i + ϕ n , x , i .
Using the error characteristics of the individual terms in Equation (4), a measure of the variation of the residual phase for a pixel γ as is defined:
γ x = 1 N | i = 1 N exp { 1 ( ϕ x , i ϕ ~ x , i ϕ ε , x , i ) } | .
In Equation (5), N is the number of the interferograms, ϕ ~ x , i is a wrapped estimate of the spatially correlated parts of each of the terms on the right side of Equation (5) and ϕ ε , x , i denotes the spatially uncorrelated part of ϕ ε , x , i . Through spatial–temporal filtering, long-wavelength atmospheric effects and orbit error are removed.

3.3. Phase Unwrapping and Time-Series Deformation Retrieval

Spatial phase unwrapping was applied to recover unambiguous phase values. In order to unwrap correctly, the spatially uncorrelated contribution needs to be subtracted before unwrapping. We use the statistical-cost approach to unwrapping unambiguous phase values [45]. The spatial and temporal band pass filtering was applied to remove the spatially correlated contributions. Finally, the displacement time series for each PS pixel was obtained by least-squares inversion. Time series deformation for each PS pixel was calibrated to a presumably stable reference point.

4. Results and Spatial Analysis

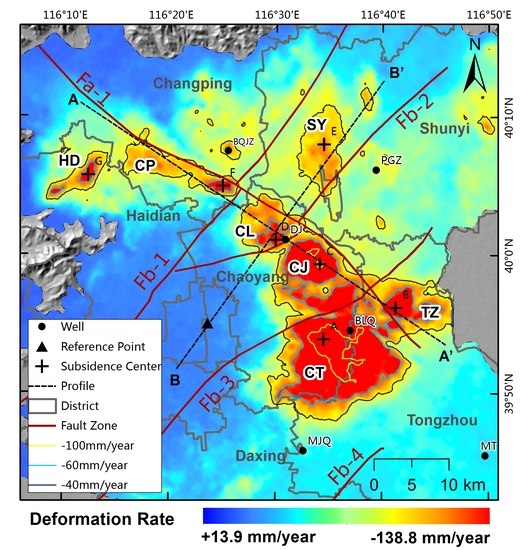
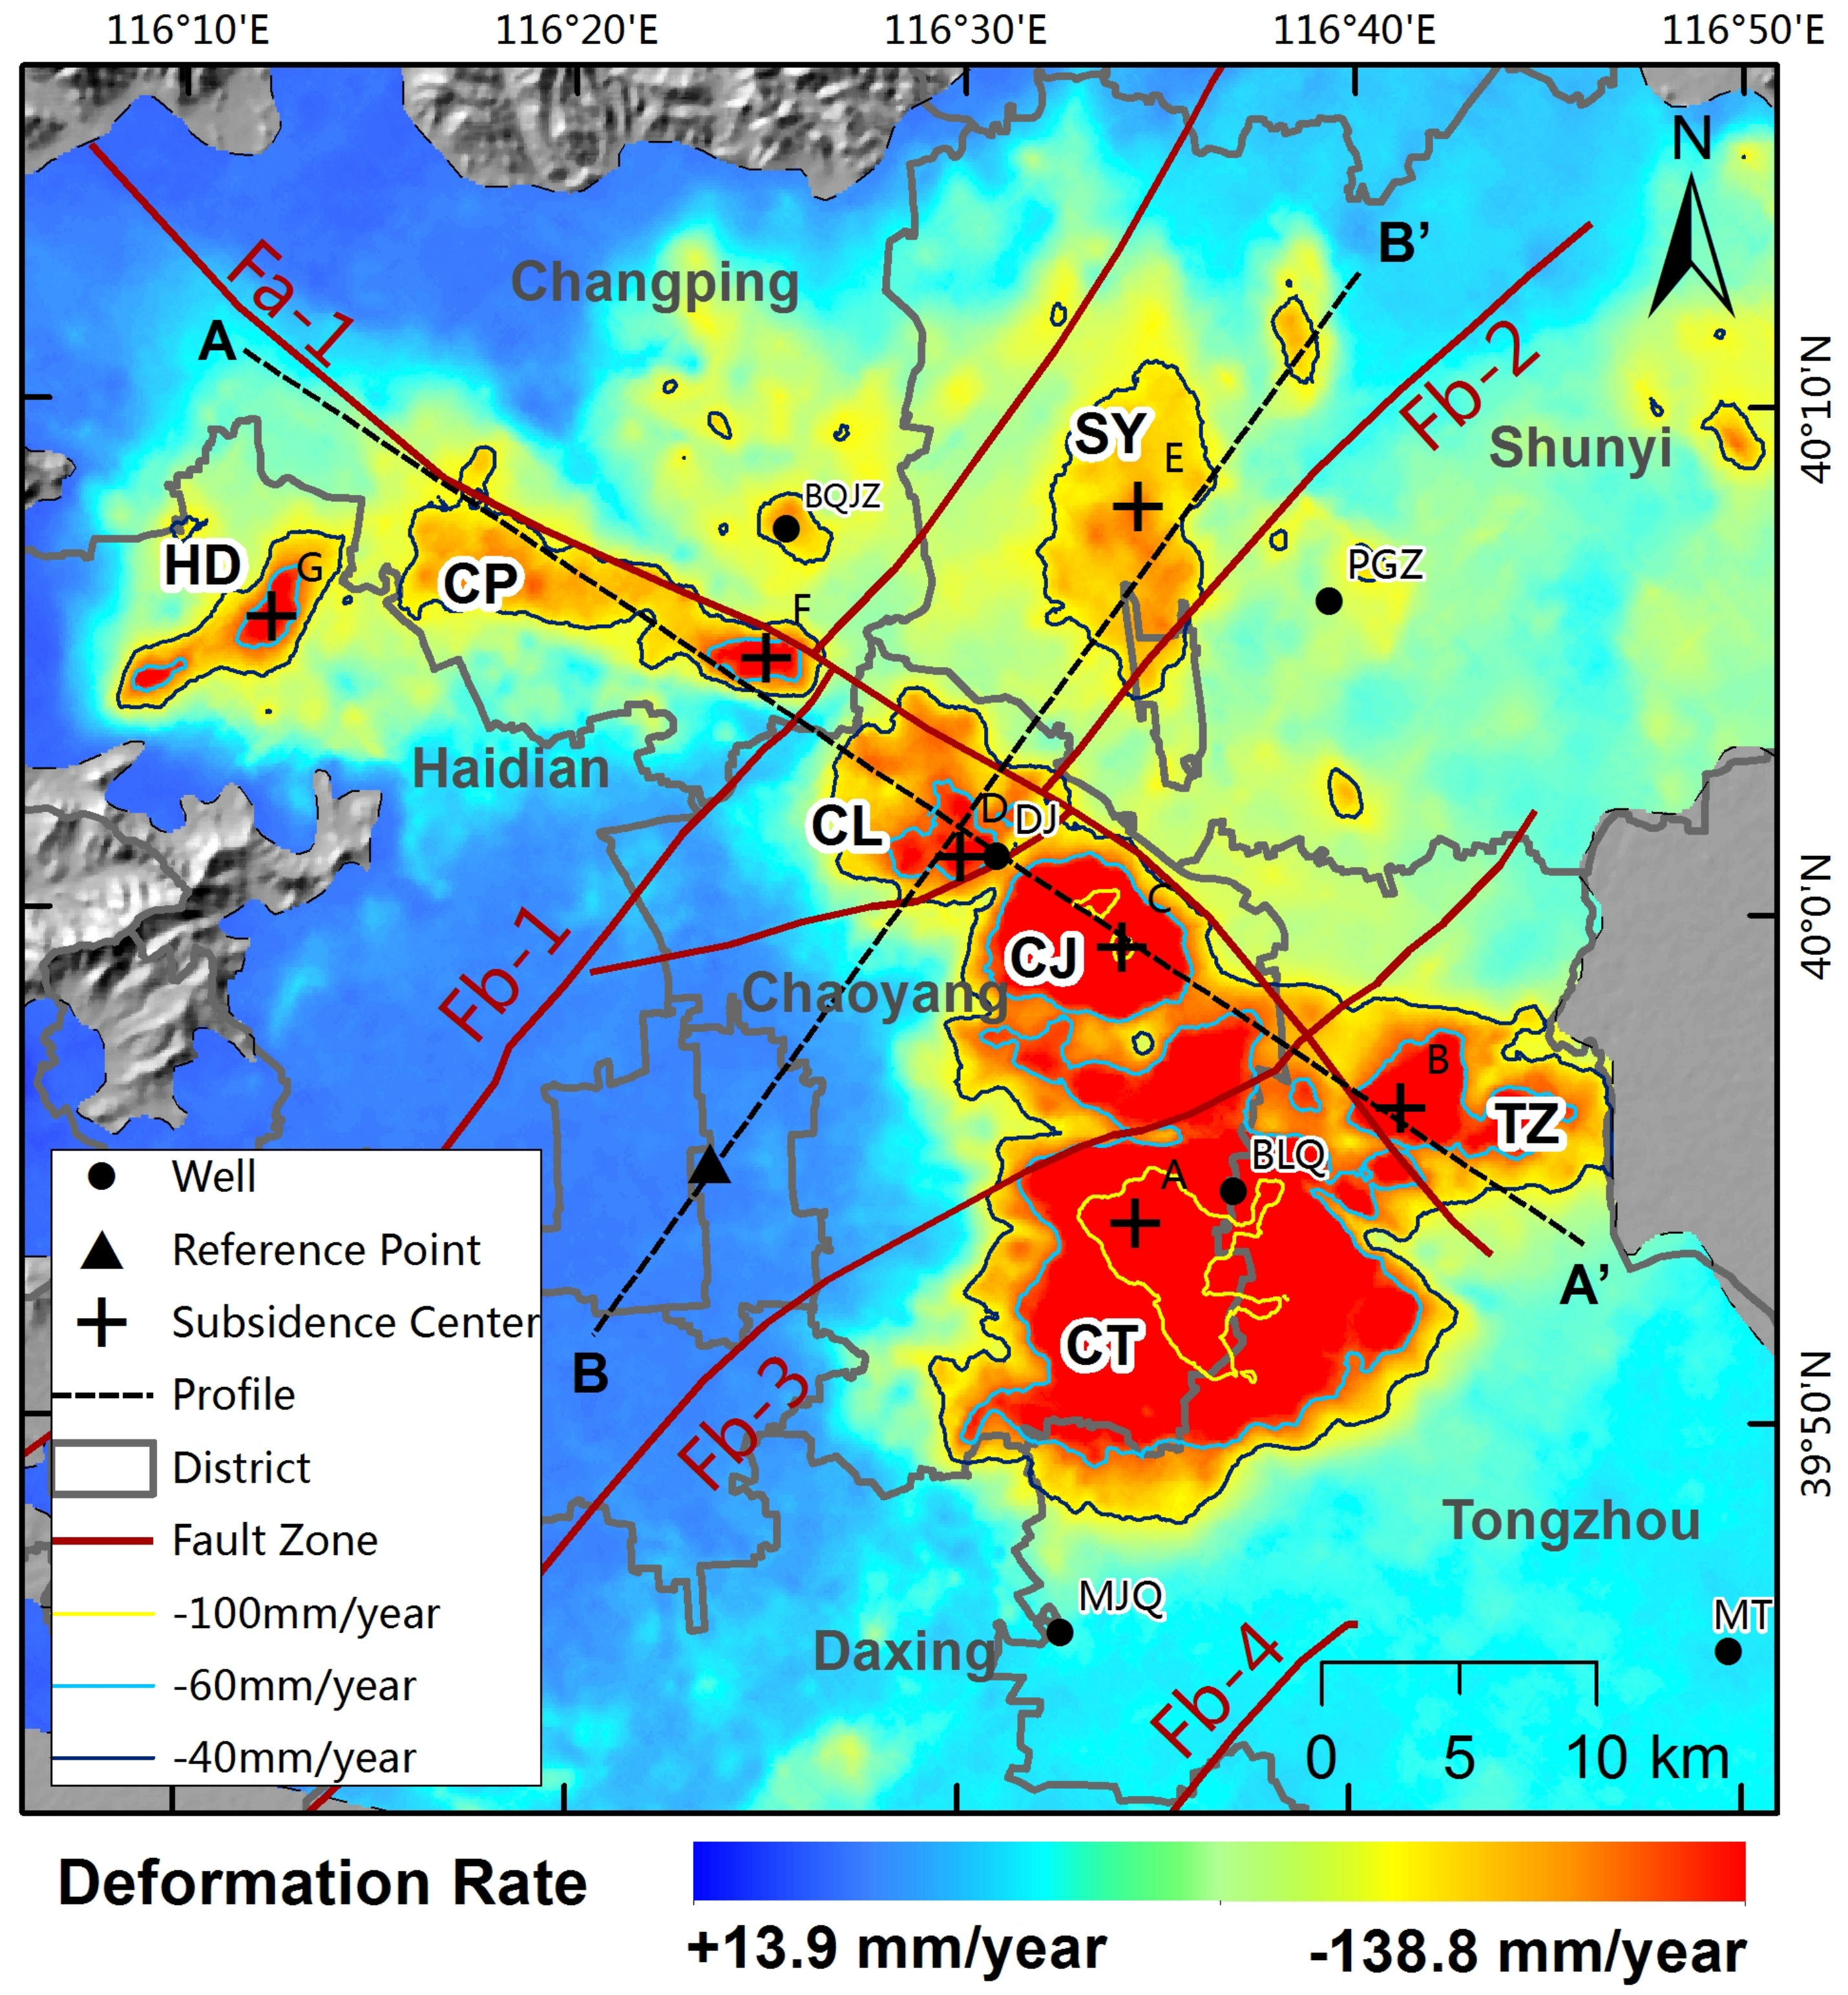
4.1. PSI-Derived Results

The three sets of SAR images were processed by PSI methods and the deformation of the Beijing Plain over the three time periods was calculated. The numbers of PS pixels obtained over the study area were 329,675 for the ENVISAT ASAR images, 773,905 for the TerraSAR-X images and 377,213 for the RADARSAT-2 images. The mean deformation velocity mosaic of the three time spans is shown in Figure 3, respectively. In order to generate a long period information of cumulative deformation, the deformation rate in LOS has been projected into the up–down direction as subsidence rate by Equation (6) [33]:
υ u d ( x , y ) = υ L O S ( x , y ) / cos θ ( x , y ) .
In Equation (6), υ u d ( x , y ) represents the up–down subsidence rate, υ L O S ( x , y ) is SAR LOS deformation rate, θ ( x , y ) is SAR viewing angle at position (x, y). Of course, this is only under the ideal condition that the ground just have the deformation of uplift or subsidence. For this study, this assumption is reasonable, as the main deformations in the Beijing Plain are ground subsidence and uplift [46].
The average deformation velocity ranges from −136.9 to +15.2 mm/year from 2003 to 2010 detected by ENVISAT ASAR (Figure 3a), −149.4 to +8.9 mm/year during 2011 to 2015 by RADARSAT-2 (Figure 3b), and −154.7 to 21.4 mm/year during 2010 to 2015 by TerraSAR (Figure 3c). All of the deformation results are relative to the same reference point, which is located at the Tiananmen Square (116.394°E, 39.917°N). It is clear that the main subsidence area is distributed in the east and north parts of the Beijing Plain.
As the locations of the PS pixels generally cannot be exactly the same between ENVISAT ASAR and RADARSAT-2 results, we use Kriging to interpolate all of the discrete PS points into raster images [44]. As the ENVISAT ASAR and RADARSAT-2 SAR images are limited, there is a small time gap (about several months) between the two data sets. We ignored the deformation during the gap in calculating the cumulative deformation. For this study, this assumption is reasonable, because the gap is very short compared to the entire range of analyzed years (2003–2015). Through raster processing, we calculated cumulative deformation from 2003 to 2015 (Figure 12). It is clear that land subsidence occurred across most of the Beijing Plain, increasing in extent and depth in every year during this period, from 2003 to 2015. In the year of 2015, the maximum cumulative subsidence in the Beijing Plain was already more than 1500 mm. From the maximum cumulative subsidence of each year, we can see that there was a gradual acceleration of the deformation rates in the analyzed years.

4.2. The Validation of the PSI Results

There are many methods to validate the deformation results detected from PSI, such as GPS, leveling [47], field photos of ground/building cracks and the estimated heights [48,49]. Considering the limited available data, we chose the leveling measurements and cross-validation of different SAR results to evaluate the quality of the results from PSI.

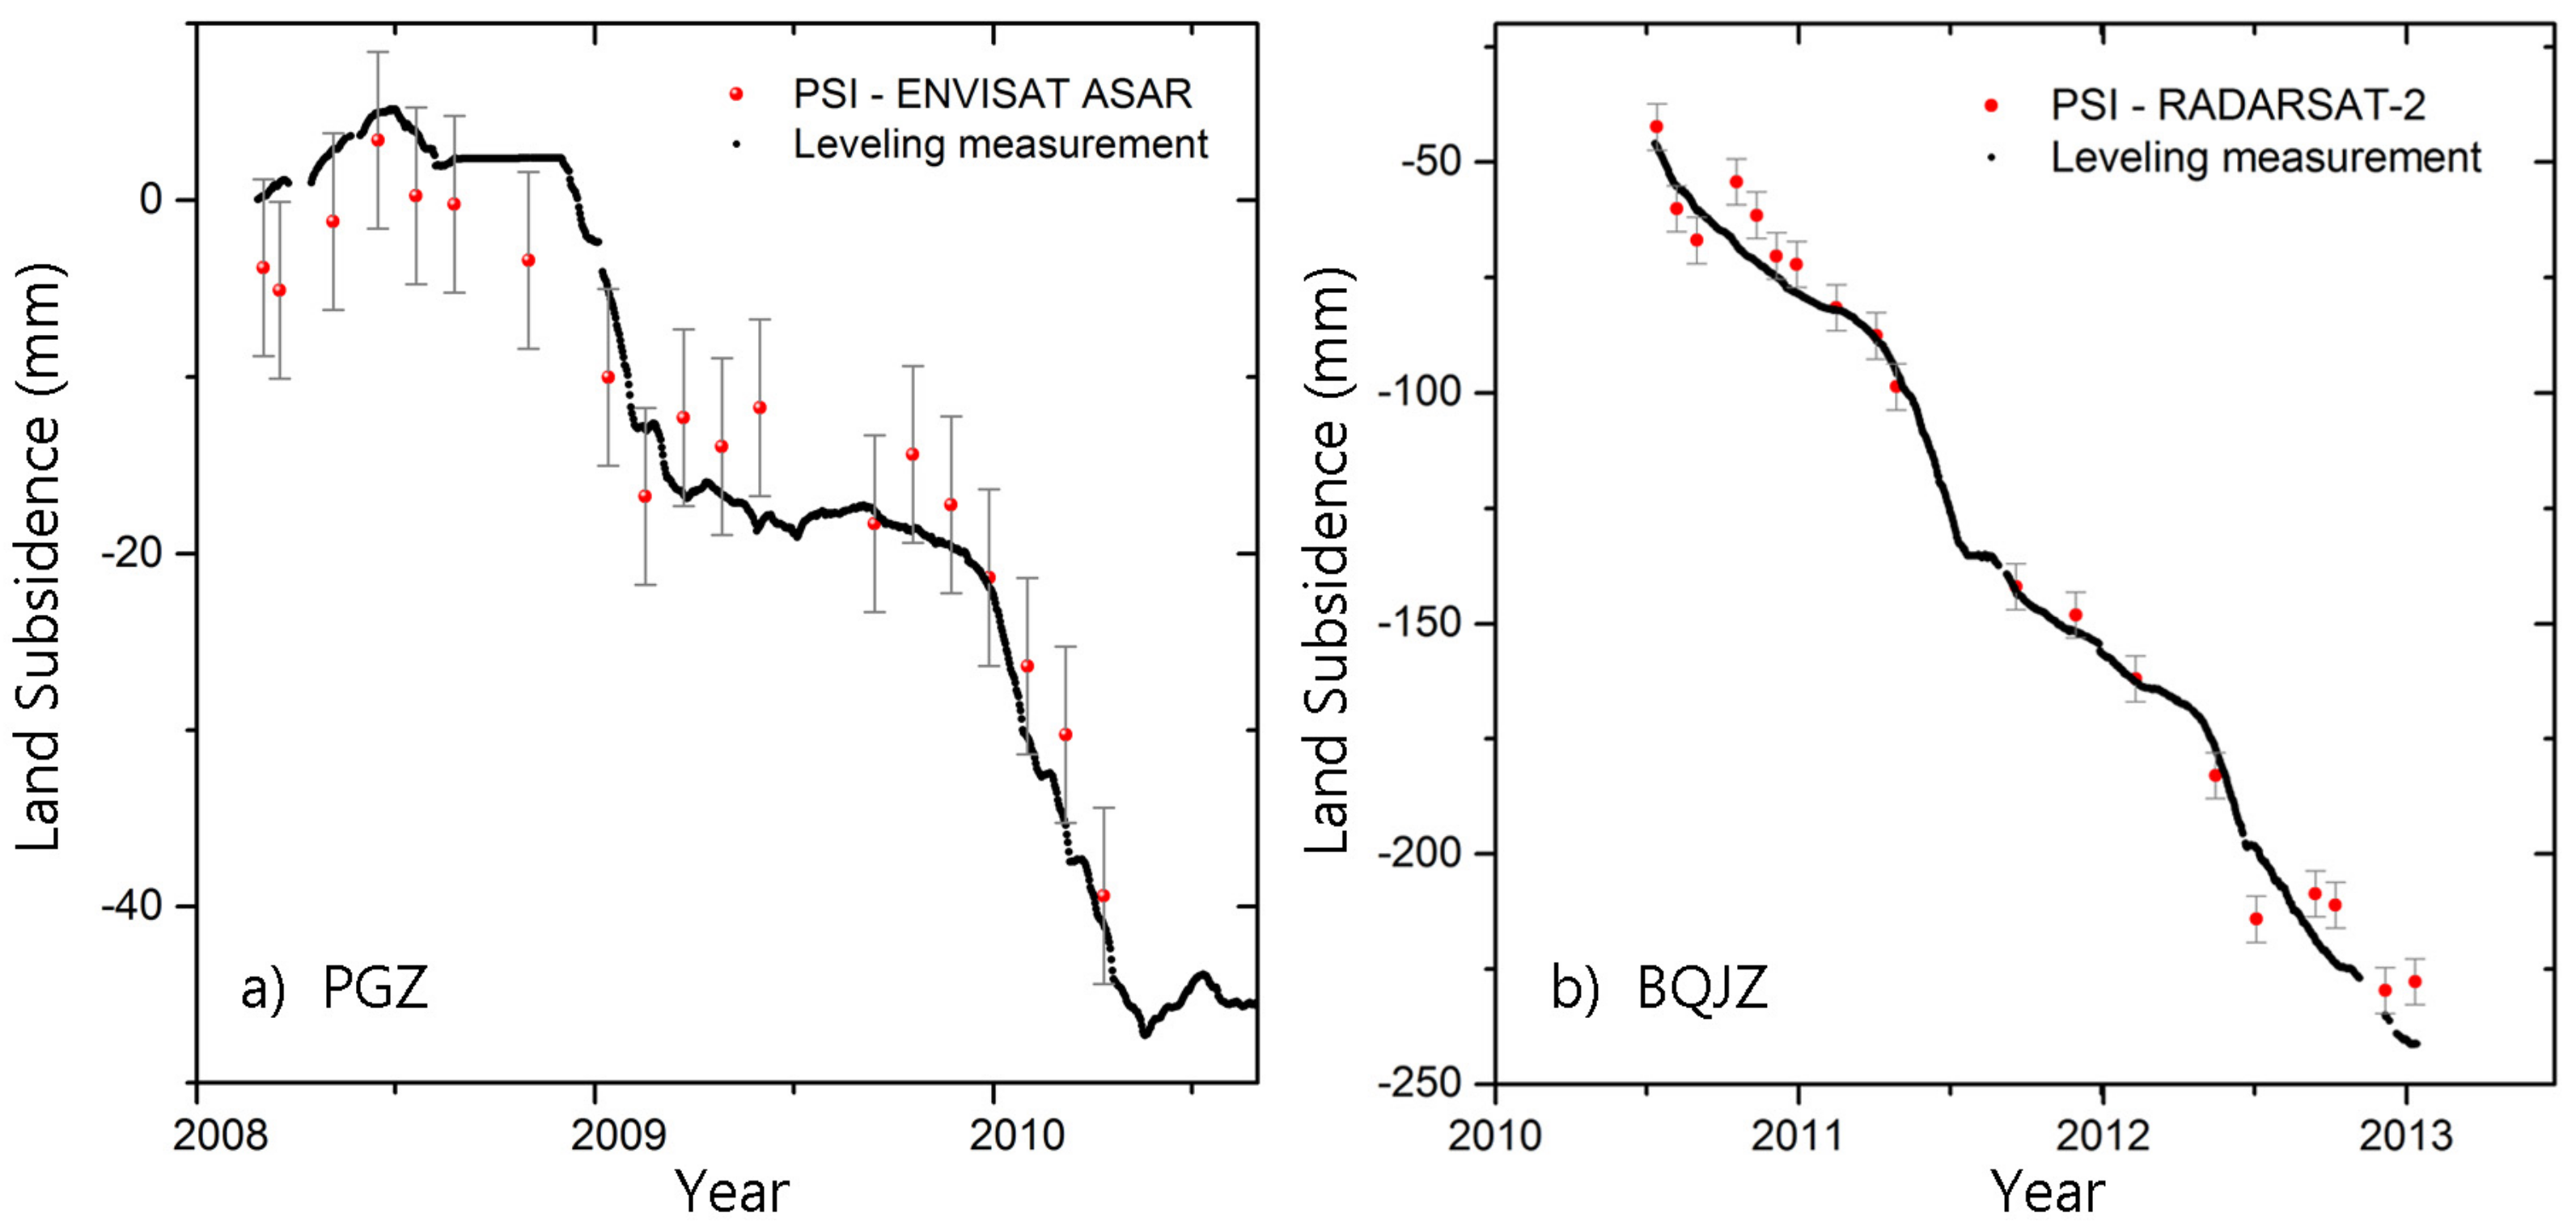
4.2.1. Comparison between PSI and Leveling Measurements

We compared the time series of deformation from PSI and leveling measurements at Pinggezhuang station (PGZ) and Beiqijiazhen (BQJZ). We chose the nearest PS point of each leveling station for the comparison. Unfortunately, at PGZ there are only leveling measurements from 2008 to 2010 and at BQJZ from 2011 to 2013 (Figure 4). Although a single, long time series data set to cover the whole time span studied is not available, the measured deformation from PSI and Leveling techniques are in general agreement. The difference between the two methods are almost smaller than ±5 mm at most points, and the standard deviation of the difference of ENVISAT ASAR and leveling, RADARSAT-2 and leveling are 3.99 and 6.45, respectively, which indicates that the PSI results are reliable and can meets the accuracy requirements for ground deformation monitoring.

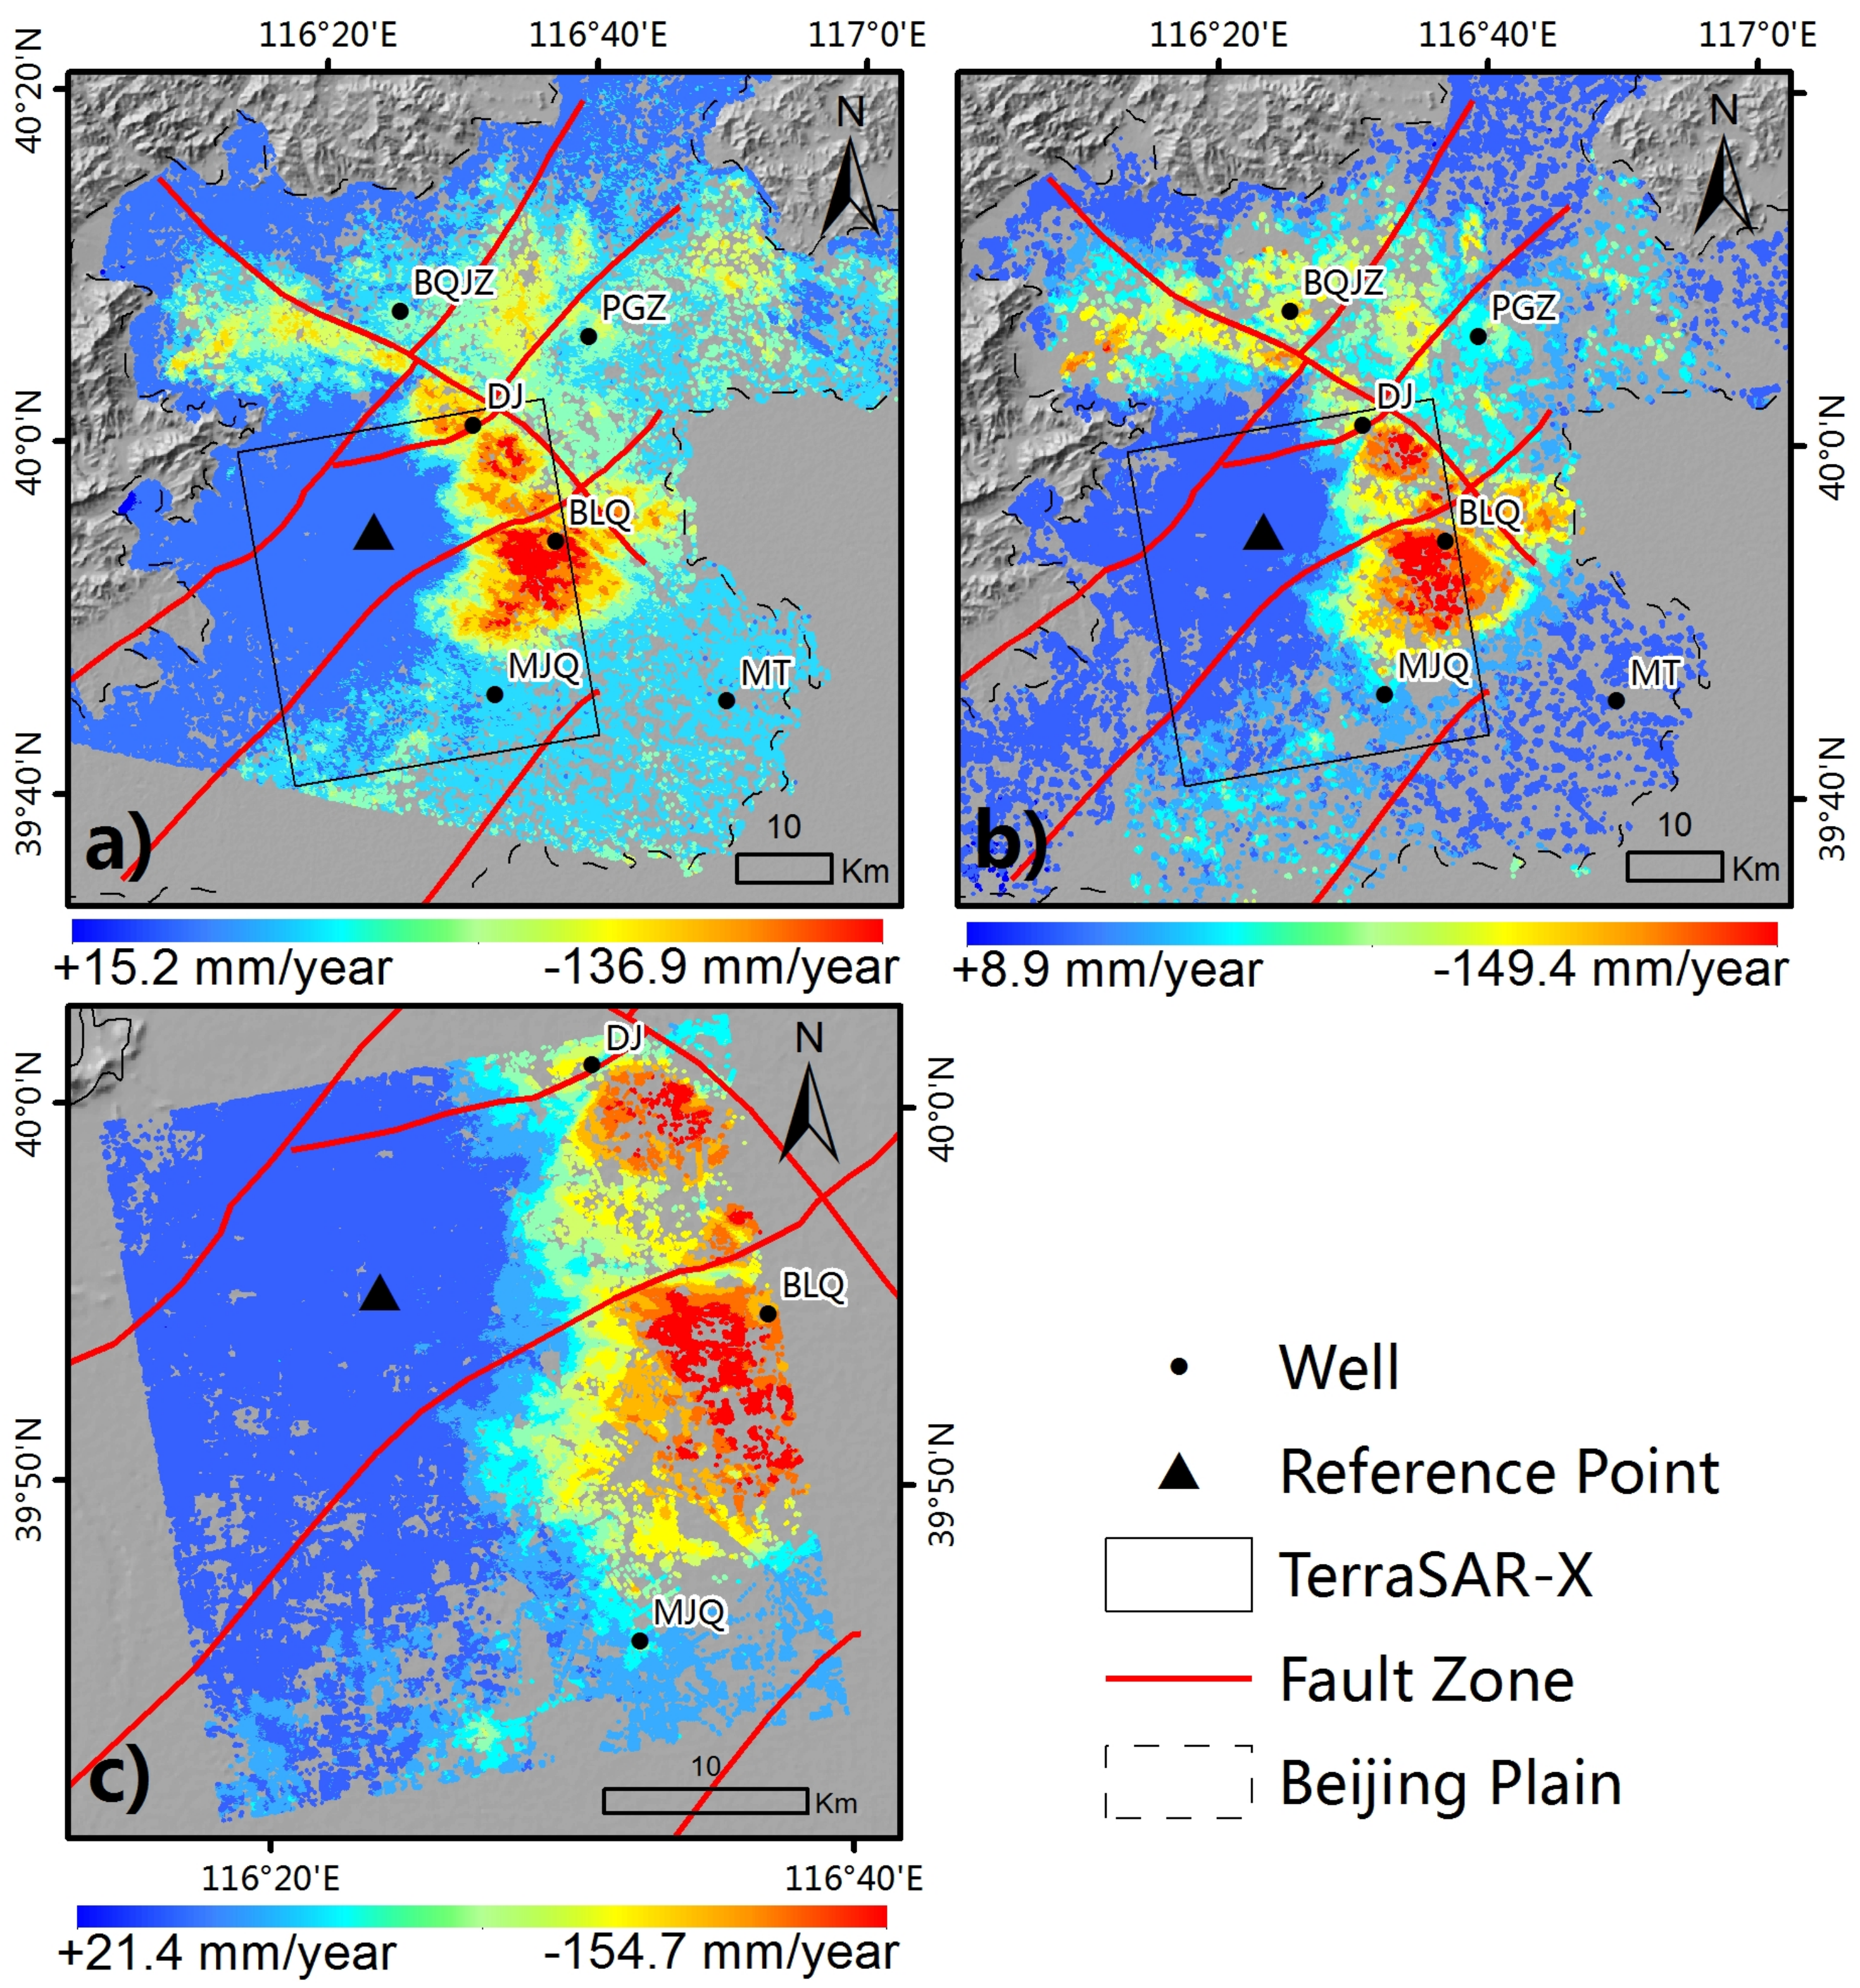
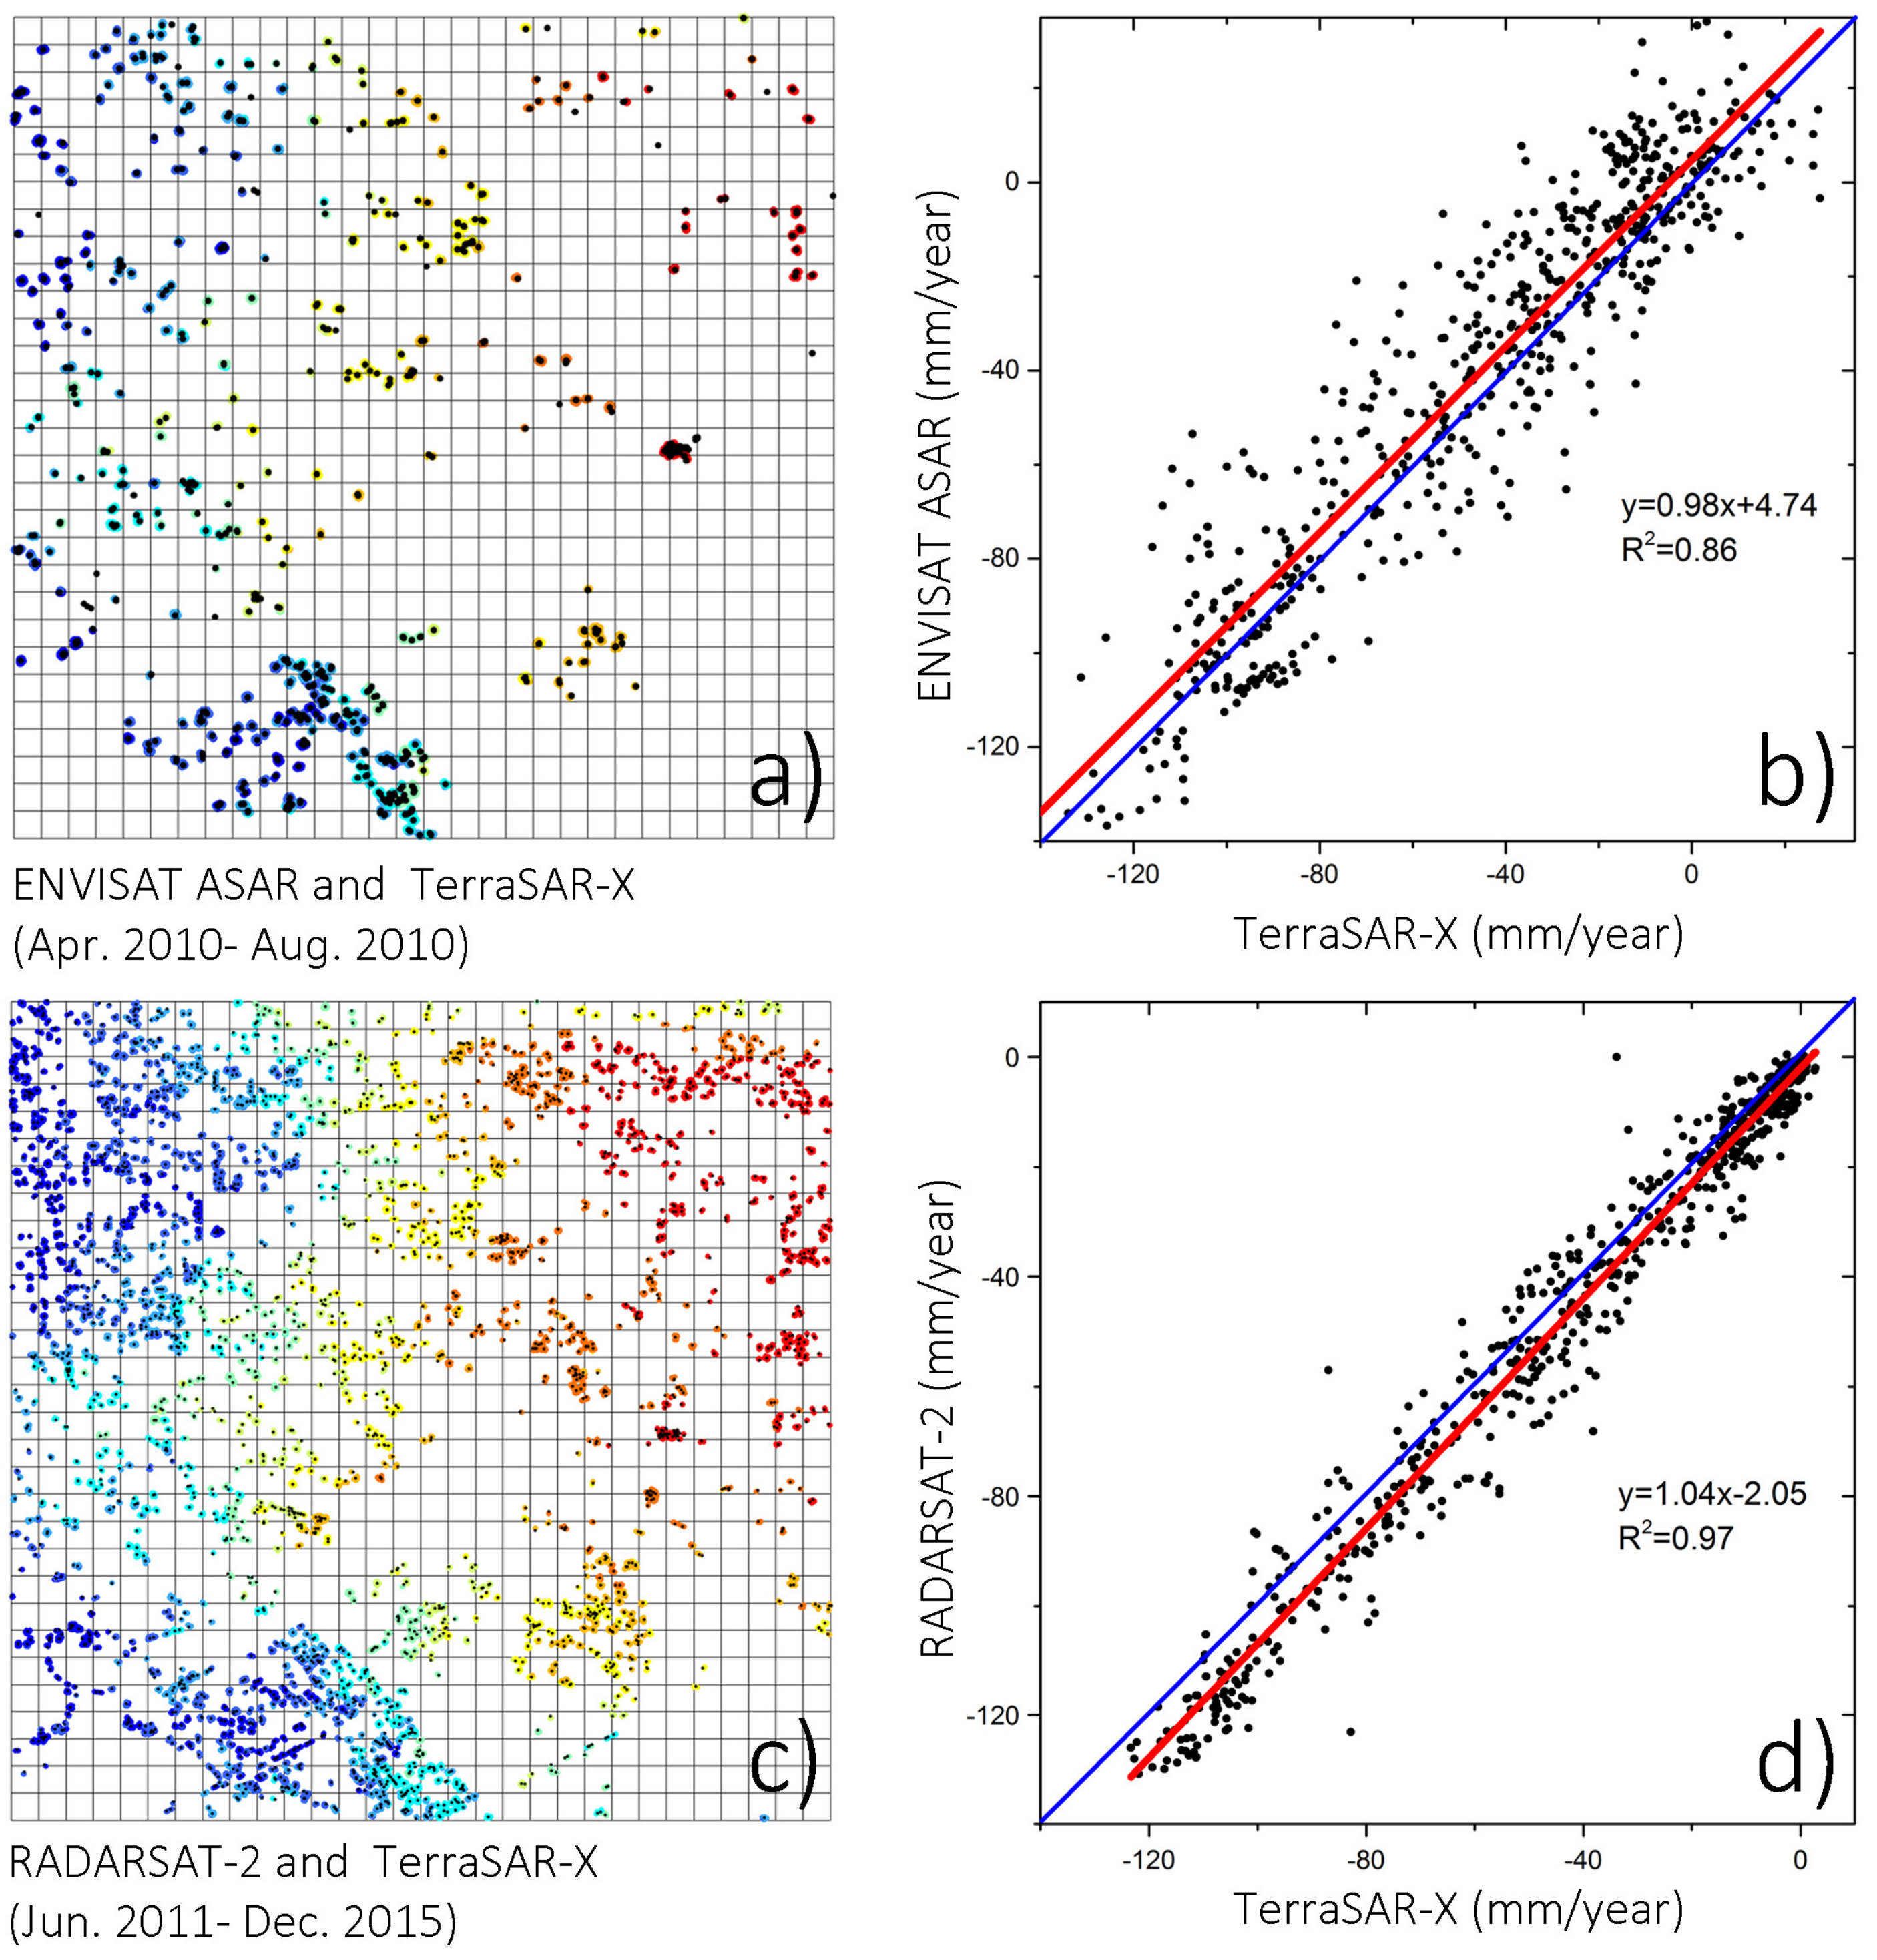
4.2.2. Cross-Validation between Different SAR Results

The PSI outcomes of ENVISAT ASAR and RADARSAT-2 were also validated by statistically comparing the results of TerraSAR-X in the area the two data sets intersect. Because the position of PS from different SAR data sets are generally not located at the same point, we firstly select ASAR and RADARSAT-2 PS points by using a regular grid, where the size of each numbered grid cell is about 500 × 500 m. As the resolution of TerraSAR-X is three meters, there are many TerraSAR-X PS points near the PS points of ASAR or RADARSAT-2. In this study, only the nearest TerraSAR-X PS target of each PS target from ASAR or RADARSAT-2 is chosen for the comparison. After this initial selection, there are 727 PS pairs of ASAR and TerraSAR-X PS points (Figure 5a), as well as 875 PS pairs of RADARSAT-2 and TerraSAR-X PS points (Figure 5c) marked in the grid. The resulting statistical analysis shows there is high correlation between the PSI outcomes from ASAR and TerraSAR-X PS points (Figure 5b), as well as RADARSAT-2 and TerraSAR-X PS points (Figure 5d) during their common time period.
The R-squared of the regression line between ENVISAT ASAR and TerraSAR-X, and the regression line between RADARSAT2 and TerraSAR-X, is 0.86 and 0.97 respectively. The overall good agreement of the results from the different SAR data sets indicates that it is appropriate to use PSI derived subsidence rates from ENVISAT ASAR and RADARSAT-2 for further analysis.

5. Discussion

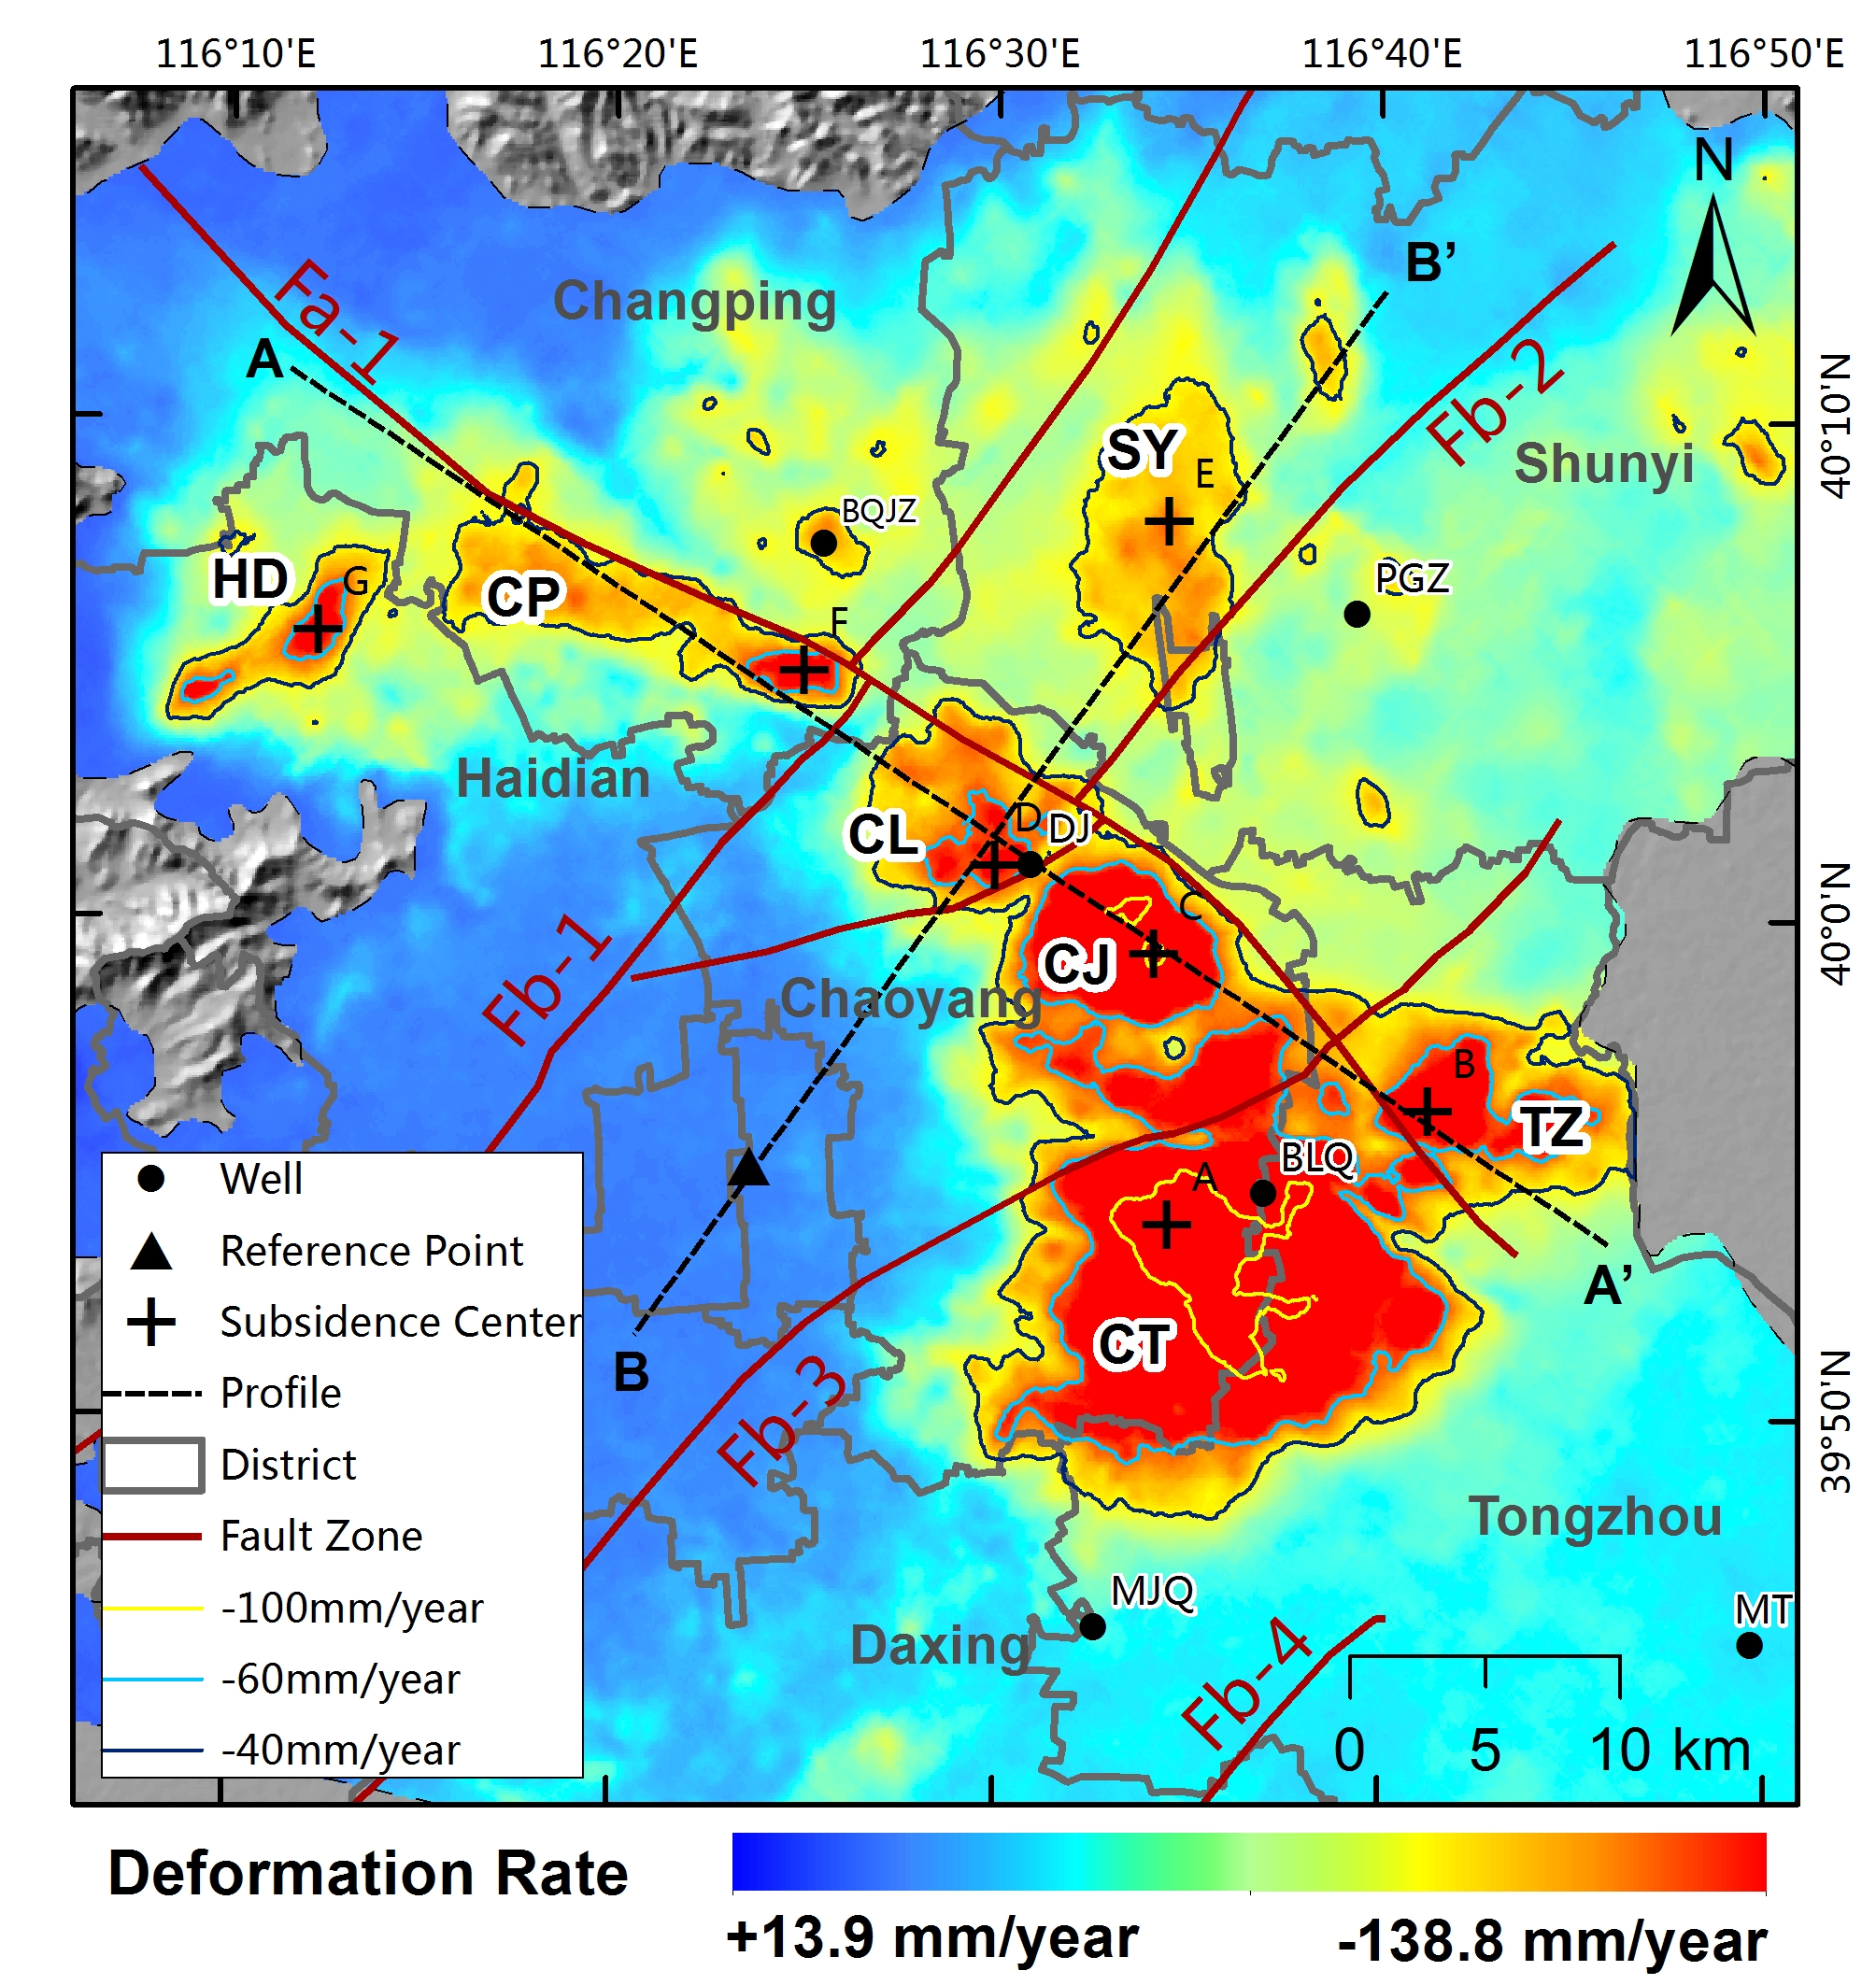
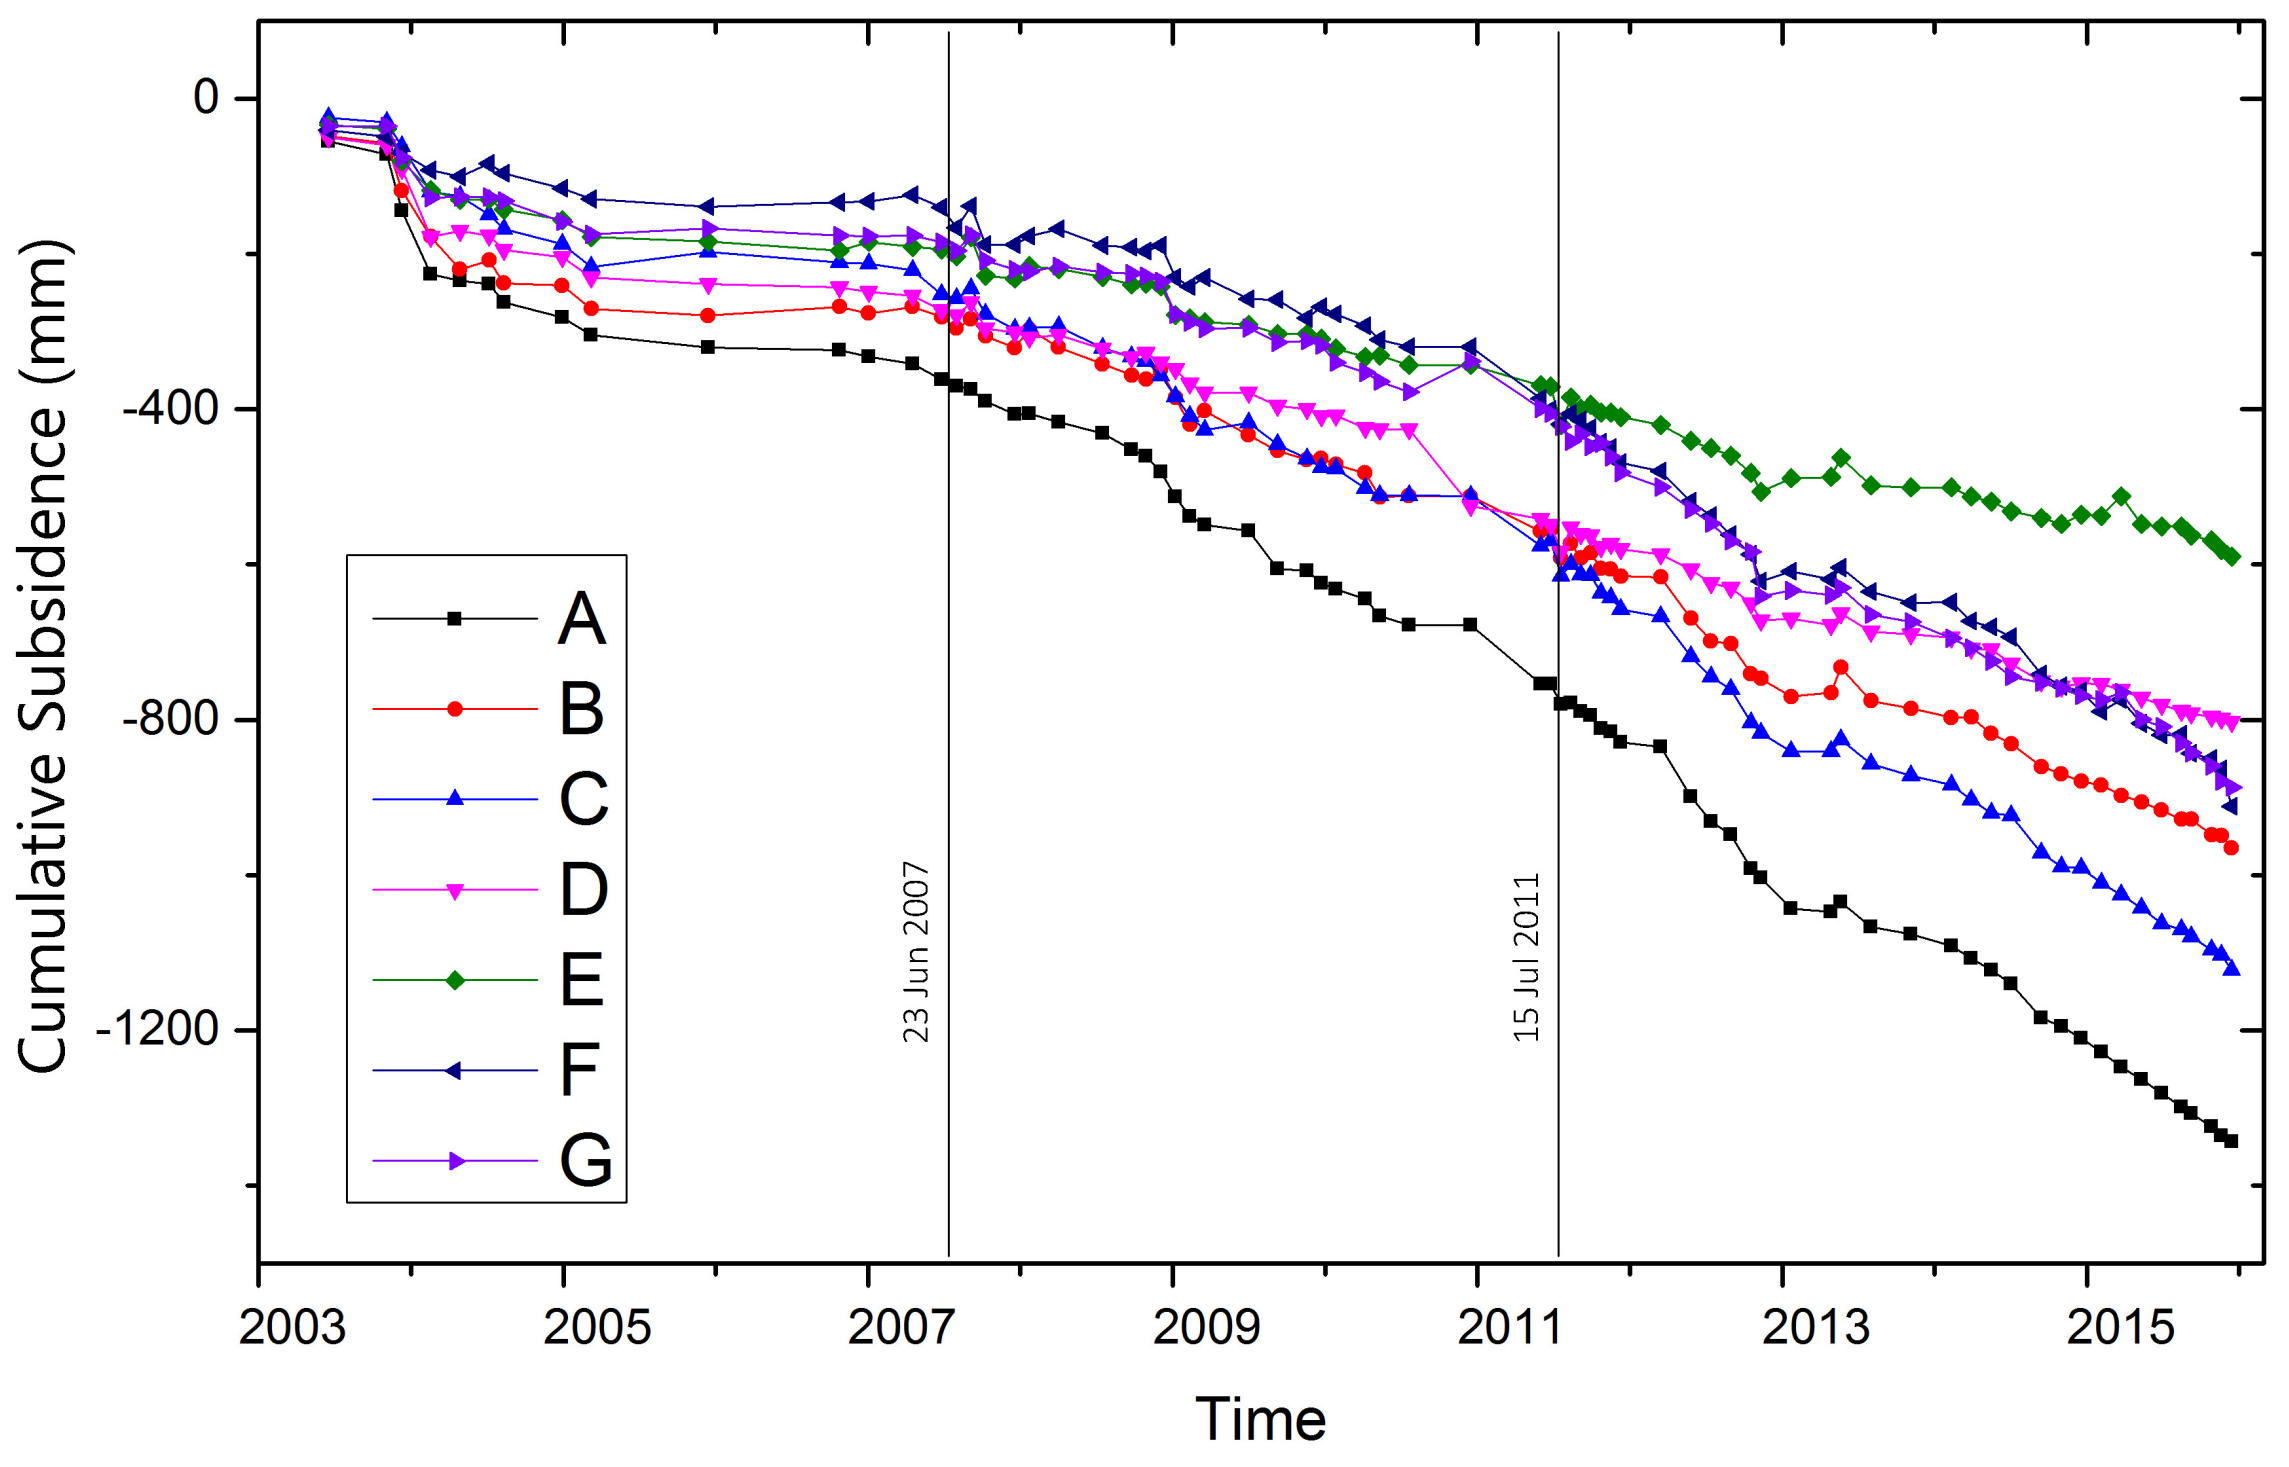
5.1. Spatiotemporal Evolution of Subsidence Bowls

The mean deformation rate map (Figure 6) was produced from the time-series data of PS points during the study period (2003–2015). It is clear that the main land subsidence region is located in the East and north parts of the Beijing Plain (Haidian and Tongzhou district). The deformation rate ranges from −138.8 to +13.9 mm/year. This serious land subsidence with a rapid rate and a wide range of values has been observed in previous studies. Our deformation results from PSI are similar with the land subsidence results detected by IPTA (Interferometric Point Target Analysis) method [50], SBAS (small baseline subset) method [51,52], and Multi-Temporal InSAR [26]. There is a similar maximum subsidence rate about 140 mm/year during 2003 to 2010 in the Beijing Plain.
As there is a clear distinction across the −40 mm/year deformation line in the map shown in Figure 6, we used the −40 mm/year deformation line as a boundary of the subsidence regions. Combining with the −60 mm/year deformation line, we found there are mainly seven subsidence bowls in the Beijing Plain: Chaoyang–Tongzhou (CT), Tongzhou (TZ), Chaoyang–Jinzhan (CJ), Chaoyang–Laiguangying (CL), ShunYi (SY), ChangPing (CP) and Haidian (HD) Subsidence Bowl. All of these subsidence bowls are around the downtown of Beijing to the north and east sides of it, except for the SY subsidence bowl which is located in the Shunyi district. CT, TZ, CJ and CL subsidence bowls are approximately circular in shape, whereas SY, CP and HD subsidence bowls are close to elliptical. SY subsidence bowl is elongated in the north and south directions, CP towards southeast and northwest directions, almost parallel to the Fb-2 fault, and HD is elongated in a northeast to southwest direction.
It is evident that some subsidence bowls are separated by the major faults in the plain: CT, TZ and CJ are divided by the Fa-1 and Fb-3 faults; Fb-2 crosses in the middle of CJ and CL; the boundaries of CL are Fa-1, Fb-1 and Fb-2; and both CL and SY are located between Fb-1 and Fb-2, but are separated by Fa-1, while there are also some exceptions, such as Fb-3 fault passes through the CT subsidence bowl. That means there may be some other geological structure reasons lead to this phenomenon. On the whole, these spatial characteristics confirm that the influence of faults on land subsidence in the Beijing Plain cannot be ignored.
In order to analyze the development of the subsidence bowls, points (A–G, Figure 6) located almost in the central part of each of the main seven subsidence bowls, were selected for time series analysis of the deformation (Figure 7).
The largest subsidence (more than 100 mm/year) occurred in the central part of the CT subsidence bowl, near point A. Similarly, the land subsidence velocities of TZ (point B) and CJ (point C) subsidence bowls were more than 80 mm/year. A notable feature of Figure 7 is that the year of 2007 was a clear turning point, before which the cumulative subsidence of all points (A–G) was mostly stable following an initial period of subsidence in early 2004. In contrast, the cumulative subsidence increased rapidly after the year of 2007. The other important turning point is the year 2012, when the subsidence speed of D and E slowed down relative to the other subsidence bowls, resulting in lower overall subsidence compared to the other bowls by the end of 2015, and the cumulative subsidence of the two bowls was smaller than the other bowls in the end of 2015.
We examined deformation profiles through time in the northwest–southeast (AA’) and southwest–northeast (BB’) directions. The cumulative deformation of the profiles are shown in Figure 8 from 2003 to 2015. Profile AA’ which is almost along Nankou–Sunhe fault across subsidence bowls CP, CL, CJ and TZ. It is apparent that Fb-1 is located between CP and CL, Fb-2 is located between CL and CJ, and Fb-3 is located between CJ and TZ, which means that the subsidence area is divided into regions along the northwest–southeast direction. From the profile BB’ we can see that there was almost no subsidence in the left part (i.e., southwest), but there was large subsidence (about 500 mm from 2003 to 2015) in the right part (i.e., northeast). We can conclude that there are generally two parts (stable and subsidence areas) along the southwest–northeast direction.

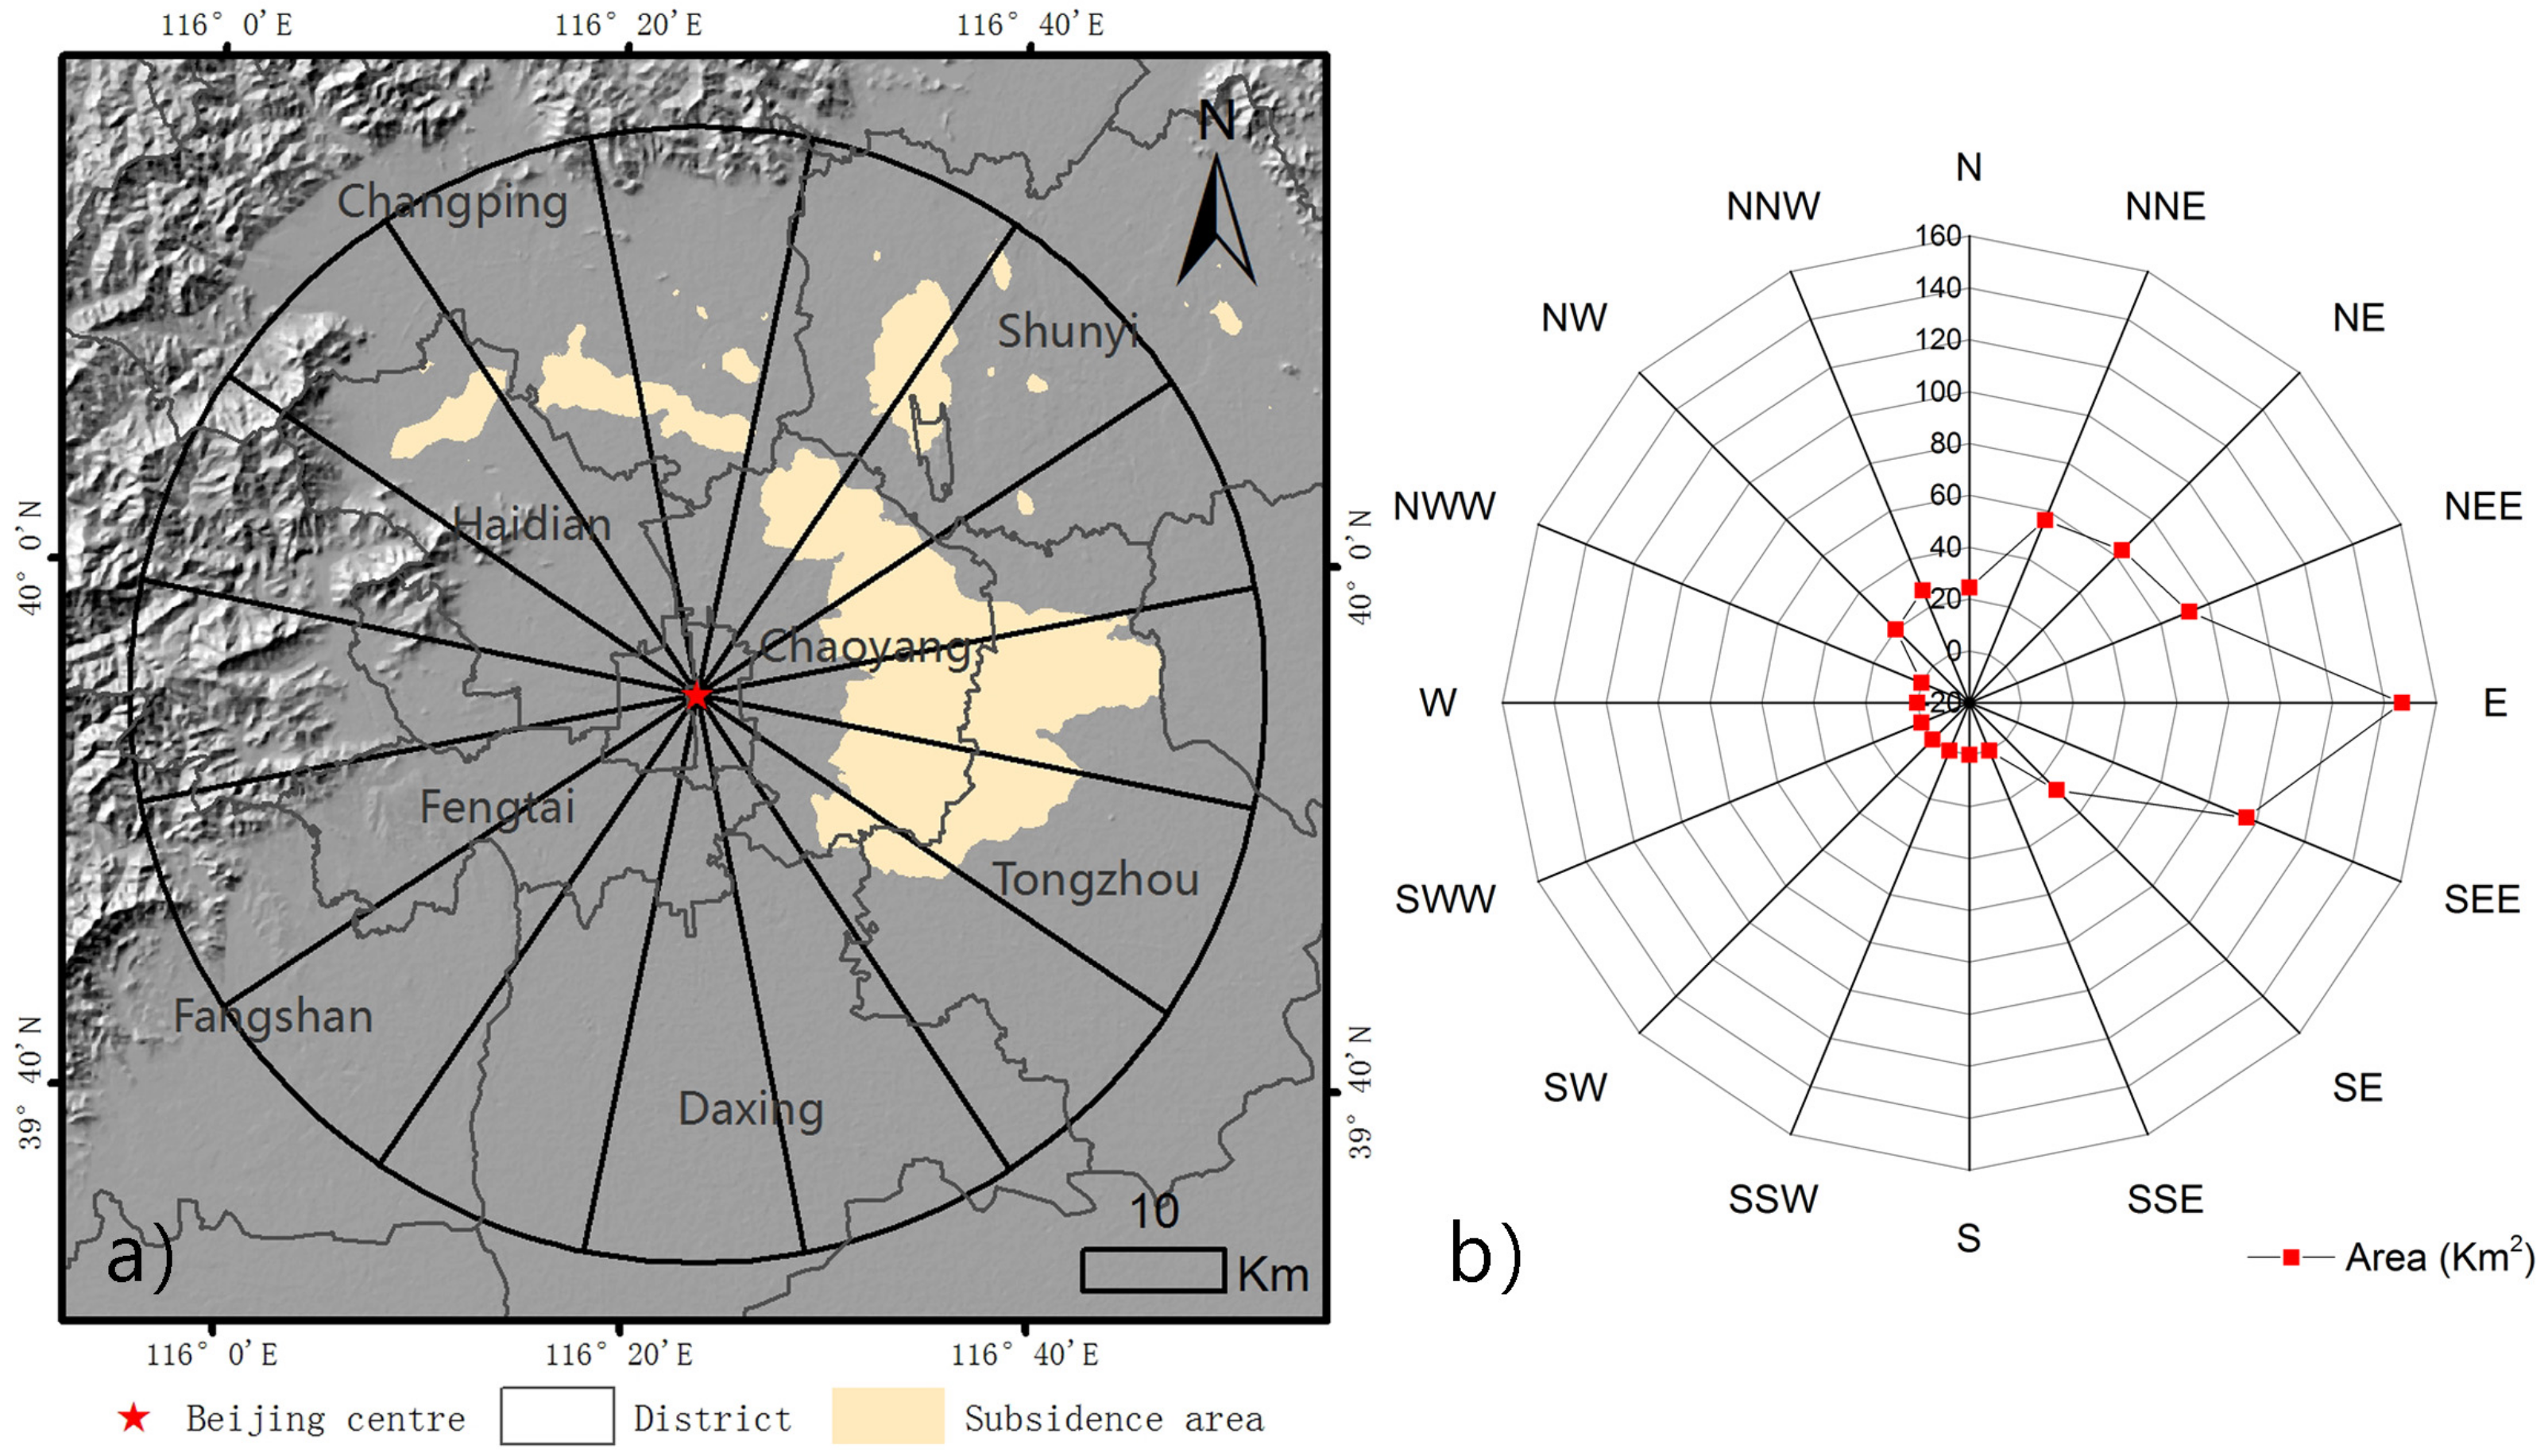
5.2. The Area of Different Mean Deformation Rates Region

From the GIS spatial analysis, we discovered that the most serious part of land subsidence in the Beijing Plain is located in the east part of Chaoyang district, a 26.51 km2 region with a subsidence rate of more than 100 mm/year. The area of subsidence rate with more than 40 mm/year is 536.06 km2 large (Figure 9).
The Equal Fan Analysis Method (EFAM) was used to define quantitatively the expansion of the subsidence region in different directions. This method has previously been used to study the evolution of city development [53,54]. EFAM is an effective way to explore the changing features in different directions of an object. In our study, we use this method to expose the spatial evolution of land subsidence in the Beijing Plain as a whole. First, we made Tiananmen Square as the center point, and drew a circle with a 50 km radius, covering most of the subsidence area in the Beijing Plain. Then we divided the circle into sixteen equal fans by the EFAM method. Each sector has its own direction, such as N, NNE, NE, NEE, E, and so on. The area of subsidence in each fan represents the expansion of the subsidence in the corresponding direction.
The sixteen radial subsidence regions are shown in the Figure 10a and listed in Table 2, Figure 10b summarizes that the area expansion in different directions using a radar map. The maximum extension is in the E direction, at about 146.83 km2, and the expansion rate is nearly 11.30 km2/year. The land subsidence area (314.34 km2) in the E, NEE and SEE directions occupy approximate 66% of the total subsidence area. The average of the expansion in the northeast direction is relatively higher than it on the west and south directions. This means that Shunyi and Tongzhou districts are particularly affected by land subsidence and Chaoyang district is the most affected region of land subsidence. In contrast, there is almost no subsidence in the south and west part of the Beijing Plain. The results of subsidence area expansion observed by EFAM are not only similar to the previous findings of Chen et al. (2016), the subsidence bowls in the east, northeast and north parts of Beijing have gradually merged [29], but also show the average speed of the expansion in the northeast direction during 2003 to 2015.

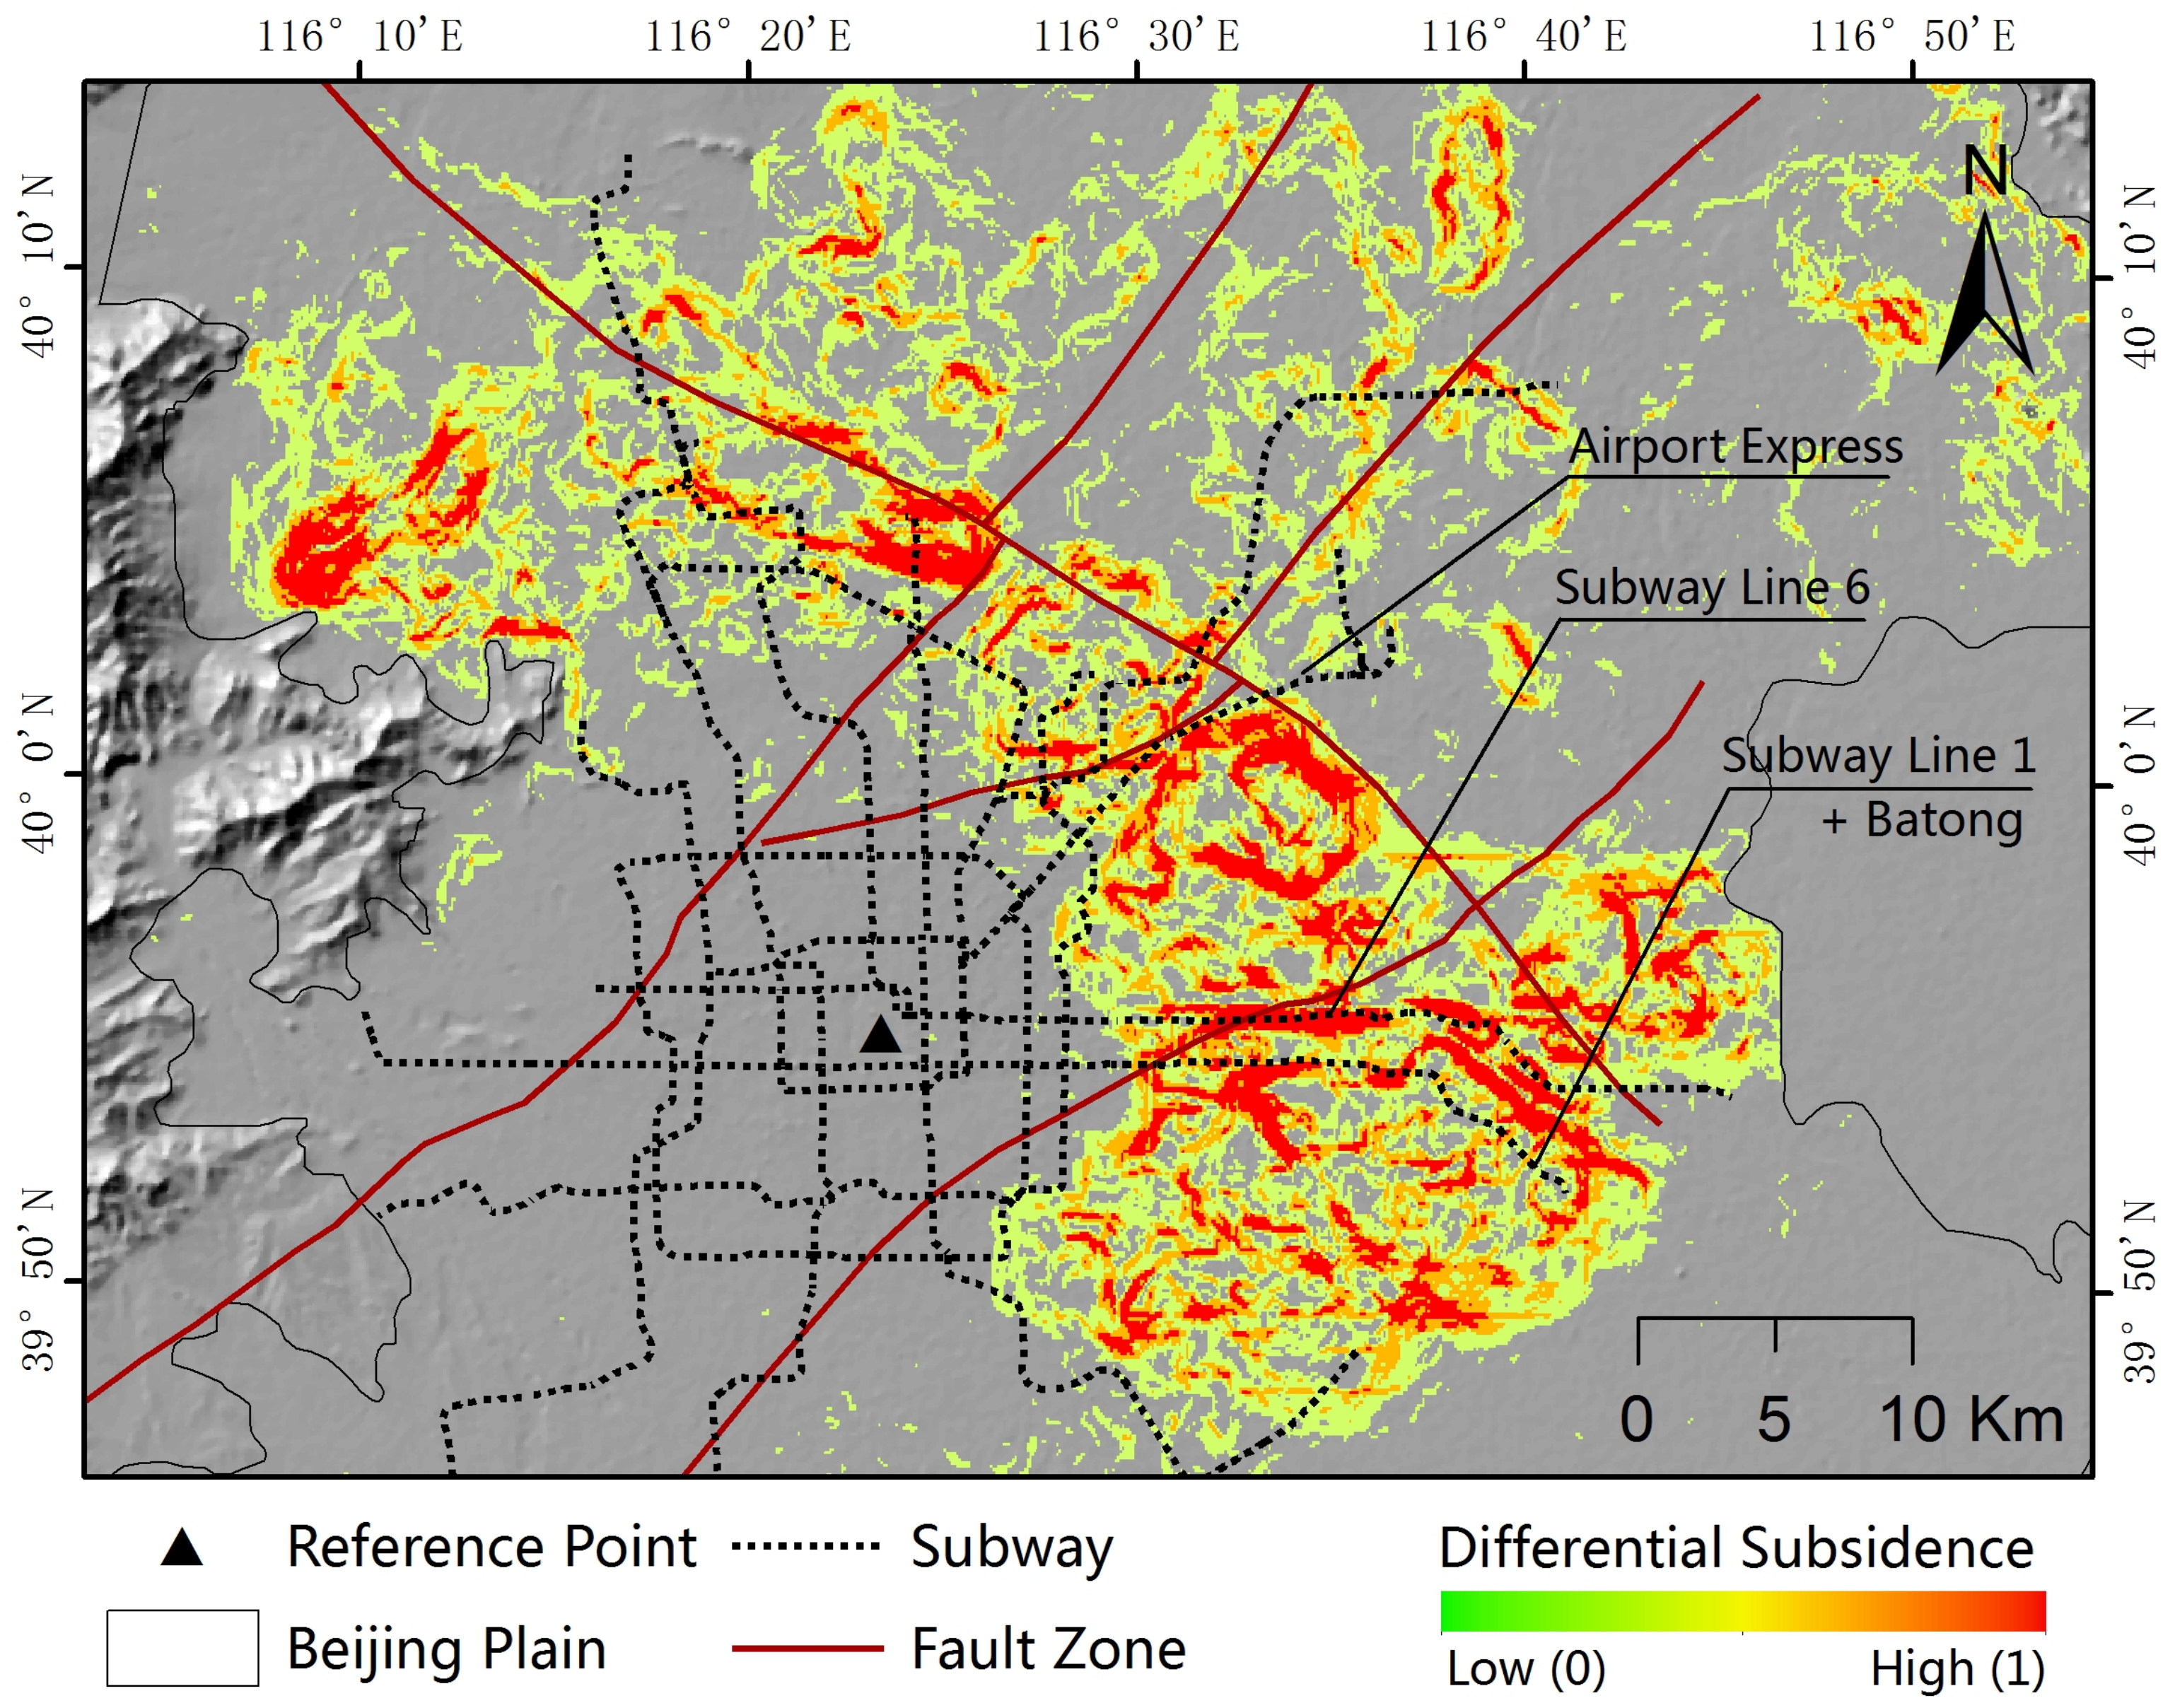
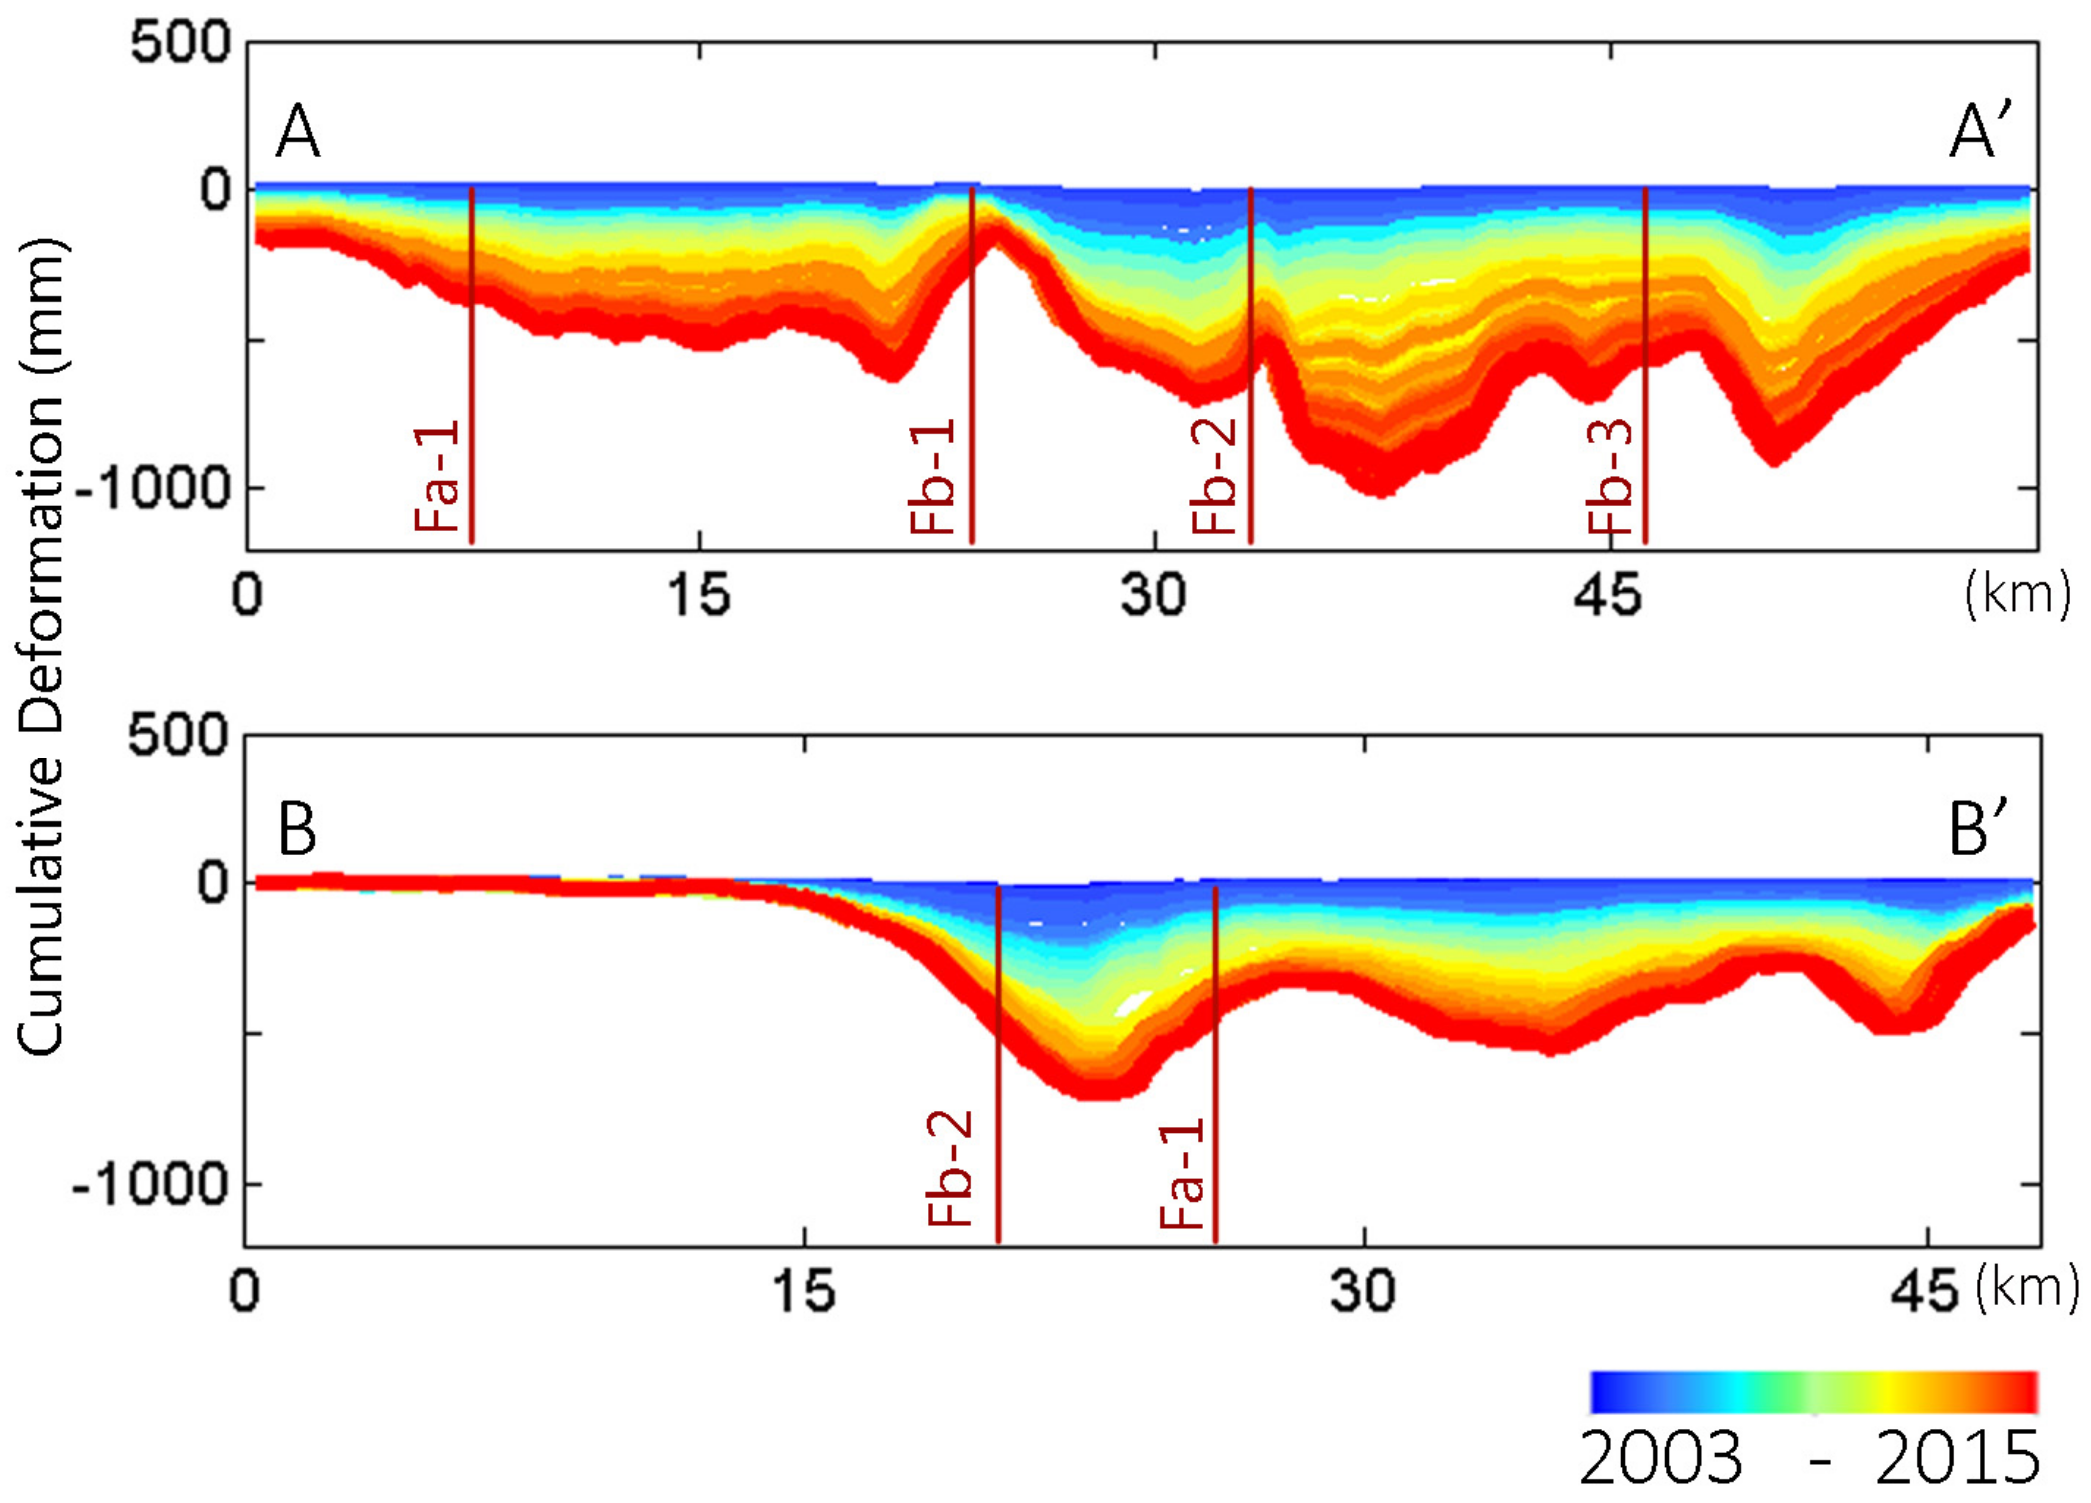
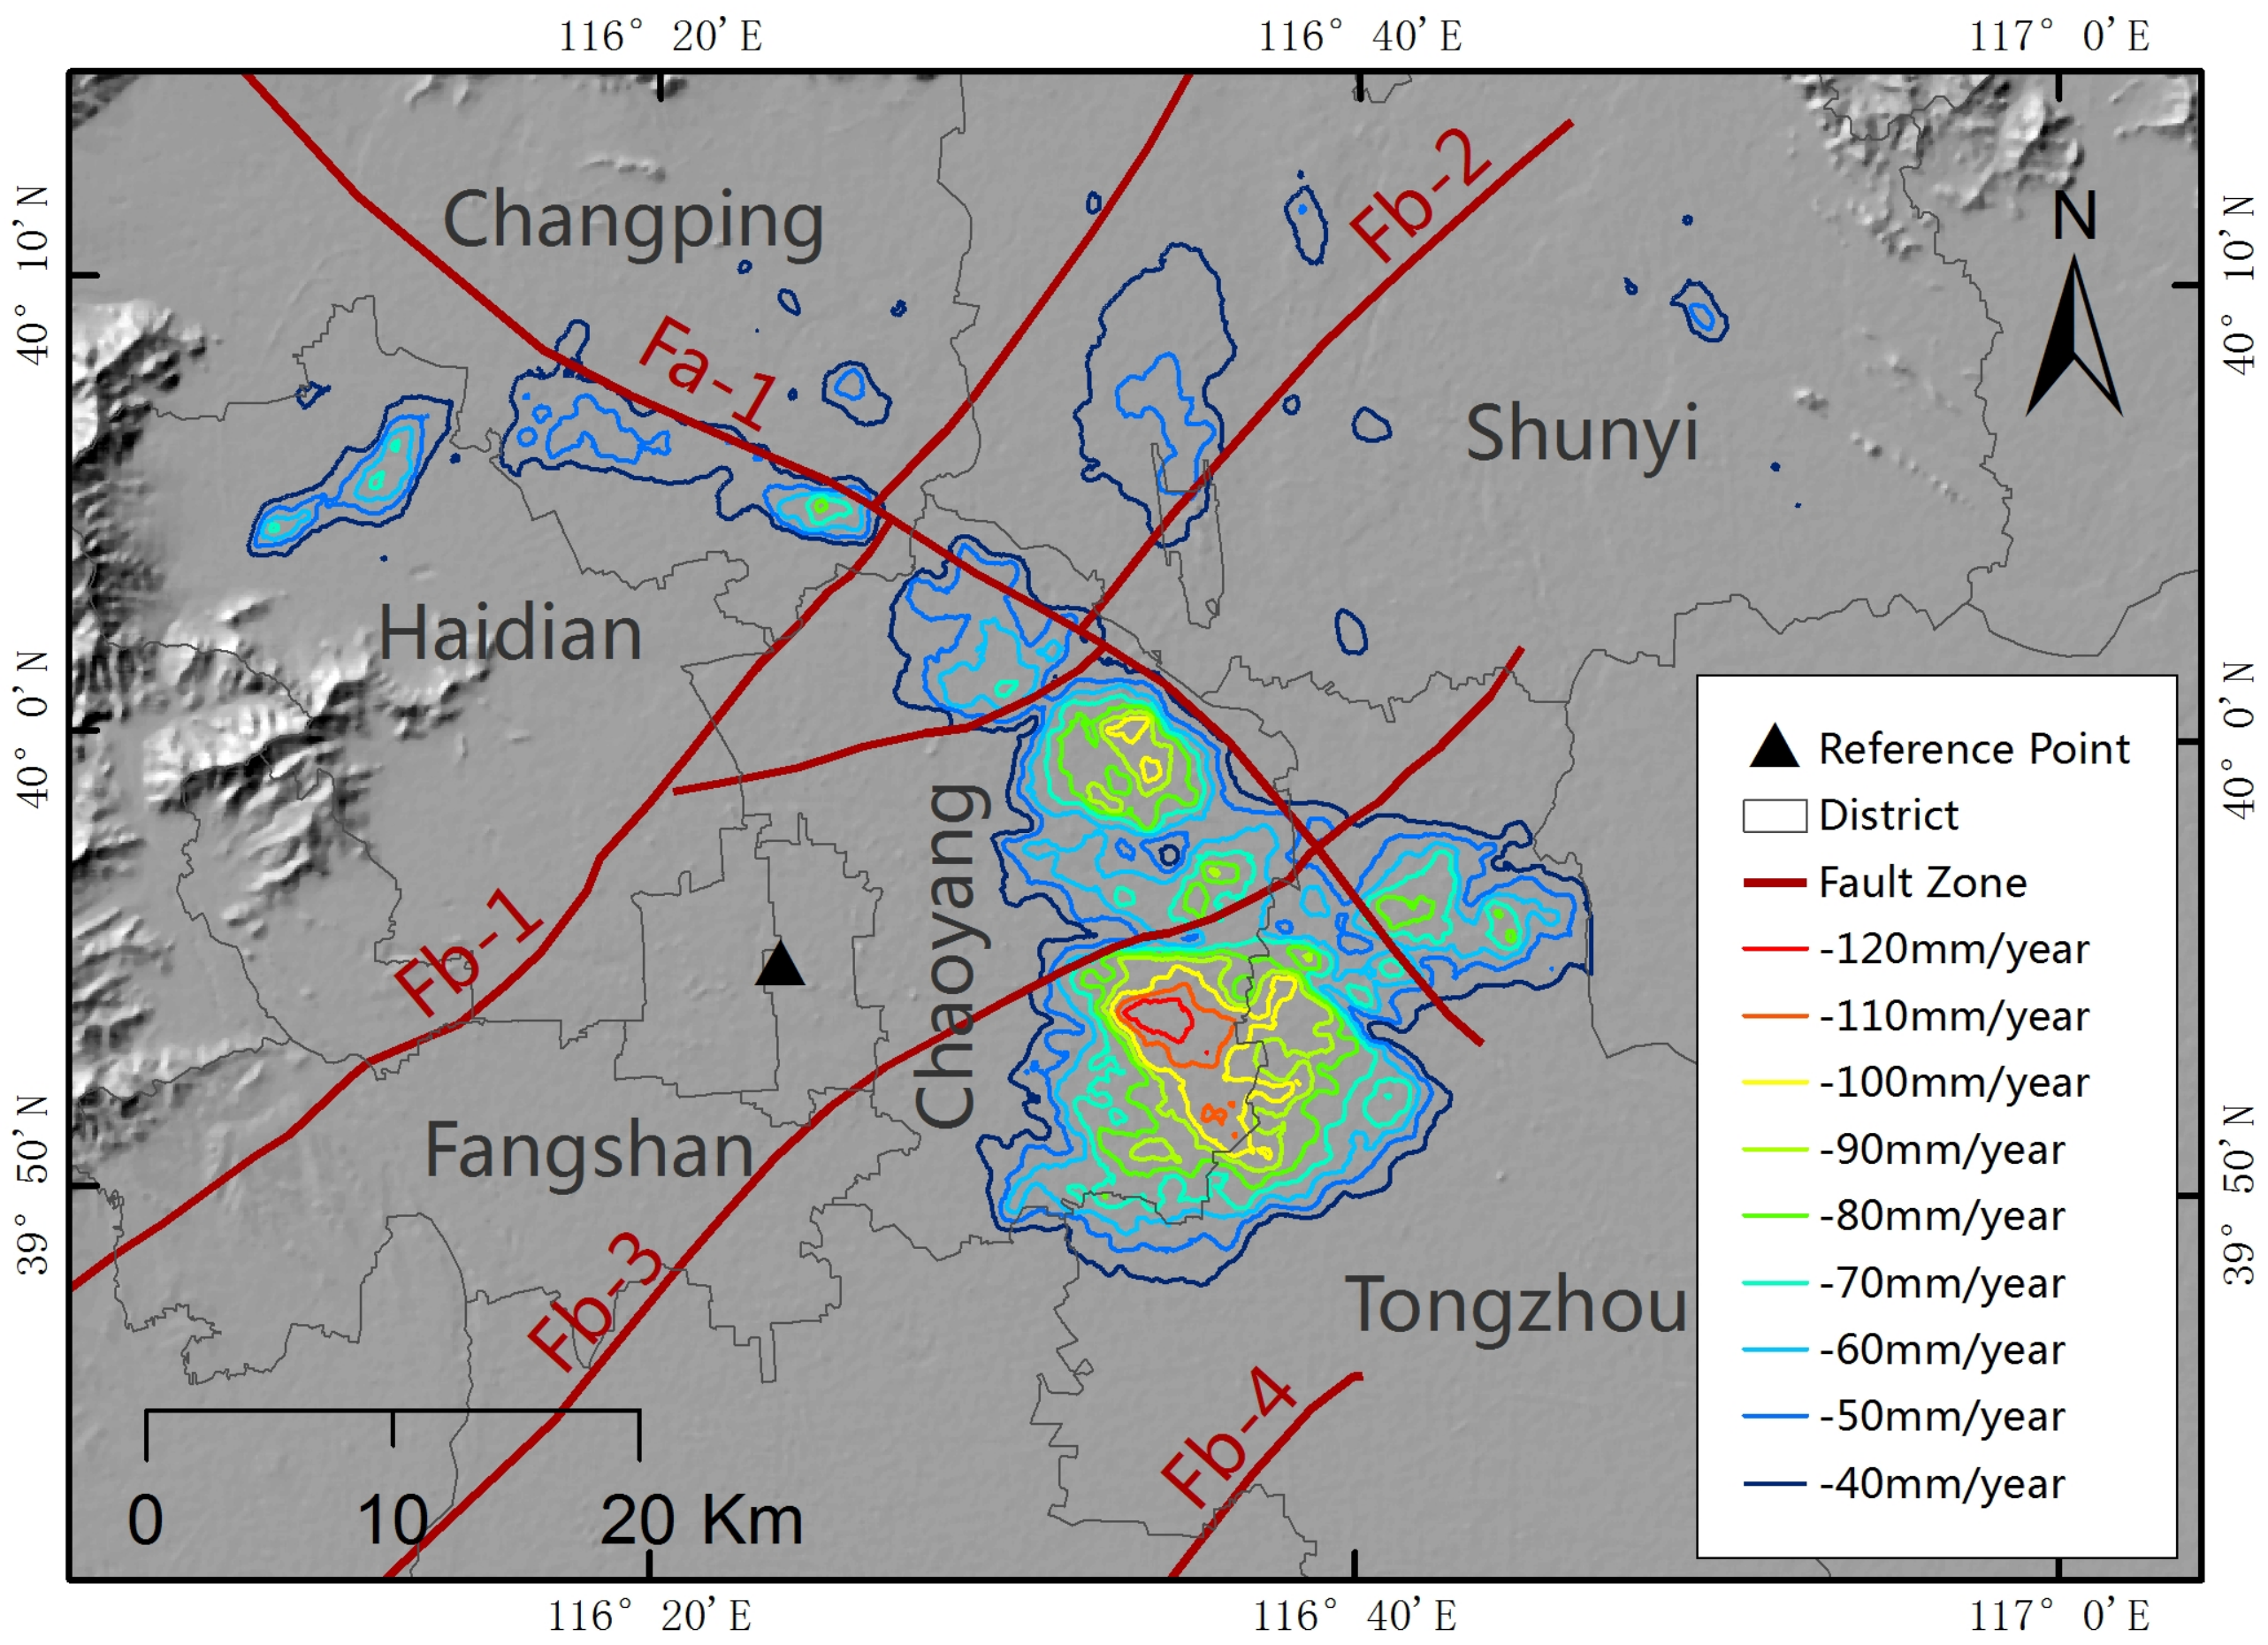
5.3. Differential Subsidence Zone

Differential subsidence, which implies a large difference in deformation within a short distance, may be particularly hazardous for buildings and infrastructure [55,56]. It is therefore important to locate differential subsidence areas. In order to recognize the area of differential land subsidence, we adopted the concept of slope in geographic spatial analysis. The Subsidence Rate Slope (SRS) was defined as:
I s = Δ V l .
In Equation (7), Δ V represents the change of land subsidence rate, and l stands for the distance.
We assume that the region with a larger difference rate than 7 mm/year over 100 m in the horizontal direction is a differential subsidence area. Thus, we normalize the value of SRS to the range 0 to 1, and divide the differential subsidence region into different levels for a better distinction by using the subsidence slope map (Figure 11). Not surprisingly, the differential subsidence areas are mainly distributed on the boundary of the subsidence bowls. These regions expose larger structures to differential subsidence rates, and this may lead to structural failure. In addition, when we added the subway lines on the differential subsidence map, we found the east parts of subway line Six and line One plus Batong are mostly located in the differential subsidence area. The Airport Express line is also goes across the differential subsidence region.

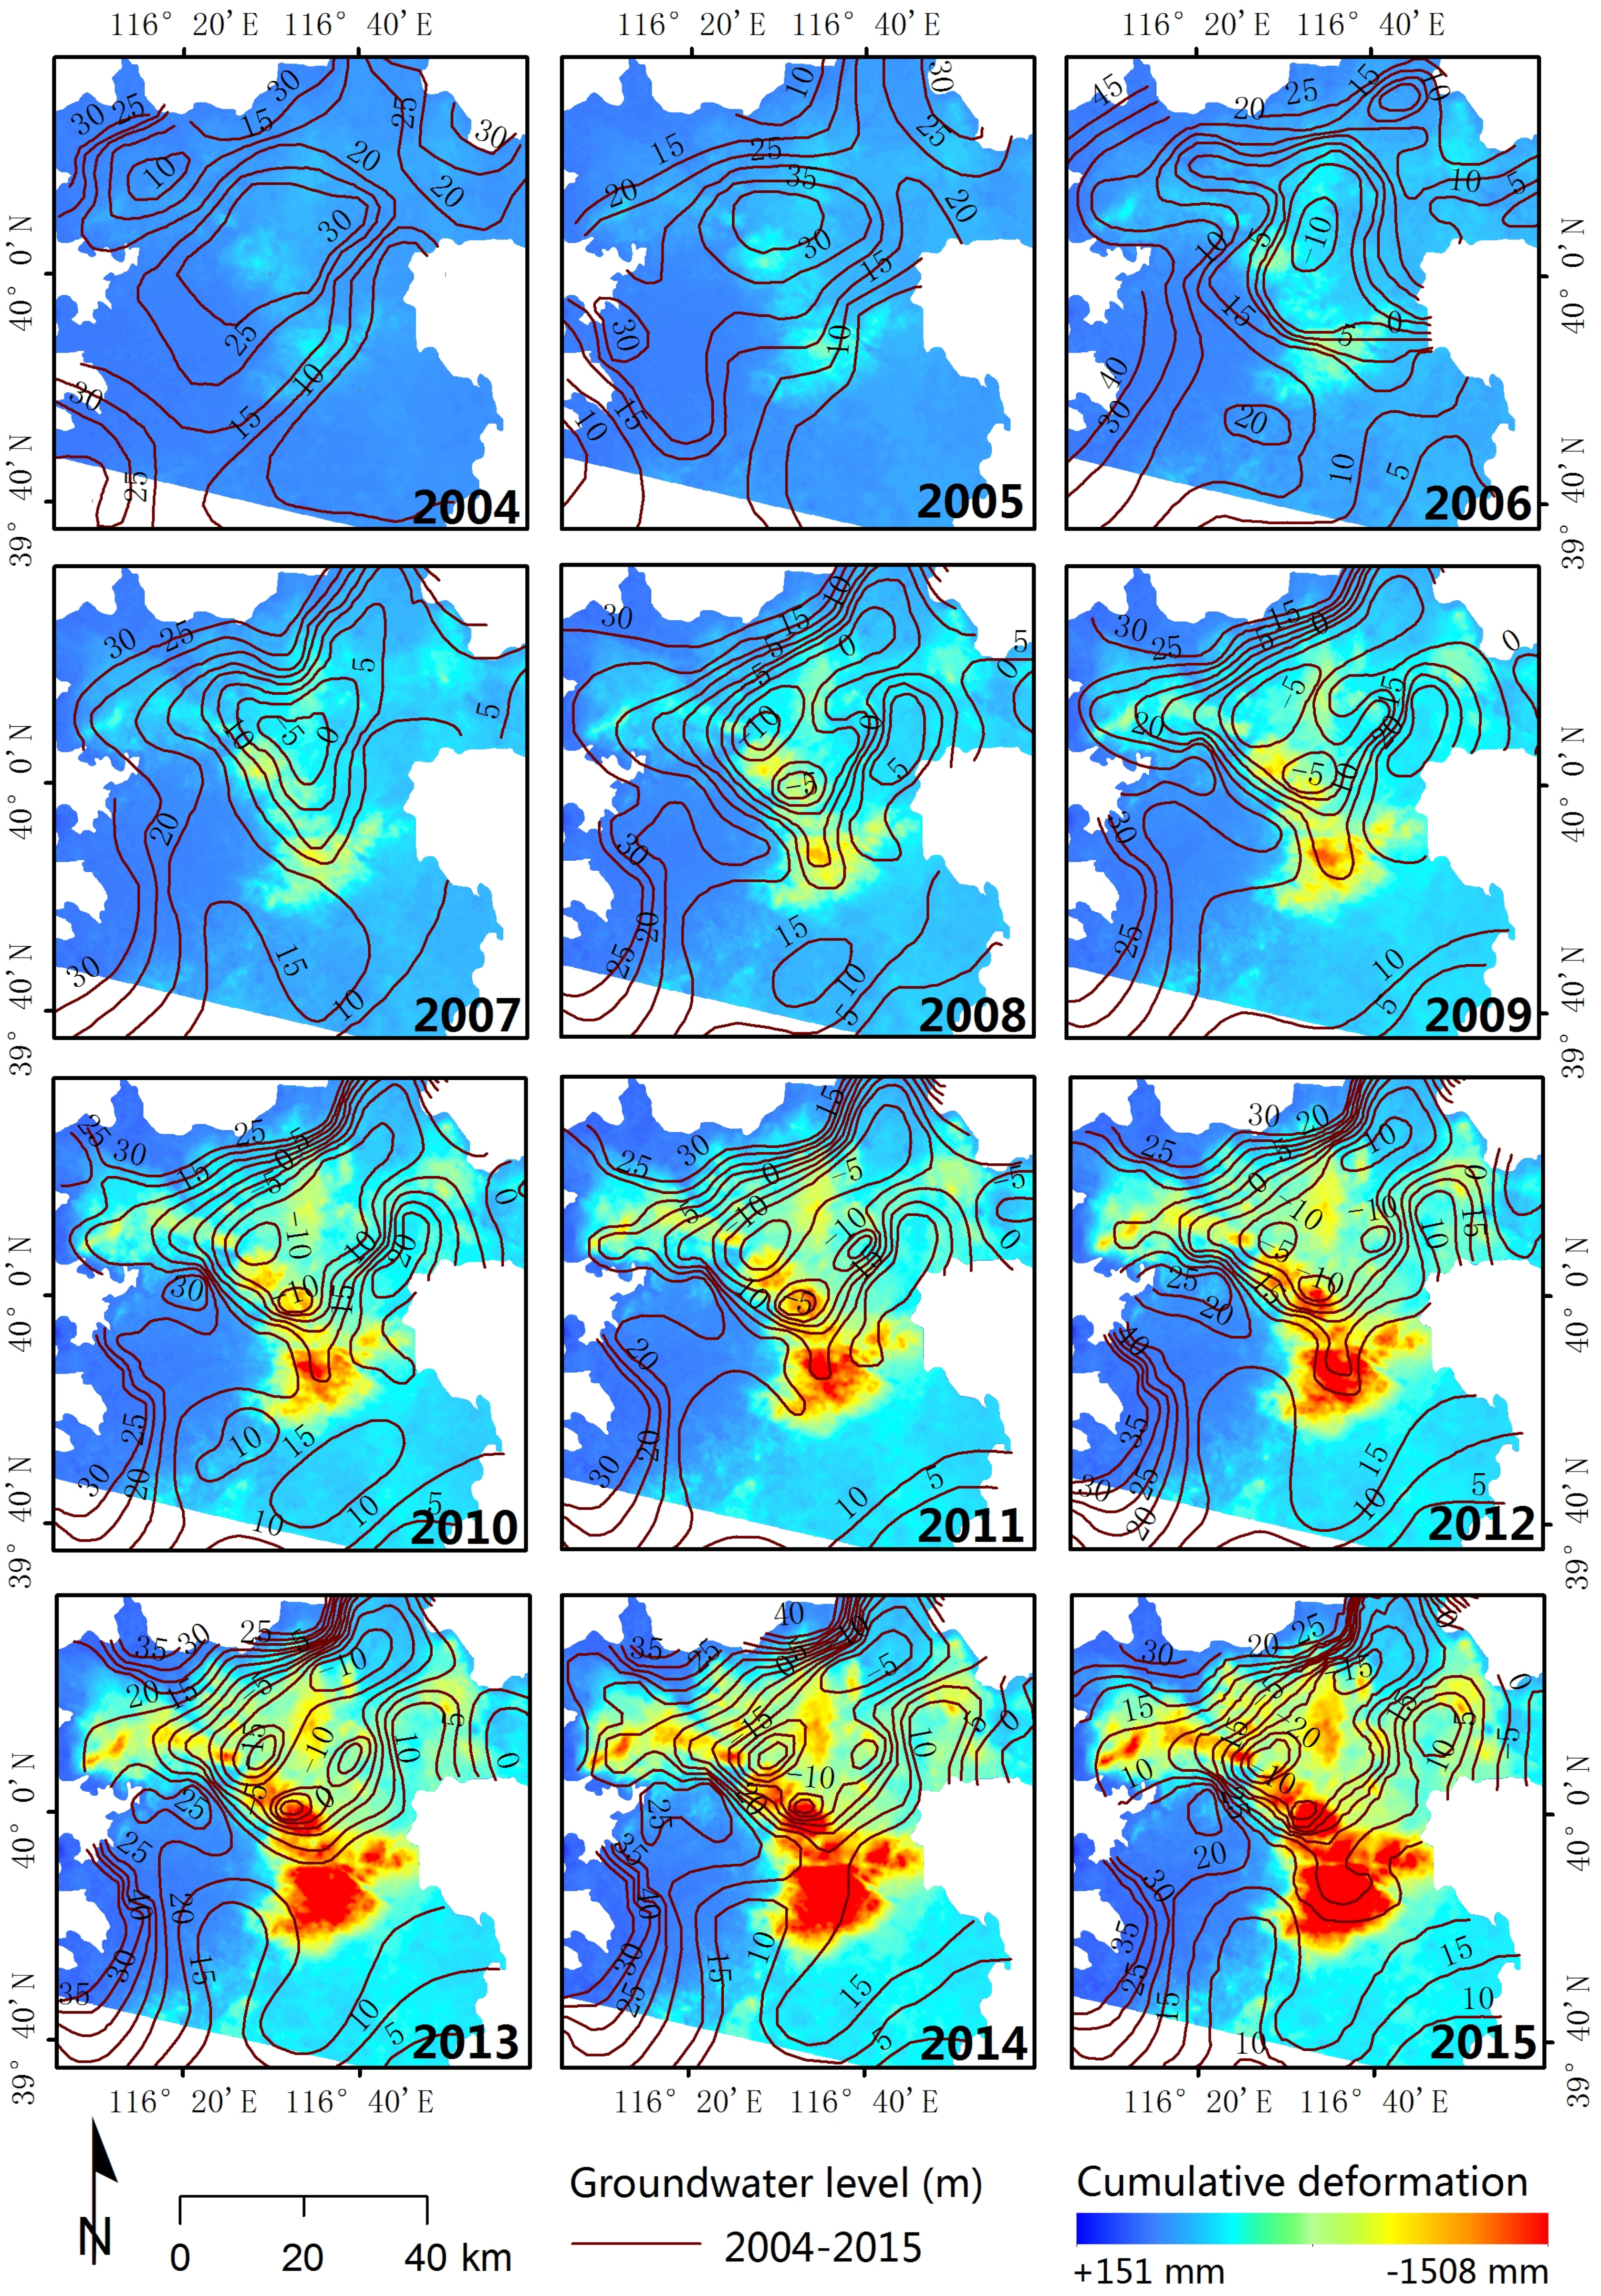
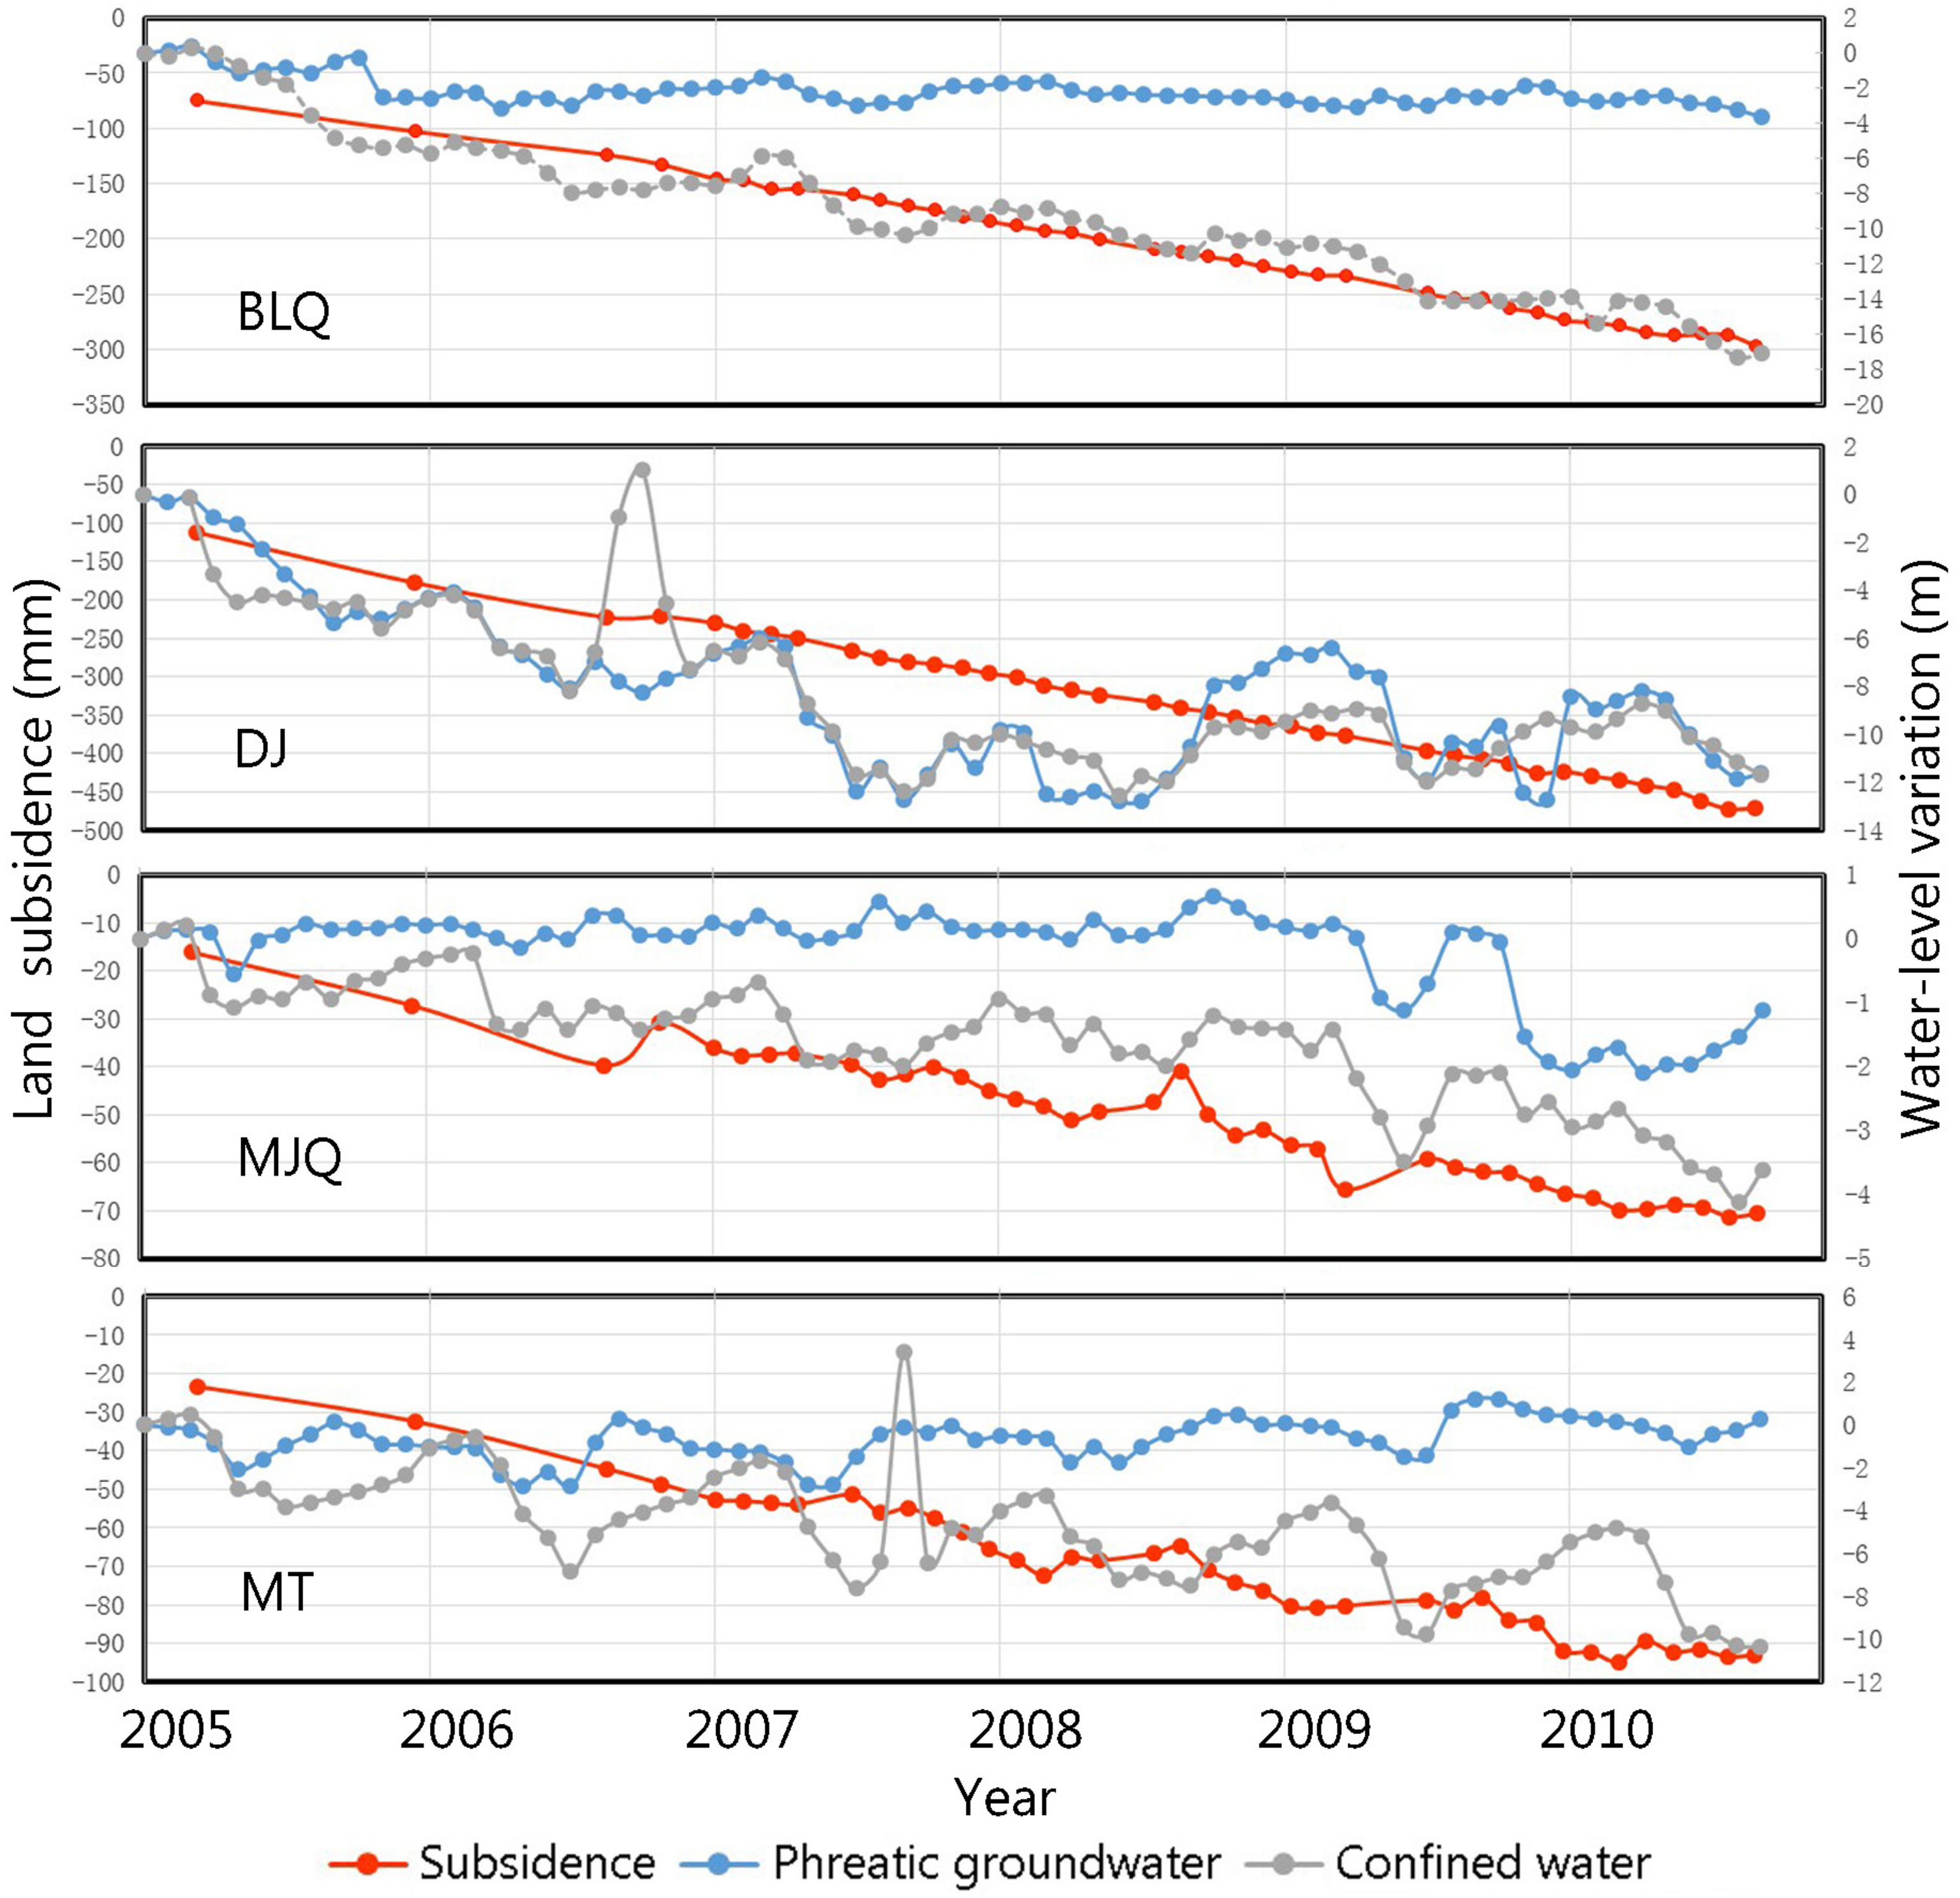
5.4. Subsidence and Groundwater

Long-term over-exploitation of groundwater could cause a regional drop of piezometric levels, decreasing pore pressure and increasing effective stresses [56]. Previous research showed that the predominant cause of subsidence in the Beijing Plain is intense groundwater extraction, rather than the other driving mechanisms [31].
Combining ground water level contours from 2003 to 2015 and the cumulative deformation extracted by PSI during the period, the correlation between subsidence response patterns and phreatic groundwater flow field was analyzed comprehensively (Figure 12). A comparison of 2015 groundwater levels with 2004 levels shows water level declines of 15–30 m throughout the north plain, with a 50 m maximum decline occurring in the central part of the Beijing Plain.
In the year of 2004, the groundwater elevations ranged from 10 to 30 m and there was only a small groundwater bowl on the northwest part of the plain due to long term over exploitation of groundwater. However, the groundwater contours in 2015 indicate a more complex pattern than those of 2003 with many groundwater bowls in the middle of the Beijing Plain and a minimum value of the groundwater of −20 m. The cumulative deformation also had great change over the same period with a maximum subsidence of more than 1500 mm. The most serious and extensive subsidence in the study area occurred in the area with the greatest groundwater depression, particularly in the east and north parts of the Beijing Plain. Furthermore, it also shows that the depression of the groundwater and the response of subsidence in the Beijing Plain is generally consistent. The Chaoyang–Jinzhan, Chaoyang–Laiguangying, ShunYi and ChangPing subsidence bowls were generally located in the same area of water level decrease. However, the spatial distribution of the subsidence zones are not fully aligned with the groundwater depression area. There are also some differences between them, the Chaoyang–Tongzhou and TongZhou subsidence bowls are not located in the zone of declining groundwater.
It is worth noting that the displacements on the ground surface are the total deformation that occurred in the different underground aquitards and aquifers. For more detailed analysis about the relationship between subsidence and groundwater, we compared the time series analysis of deformation measured by PSI and groundwater level change (Figure 13).
Four representative monitoring wells (BLG, DJ, MJQ and MT) were selected from study area to analyze the temporal response of land subsidence through a comparison with the time series deformation of the nearest PS point. BLQ and DJ wells are located in the Chaoyang–Tonghzou and Chaoyang–Laiguangying subsidence bowls respectively, while MJQ and MT well are located in the south and southeast part of study area, which are a little far from the subsidence area (marked in Figure 6). The phreatic water levels of BLQ and MJQ have stabilized rephase and water level of MT recovered by as much three meters during the study period. The water levels of confined aquifers continued to decline with the maximum 18 m decrease in the BLQ, and the corresponding subsidence was about 300 mm for the period 2005–2010. The water levels of the phreatic and confined aquifers at DJ location were generally have the same trend, dropping from 2005 to 2008, and recovering slightly after 2008. The comparison shows a close correlation between water-level fluctuations and seasonal deformation response of the location of MJQ. Seasonal displacement was also found at the MT well. Furthermore, the deformation show an obvious delayed response (about three months) to the seasonal head change which can be attributed to the delayed drainage and fluid-pressure equilibration of the low-permeability aquitard or interbed. The displacements at BLQ and DJ wells continued at relative stable rates through most of the period, even though the water level recovered with a relative large magnitude (DJ). The BLQ and DJ wells show a mainly inelastic behavior as the deformation presents a continuous compaction with the groundwater level decline. The inelastic aquifer-system deformation may be primarily caused by two factors: residual compaction and secondary compression of the aquitards.

6. Conclusions

In this study, land subsidence due to over-extraction of groundwater in the Beijing Plain was investigated with the PSI method by using multi-source SAR (ENVISAT ASAR, RADARSAT-2 and TerraSAR-X) images. The PSI results were compared with conventional leveling measurements and cross-validation, which showed that the PSI monitoring results replicate both the seasonal and long-term trends of the conventional benchmark results with an accuracy of about five millimeters. The displacement map reveal reveals that the Beijing Plain has experienced severe land subsidence from June 2003 to December 2015, with a maximum cumulative subsidence of about 1508 mm.
From the average deformation velocity fields during 2003 to 2015, seven major subsidence bowls were identified: Chaoyang–Tongzhou (CT), Tongzhou (TZ), Chaoyang–Jinzhan (CJ), Chaoyang–Laiguangying (CL), ShunYi (SY), ChangPing (CP) and Haidian (HD) Subsidence Bowls, in the east and north parts of the Beijing Plain.
The spatiotemporal analysis of land subsidence indicates an increasing trend in the rate and extent of land subsidence. A profile across the northeast-trending Quaternary faults (Figure 6) reveals that the distribution of subsidence bowls is clearly controlled by the faults. The Equal Fan Analysis Method was used to detect the expansion in different directions of the subsidence region, showing that the maximum expansion direction is towards the east, with a speed of 11.30 km2/year.
The comparisons of land subsidence and head changes of multi-aquifer system between 2003 and 2015 shows that the main subsidence region is distributed in the same area with the area of groundwater depression. The comparison between the time-series deformation and water-level fluctuations shows the different response patterns of the aquifer system. Seasonal displacement was also found at the MT well. However, the deformation show an obvious delayed response to the seasonal head change which can be attributed to the delayed drainage and fluid-pressure equilibration of the low-permeability aquitard or interbed.
To summarize, mapping the land subsidence by PSI techniques with multi-source SAR data has allowed us to characterize the spatial and temporal pattern of the land subsidence in the Beijing Plain during the study period. The accuracy of deformation could be further improved by increasing the SAR data, and by combining data from different SAR viewing geometries and multiple satellites. The greater resolution of the seasonal signals may be detected and can be used to estimate the storage change of aquifer systems. Time-series displacements of PSI may also be used to identify the depth-dependent mechanisms of land subsidence in conjunction with conventional hydrogeophysical methods.

Acknowledgments

This work was supported by the National Natural Science Foundation of China under Grant 41130744, 41171335, the Nature Science Foundation of Beijing grants No. 16J00027, 16H20024 and China Geological Survey grants No. DD20160235. ENVISAT ASAR are copyright of European Space Agency (ESA), TerraSAR-X are copyright of German Aerospace Agency (DLR), RADARSAT-2 are copyright of Canadian Space Agency. All the SAR images were provided under the research foundation. Precise orbit state vectors were provided by the ESRIN Help desk of ESA. Shuttle Radar Topography Mission (SRTM) DEM provided by NASA. Open source software DORIS and StaMPS were provided by the University of Delft, Stanford and Leeds. Thanks for the support from these institutions.

Author Contributions

Chaodong Zhou performed experiments, analyzed the data and wrote the paper. Huili Gong and Youquan Zhang provided crucial guidance and support through the research. Tim Warner made important suggestions on paper writing. Cong Wang analyzed the validation data and helped to survey the subsidence area.

Conflicts of Interest

The authors declare no conflict of interests.

References

  1. Galloway, D.L.; Burbey, T.J. Review: Regional land subsidence accompanying groundwater extraction. Hydrogeol. J. 2011, 19, 1459–1486. [Google Scholar] [CrossRef]
  2. Chaussard, E.; Wdowinski, S.; Cabral-Cano, E.; Amelung, F. Land subsidence in central mexico detected by alos insar time-series. Remote Sens. Environ. 2014, 140, 94–106. [Google Scholar] [CrossRef]
  3. Miller, M.M.; Shirzaei, M. Spatiotemporal characterization of land subsidence and uplift in phoenix using insar time series and wavelet transforms. J. Geophys. Res. Solid Earth 2015, 120, 5822–5842. [Google Scholar] [CrossRef]
  4. Chen, F.; Guo, H.; Ma, P.; Lin, H.; Wang, C.; Ishwaran, N.; Hang, P. Radar interferometry offers new insights into threats to the Angkor site. Sci. Adv. 2017, 3, e1601284. [Google Scholar] [CrossRef] [PubMed]
  5. Syvitski, J.P.M.; Kettner, A.J.; Overeem, I.; Hutton, E.W.H.; Hannon, M.T.; Brakenridge, G.R.; Day, J.; Vörösmarty, C.; Saito, Y.; Giosan, L.; et al. Sinking deltas due to human activities. Nat. Geosci. 2009, 2, 681–686. [Google Scholar] [CrossRef]
  6. Tosi, L.; Da Lio, C.; Strozzi, T.; Teatini, P. Combining l- and x-band sar interferometry to assess ground displacements in heterogeneous coastal environments: The Po river delta and Venice Lagoon, Italy. Remote Sens. 2016, 8, 308. [Google Scholar] [CrossRef]
  7. Ng, A.H.-M.; Ge, L.; Li, X.; Zhang, K. Monitoring ground deformation in Beijing, China with persistent scatterer sar interferometry. J. Geod. 2011, 86, 375–392. [Google Scholar] [CrossRef]
  8. Liu, Y.; Zhang, F.; Wang, Y.; Hu, L. Research on land subsidence of recent years Beijing. Sci. Surv. Mapp. 2014, 39, 68–70. [Google Scholar]
  9. Haghshenas Haghighi, M.; Motagh, M. Assessment of ground surface displacement in taihape landslide, new zealand, with c- and x-band sar interferometry. N. Z. J. Geol. Geophys. 2016, 59, 136–146. [Google Scholar] [CrossRef]
  10. Chen, Q.; Liu, G.; Li, Y.; Ding, X. Automated detection of permanent scatterers in radar interferometry: Algrorithm and testing resrlts. Acta Geod. Cartogr. Sin. 2006, 35, 112–117. [Google Scholar]
  11. Liu, G.; Chen, Q.; Ding, X. Detecting ground deformation with permanent-scatterer network in radar interferometry: Algorithm and testing results. Acta Geod. Cartogr. Sin. 2007, 36, 13–18. [Google Scholar]
  12. Zebker, H.A.; Villasenor, J. Decorrelation in interferometric radar echoes. IEEE Trans. Geosci. Remote Sens. 1992, 30, 950–959. [Google Scholar] [CrossRef]
  13. Zebker, H.A.; Rosen, P.A.; Hensley, S. Atmospheric effects in interferometric synthetic aperture radar surface deformation and topographic maps. J. Geophys. Res. Solid Earth 1997, 102, 7547–7563. [Google Scholar] [CrossRef]
  14. Werner, C.; Wegmuller, U.; Strozzi, T.; Wiesmann, A. Interferometric point target analysis for deformation mapping. In Proceedings of the 2003 IEEE International Geoscience and Remote Sensing Symposium, IGARSS ’03, Toulouse, France, 21–25 July 2003; Volume 4367, pp. 4362–4364. [Google Scholar]
  15. Wegmuller, U.; Werner, C.; Strozzi, T.; Wiesmann, A. Multi-temporal interferometric point target analysis. In Proceedings of the The Second International Workshop on Analysis of Multi-Temporal Remote Sensing Images, Ispra, Italy, 16–18 July 2003; pp. 136–144. [Google Scholar]
  16. Ferretti, A.; Prati, C.; Rocca, F. Permanent scatterers in sar interferometry. IEEE Trans. Geosci. Remote Sens. 2001, 39, 8–20. [Google Scholar] [CrossRef]
  17. Zebker, H.; Shanker, P.; Hooper, A. Insar remote sensing over decorrelating terrains persistent scattering methods. In Proceedings of the IEEE Radar Conference, Waltham, MA, USA, 17–20 April 2007; pp. 717–722. [Google Scholar]
  18. Hooper, A.; Segall, P.; Zebker, H. Persistent scatterer interferometric synthetic aperture radar for crustal deformation analysis, with application to Volcán Alcedo, Galápagos. J. Geophys. Res. 2007, 112. [Google Scholar] [CrossRef]
  19. Tamburini, A.; Bianchi, M.; Giannico, C.; Novali, F. Retrieving surface deformation by psinsar™ technology: A powerful tool in reservoir monitoring. Int. J. Greenh. Gas Control 2010, 4, 928–937. [Google Scholar] [CrossRef]
  20. Zhang, Q.; Zhao, X.; Sun, R.; Luo, H. Land subsidence and ground fissures in xi'an, china 2005–2012 revealed by multi-band insar time-series analysis. Remote Sens. Environ. 2014, 155, 366–376. [Google Scholar]
  21. Solari, L.; Ciampalini, A.; Raspini, F.; Bianchini, S.; Moretti, S. Psinsar analysis in the pisa urban area (Italy): A case study of subsidence related to stratigraphical factors and urbanization. Remote Sens. 2016, 8, 120. [Google Scholar] [CrossRef]
  22. Chen, J.; Wu, J.; Zhang, L.; Zou, J.; Liu, G.; Zhang, R.; Yu, B. Deformation trend extraction based on multi-temporal insar in shanghai. Remote Sens. 2013, 5, 1774–1786. [Google Scholar] [CrossRef]
  23. Liu, G.; Luo, X.; Chen, Q.; Huang, D.; Ding, X. Detecting land subsidence in shanghai by ps-networking sar interferometry. Sensors 2008, 8, 4725–4741. [Google Scholar] [CrossRef] [PubMed]
  24. Liu, P.; Li, Q.; Li, Z.; Hoey, T.; Liu, G.; Wang, C.; Hu, Z.; Zhou, Z.; Singleton, A. Anatomy of subsidence in tianjin from time series insar. Remote Sens. 2016, 8, 266. [Google Scholar] [CrossRef]
  25. Zhu, C.; Zhang, Y.; Zhang, J.; Zhang, L.; Long, S.; Wu, H. Recent subsidence in tianjin, China: Observations from multi-looking terrasar-x insar from 2009 to 2013. Int. J. Remote Sens. 2015, 36, 5869–5886. [Google Scholar] [CrossRef]
  26. Guo, J.; Zhou, L.; Yao, C.; Hu, J. Surface subsidence analysis by multi-temporal insar and grace: A case study in Beijing. Sensors 2016, 16, 1495. [Google Scholar] [CrossRef] [PubMed]
  27. Gong, H.; Zhang, Y.; Li, X.; Lu, X.; Chen, B.; Gu, Z. Land subsidence research in Beijing based on the permanent scatterers insar technology. China Acad. J. Electron. Publ. House 2009, 19, 1261–1266. [Google Scholar]
  28. Zhang, Y.; Gong, H.; Gu, Z.; Wang, R.; Li, X.; Zhao, W. Characterization of land subsidence induced by groundwater withdrawals in the plain of Beijing city, China. Hydrogeol. J. 2013, 22, 397–409. [Google Scholar] [CrossRef]
  29. Chen, M.; Tomás, R.; Li, Z.; Motagh, M.; Li, T.; Hu, L.; Gong, H.; Li, X.; Yu, J.; Gong, X. Imaging land subsidence induced by groundwater extraction in Beijing (China) using satellite radar interferometry. Remote Sens. 2016, 8, 468. [Google Scholar] [CrossRef]
  30. Li, Y.; Zhang, J.; Li, Z.; Luo, Y. Land subsidence in Beijing city from insar time series analysis with small baseline subset. Geom. Inf. Sci. Wuhan Univ. 2013, 38, 1374–1377. [Google Scholar]
  31. Zhu, L.; Gong, H.; Li, X.; Wang, R.; Chen, B.; Dai, Z.; Teatini, P. Land subsidence due to groundwater withdrawal in the northern Beijing plain, China. Eng. Geol. 2015, 193, 243–255. [Google Scholar] [CrossRef]
  32. Hu, B.; Wang, H.-S.; Sun, Y.-L.; Hou, J.-G.; Liang, J. Long-term land subsidence monitoring of Beijing (China) using the small baseline subset (SBAS) technique. Remote Sens. 2014, 6, 3648–3661. [Google Scholar] [CrossRef]
  33. Zhang, Y.; Wu, H.A.; Kang, Y.; Zhu, C. Ground subsidence in the Beijing-tianjin-hebei region from 1992 to 2014 revealed by multiple sar stacks. Remote Sens. 2016, 8, 675. [Google Scholar] [CrossRef]
  34. Yang, Y.; Luo, Y.; Liu, M.; Wang, R.; Wang, H. Research of features related to land subsidence and ground fissure disasters in the Beijing plain. Proc. Int. Assoc. Hydrol. Sci. 2015, 372, 239–242. [Google Scholar] [CrossRef]
  35. Beijing Geology and Mineral Resources Exploration and Development Bureau; Hydrogeology and Engineering Geology Team of Beijing. Physical Geography and Regional Geological Settings. Groundwater of Beijing; China Land Publishing House: Beijing, China, 2008; pp. 1–23.
  36. Zhang, Y.; Ma, Y.; Nong, Y.; Wei, S.; Dong, S. Cenozoic extensional stress evolution in north china. J. Geodyn. 2003, 36, 591–613. [Google Scholar]
  37. Zhang, Y.G.; Zheng, W.J.; Wang, Y.J.; Zhang, D.L.; Tian, Y.T.; Wang, M.; Zhang, Z.Q.; Zhang, P.Z. Contemporary deformation of the north china plain from global positioning system data. Geophys. Res. Lett. 2018, 45, 1851–1859. [Google Scholar] [CrossRef]
  38. Wang, Z.; Cai, X.; Yan, J.; Wang, J.; Liu, Y.; Zhang, L. Using the integrated geophysical methods detecting active faults: A case study in beijing, china. J. Appl. Geophys. 2017. [Google Scholar] [CrossRef]
  39. Liu, S. Magnetostratigraphic research on the structural activeties of the faults in the beiqijia area of beijing plain. Master's Thesis, University of Geosciences, Beijing, China, 2013. [Google Scholar]
  40. Zhang, L.; Bai, L.; Cai, X.; Wang, J.; Liu, Y.; He, F.; Wang, Z.; He, J. An analysis of the activity of the northwest part of nankou-sunhe fault. Geol. China 2014, 41, 902–911. [Google Scholar]
  41. Jiao, Q.; Qiu, Z. Research progress of major active faults. Bull. Inst. Crustal Dyn. 2006, 78–90. [Google Scholar]
  42. Zhao, Y.; Cai, X.M.; Wang, J.M.; Zhang, L.; Liu, Y.; Lv, J.B. The division of“small blocks”of structure in beijing plain and a discussion on the activity of micro block in quaternary period. Geol. China 2015, 6, 1807. [Google Scholar]
  43. Kampes, B.M.; Adam, N. Velocity field retrieval from long term coherent points in radar interferometric stacks. In Proceedings of the 2003 IEEE International Geoscience and Remote Sensing Symposium (IGARSS 2003), Toulouse, France, 21–25 July 2003; Volume 942, pp. 941–943. [Google Scholar]
  44. Hsu, W.-C.; Chang, H.-C.; Chang, K.-T.; Lin, E.-K.; Liu, J.-K.; Liou, Y.-A. Observing land subsidence and revealing the factors that influence it using a multi-sensor approach in Yunlin county, Taiwan. Remote Sens. 2015, 7, 8202–8223. [Google Scholar] [CrossRef]
  45. Hooper, A. Statistical-cost approach to unwrapping the phase of insar time series. In Proceeding of the 2010 International Workshop on ERS SAR Interferometry, Frascati, Italy, 30 November–4 December 2010; pp. 1–5. [Google Scholar]
  46. He, Q.-C.; Liu, W.-B.; Li, Z.-M. Land subsidence survey and monitoring in the north China plain. Geol. J. China Univ. 2006, 12, 195–209. [Google Scholar]
  47. Casu, F.; Manzo, M.; Lanari, R. A quantitative assessment of the sbas algorithm performance for surface deformation retrieval from dinsar data. Remote Sens. Environ. 2006, 102, 195–210. [Google Scholar] [CrossRef]
  48. Chen, F.; Wu, Y.; Zhang, Y.; Parcharidis, I.; Ma, P.; Xiao, R.; Xu, J.; Zhou, W.; Tang, P.; Foumelis, M. Surface motion and structural instability monitoring of ming dynasty city walls by two-step tomo-psinsar approach in Nanjing city, China. Remote Sens. 2017, 9, 371. [Google Scholar] [CrossRef]
  49. Deng, Z.; Ke, Y.; Gong, H.; Li, X.; Li, Z. Land subsidence prediction in Beijing based on ps-insar technique and improved grey-markov model. Gisci. Remote Sens. 2017, 54, 797–818. [Google Scholar] [CrossRef]
  50. Zhao, H.; Fan, J.; Guo, X.; Chen, J.; Xia, Y.; Ge, D.; Zhang, L.; Qiu, Y.; Zhong, C. Detection of land subsidence in Beijing, China, using interferometric point target analysis technique. In Proceedings of the Geoscience and Remote Sensing Symposium, Honolulu, HI, USA, 25–30 July 2010; pp. 1553–1556. [Google Scholar]
  51. Gao, M.; Gong, H.; Chen, B.; Zhou, C.; Chen, W.; Liang, Y.; Shi, M.; Si, Y. Insar time-series investigation of long-term ground displacement at Beijing capital international airport, China. Tectonophysics 2016, 691, 271–281. [Google Scholar] [CrossRef]
  52. Zhou, C.; Gong, H.; Chen, B.; Li, J.; Gao, M.; Zhu, F.; Chen, W.; Liang, Y. Insar time-series analysis of land subsidence under different land use types in the eastern Beijing plain, China. Remote Sens. 2017, 9, 380. [Google Scholar] [CrossRef]
  53. Chen, J.; Gao, J.; Chen, W. Urban land expansion and the transitional mechanisms in Nanjing, China. Habitat Int. 2016, 53, 274–283. [Google Scholar] [CrossRef]
  54. Zhang, Z.; Jia, D.; Deng, S.; Jin, X. Quantitative research of urban spatial morphology: A case study of the main urban zone of Chongqing. J. Geo-Inf. Sci. 2013, 15, 297–306. [Google Scholar] [CrossRef]
  55. Cigna, F.; Del Ventisette, C.; Liguori, V.; Casagli, N. Advanced radar-interpretation of insar time series for mapping and characterization of geological processes. Nat. Hazards Earth Syst. Sci. 2011, 11, 865–881. [Google Scholar] [CrossRef] [Green Version]
  56. Terzaghi, K. Settlement and consolidation in clay. Eng. News Rec. 1925, 95, 874–878. [Google Scholar]
Figure 1. Geographic location of the study area and coverages of Synthetic Aperture Radar (SAR) data sets monitoring in the region. Red lines stand for major faults in the study area. The background is a shaded relief DEM (Digital Elevation Model). Nankou–Sunhe Fault (Fa-1), Huangzhuang–Gaoliying Fault (Fb-1), Liangxiang–Shunyi Fault (Fb-2), Nanyuan–Tongxian Fault (Fb-3), Lixian–Niubaotun Fault (Fb-4).
Remotesensing 10 00552 g001
Figure 2. Temporal and perpendicular baselines of interferograms. The black cube, red circle and blue triangle symbols represent ENVISAT ASAR, RADARSAT-2 and TerraSAR-X images, respectively. The centers are the master images, the lines represent the individual interferograms between slave images and the public master images.
Remotesensing 10 00552 g002
Figure 3. Mean subsidence rate derived from Persistent Scatterer Interferometry (PSI): (a) ENVISAT ASAR during the period from June 2003 to August 2010; (b) RADARSAT-2 June 2011 to December 2015 and (c) TerraSAR-X April 2010 to December 2015. The rectangle in (a) and (b) is the boundary of TerraSAR-X image.
Remotesensing 10 00552 g003
Figure 4. Comparison of PSI results from ENVISAT ASAR and the Leveling measurement results at Pinggezhuang station (PGZ) and Beiqijiazhen (BQJZ). The error range of PSI results is ±5 mm. The cumulative deformation points are relative to the date of 26 June 2008 in (a), and 1 January 2010 in (b).
Remotesensing 10 00552 g004
Figure 5. Cross-validation of the deformation results by PSI. (a) ENVISAT ASAR PS (black) and the nearest TerraSAR-X PS (colored); (b) The correlation between ENVISAT ASAR and TerraSAR-X; (c) RADARSAT-2 PS (black) and the nearest TerraSAR-X PS (colored); (d) Correlation between RADARSAT-2 and TerraSAR-X. (The blue lines in b) and (d) represent the y = x relationship).
Remotesensing 10 00552 g005
Figure 6. Subsidence bowls by mean deformation velocity from 2003 to 2015. (CT: Chaoyang–Tongzhou; TZ: Tongzhou; CJ: Chaoyang–Jinzhan; CL: Chaoyang–Laiguangying; SY: ShunYi; CP: ChangPing; and HD: Haidian Subsidence Bowl).
Remotesensing 10 00552 g006
Figure 7. Time series cumulative subsidence of the typical points: A–G (marked in Figure 6) from June 2003 to December 2015, representing each of the seven major subsidence bowls.
Remotesensing 10 00552 g007
Figure 8. Cumulative deformation along the profiles A–A’ and B–B’ from 2003 to 2015 (the locations of the profiles are shown in Figure 6).
Remotesensing 10 00552 g008
Figure 9. The distribution of different deformation rate contour lines from −40 to −120 mm/year during the period from 2003 to 2015.
Remotesensing 10 00552 g009
Figure 10. The spatial evolution characteristic of land subsidence region from 2003 to 2015 with Equal Fan Analysis Method.
Remotesensing 10 00552 g010
Figure 11. Differential subsidence region derived from Subsidence Rate Slope.
Remotesensing 10 00552 g011
Figure 12. Relationship between the variation of hydraulic head and displacement. All of the cumulative deformation maps are relative to the first image in 2003.
Remotesensing 10 00552 g012
Figure 13. Comparison of subsidence with water-level change from 2005 to 2010. The cumulative deformations are relative to the first image in the year of 2003. The location of the monitoring wells are shown in Figure 6.
Remotesensing 10 00552 g013
Table 1. The parameters of the SAR data used.
ParameterENVISAT ASARRADARSAT-2TerraSAR-X
BandCCX
Wavelength (cm)5.65.53.1
PolarizationVVVVHH
Orbit directionsDescendingDescendingAscending
Track No.2218601158
Incidence angle (°)22.927.633.1
Heading (°)−164−168.8−10
Spatial resolution (m)30303
No. of images484051
Date rangeJune 2003–August 2010June 2011–December 2015April 2010–December 2015
Table 2. The Expanding Area in Different Directions.
DirectionExpanding Area (km2)Rate (km2/Year)DirectionExpanding Area (km2)Rate (km2/Year)
N24.461.88S00
NNE56.324.33SSW00
NE63.264.87SW00
NEE71.815.52SWW00
E146.8711.30W00
SEE95.667.36NWW00
SE27.532.12NW20.111.55
SSE00NNW26.932.07

