A Novel Affine and Contrast Invariant Descriptor for Infrared and Visible Image Registration


1
Xi’an Microelectronics Technology Institute, Xi’an 710068, China
2
University of Chinese Academy of Sciences, Beijing 100049, China
*
Author to whom correspondence should be addressed.
Remote Sens. 2018, 10(4), 658; https://doi.org/10.3390/rs10040658
Submission received: 2 April 2018
/
Revised: 15 April 2018
/
Accepted: 19 April 2018
/
Published: 23 April 2018
(This article belongs to the Special Issue Learning to Understand Remote Sensing Images)
Abstract
:Infrared and visible image registration is a very challenging task due to the large geometric changes and the significant contrast differences caused by the inconsistent capture conditions. To address this problem, this paper proposes a novel affine and contrast invariant descriptor called maximally stable phase congruency (MSPC), which integrates the affine invariant region extraction with the structural features of images organically. First, to achieve the contrast invariance and ensure the significance of features, we detect feature points using moment ranking analysis and extract structural features via merging phase congruency images in multiple orientations. Then, coarse neighborhoods centered on the feature points are obtained based on Log-Gabor filter responses over scales and orientations. Subsequently, the affine invariant regions of feature points are determined by using maximally stable extremal regions. Finally, structural descriptors are constructed from those regions and the registration can be implemented according to the correspondence of the descriptors. The proposed method has been tested on various infrared and visible pairs acquired by different platforms. Experimental results demonstrate that our method outperforms several state-of-the-art methods in terms of robustness and precision with different image data and also show its effectiveness in the application of trajectory tracking.

1. Introduction
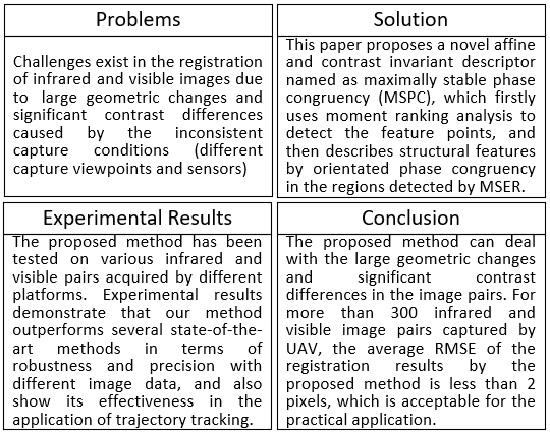
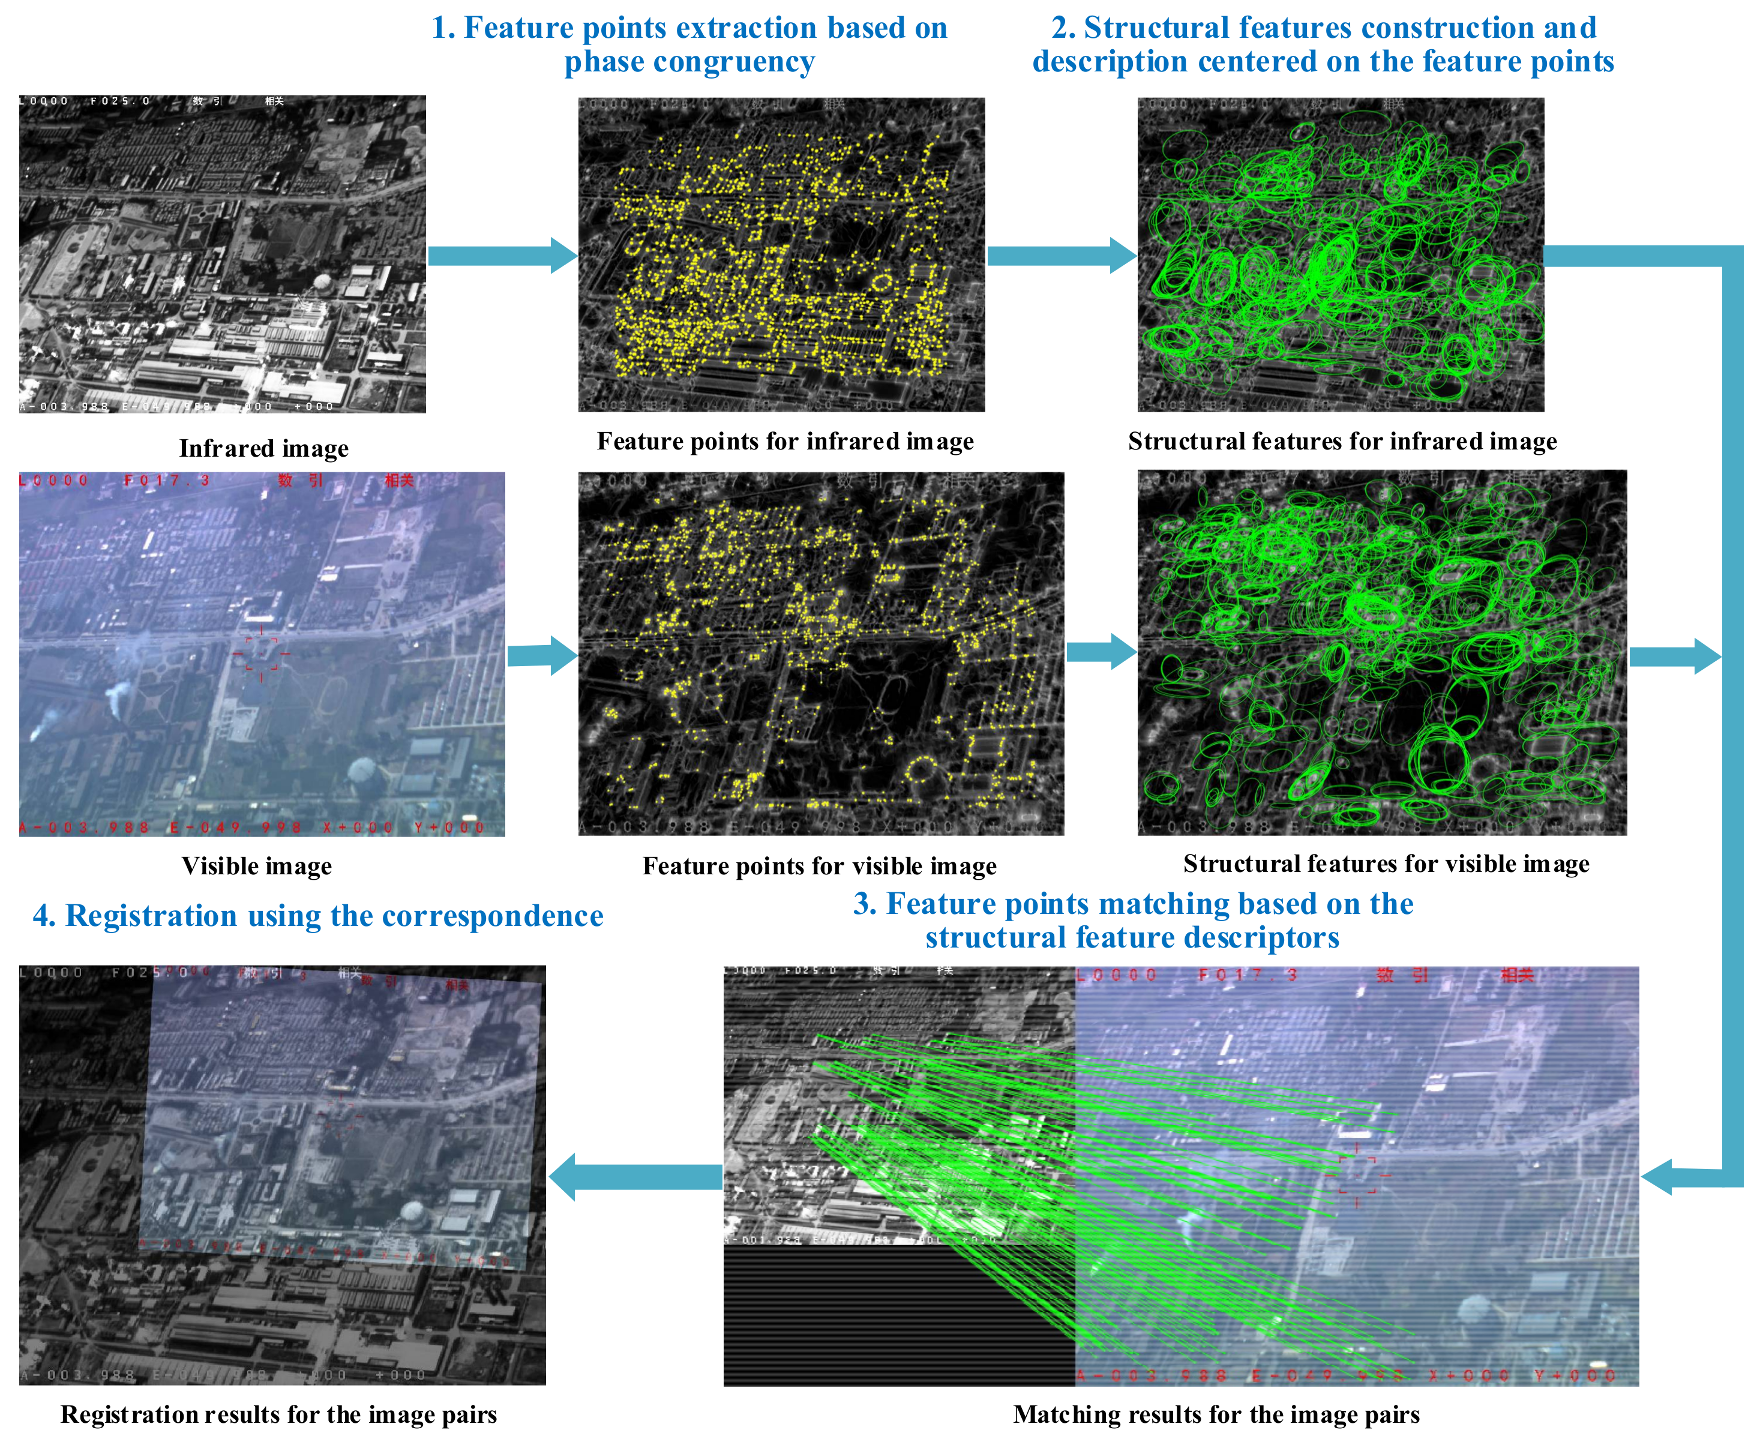
In recent years, the rapid development of sensor technology has made it possible to fully perceive an object in complicated scenes. As the two most common visual sensors, infrared and visible sensors are widely applied in various kinds of optoelectronic systems [1]. To make use of both sensors simultaneously, a prerequisite is to achieve the image registration, which is a process of aligning two or more images of a same scene captured by different sensors, at different times, or from distinct viewpoints [2]. The accuracy of image registration has a significant impact on many computer vision tasks, such as image fusion [3], image mosaic, visual-based navigation, and object recognition. In the registration field, infrared and visible image registration is very challenging work mainly due to two reasons. First, as a result of the differences in imaging mechanisms, the same scene’s content may be represented by different intensity values, which means that images from two different sources have poor consistency in contrast. This makes it difficult to find the correspondence based on their intensity or gradient values directly, which can be seen from Figure 1. Second, he various intrinsic and extrinsic sensing conditions may lead to large geometric deformations that exist between the images, which further increase the difficulty of registration. A number of related methods have been proposed and applied successfully in the situation where the geometric changes are small [4,5,6,7,8] or can be greatly alleviated according to the capture information [9,10]. However, automatic infrared and visible image registration has not been solved effectively in complicated environments with large geometric changes and significant differences in contrast.
This paper presents a novel affine and contrast invariant descriptor for the automatic registration of infrared and visible images. The proposed method detects the significant feature points based on moment ranking analysis and constructs structural features via merging phase congruency images in multiple orientations. This embodies the significance of feature points maximally and makes structural features to be contrast invariant. Descriptors of orientated phase congruency centered on the feature points are constructed in the affine invariant regions detected by maximally stable extremal regions (MSER), which ensures that the descriptors are affine invariant. This paper is organized as follows. Related works in registration for infrared and visible images are described in Section 2. The proposed registration method using a novel affine and contrast invariant descriptor is described in detail in Section 3. Comparative and applied experimental results are discussed in Section 4. Finally, conclusions are drawn, and future work is discussed in Section 5.
2. Related Works
At present, the registration methods for infrared and visible image can be classified into two categories: global region-based methods and local features-based methods. Global region-based methods obtain correspondence by using the whole image content in spatial domain or transform domain, which mainly include mutual information (MI) [8,11,12], phase correlation (PC) [4], Fourier transform [6,13], particle swarm optimization (PSO) [7], gradient information [5,14], and template correlation matching [15,16]. Those methods can get remarkable performance for images with small geometric changes or medical images with high correlation in global intensity. However, contrast reversal, occlusion, uneven heated, and clutters occur frequently in some regions of input images, which result in the global region-based methods being unable to achieve an accurate registration.
In contrast to global region-based methods, local feature-based methods utilize the extracted features to establish correspondence, and they are generally divided into two groups: typical features-based methods and structural features-based methods. In the first group, extracted typical features include edges [17], lines [18,19,20,21,22], contours [23], gradient distribution [15,24], and their variants [25,26,27,28]. Those methods above are robust in response to geometrical changes, occlusion, background clutter, and noise. However, they treat all content equally, such that they are highly sensitive to structural disparities caused by insignificant structures. This results in serious degradation in matching performance when large differences in contrast appeared in input images. Two images obtained from the same scene using different modalities may have significantly different intensity characteristics but should have very similar structural features. Therefore, the structural features of the disparate images can be compared in a direct fashion.
Compared with the typical features-based methods, structural features-based methods can extract more robust common features from different modalities and are less sensitive to the contrast differences. Due to these advantages, they have been successfully applied to multimodal image registration [10,21,28,29,30,31,32,33]. As a valid structural feature extraction method, phase congruency was proposed by Morrone et al. [34], which is the ratio of local energy to the overall path length taken by the local Fourier components in reaching the endpoint. To improve the insensitivity of phase congruency to noise and provide good localization, Kovesi proposed a new sensitivity measure and noise compensation method for phase congruency, which can locate the features that remain constant over scales [35]. Subsequently, Kovesi presented a highly localized feature detector whose responses are invariant to image contrast [36]. These properties make local phase congruency an effective method for creating a structural representation of the images. Wong and Orchard [29] constructed local phase-coherent representations of images and applied their method to multimodal medical image registration successfully. Xia et al. [30] combined phase congruency representations of images with scale-invariant feature transform (SIFT) to achieve multimodal medical image registration. Recently, Liu et al. [31] proposed mean local phase angle (MLPA) and frequency spread phase congruency (FSPC) by using local frequency information on Log-Gabor wavelet transformation space, which improved the robustness compared with traditional multimodal matching. Based on the structural properties of images, Ye et al. [10] developed the histogram of orientated phase congruency (HOPC) descriptor, which outperforms several methods in matching performance. These registration methods that relate to phase congruency are robust against complex nonlinear radiometric differences and have good performance on image pairs with slight geometric changes. However, they cannot obtain satisfactory results for image pairs with large geometric deformations. Zhao et al. [21] proposed a novel multimodality robust line segment descriptor (MRLSD) and developed a MRLSD matching method, which can deal with large-scale and rotation changes in image pairs, while the registration results are poor when line segments or edges are deficient in some regions.
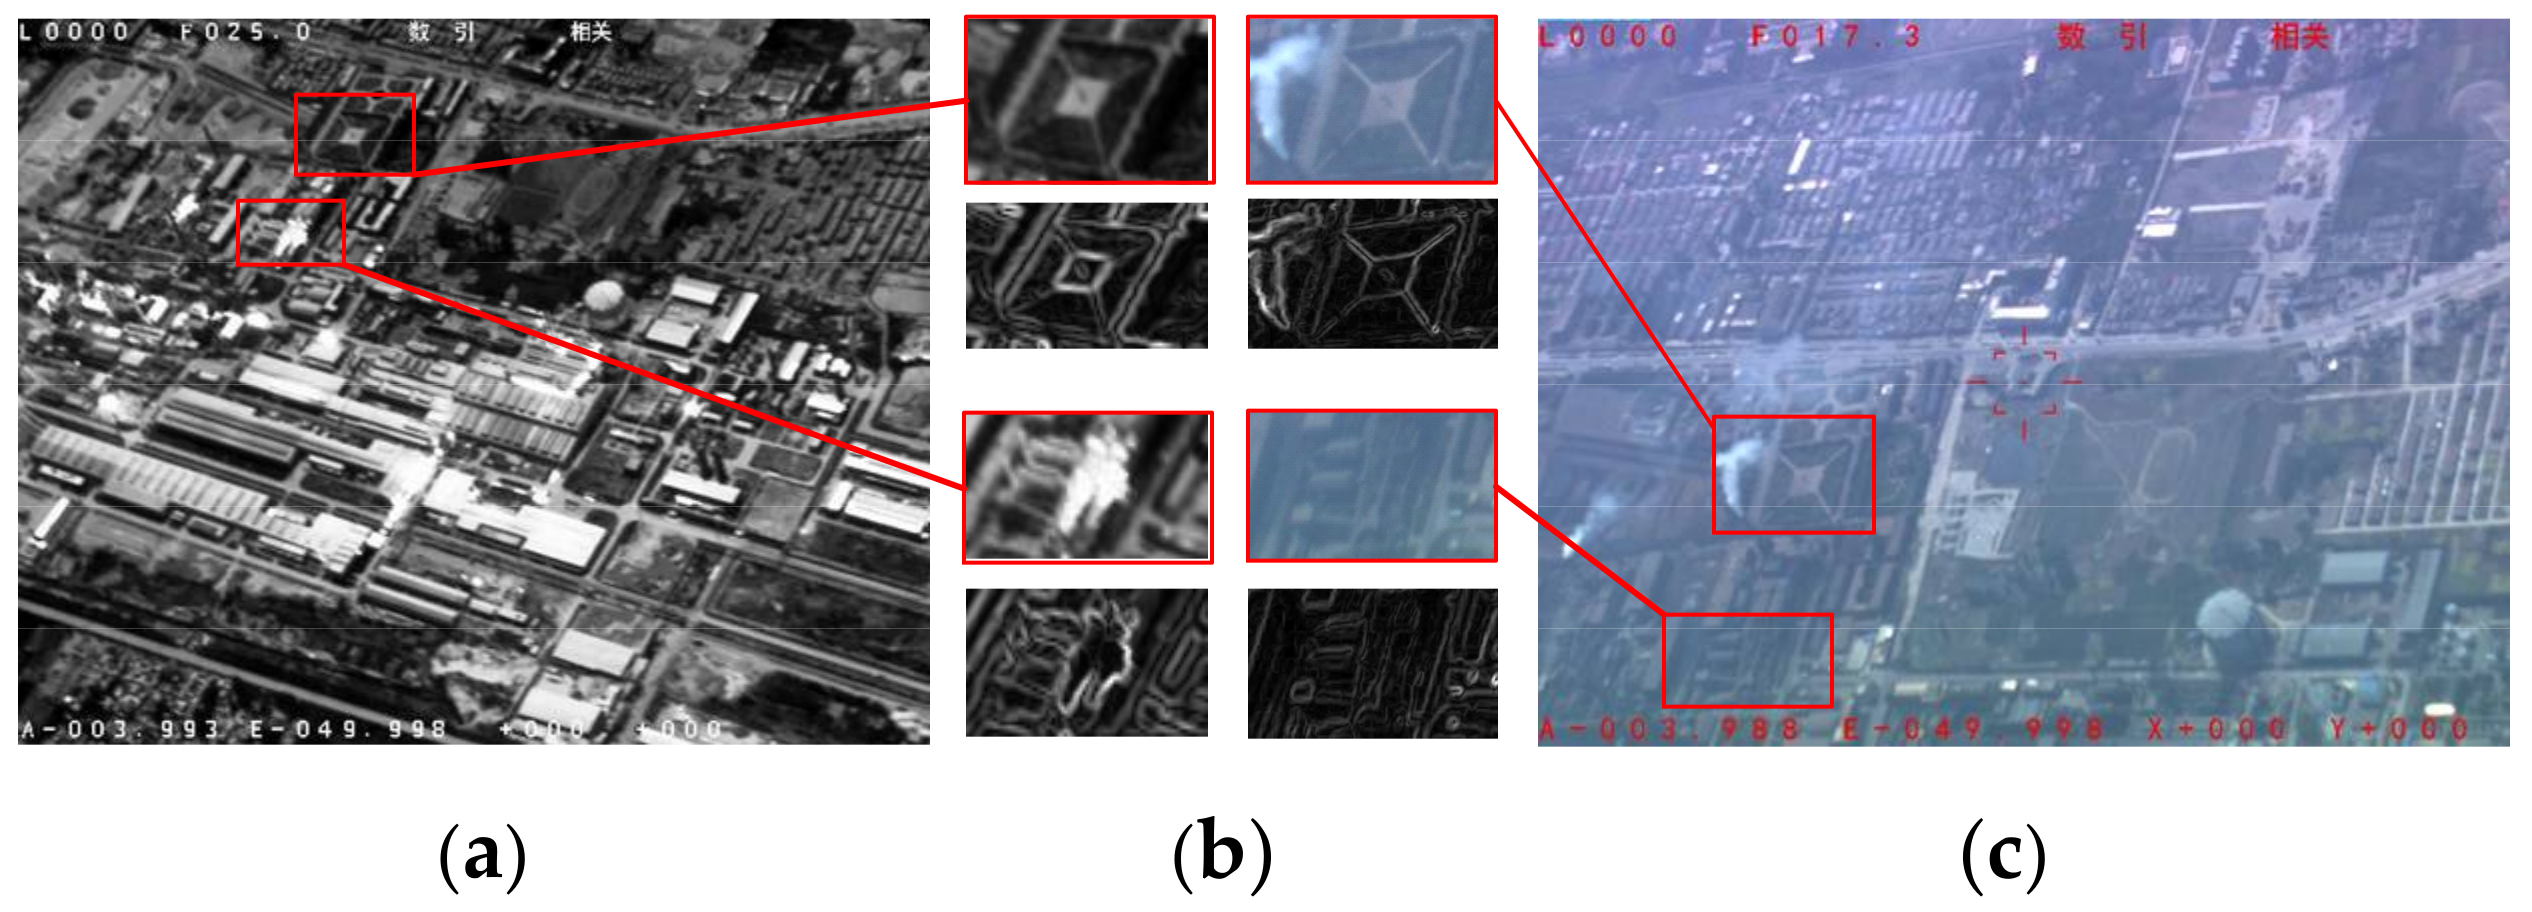
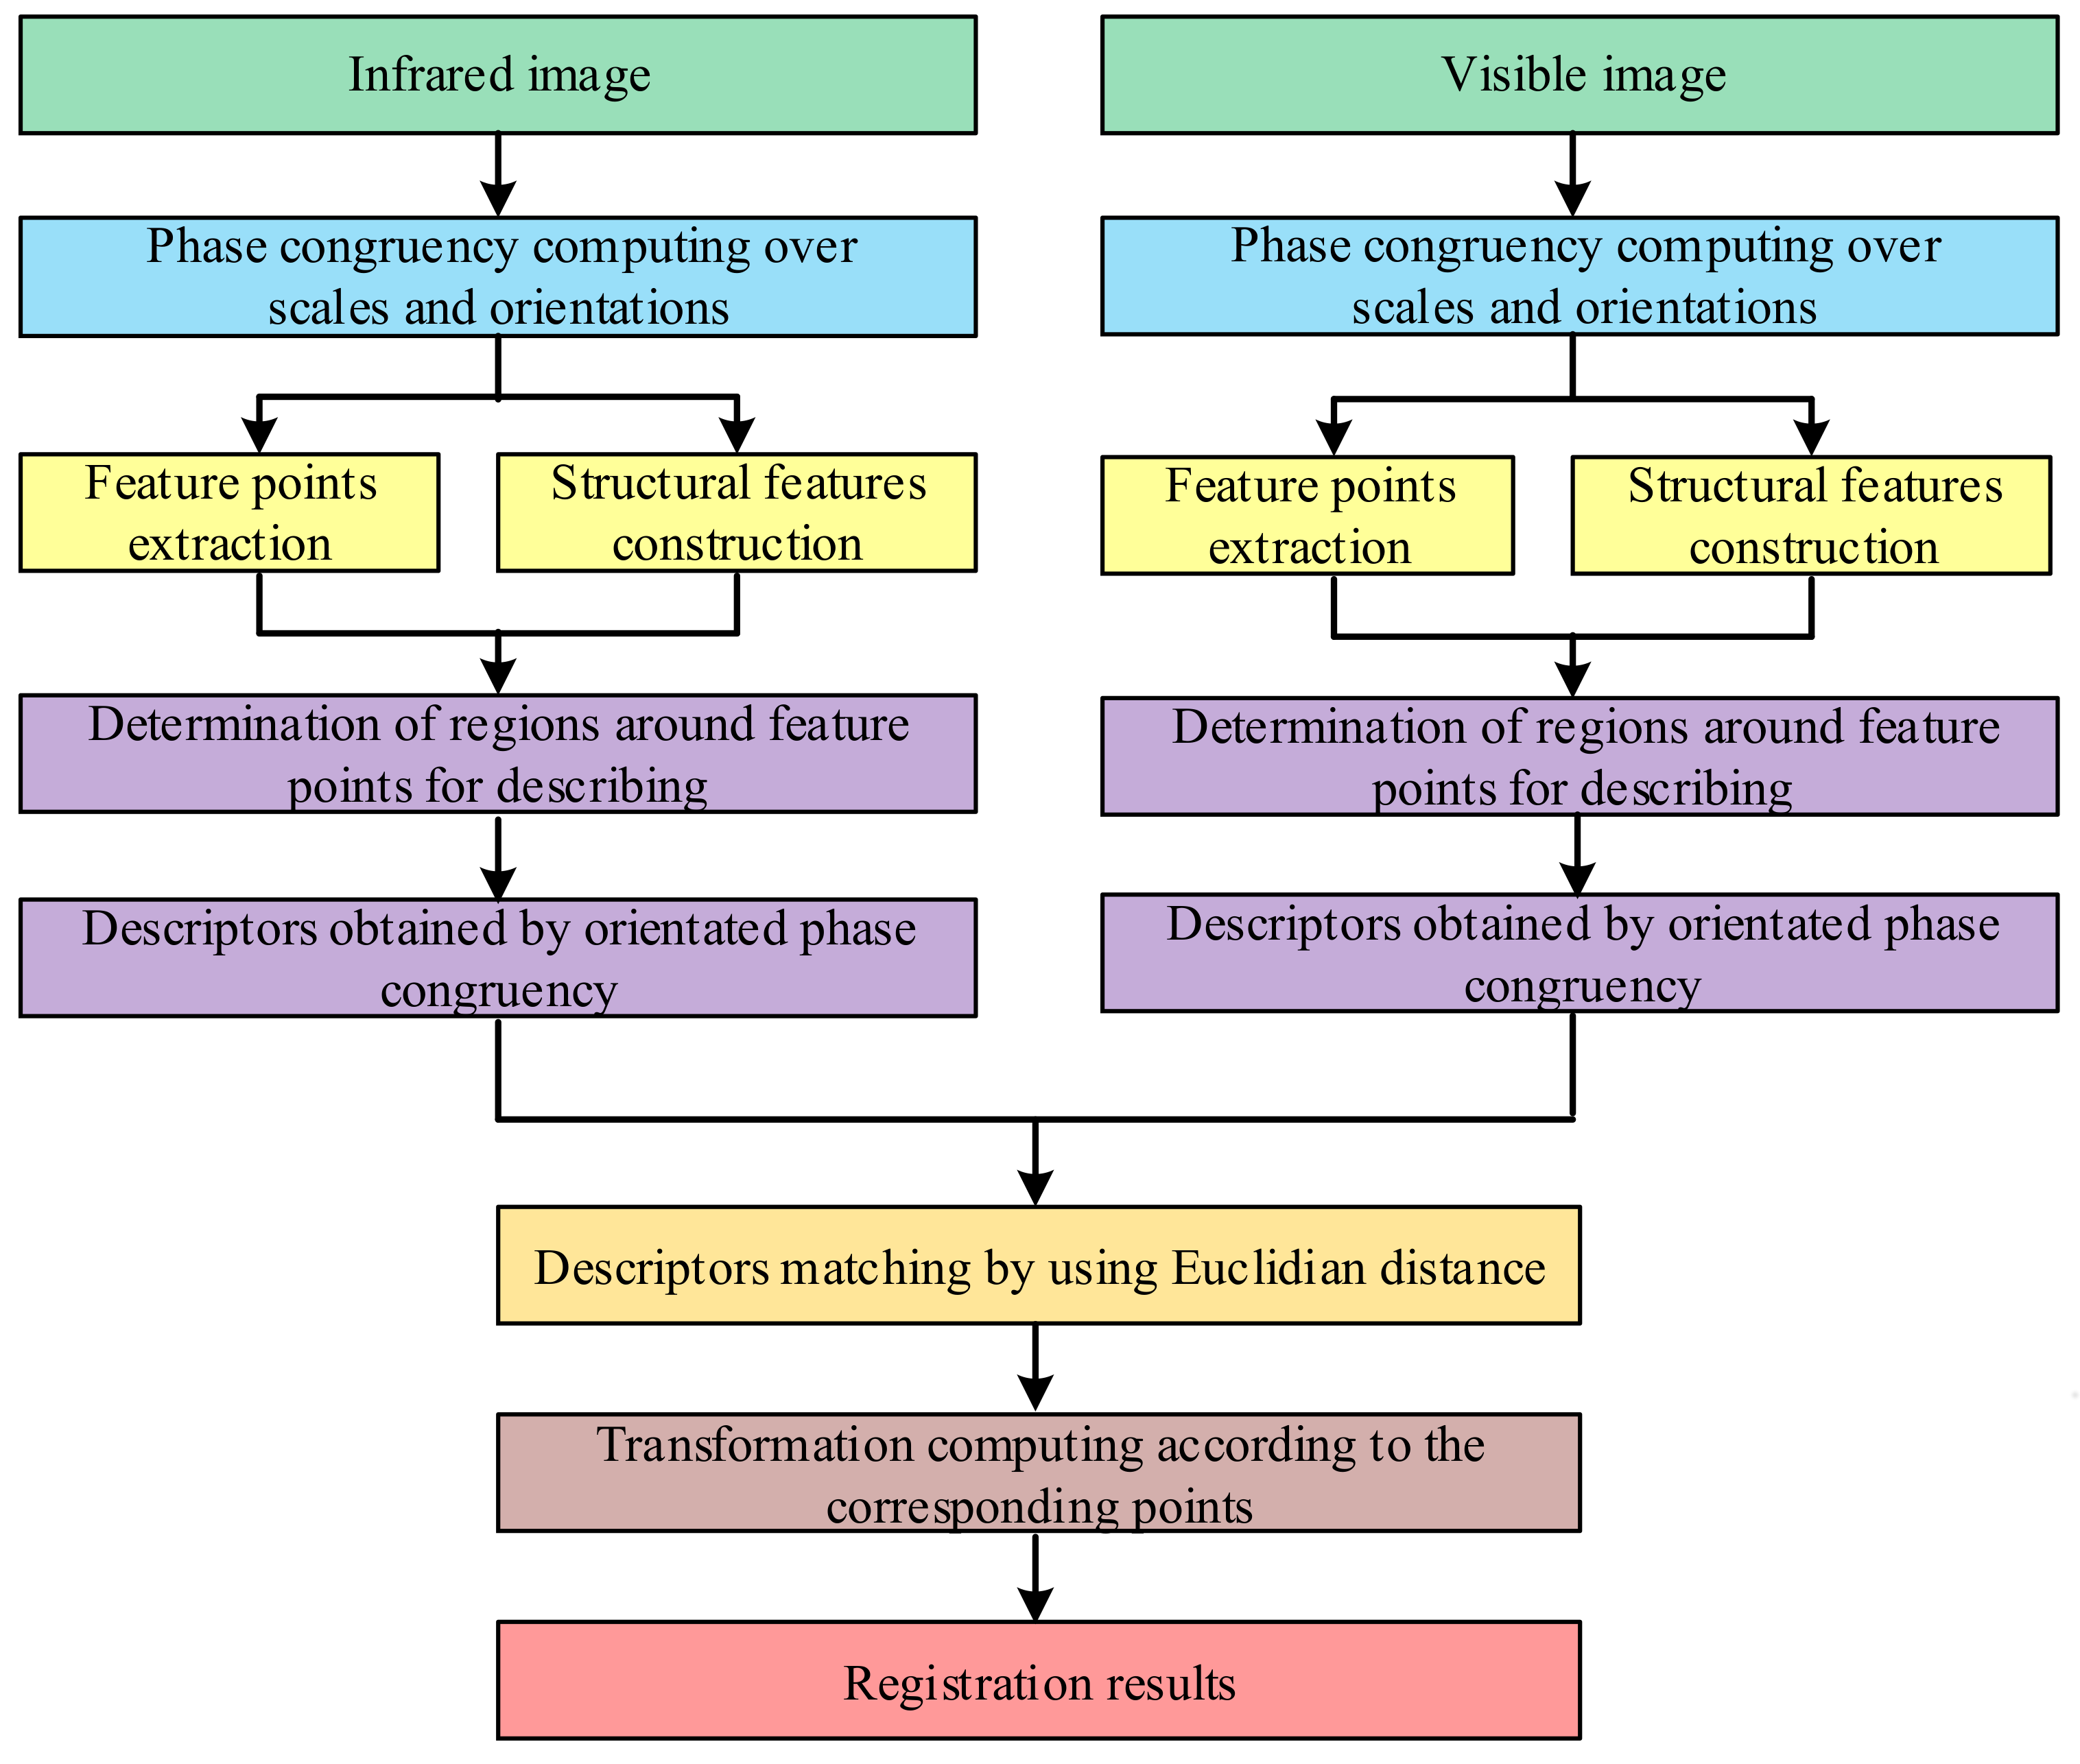
Motivated by the phase congruency-related methods [10,21,31], this paper develops an affine and contrast invariant descriptor and presents a robust registration method based on that descriptor. Firstly, feature points are extracted based on the moment analysis over orientations. Then, the coarse description regions are estimated by Log-Gabor response over scales and orientations centered on the feature points, and the descriptors are constructed by the orientations on the fine regions detected by MSER. Finally, the registration is achieved according to the correspondence of descriptors between image pairs. The whole process of the proposed method is shown in Figure 2.
3. Methodology
The key issues in infrared and visible registration are what type of features should be detected and how to extract the feature form input images. With the idea that feature points of high perceptual significance coincide with points of high structural significance within an image, the salient feature points (SFP) detection method based on the moment analysis in phase congruency images is presented in Section 3.1. Then, the approach of construction for the maximally stable phase congruency (MSPC) descriptor, using orientated phase congruency and MSER [37], is developed in detail in Section 3.2. Finally, the algorithm of registration for infrared and visible image is described in Section 3.3.
3.1. Salient Feature Points Detection
The measure of phase congruency developed by Morrone et al. [34] is follows:
where is an amplitude of Fourier components at a location in a signal, and is the magnitude of the vector from the origin to the endpoint. From the definition above, if all the Fourier components are in phase, all the complex vectors would be aligned, and would be 1. If there is no coherence of phase, falls to a minimum of 0. Phase congruency provides a measure that is independent of the overall magnitude of the signal, making it invariant to variations in image contrast. Subsequently, Kovesi proposed an improved measure [35] as follows:
where is a factor that weights for frequency spread, and is an amplitude of Fourier components at a location . and are phase angle and weighted mean phase angle, respectively. is a small constant, and is a threshold that eliminates noise influence. The symbol denotes that the enclosed quantity is equal to itself when its value is positive and zero otherwise. Based on the measure, Kovesi presented a highly localized feature detector whose responses are invariant to image contrast [36], which consists of the following steps:
- (1)
- Compute the moment analysis equations at each point in the image as follows:where refers to the phase congruency value determined at orientation .
- (2)
- The minimum moment matrix and principal axis matrix are given by
If the minimum moment of phase congruency is still large, then it means that the point should be marked as a ‘corner’. The principal axis, corresponding to the axis about which the moment is minimized, provides an indication of the orientation of the feature. Thus, the minimum moment is used for detecting the feature points, and the principal axis matrix is used to guide the construct of the structural feature image in Section 3.2.
Therefore, the SFP extraction (MSFPE) based on salient ranking can be expressed as follows:
- (1)
- Compute the minimum moment matrix at each point in the input image using (2)–(6).
- (2)
- To ensure the significance of feature points, candidate feature points are obtained by filtering :where is the mean of values that are larger than 0.1 and adaptive to matrix .
- (3)
- To make the feature points distributed uniformly, we extract from by using non-maximum suppress in the neighborhood of :
- (4)
- The significance ranking space is built by sorting the positions in according to corresponding value in from maximum to minimum.
- (5)
- The top of significance ranking space are selected as SFP.
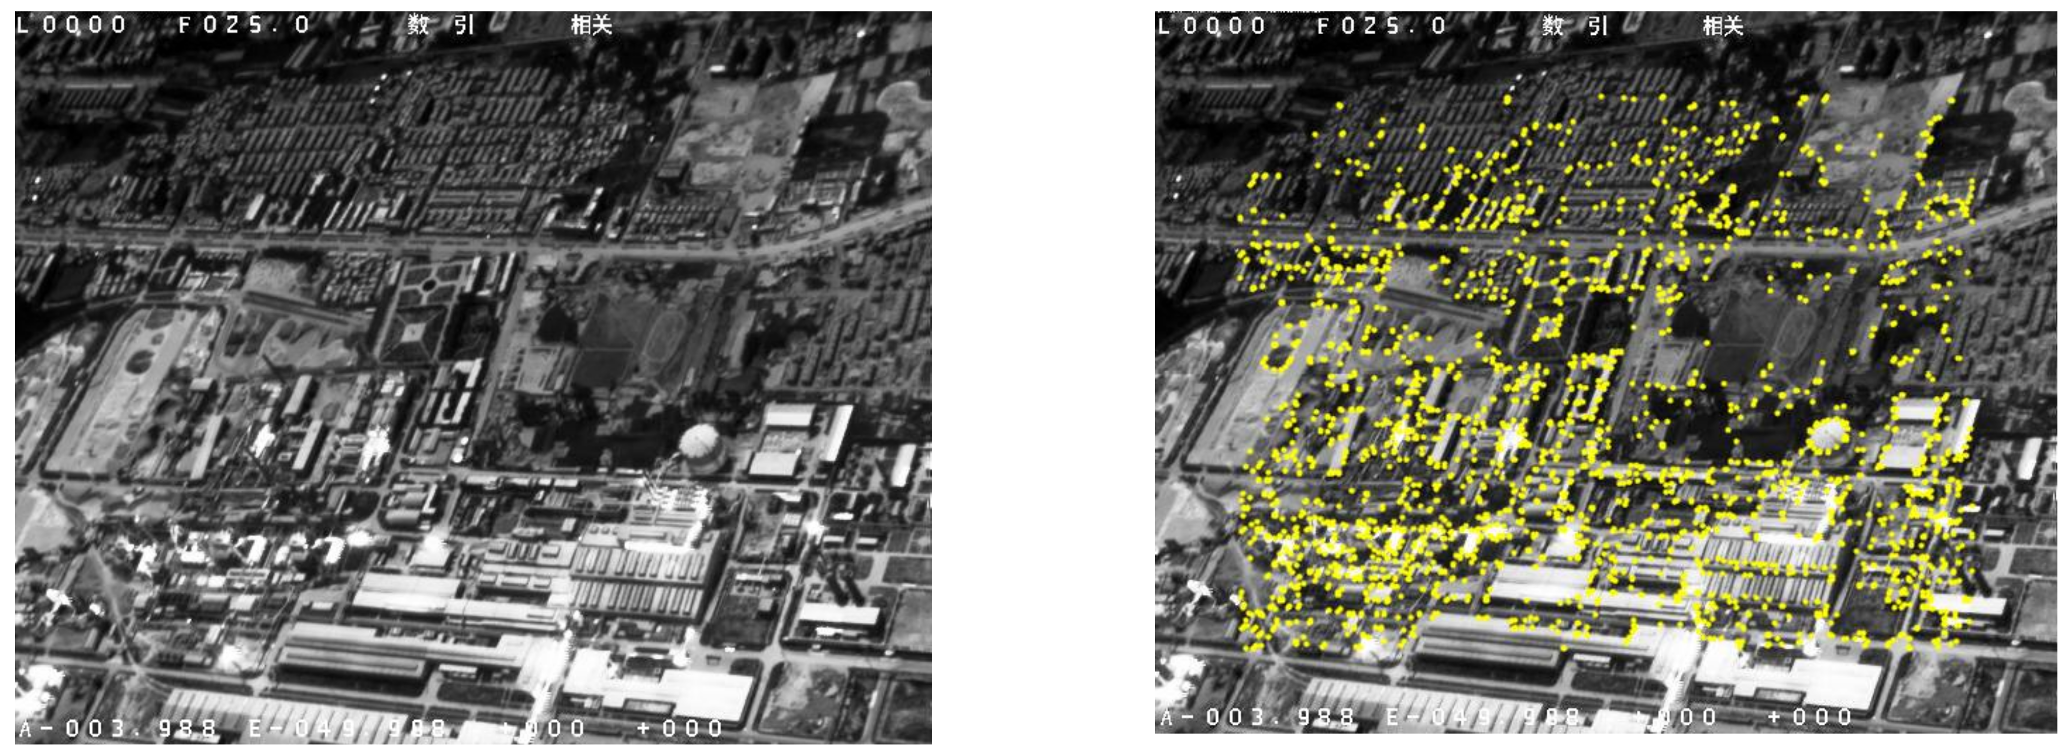
In the above algorithm, the non-maximal suppression over a 5 × 5 neighborhood of a candidate feature point is adopted to ensure the uniform distribution of feature points. An example for feature points extraction using MSFPE is shown in Figure 3. It can be seen that the feature points are not only significant, but also distributed uniformly in the whole image.
3.2. Maximally Stable Phase Congruency Descriptor
Salient feature points indicate that there are significant features around them. Hence, to improve the robustness of feature matching, the description for structural features centered on the feature points in an image is necessary. Consequently, a method of construction for structural features using multi-orientation phase congruency is proposed, and the generation of the MSPC descriptor based on the structural features is developed in this section.
3.2.1. Structural Features Extraction
The calculation model of phase congruency was improved by Kovesi [35] using Log-Gabor wavelets over multiple scales and orientations. To make full use of multi-orientation phase congruency, we construct the structural features from multiple phase congruency images over orientations according to the principal axis information. The detailed calculation steps of the structural features extraction (SFE) are shown as follows:
- (1)
- Compute different phase congruency images with and the principal axis matrix from the input image using (2)–(7).
- (2)
- To embody the significance of structural features over the image maximumly, structural features image (SFI) is constructed from different according to the principal axis matrix . The value at in SFI can be expressed as follows:wherewhere is the phase congruency image corresponding to .
In the algorithm above, each value of SFI is from a special matrix , and is the closest orientation to the corresponding value in , which ensures that each point of SFI has a maximum response in all orientations. The construction of structural features can be seen in Figure 4.
3.2.2. Affine Invariant Structural Descriptor
In order to produce an affine invariant descriptor for a feature point, the coarse shape of the region to be described centered on the feature point should be estimated first. Similar to SIFT [24], the coarse shape can be determined by the feature point’s scale and orientation, which can be computed by the responses of Log-Gabor wavelets over multiple scales and orientations.
In frequency domain, the Log-Gabor function is defined as
where is the central frequency, and is the related width parameter. Let denote the image, and denote the even-symmetric and odd-symmetric component of Log-Gabor function at the scale and orientation , respectively. The responses of each quadrature pair of filters can be expressed as
The values and can be regarded as real and imaginary parts of a complex valued frequency component. The amplitude and phase of the responses at the scale and orientation are given by
The orientation for a point in phase congruency is defined as
We can see that the results computed by (7) and (19) are the same. The coarse scale of a point can be obtained based on the responses of Log-Gabor filters, along with its orientation over scales in phase congruency, which can be computed as follows:
where can be computed by (12) and is the closest orientation to the corresponding value in . Based on the coarse scale and orientation of a feature point , the coarse rectangle shape of its neighborhood can be estimated by
where is a two-dimensional (2D) vector that contains the length and width of the rectangle, is the rotation angle, is a given minimum size, and is the scaling factor between successive Log-Gabor filters.
Because the scale of the feature point is approximate, the rectangle neighborhood is also imprecise. Consequently, the fine ellipse region of a feature point is further obtained by MSER on the estimated coarse rectangle neighborhood from SFI according to (21), which is the definitive description area for the point and affine invariant in image content. Structural features computed by (11) indicate the degree of phase congruency in some orientations; however, they cannot represent the significant directions of feature variation [9]. Thus, it is insufficient to use only the amplitude of phase congruency to construct robust feature descriptors. Therefore, we use orientated phase congruency that is weighted by the amplitude of structural features to compute the descriptors. The construction process of the maximally stable phase congruency (MSPC) descriptor can be expressed as follows.
- (1)
- Compute the scale and orientation by using (14)–(20) for each feature point extracted by MSFPE.
- (2)
- Estimate the coarse rectangle shape of the feature point’s neighborhood by (21).
- (3)
- Get the fine ellipse region for the feature point by applying MSER to the coarse rectangle region on SFI obtained by (11).
- (4)
- Normalize the ellipse region to a circle region according to the long axis to ensure the affine invariance of the descriptor.
- (5)
- Calculate the weighted statistical histogram with four orientations distributed in by structural feature values in the circle region , in which, the weight of a certain orientation can be computed as follows:
- (6)
- The orientation histogram is normalized as a descriptor by
In the algorithm above, a circle region is divided into 4 × 4 small regions, and each small region is computed in four directions. Therefore, a circle region can be described as a vector of 64 dimensions. In the process of description, we use both the orientation and amplitude of the phase congruency to compute the descriptor in the ellipse region detected by MSER, which can effectively describe the feature distribution in the orientation and strength of phase congruency and make the descriptors to be affine invariant. The construction example of the descriptor is shown in Figure 5. From that, we can see the descriptor is robust against contrast and geometrical distortion.
3.3. Registration Using the MSPC Descriptor
After the extraction of salient feature points and the construction of the MSPC descriptors were presented in Section 3.1 and Section 3.2, the method of registration for infrared and visible images based on those feature points and descriptors is proposed in this section.
The flow chart of the registration algorithm is shown in Figure 6, and the details are described as follows.
- (1)
- Compute the phase congruency images using Log-Gabor filters over the scales and orientations from infrared and visible images, respectively.
- (2)
- Extract the salient feature points based on the moment analysis of the phase congruency images by the MSFPE algorithm proposed in Section 3.1.
- (3)
- Construct the structural features using the multi-orientation phase congruency by the SFE algorithm presented in Section 3.2.
- (4)
- Generate the descriptors for the salient feature points using the construction algorithm of the MSPC designed in Section 3.2.
- (5)
- Find the matching points via the minimization of the Euclidean distances between the descriptors and refine the matching with random sample consensus (RANSAC).
- (6)
- Obtain the transformation from the matching and achieve the image registration.
In the registration algorithm above, the affine transformation model is used for describing the geometric distortion between the input images, which can be expressed as follows:
where and are the combination of scale, rotation, stretch, and twist, and and are the translation in the horizonal direction and vertical direction, respectively. and are the coordinates of the corresponding points in the input images. The transformation parameters are estimated by applying the least squares on the corresponding point pairs in our algorithm. In addition, the significance of the feature points is ensured by minimum moment analysis and significance ranking. Affine and contrast invariance of the descriptors is guaranteed by the scale and orientation of the feature points and MSER detection. Therefore, the proposed algorithm can achieve good performance for infrared and visible images with significant contrast changes and large geometric deformation, which will be seen in Section 4.
4. Experimental Results and Analysis
To test our method in terms of validity and efficiency, three different sets of images were used in comparative and evaluative experiments in this section. There were four infrared and visible pairs from computer vision center (CVC) datasets in the first set, which are used to evaluate the matching performance of the proposed method via a comparison with multimodal-SURF (MM-SURF) [27], fast visual salient and descriptor-rearranging (FVS-DR) [28], local frequency information (LFI) [31], MRSLD [21], and HOPC [10]. The second image set contained 300 image pairs captured from electro-optical pod (EOP) on unmanned aerial vehicle (UAV) with discontinuous focus length change from 25 to 300 in a mid-wavelength infrared camera and from 6.5 to 130.2 in a visible camera. Those remote sensing images were used to test the validity of our method for registration with significant contrast change and large geometric distortion. Several registration results of our method have been given, and the corresponding registration errors have been compared with those of the related methods. The third image set contained one large Google image and 40 infrared images captured from EOP on UAV, which are used to confirm the practicability of the proposed method in trajectory tracking.
For evaluating the matching performance, precision and repeatability are employed, which can be expressed as follows:
where and are the number of correct matched and total correct matched point pairs, respectively, and and are the number of feature points extracted from the reference and sensed image, respectively. For each feature point in the reference image, we compare its mapped point with the corresponding point in the sensed image. If the Euclidean distance is less than 3 pixels, the match is considered to be correct.
To assess the registration results, root-mean-square error (RMSE) is used in the overlapped area between the reference image and the transformed sensed image, which is calculated as follows:
where , are the coordinates of pixels in the reference image and the transformed sensed image, respectively, and is the number of pixels in their overlapped area.
4.1. Comparative Experiments
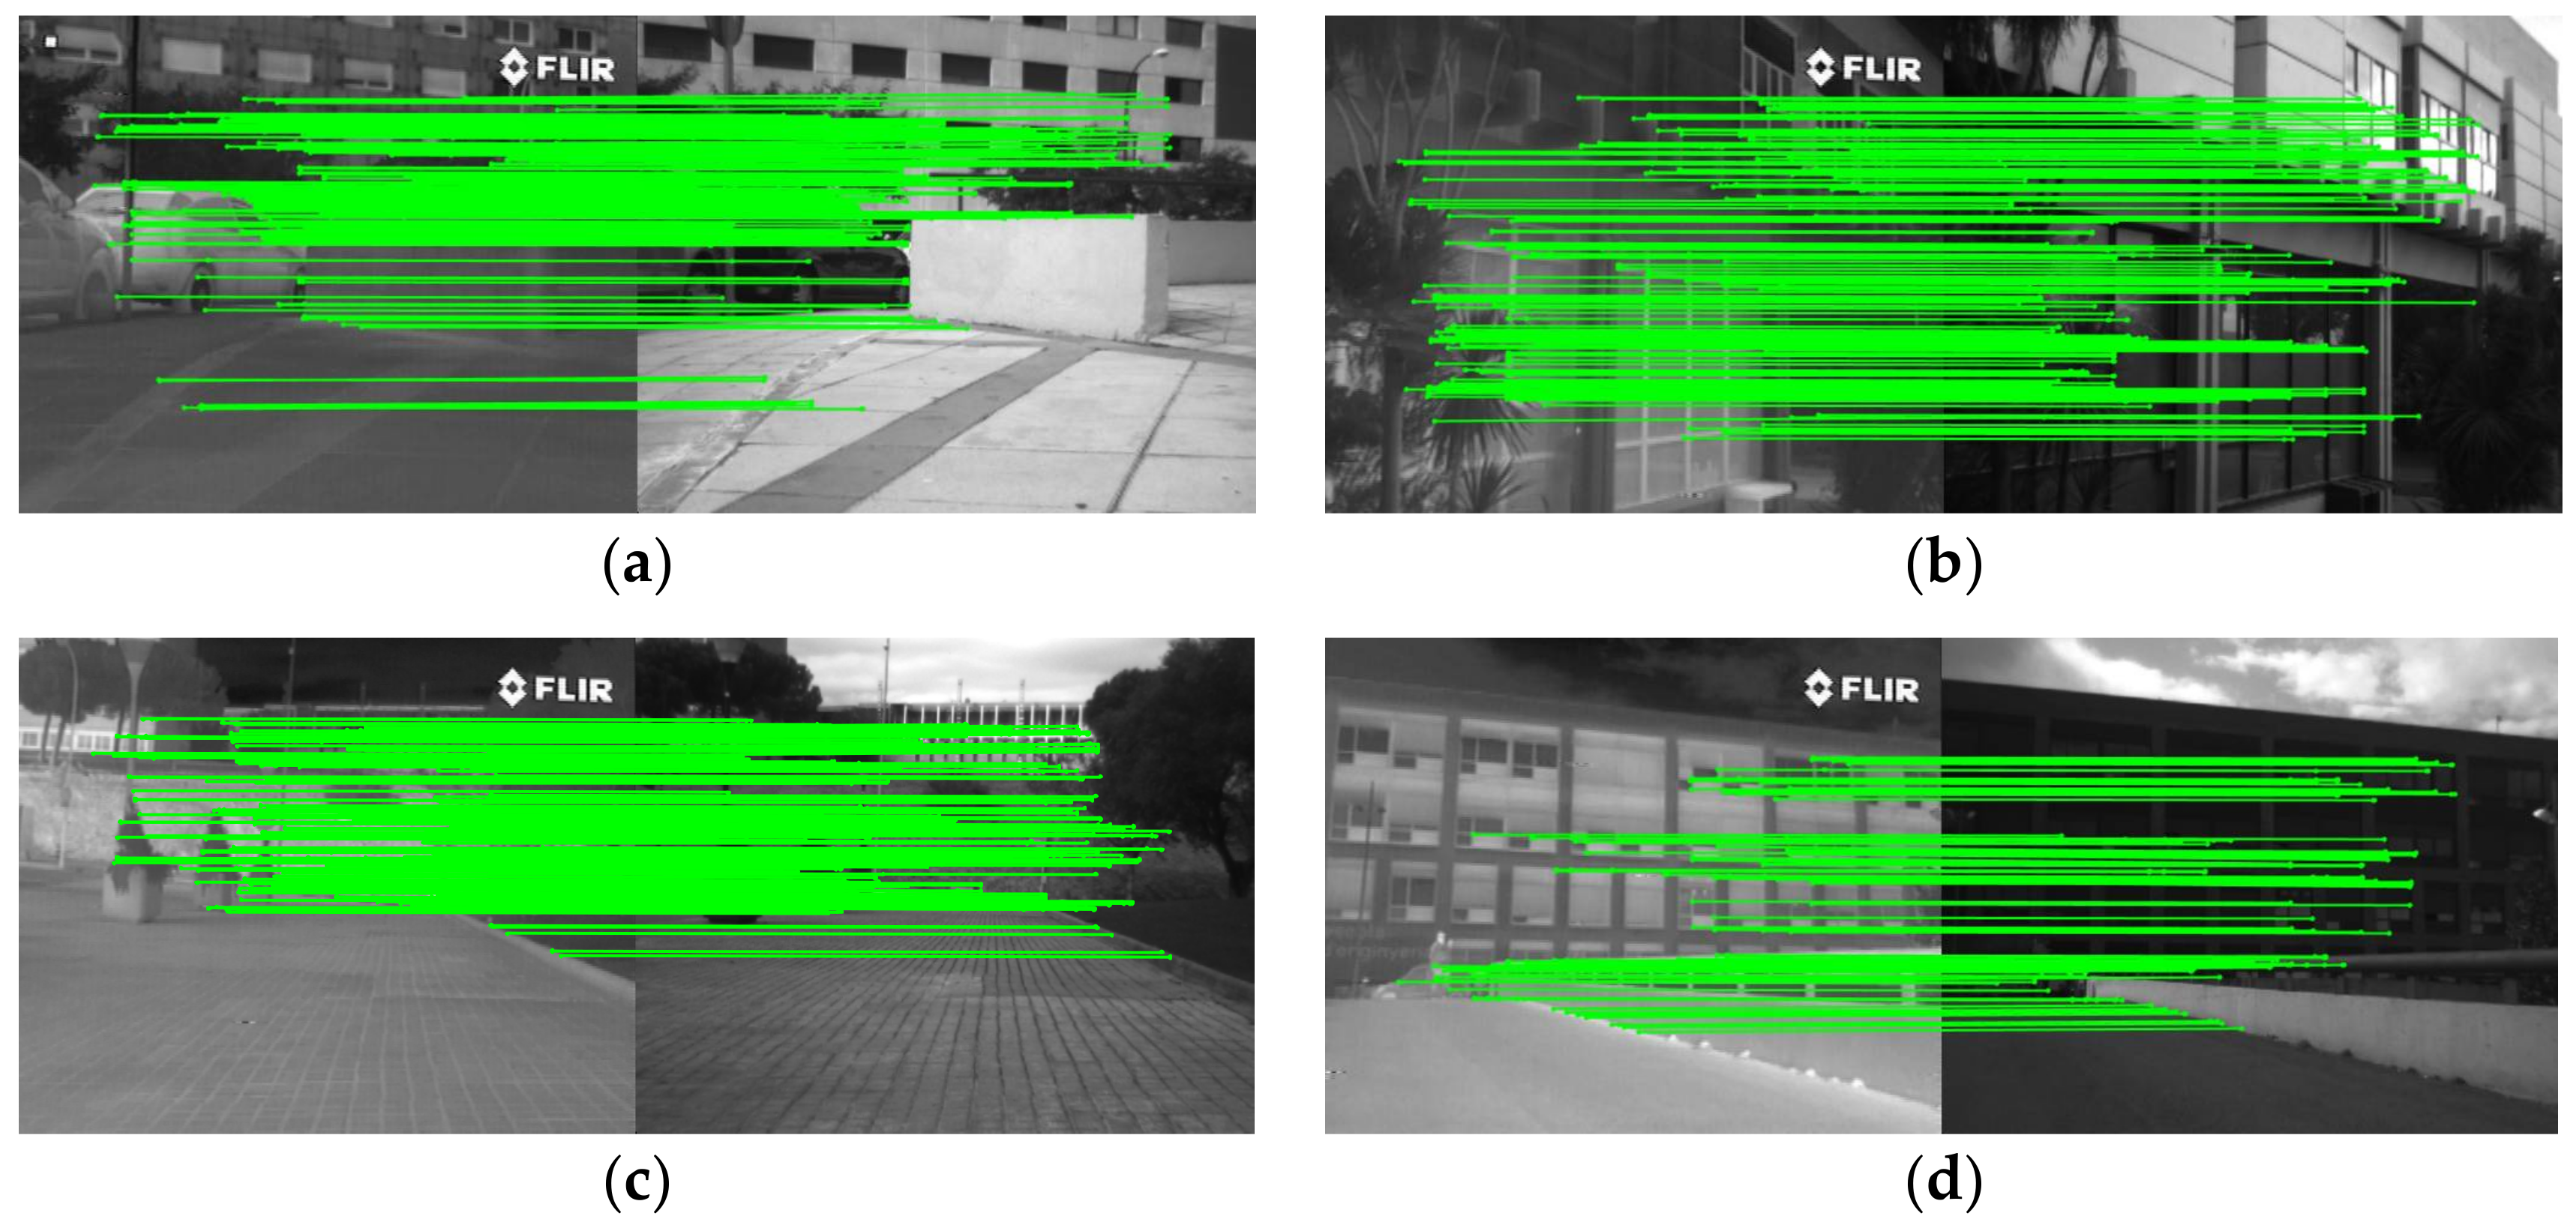
To evaluate the matching performance of the proposed method, four multimodal stereo image pairs from CVC datasets were used to compare with the related methods presented in [10,21,27,28,31] in terms of precision and repeatability. The set of image pairs with size of 506×408 are shown in Figure 7, which have large difference in contrast and small viewpoint changes. Matching results using the proposed method for the image pairs in Figure 7 are shown in Figure 8. It can be seen that our method obtained a good matching when significant difference contrast occurs in the image pairs. In addition to LFI, the other five methods belong to local feature matching and contain the feature points detection steps. To compare the proposed method with LFI conveniently, the feature points are extracted by the Harris corner detector first, and then, the matching of regions is computed by LFI. The precision and repeatability of the matching results of different methods are shown in Table 1. From that, we can see that the proposed method has better performance than the other five related methods. The average precision of the proposed method for the four image pairs is 93.32%, which is 5.79%, 10.43%, and 14.30% higher than that of HOPC, MRLSD, and LFI, respectively. This is mainly due to the affine and contrast invariance of the MSPC constructed by the proposed method. The average precision of both MM-SURF and FVS-DR is less than 75%, which is due to the fact that simple intensity symmetry or reversal cannot eliminate the difference in contrast completely. The average repeatability of our method for the four image pairs is 33.30%, which is 5.88%, 6.02%, and 10.64% higher than that of HOPC, MRLSD, and LFI respectively. This advantage is attributed to the great significance of the extracted feature points in sequence and the high communization of the constructed structural features in the proposed method.
4.2. Validity Verification Experiments
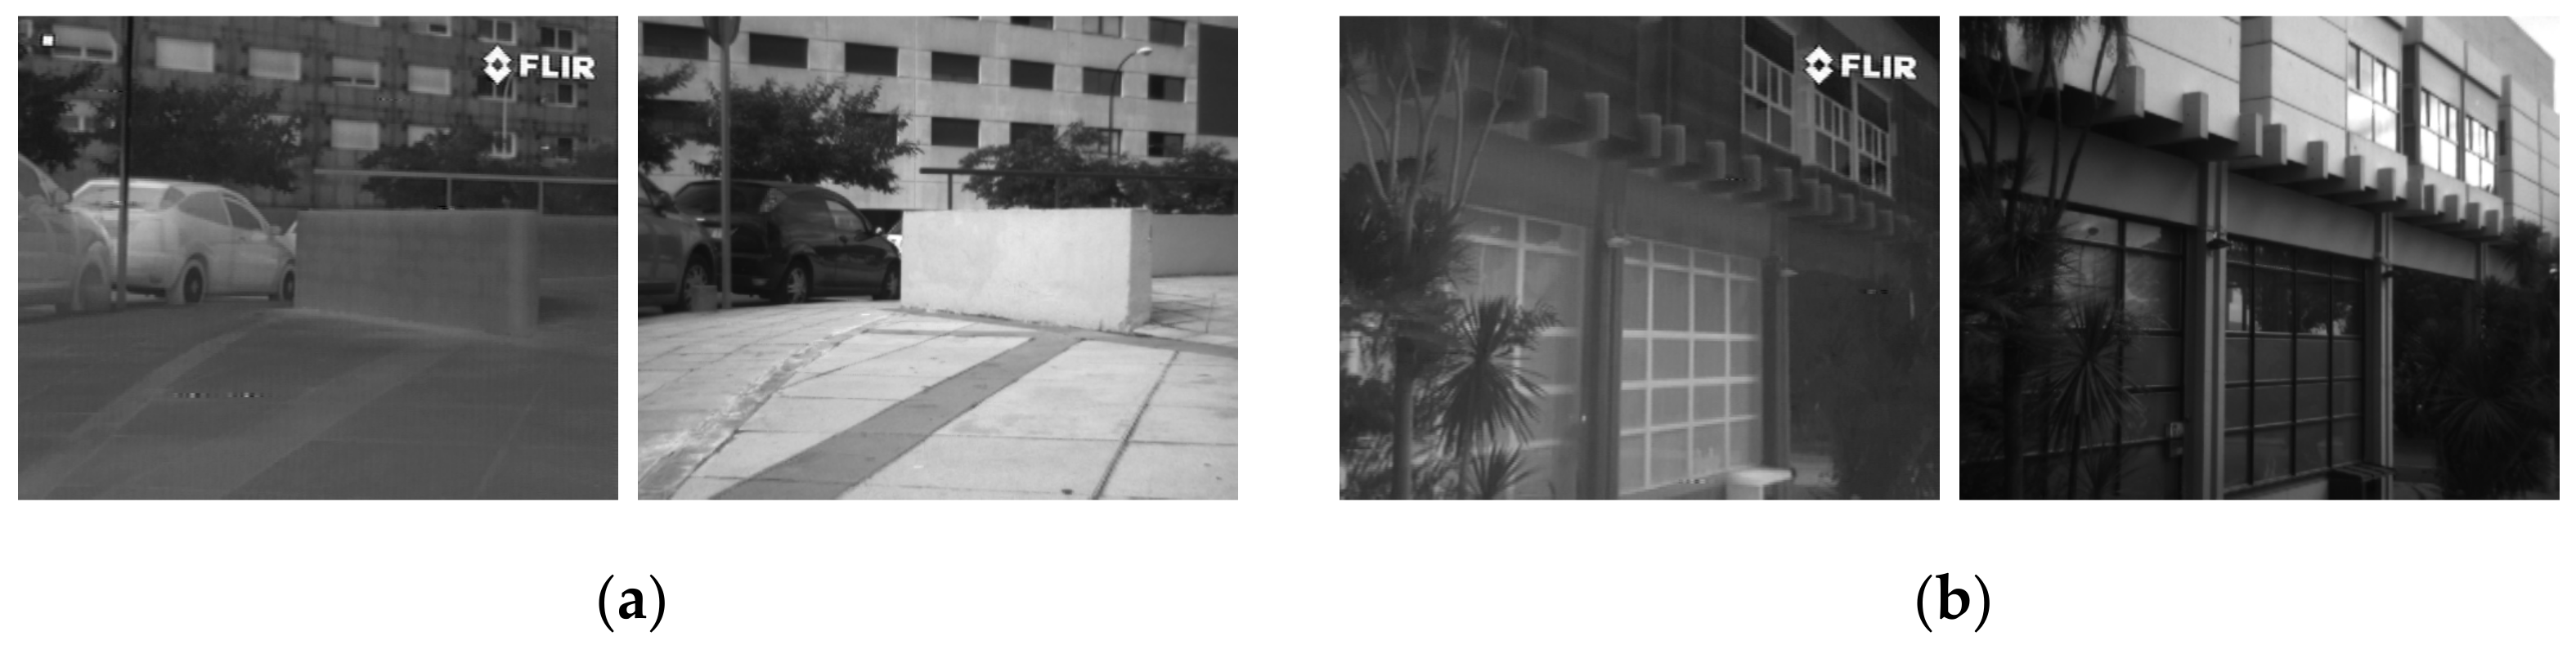
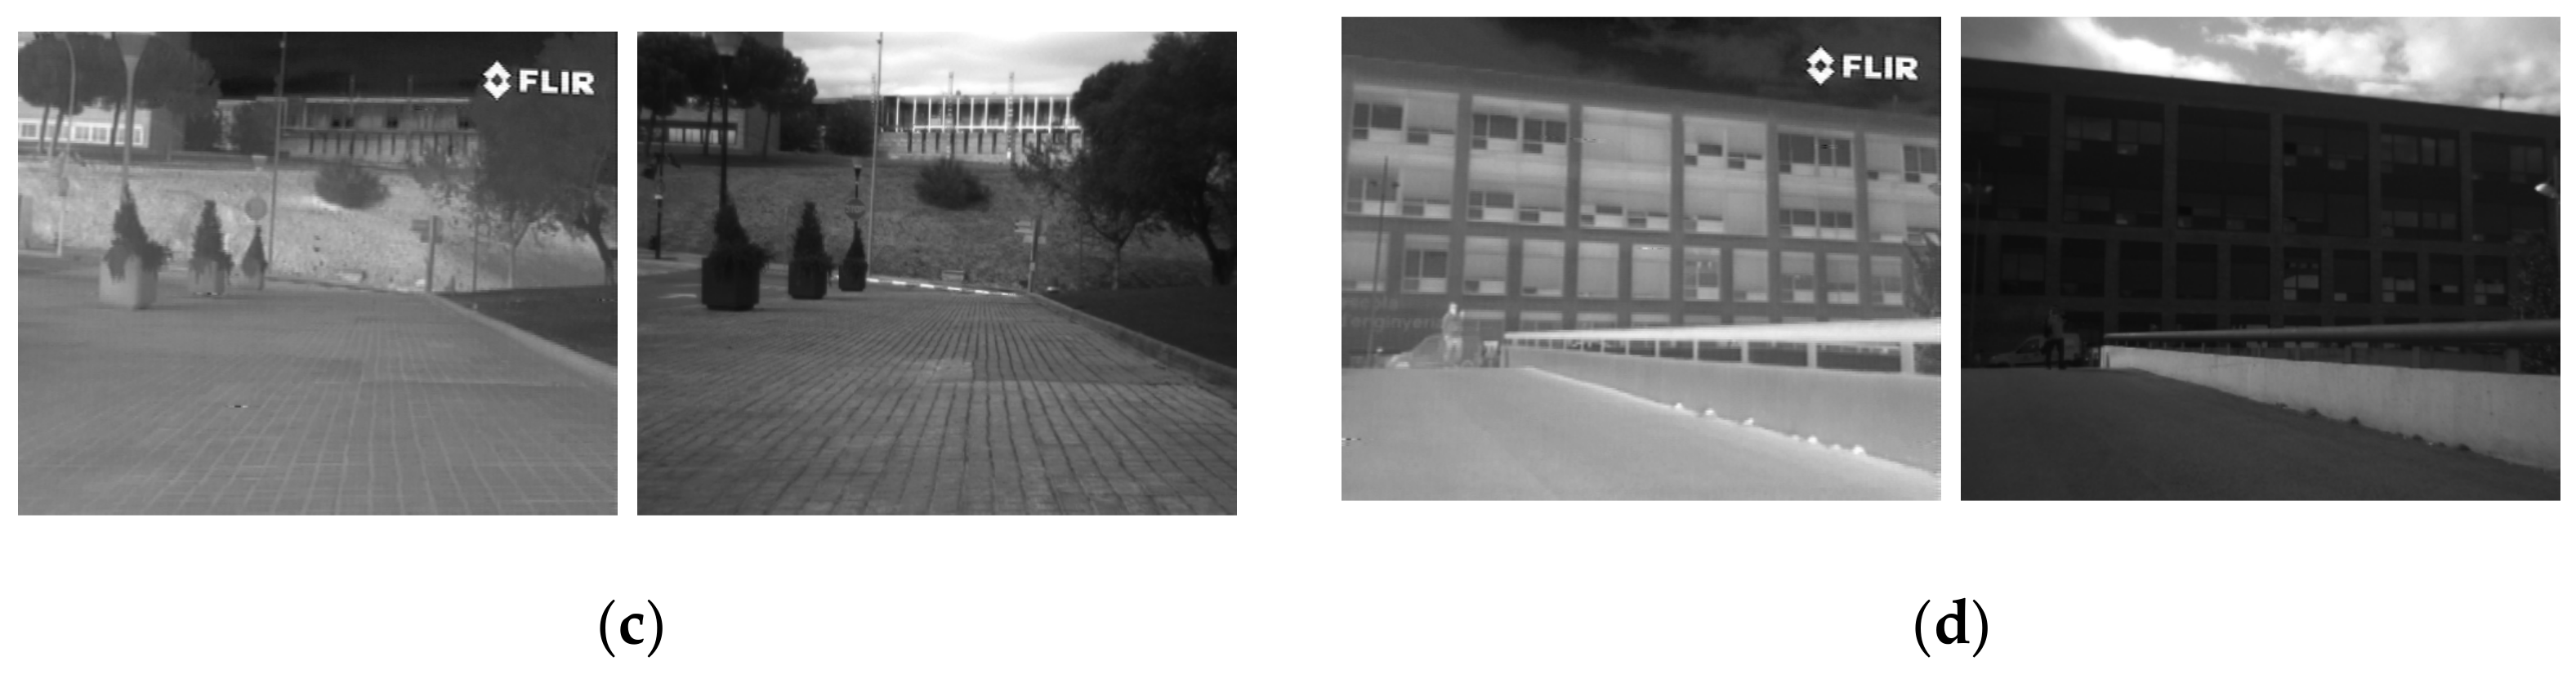
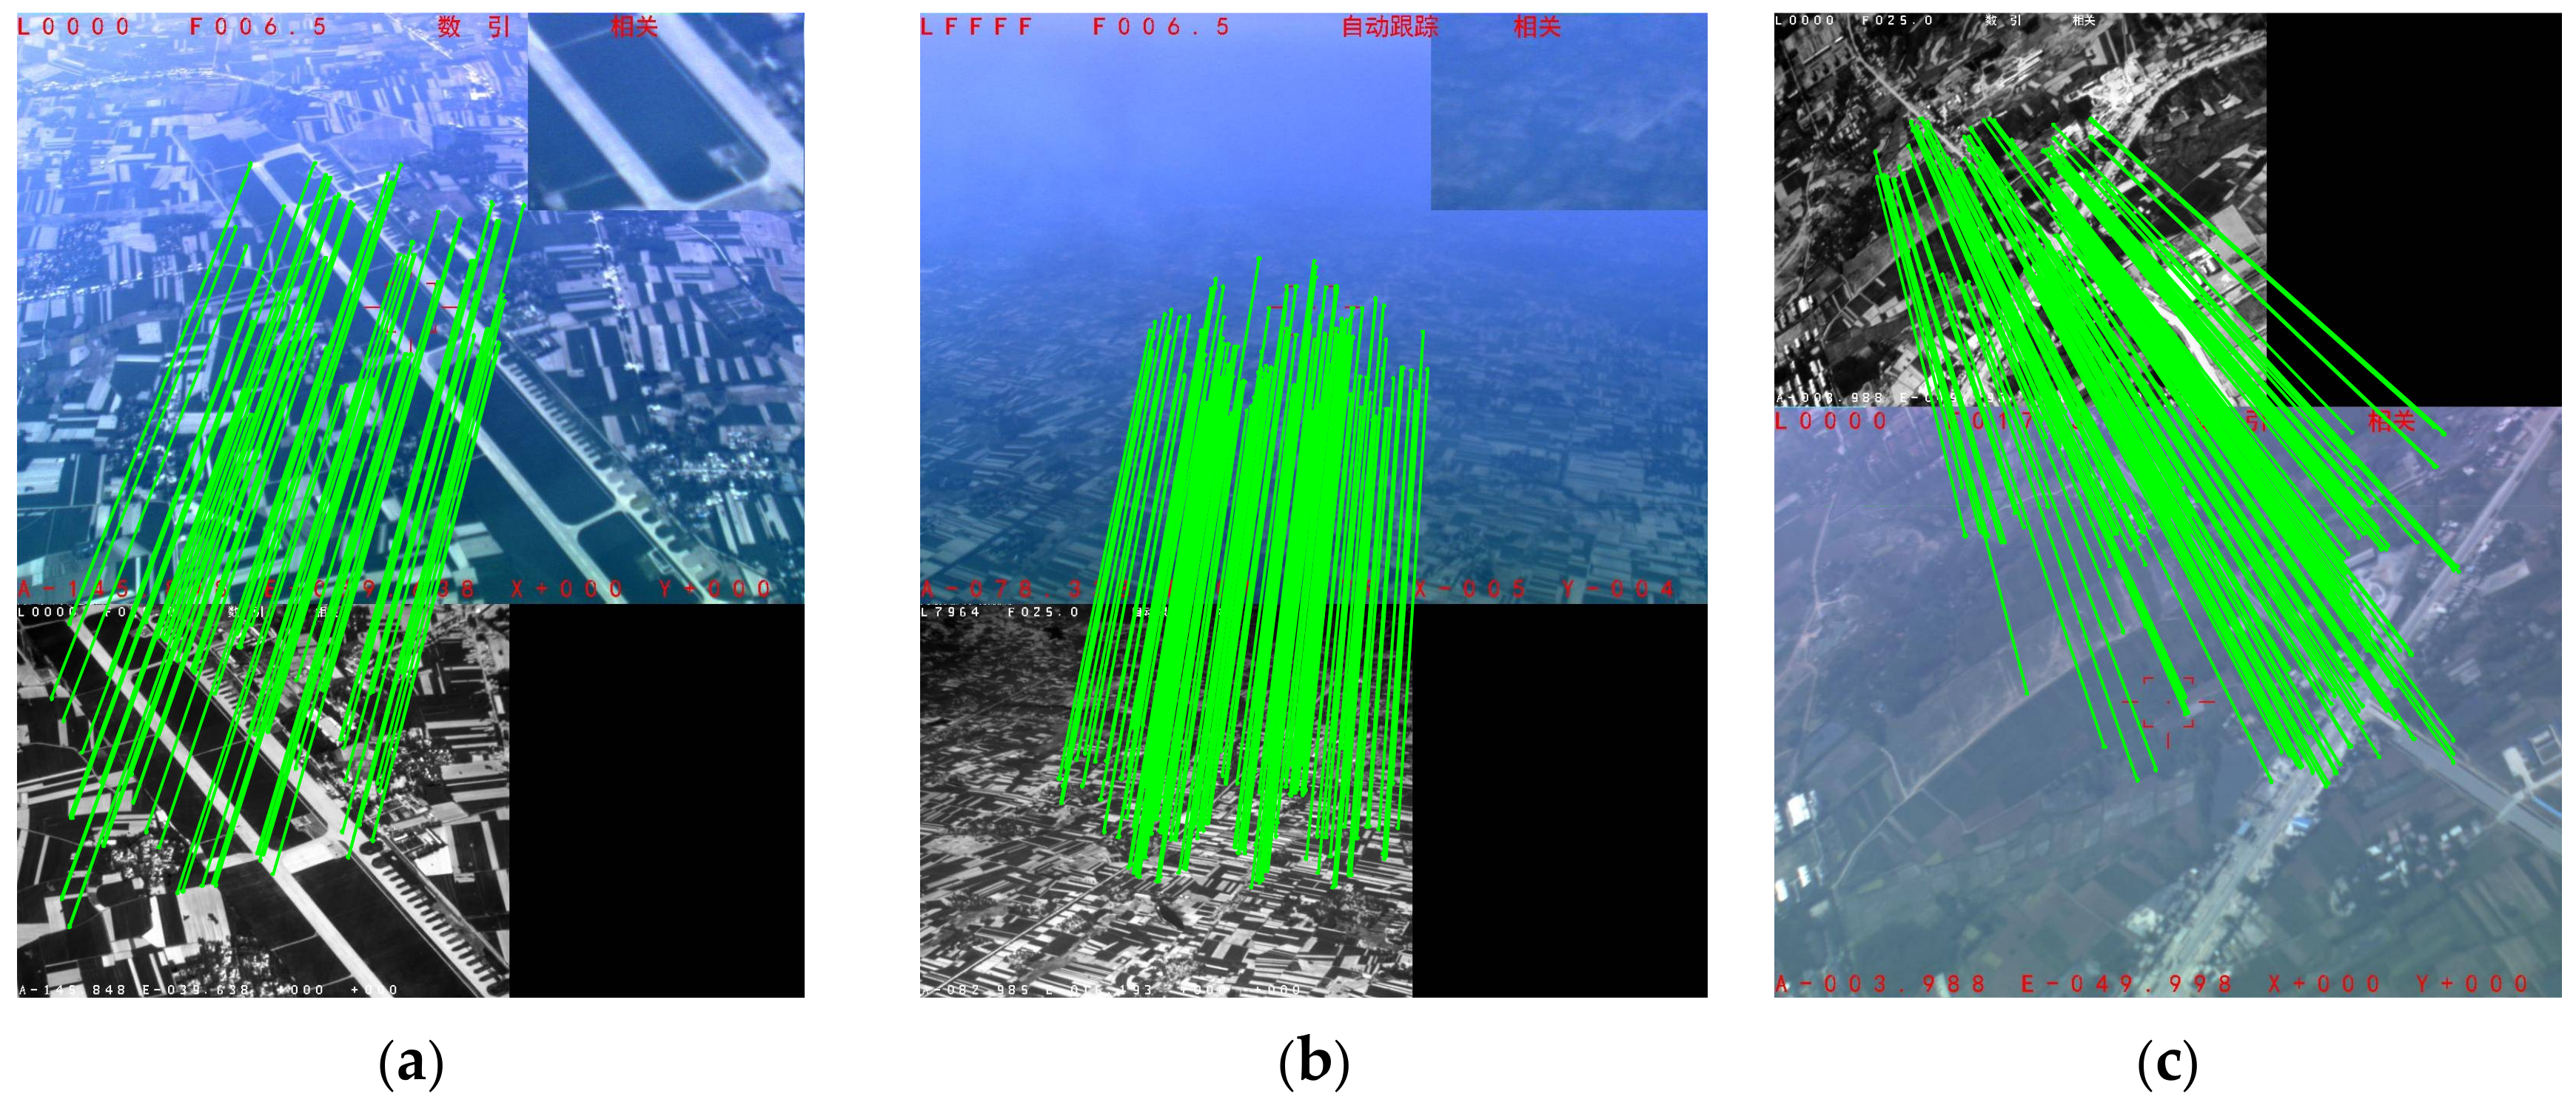
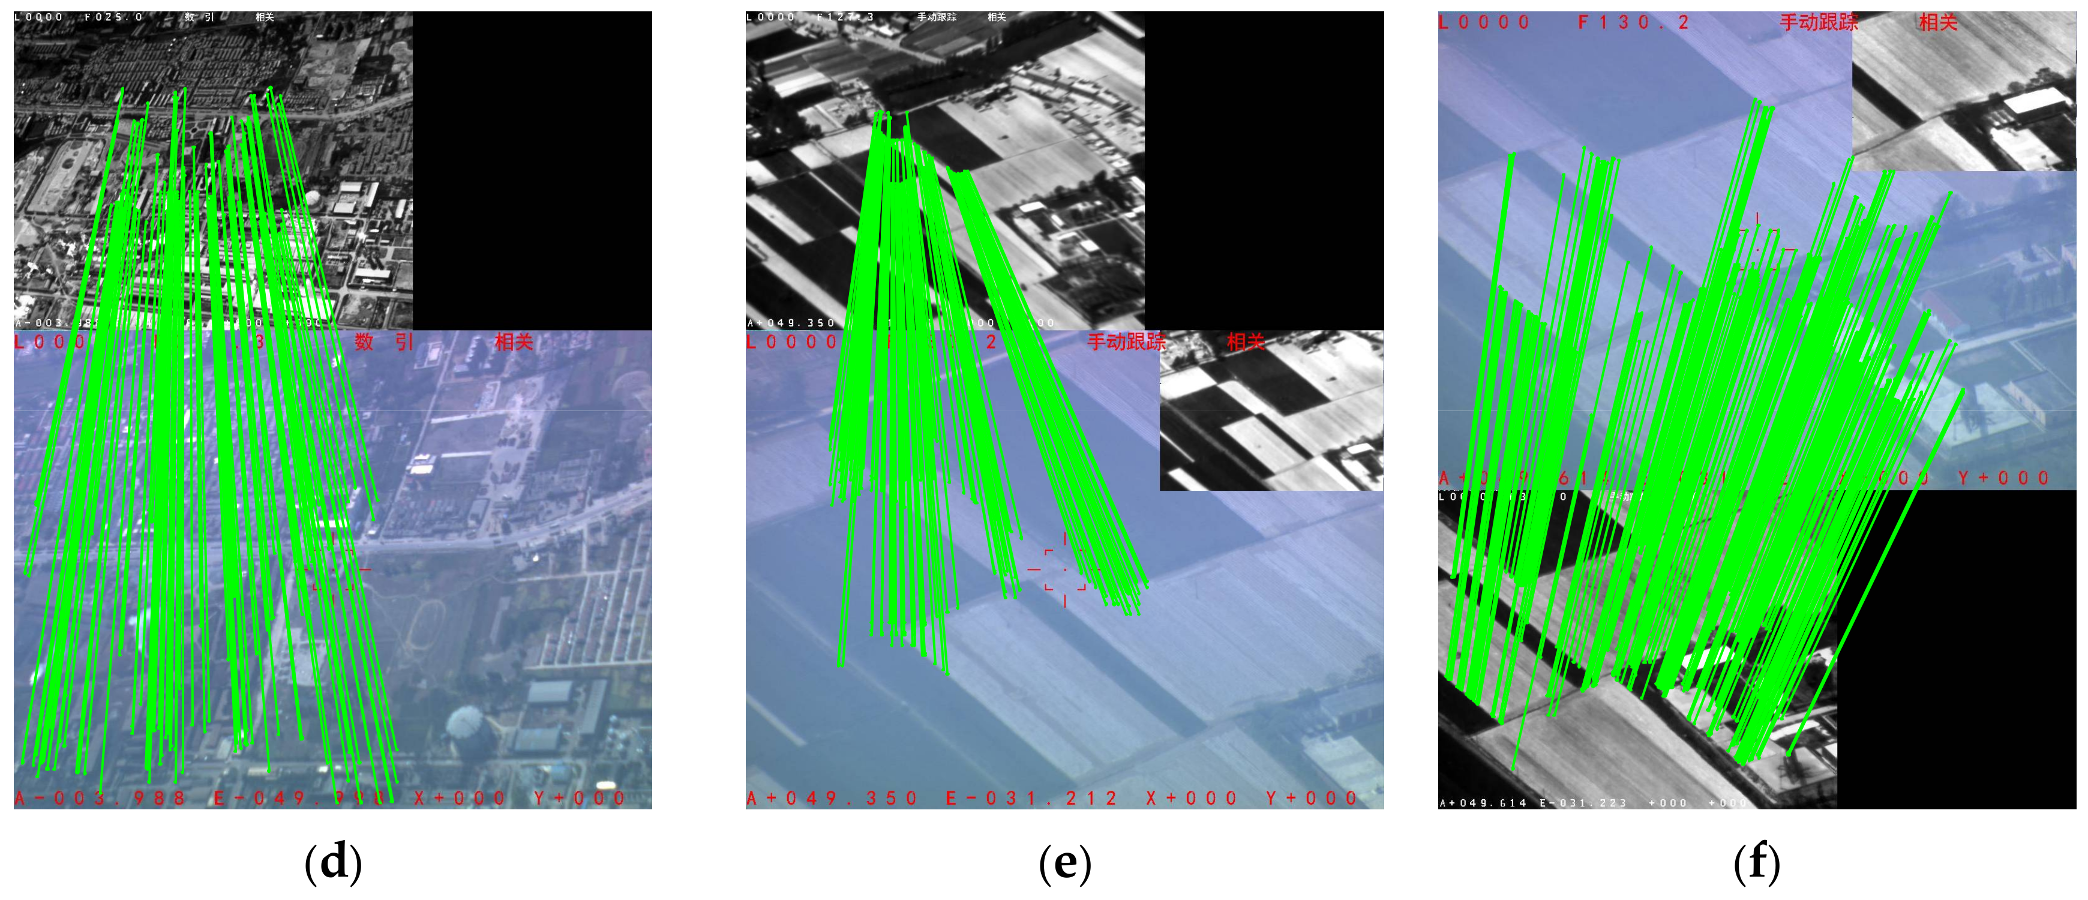
To test the validity of the proposed method, the second set of images captured from EOP on UAV were used in this section. Those images not only have scale differences caused by focus length changes, but also have a variety of scenes with infrared and visible images with size 1024×768 and 640×512, respectively, and several examples are shown in Figure 9. From that, we can see that (a), (b), (c), and (d) have focus length changes of the visible camera with different scenes, while that of infrared camera keeps to 25 mm. Figure 9e and f have focus length changes of the infrared camera with different scenes, while that of visible camera keeps to 130.2 mm. The six image pairs not only contain large geometric changes, but also have significant differences in contrast.
To ensure the attainment of salient structural features, eight orientations are adopted for different phase congruency images, and is used to filter the minimum moment image in feature points extraction. Figure 10 shows the matching results of the image pairs in Figure 9 by using the proposed method. In those image pairs, we consider the image that has the larger field of view as the reference image and the other one as the sensed image. It can be seen from those results that the proposed method can achieve good performance whether images have rich texture information (Figure 9a,c,d) or not (Figure 9e,f). In particular, in blurry situations (see Figure 9b) and with large differences in scale (Figure 9e), the proposed method can still get enough correct matching point pairs, while several of the state-of-art methods failed in those cases. For example, MRLSD failed for Figure 9b due to the fact that there are not enough lines to be extracted from the images. MM-SURF and FVS-DR failed for Figure 9e,f, because they cannot get the robust feature descriptors for textures. HOPC failed for Figure 9e as result of the large geometric changes in the image pairs.
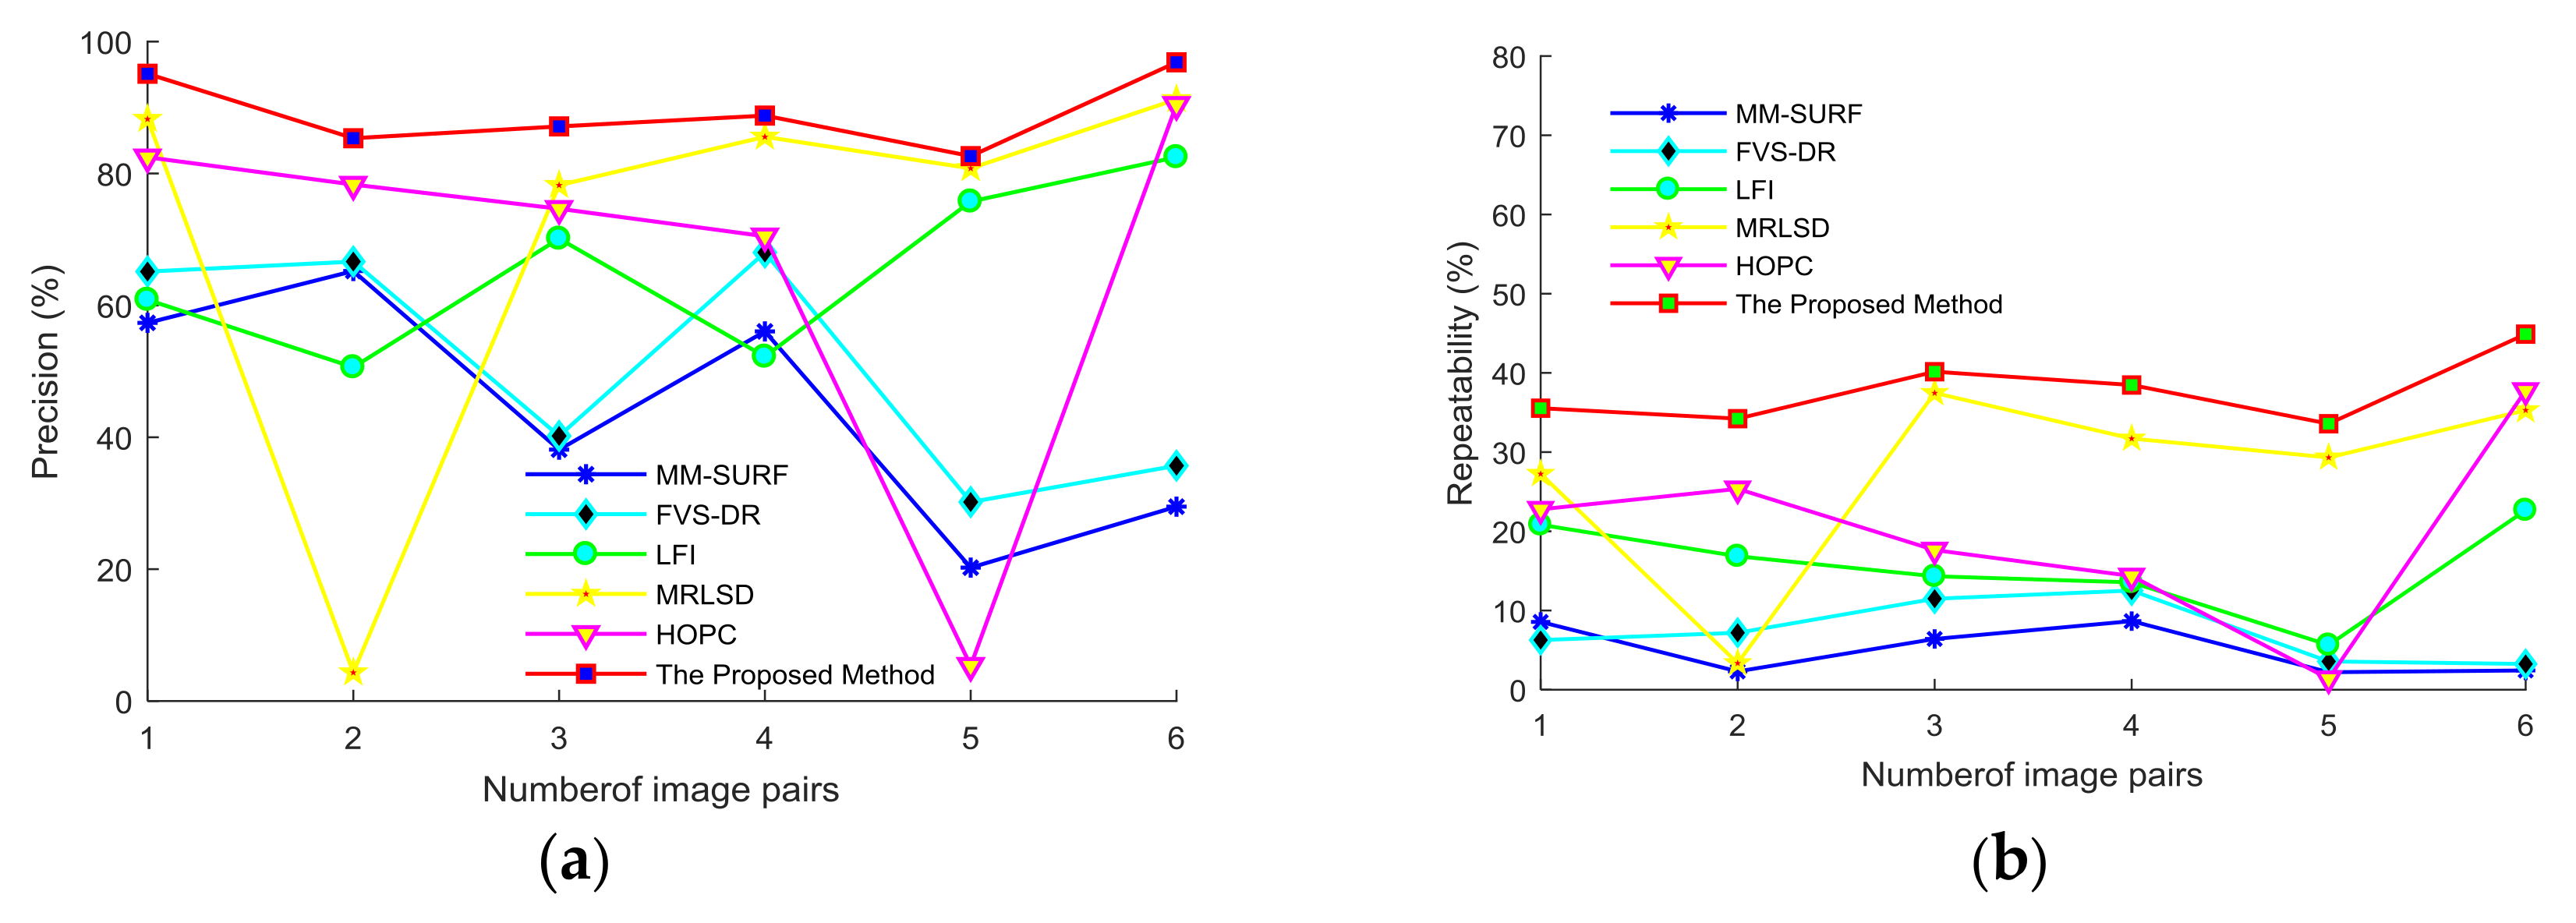
The matching performance of the proposed method compared with MM-SURF, FVS-DR, LFI, MRLSD, and HOPC are shown in Figure 11. From those results, we can see the proposed method outperforms the other methods both in precision and repeatability. The average precision of our method is higher than 89%, and the average repeatability is higher than 37%, while the average precision and repeatability of the best performances in the other methods are lower than 85% and 33% (failures are not calculated), respectively, which is because of large difference in scale and contrast between the input images. The proposed method can achieve better performance, even in the cases where other methods are invalid for Figure 9b,e,f. In addition to our method, both MRLSD and HOPC achieve better performance (except for the failure case) than the rest of the methods due to the fact that they use phase congruency information and structural features in the feature description. However, linear features do not always exist in the images (Figure 9b) that result in the failure of MRLSD. HOPC cannot deal with large geometric changes, so it failed for Figure 9e. LFI uses the differences of features as the similarity measure directly, which resulted in a matching performance that was worse than our method. Although FVS-DR and MM-SURF have a certain tolerance for geometric changes, they are less able to deal with differences in contrast based on the reversal or symmetry of intensity; therefore, they had a worse matching performance than the proposed method.
The registration results of using the proposed method for the image pairs in Figure 9 are shown in Figure 12. It can be observed that our method achieves good performance whether the infrared image is used as a reference or not, which indicates that our method is robust against the changes in geometry and contrast. The RMSE of the registration results of using different methods are given in Table 2, where MM-SURF and FVS-DR failed for Figure 10e and f and MRLSD and HOPC failed for Figure 10b,e, respectively, because they could not get enough correct matched point pairs. The proposed method can not only achieve the registration of all the image pairs, but also make the average RMSE less than 2 pixels. Furthermore, the average RMSE in the registration of the second set with 300 images is 1.8 pixels, which is acceptable for practical application.
Moreover, the experiments are implemented on computer with Intel Core i7-4810MQ CPU at 2.80GHz, and the average registration times achieved by the related methods for the six image pairs in Figure 9 are shown in Table 3. From that, we can see that the run time of the proposed method is moderately fast, but the registration performance is significantly improved compared with the other related methods.
4.3. Applied Experiments
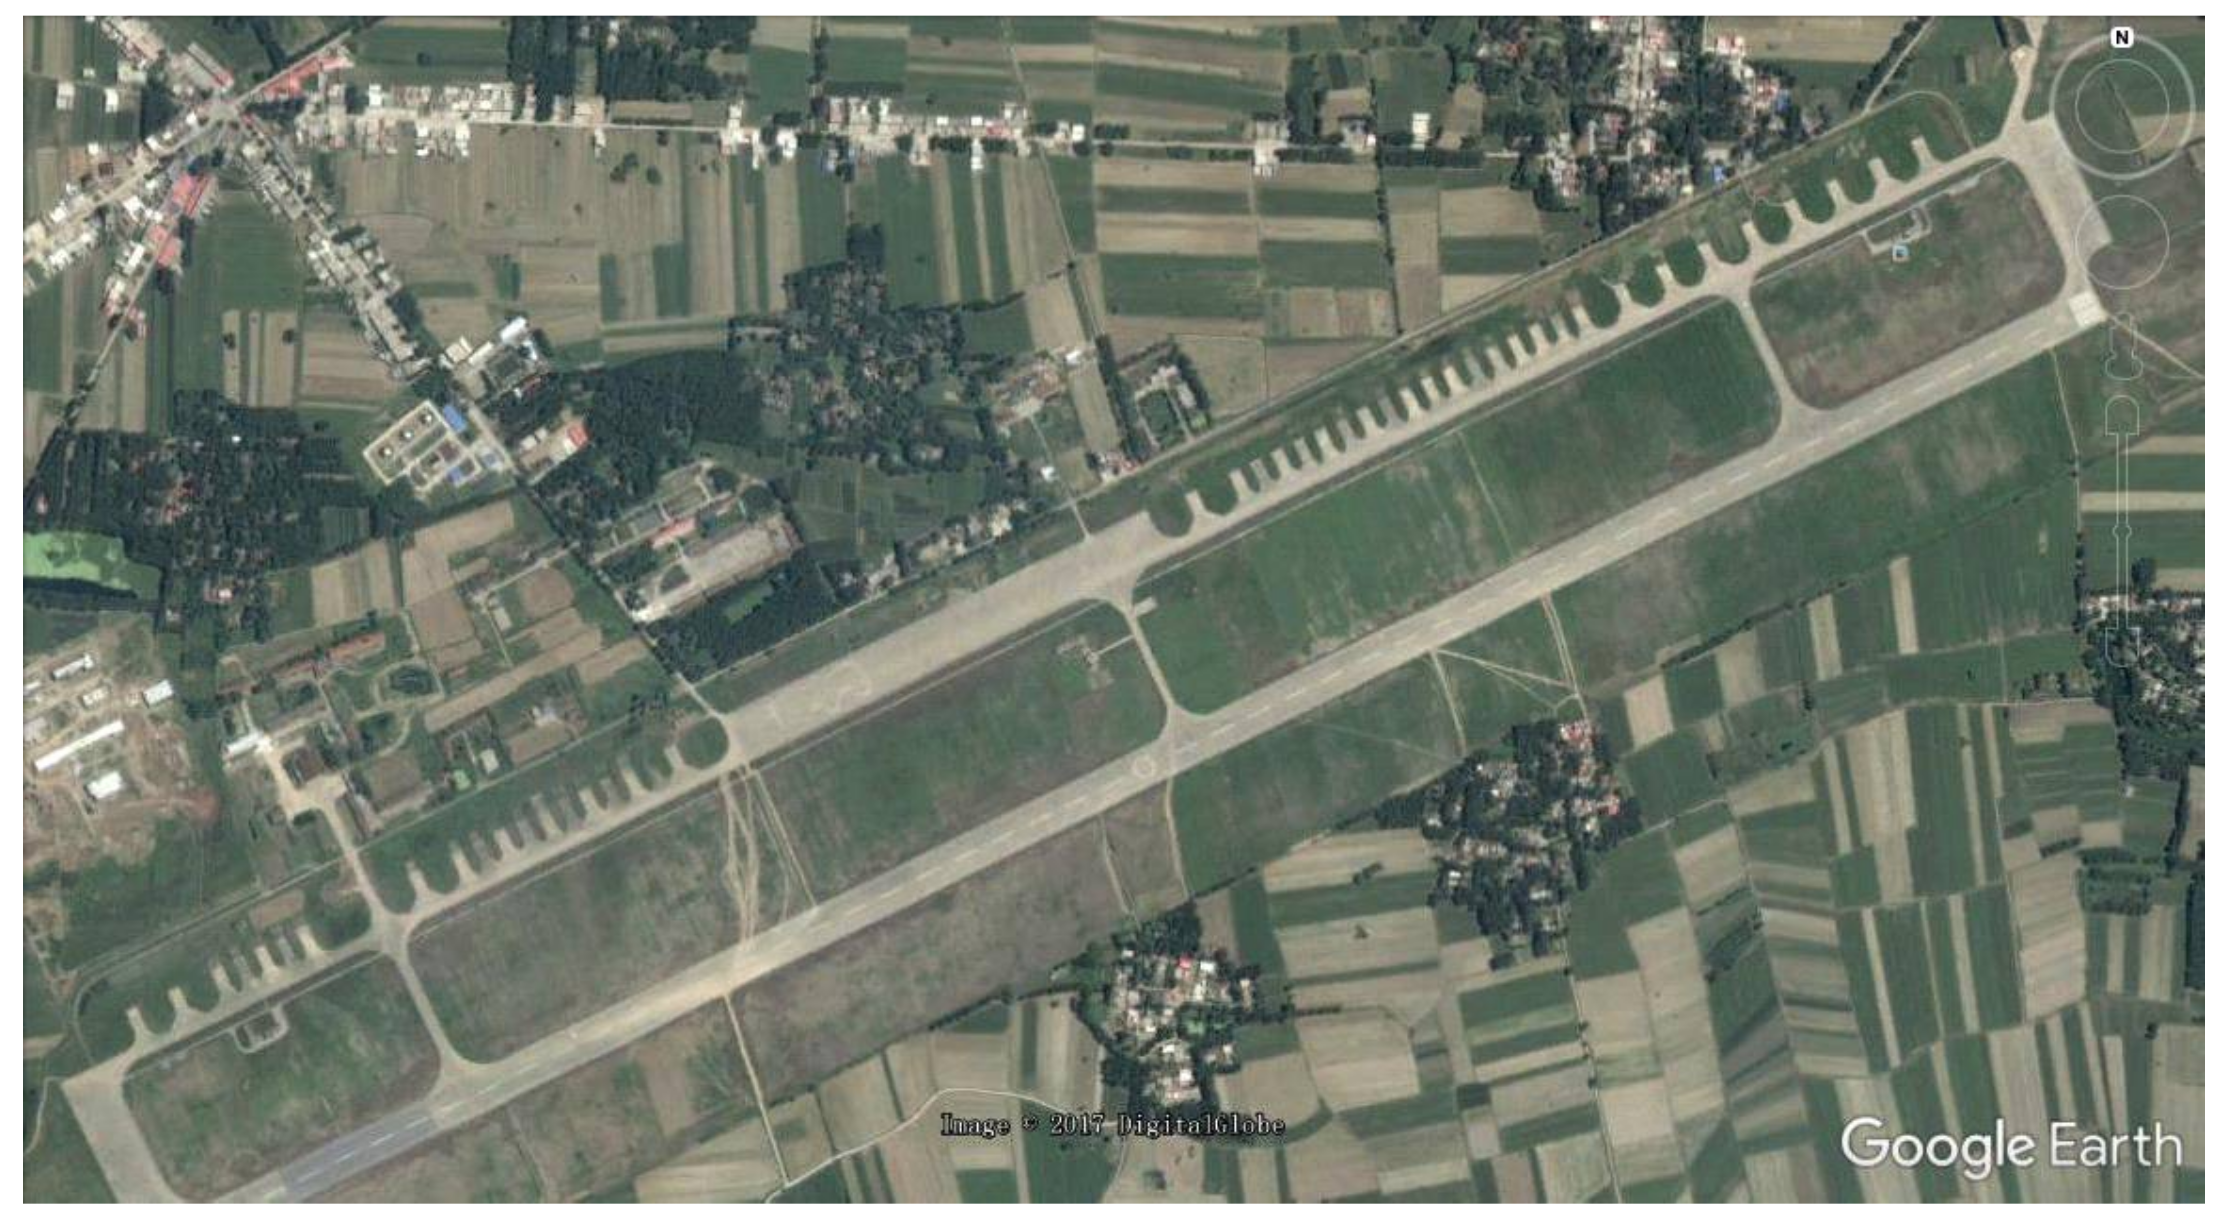
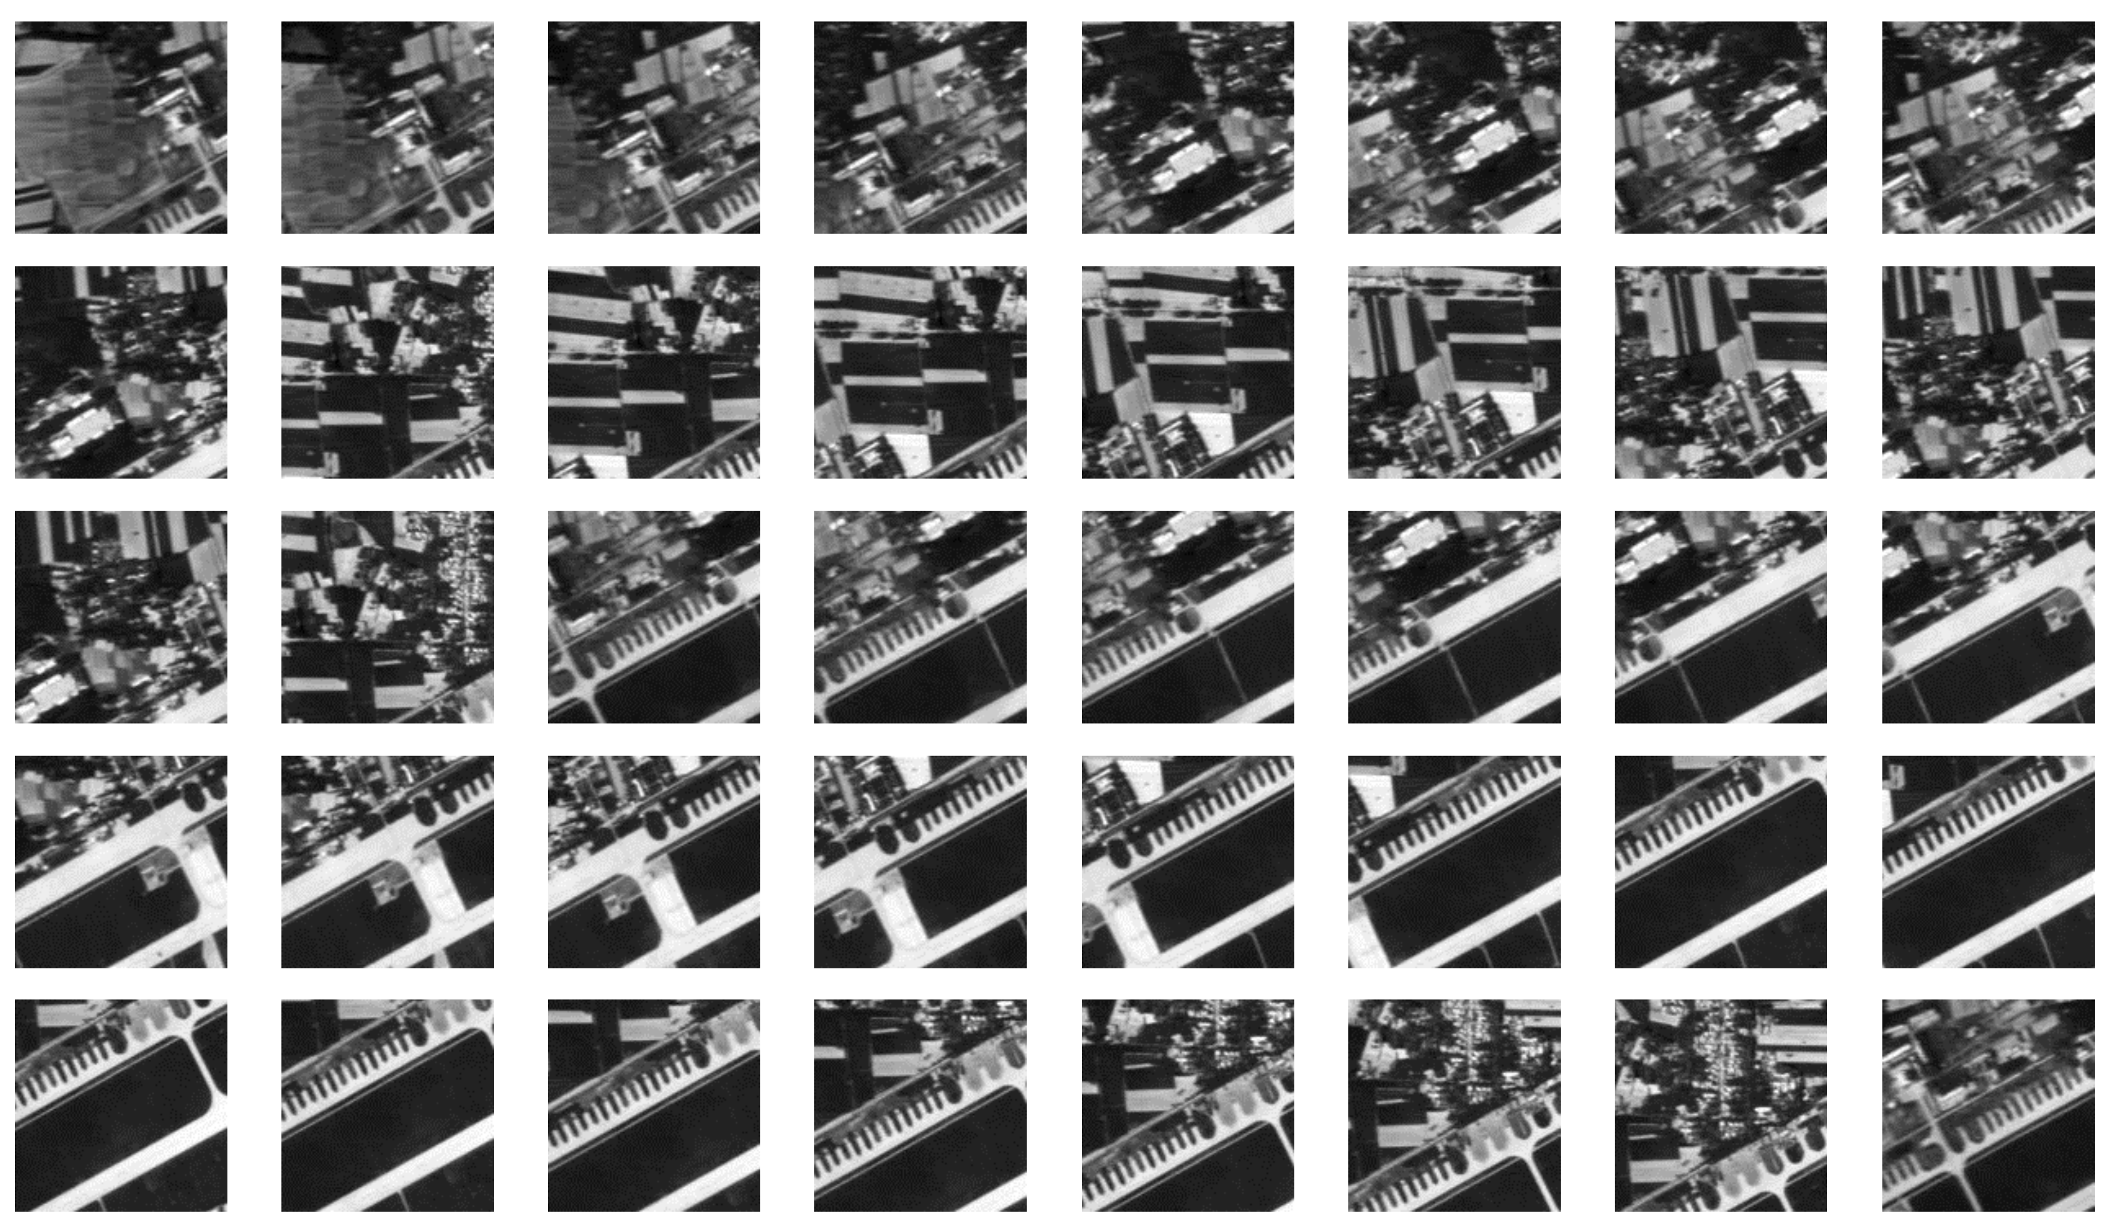
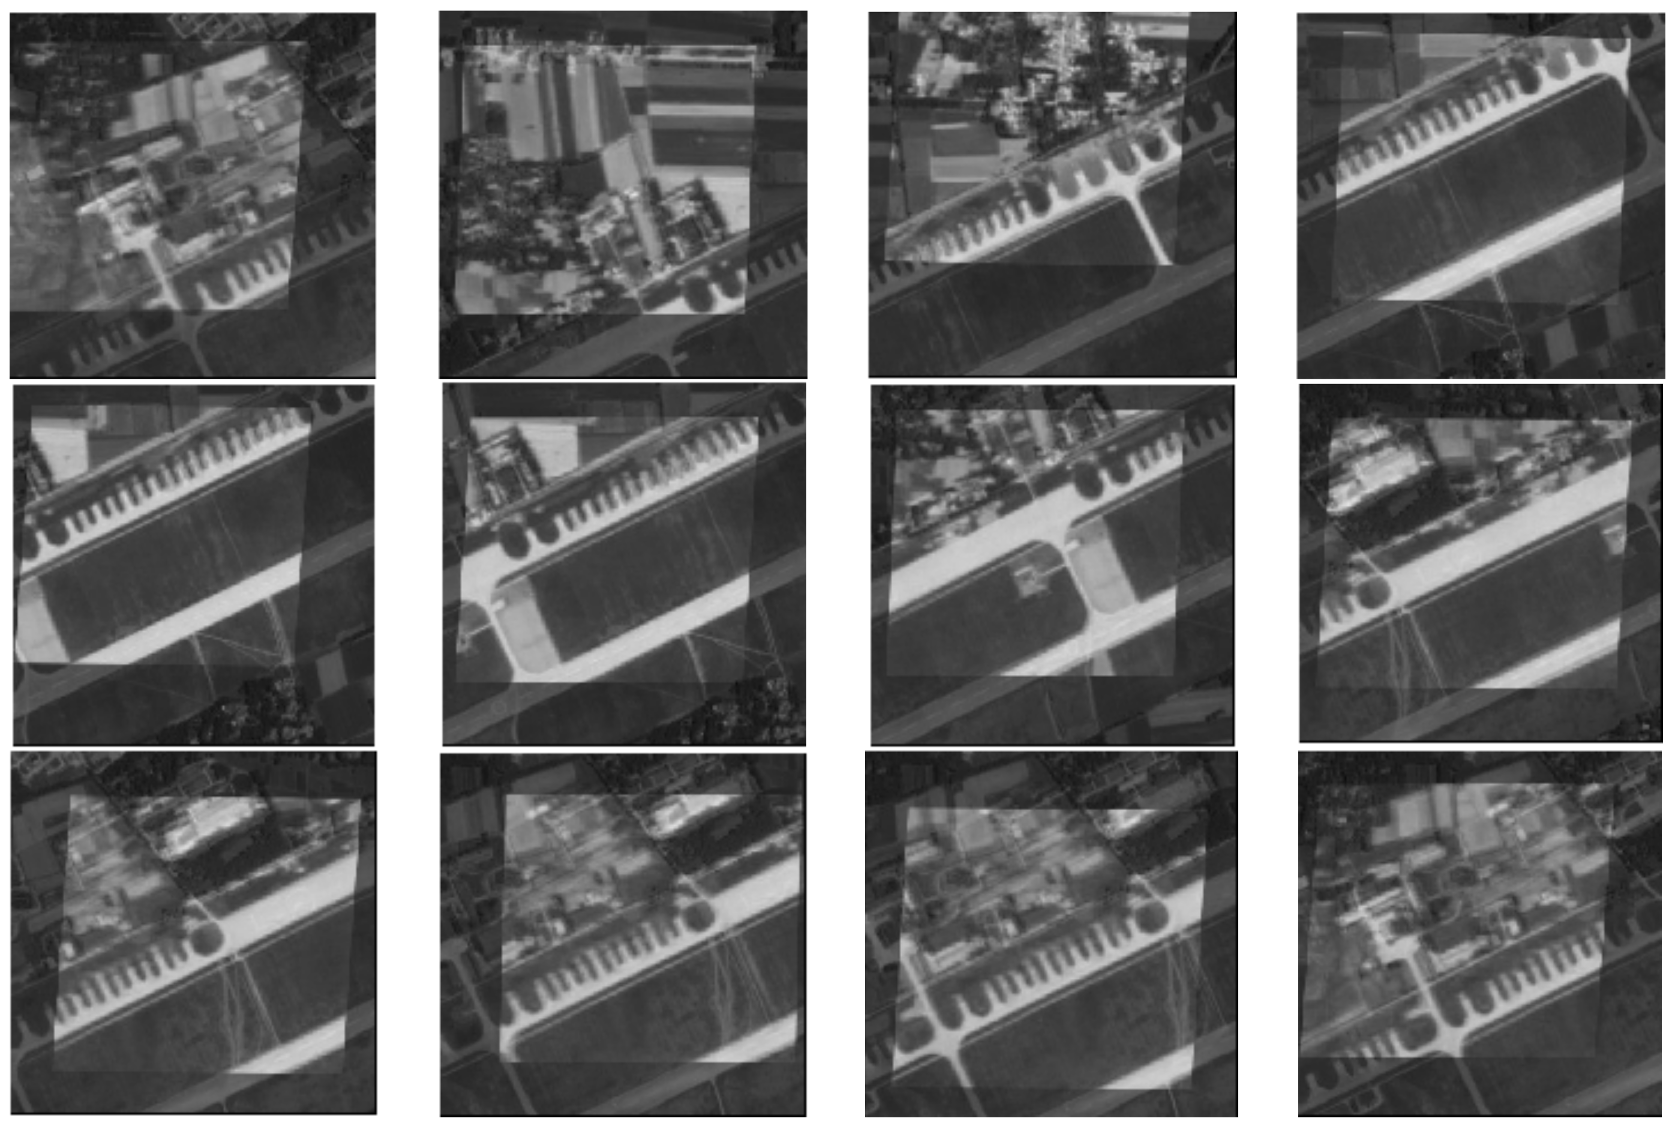
Finally, we apply the proposed method to UAV trajectory tracking via the registration of the real-time images and the reference image. The real-time images were captured by EOP on UAV, and the reference image was downloaded from Google. To achieve fast registration, the sub-images (300×300) from the real-time images were used to search the matching on the reference image. The reference image (with 1.5 m resolution) is shown in Figure 13, and samples of the sub-image from the real-time images are shown in Figure 14. From that, we can see there are large geometric changes and significant contrast differences existing in those images.
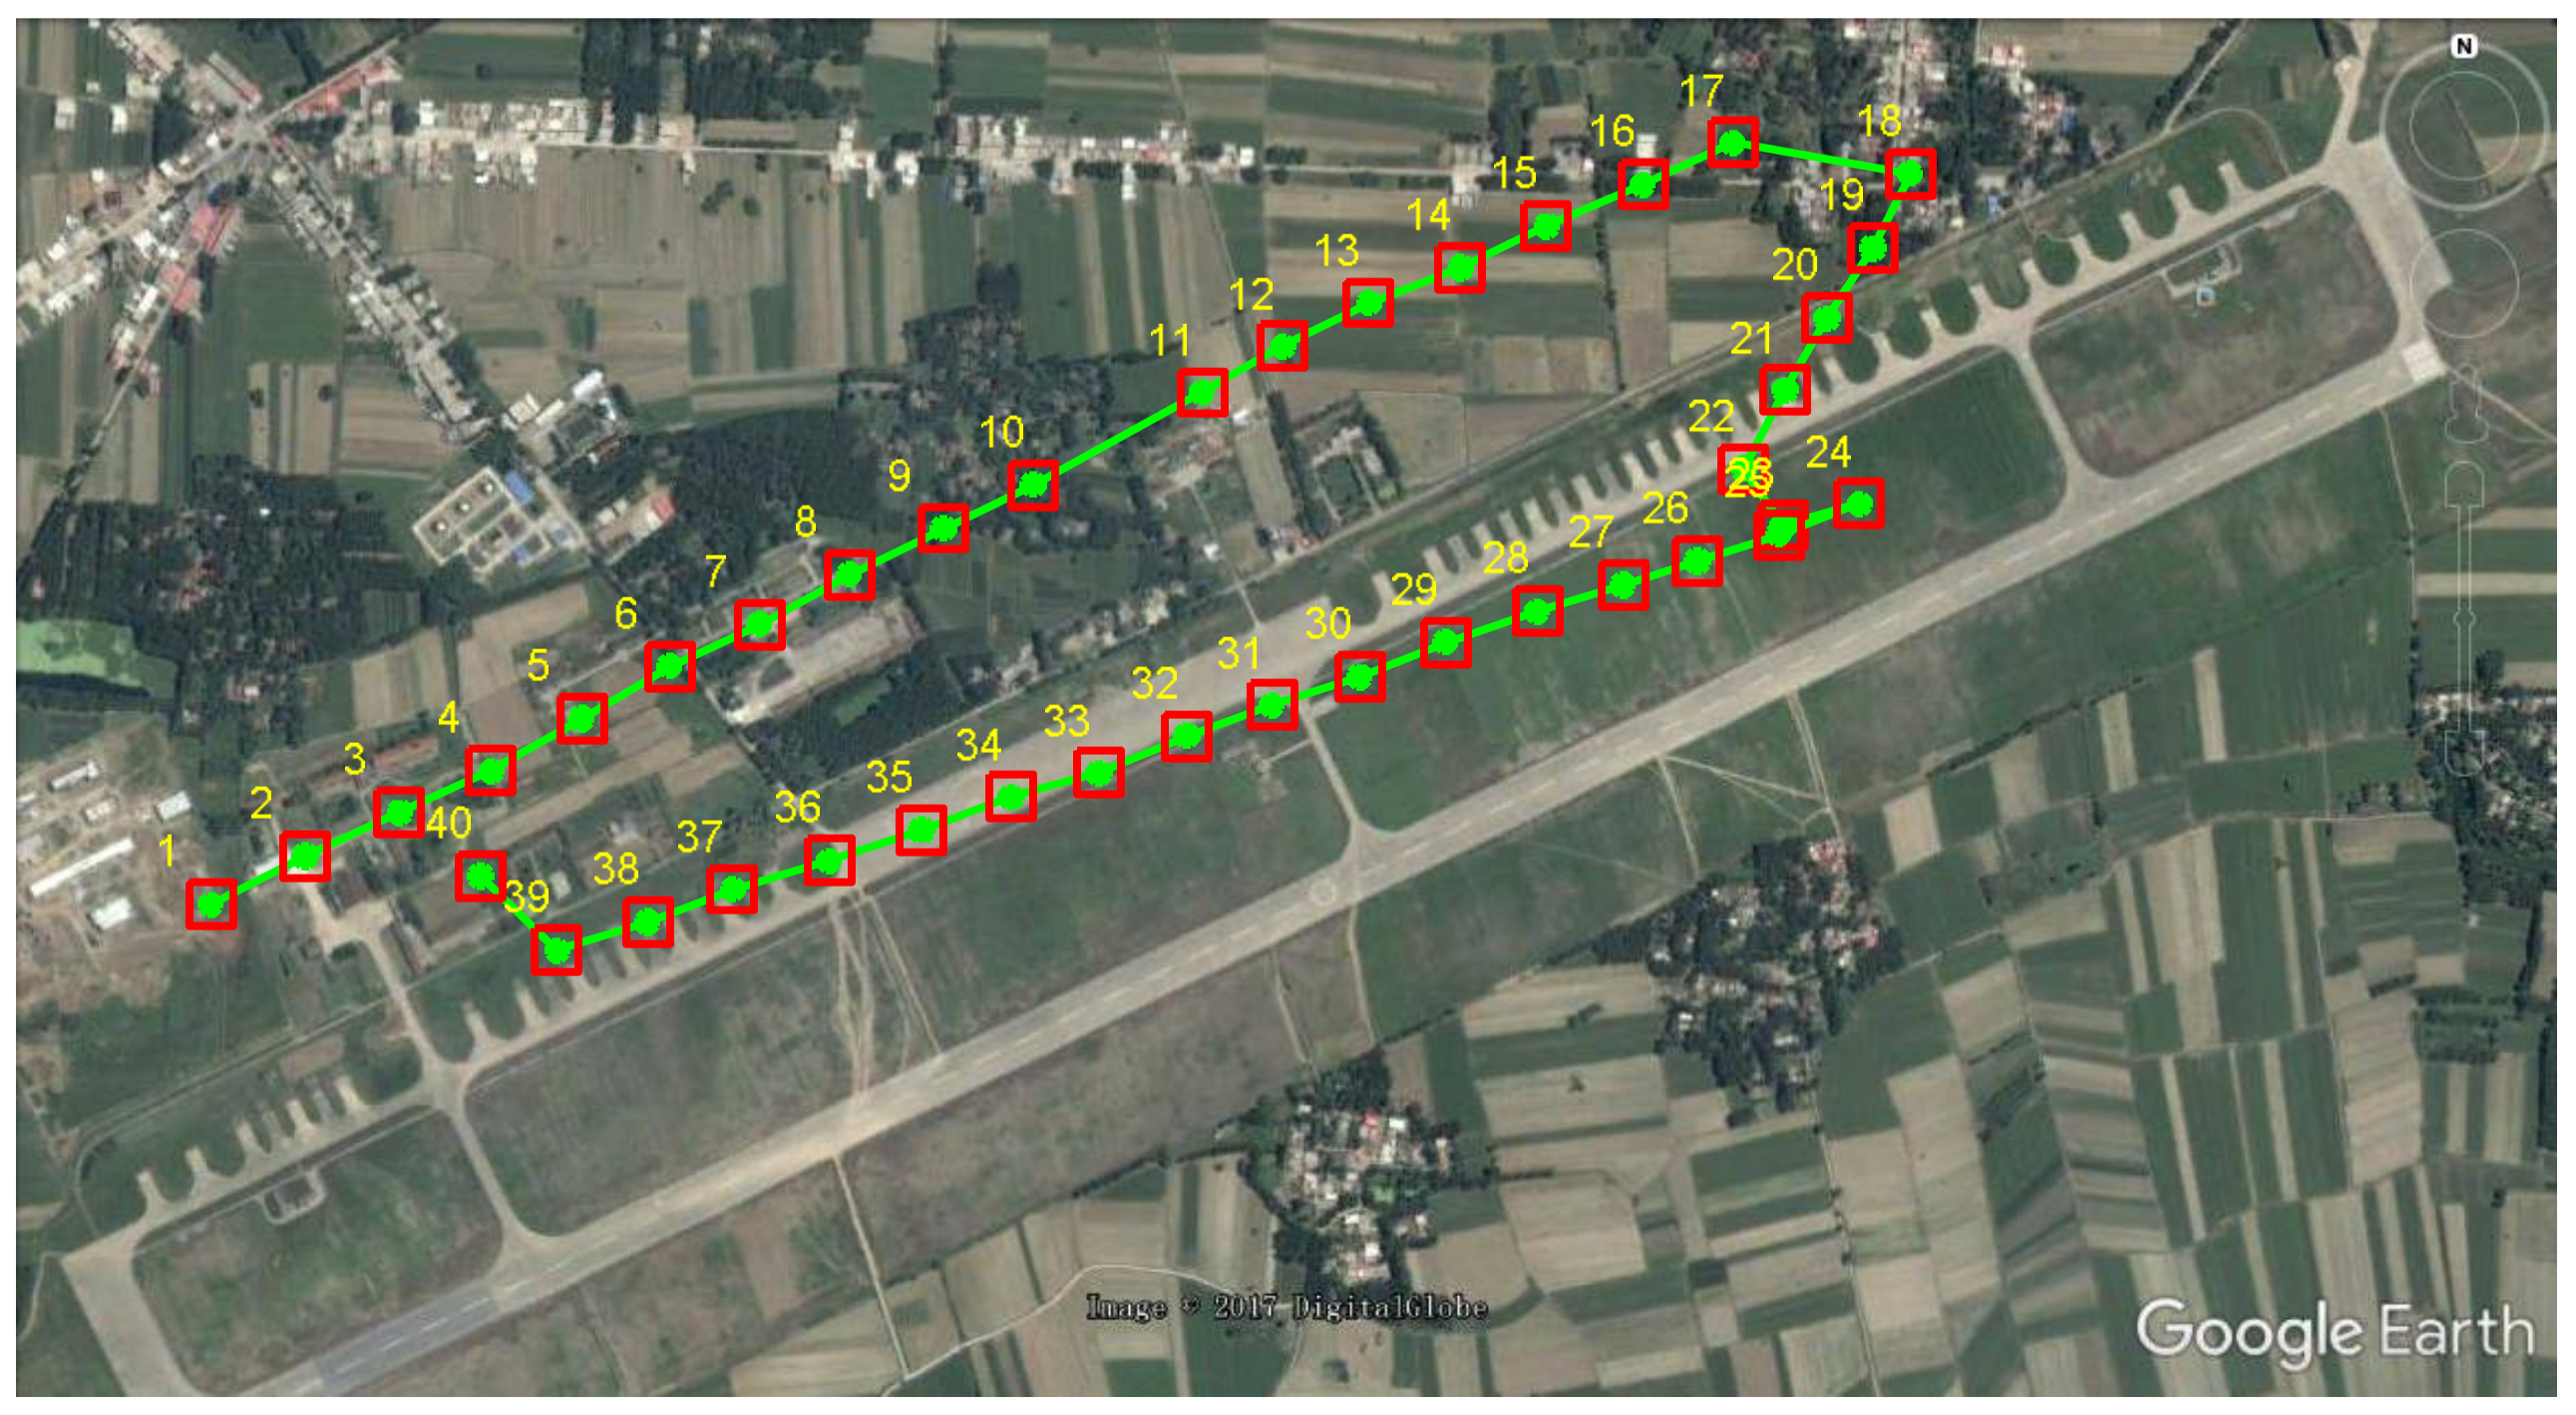
Several registration results of samples are given in Figure 15. We can see that the proposed method can deal with large geometric changes, significant differences in contrast, and variance in some structures. The tracking results are shown in Figure 16. It can be seen that the trajectory can be tracked precisely and steadily. In the process of trajectory tracking, the registration time can be shortened to 230 ms when the number of feature points is reduced to 150, which is acceptable in this application. The average RMSE of the registration results is less than 2 pixels, which equals that when the error of tracking is no more than 3 m. Therefore, the proposed method has the potential for practical application.
5. Conclusions
In this paper, a robust registration method for infrared and visible image using structural features extracted based on phase congruency is presented. The main contribution of the proposed method is the development of a novel affine and contrast invariant descriptor (MSPC). MSPC firstly uses moment ranking analysis to detect feature points, and then describes structural features by using orientated phase congruency in the regions detected by MSER. Several groups of infrared and visible pairs were used to test the validity and practicality of the proposed method. The experimental results show that our method outperforms several state-of-the-art methods in terms of matching performance and RMSE of registration and also demonstrate its effectiveness in the application of UAV trajectory tracking. For the more than 300 infrared and visible images captured by UAV, the average RMSE of the registration results of the proposed method was less than 2 pixels, which is acceptable for practical application.
Improving the speed of the proposed method and implementing it in the embedded environment is the direction of our future work.
Acknowledgments
This research is supported by the China Postdoctoral Science Foundation (2016M592905XB) and the Ninth Academy of China Aerospace Science and Technology Corporation Innovation Foundation (2016JY06).
Author Contributions
Xiangzeng Liu conceived of and designed the experiments and wrote the paper; Yunfeng Ai performed the experiments; Juli Zhang analyzed the data; and Zhuping Wang supervised the study and reviewed the manuscript.
Conflicts of Interest
The authors declare no conflict of interest.
References
- Zitova, B.; Flusser, J. Image registration methods: A survey. Image Vis. Comput. 2003, 21, 977–1000. [Google Scholar] [CrossRef]
- Prasad, D.K.; Rajan, D.; Rachmawati, L.; Rajabally, E.; Quek, C. Video processing from Electro-Optical sensors for object detection and tracking in a maritime environment: A Survey. IEEE Trans. Intell. Transp. Syst. 2017, 18, 1993–2016. [Google Scholar] [CrossRef]
- Li, H.; Ding, W.; Cao, X.; Liu, C. Image registration and fusion of visible and infrared integrated camera for medium-altitude unmanned aerial vehicle. Remote Sens. 2017, 9, 441. [Google Scholar] [CrossRef]
- Klimaszewski, J.; Kondej, M.; Kawecki, M.; Putz, B. Registration of infrared and visible images based on edge extraction and phase correlation approaches. In Image Processing and Communications and Challenges 4. Advances in Intelligent Systems and Computing; Springer: Berlin/Heidelberg, Germany, 2013; Volume 184, pp. 153–162. [Google Scholar]
- Feng, X.; Wu, W.; Li, Z.; Jeon, G.; Pang, Y. Weighted-Hausdorff distance using gradient orientation information for visible and infrared image registration. Optik 2015, 126, 3823–3829. [Google Scholar] [CrossRef]
- Rabatel, G.; Labbe, S. Registration of visible and near infrared unmanned aerial vehicle images based on Fourier-Mellin transform. Precision Agric. 2016, 17, 564–587. [Google Scholar] [CrossRef]
- Sun, M.; Zhang, B.; Liu, J.; Wang, Y.; Yang, Q. The registration of aerial infrared and visible Images. In Proceedings of the International Conference on Educational Information Technology, Chongqing, China, 17–19 September 2010; Volume 1, pp. 438–442. [Google Scholar]
- Kuczyński, K.; Stęgierski, R. Problems of infrared and Visible-Light images automatic registration. In Image Processing and Communications Challenges 5. Advances in Intelligent Systems and Computing; Springer: Berlin/Heidelberg, Germany, 2014; Volume 233, pp. 125–132. [Google Scholar]
- Wang, P.; Qu, Z.; Wang, P.; Gao, Y.; Shen, Z. A coarse-to-fine matching algorithm for FLIR and optical satellite image registration. IEEE Trans. Geosci. Remote Sens. Lett. 2012, 9, 599–603. [Google Scholar] [CrossRef]
- Ye, Y.; Shan, J.; Bruzzone, L.; Li, S. Robust registration of multimodal remote sensing images based on structural similarity. IEEE Trans. Geosci. Remote Sens. 2017, 55, 2941–2958. [Google Scholar] [CrossRef]
- Chen, H.M.; Arora, M.K.; Varshney, P.K. Mutual information-based image registration for remote sensing data. Int. J. Remote Sens. 2003, 24, 3701–3706. [Google Scholar] [CrossRef]
- Yang, F.; Ding, M.; Zhang, X.; Wu, Y.; Hu, J. Two phase non-rigid multi-modal image registration using weber local descriptor-based similarity metrics and normalized mutual information. Sensors 2013, 13, 7599–7617. [Google Scholar] [CrossRef] [PubMed]
- Orchard, J. Efficient least squares multimodal registration with a globally exhaustive alignment search. IEEE Trans. Image Process. 2007, 16, 2526–2534. [Google Scholar] [CrossRef] [PubMed]
- Geng, Y.; Wang, Y. Registration of visible and infrared images based on gradient information. 3D Res. 2017, 8, 1–10. [Google Scholar] [CrossRef]
- Zou, Y.; Dong, F.; Lei, B.; Fang, L.; Sun, S. Image thresholding based on template matching with arctangent Hausdorff distance measure. Opt. Lasers Eng. 2013, 51, 600–609. [Google Scholar] [CrossRef]
- Zhu, X.; Hao, Y.G.; Wang, H.Y. Research on infrared and visible images registration algorithm based on graph. In Proceedings of the International Conference on Information Science and Technology, Wuhan, China, 24–26 March 2017; p. 02002. [Google Scholar]
- Yi, X.; Wang, B.; Fang, Y.; Liu, S. Registration of infrared and visible images based on the correlation of the edges. In Proceedings of the International Congress on Image and Signal Processing, Hangzhou, China, 16–18 December 2013; pp. 990–994. [Google Scholar]
- Han, J.; Pauwels, E.; Zeeuw, P. Visible and infrared image registration employing line-based geometric Analysis. In Computational Intelligence for Multimedia Understanding; Springer: Berlin/Heidelberg, Germany, 2011; Volume 7252, pp. 114–125. [Google Scholar]
- Li, Y.; Stevenson, R.L. Multimodal image registration with line segments by selective search. IEEE Trans. Cybern. 2017, 47, 1285–1297. [Google Scholar] [CrossRef] [PubMed]
- Wang, Z.; Wu, F.; Hu, Z. MSLD: A robust descriptor for line matching. Pattern Recognit. 2009, 42, 941–953. [Google Scholar] [CrossRef]
- Zhao, C.; Zhao, H.; Lv, J.; Sun, S.; Li, B. Multimodal image matching based on multimodality robust line segment descriptor. Neurocomputing 2016, 177, 290–303. [Google Scholar] [CrossRef]
- Lyu, C.; Jie Jian, J. Remote sensing image registration with line segments and their intersections. Remote Sens. 2017, 9, 439. [Google Scholar]
- Chen, Y.; Dai, J.; Mao, X.; Liu, Y.; Jiang, X. Image registration between visible and infrared images for electrical equipment inspection robots based on quadrilateral features. In Proceedings of the International Conference on Robotics and Automation Engineering, Shanghai, China, 29–31 December 2017; pp. 126–130. [Google Scholar]
- Lowe, D. Distinctive image features from scale-invariant keypoints. Int. J. Comput. Vis. 2004, 60, 91–110. [Google Scholar] [CrossRef]
- Bay, H.; Ess, A.; Tuytelaars, T.; Gool, L.V. Speeded-up robust features. Comput. Vis. Image Understand. 2008, 110, 346–359. [Google Scholar] [CrossRef]
- Hossain, M.; Teng, S.W.; Lu, G. Achieving high multi-modal registration performance using simplified Hough-transform with improved symmetric-SIFT. In Proceedings of the International Conference on Digital Image Computing Techniques and Applications, Fremantle, WA, Australia, 3–5 December 2012; pp. 1–7. [Google Scholar]
- Zhao, D.; Yang, Y.; Ji, Z.; Hu, X. Rapid multimodality registration based on MM-SURF. Neurocomputing 2014, 131, 87–97. [Google Scholar] [CrossRef]
- Wu, F.; Wang, B.; Yi, X.; Li, M.; Hao, J.; Qin, H.; Zhou, H. Visible and infrared image registration based on visual salient features. J. Electron. Imaging 2015, 24, 053017. [Google Scholar] [CrossRef]
- Wong, A.; Orchard, J. Robust multimodal registration using local phase-coherence representations. J. Signal Process. Syst. 2009, 54, 89–100. [Google Scholar] [CrossRef]
- Xia, R.; Zhao, J.; Liu, Y. A robust feature-based registration method of multimodal image using phase congruency and coherent point drift. In Proceedings of the International Symposium on Multispectral Image Processing and Pattern Recognition, Wuhan, China, 26–27 October 2013; Volume 8919, p. 891903. [Google Scholar]
- Liu, X.; Lei, Z.; Yu, Q.; Zhang, X.; Shang, Y.; Hou, W. Multi-modal image matching based on local frequency information. EURASIP J. Adv. Sig. Process. 2013, 3, 1–11. [Google Scholar] [CrossRef]
- Chen, M.; Habib, A.; He, H.; Zhu, Q.; Zhang, W. Robust feature matching method for SAR and optical images by using Gaussian-Gamma-Shaped Bi-Windows-based descriptor and geometric constraint. Remote Sens. 2017, 9, 882. [Google Scholar] [CrossRef]
- Zhang, L.; Dwarikanath, M.; Jeroen, A.W.T.; Jaap, S.; Lucas, J.V.; Frans, M.V. Image registration based on autocorrelation of local structure. IEEE Trans. Med. Imaging 2016, 35, 63–75. [Google Scholar]
- Morrone, M.C.; Ross, J.; Burr, D.C.; Owens, R. Mach bands are phase dependent. Nature 1986, 324, 250–253. [Google Scholar] [CrossRef]
- Kovesi, P. Phase congruency: A low-level image invariant. Psych. Res. 2000, 64, 136–148. [Google Scholar] [CrossRef]
- Kovesi, P. Phase congruency detects corners and edges. In Proceedings of the Conference on Digital Image Computing: Techniques and Applications, 10–12 December 2003; pp. 309–318. [Google Scholar]
- Donoser, M.; Bischof, H. Efficient maximally stable extremal region (MSER) tracking. In Proceedings of the IEEE Conference on Computer Vision and Pattern Recognition, New York, NY, USA, 17–22 June 2006; pp. 553–560. [Google Scholar]
Figure 1.
Differences of contrast and viewpoints in input images. (a) Infrared image; (b) Corresponding regions and their gradient images; and (c) Visible image.
Figure 1.
Differences of contrast and viewpoints in input images. (a) Infrared image; (b) Corresponding regions and their gradient images; and (c) Visible image.

Figure 2.
Illustration of registration by using the proposed method.

Figure 3.
Feature points detection by the method of salient feature points extraction (MSFPE).

Figure 4.
Structural features extraction using multi-orientation phase congruency.

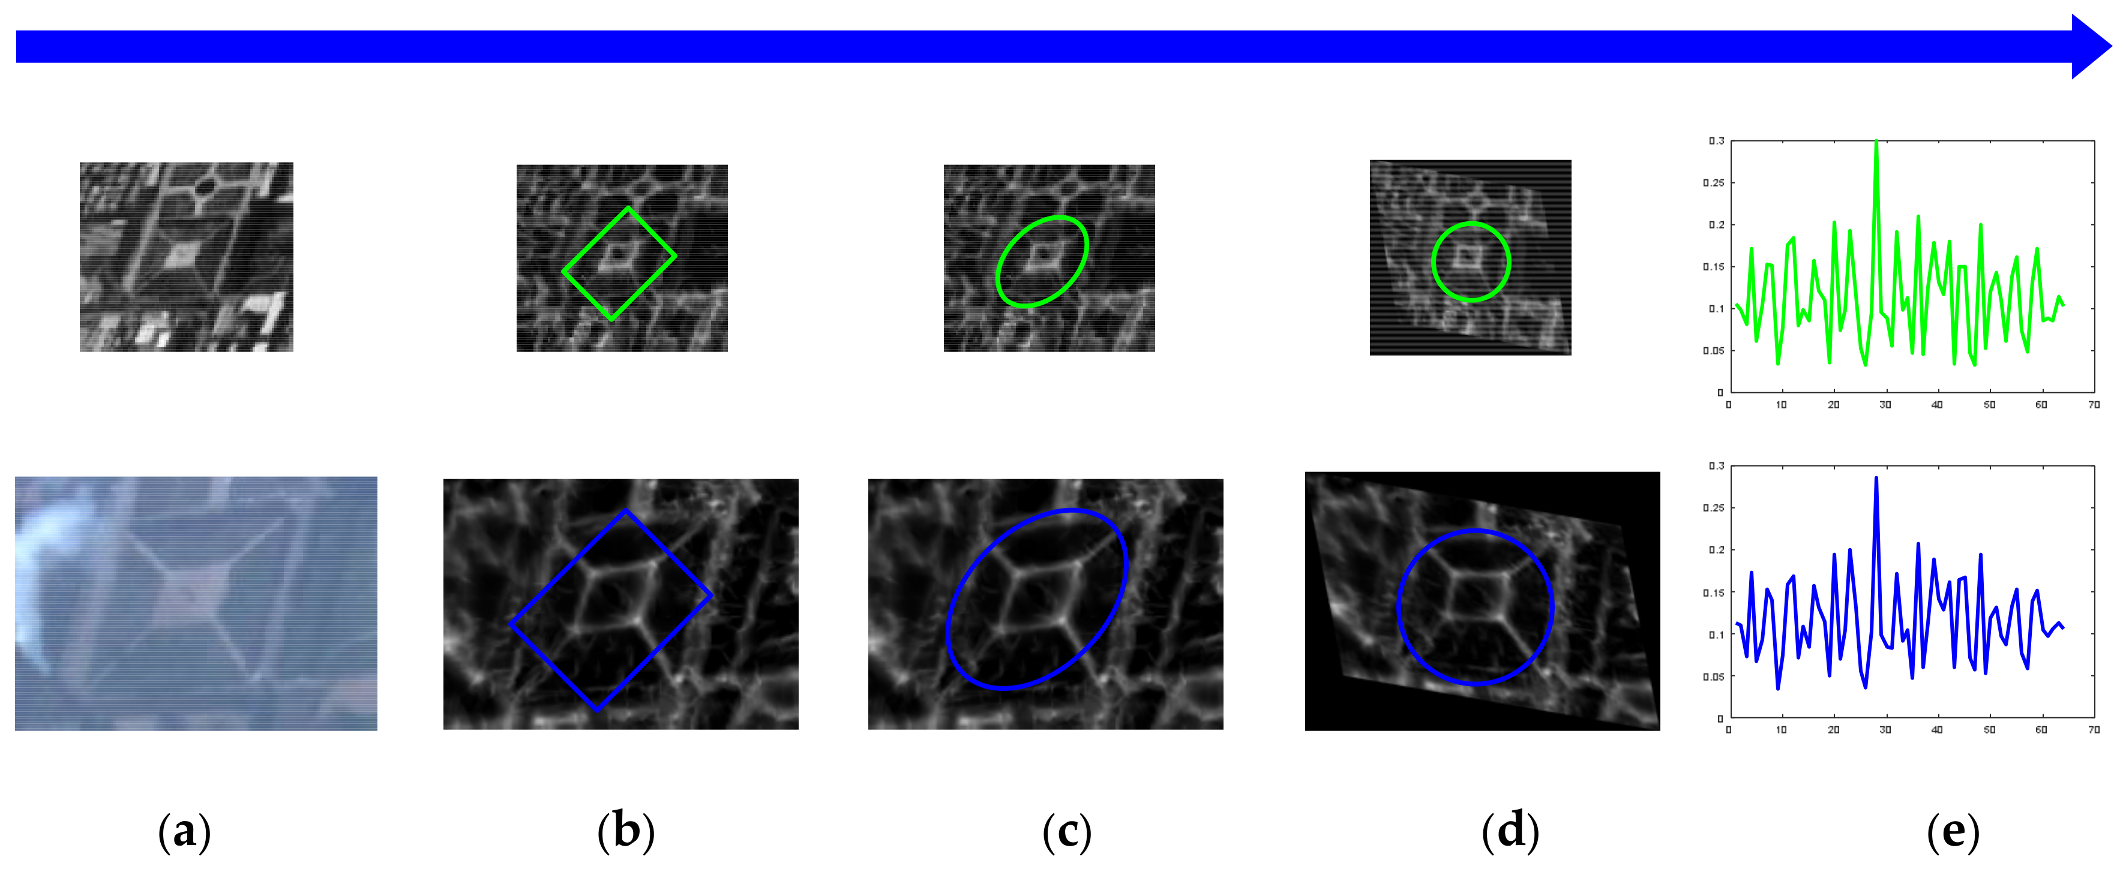
Figure 5.
The construction of the maximally stable phase congruency (MSPC) descriptor from input images. (a) Original patches around the feature points; (b) Rectangle regions from structural features image (SFI) according to the scales and orientations of the feature points; (c) Fine ellipse regions detected by maximally stable extremal regions (MSER) based on the rectangle regions; (d) Normalized circle regions relate to the ellipse regions; (e) MSPC descriptors constructed in the circle regions.

Figure 6.
Flow chart of the proposed registration.

Figure 7.
(a–d) are different infrared and visible image pairs from CVC datasets.


Figure 8.
Matching results using the proposed method for Figure 7. (a–d) are the matching results of the Figure 7a–d respectively.

Figure 9.
(a–f) are the samples of image pairs captured from electro-optical pod (EOP) on UAV.

Figure 10.
Matching results by the proposed method for Figure 9. (a–f) are the matching results of the Figure 9a–f respectively.


Figure 11.
Comparison of matching performance by the related methods. (a) is the matching precision for the six image pairs in Figure 9 by the related methods; (b) is repeatability for the six image pairs in Figure 9 by the related methods.

Figure 12.
Registration results by the proposed method for Figure 9. (a–f) are the registration results of the proposed method for Figure 9a–f respectively.

Figure 13.
Reference image download from Google.

Figure 14.
Samples of the sub-images from the real-time images.

Figure 15.
Several registration results of the samples in Figure 14 and the sub-regions of the reference image in Figure 13.

Figure 16.
UAV trajectory tracking results of our registration method.


Table 1.
Matching performance of the related methods in Figure 8.
Table 1.
Matching performance of the related methods in Figure 8.
| Image Pairs | MM-SURF | FVS-DR | LFI | MRLSD | HOPC | Our Method | |
|---|---|---|---|---|---|---|---|
| Precision | (a) | 40.72 | 75.36 | 80.22 | 85.58 | 87.13 | 91.85 |
| (b) | 35.14 | 77.81 | 82.56 | 88.72 | 93.37 | 97.78 | |
| (c) | 22.31 | 73.30 | 77.28 | 82.15 | 91.26 | 96.65 | |
| (d) | 9.84 | 69.81 | 75.95 | 78.31 | 81.54 | 90.21 | |
| Repeat-ability | (a) | 10.83 | 20.48 | 28.47 | 35.19 | 32.24 | 39.60 |
| (b) | 5.77 | 14.63 | 25.23 | 33.64 | 35.79 | 42.80 | |
| (c) | 3.23 | 11.12 | 21.41 | 20.33 | 23.82 | 26.00 | |
| (d) | 2.18 | 6.42 | 15.52 | 19.97 | 17.82 | 24.80 | |
Table 2.
Root-mean-square error (RMSE) of registration results of the related methods in Figure 9.
Table 2.
Root-mean-square error (RMSE) of registration results of the related methods in Figure 9.
| Image Pairs | MM-SURF | FVS-DR | LFI | MRLSD | HOPC | Our Method |
|---|---|---|---|---|---|---|
| (a) | 2.61 | 2.44 | 3.54 | 1.57 | 2.11 | 0.82 |
| (b) | 3.36 | 2.88 | 2.72 | ---- | 3.63 | 1.23 |
| (c) | 4.68 | 3.39 | 3.66 | 2.35 | 4.55 | 0.76 |
| (d) | 3.97 | 3.73 | 4.19 | 2.56 | 4.62 | 0.58 |
| (e) | ---- | ---- | 5.57 | 3.12 | ---- | 1.37 |
| (f) | ---- | ---- | 4.81 | 3.38 | 2.26 | 1.41 |
Table 3.
Average time of registration by the related methods in Figure 9.
Table 3.
Average time of registration by the related methods in Figure 9.
| Method | MM-SURF | FVS-DR | LFI | MRLSD | HOPC | Our Method |
|---|---|---|---|---|---|---|
| Run time | 0.8S | 1.85S | 2.8S | 2.5S | 15.8S | 2.1S |
© 2018 by the authors. Licensee MDPI, Basel, Switzerland. This article is an open access article distributed under the terms and conditions of the Creative Commons Attribution (CC BY) license (http://creativecommons.org/licenses/by/4.0/).
Share and Cite
MDPI and ACS Style
Liu, X.; Ai, Y.; Zhang, J.; Wang, Z. A Novel Affine and Contrast Invariant Descriptor for Infrared and Visible Image Registration. Remote Sens. 2018, 10, 658. https://doi.org/10.3390/rs10040658
AMA Style
Liu X, Ai Y, Zhang J, Wang Z. A Novel Affine and Contrast Invariant Descriptor for Infrared and Visible Image Registration. Remote Sensing. 2018; 10(4):658. https://doi.org/10.3390/rs10040658
Chicago/Turabian StyleLiu, Xiangzeng, Yunfeng Ai, Juli Zhang, and Zhuping Wang. 2018. "A Novel Affine and Contrast Invariant Descriptor for Infrared and Visible Image Registration" Remote Sensing 10, no. 4: 658. https://doi.org/10.3390/rs10040658
Note that from the first issue of 2016, this journal uses article numbers instead of page numbers. See further details here.