Mapping and Characterizing Thermal Dilation of Civil Infrastructures with Multi-Temporal X-Band Synthetic Aperture Radar Interferometry


Abstract
:
1. Introduction
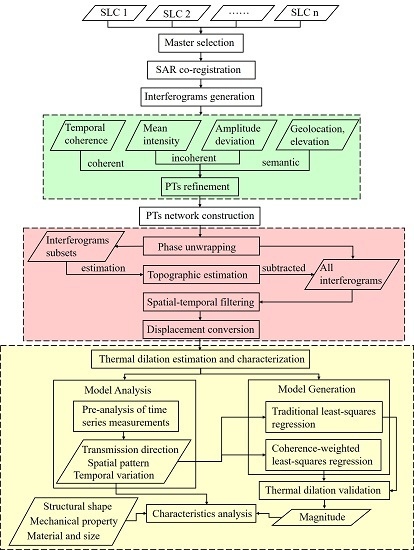
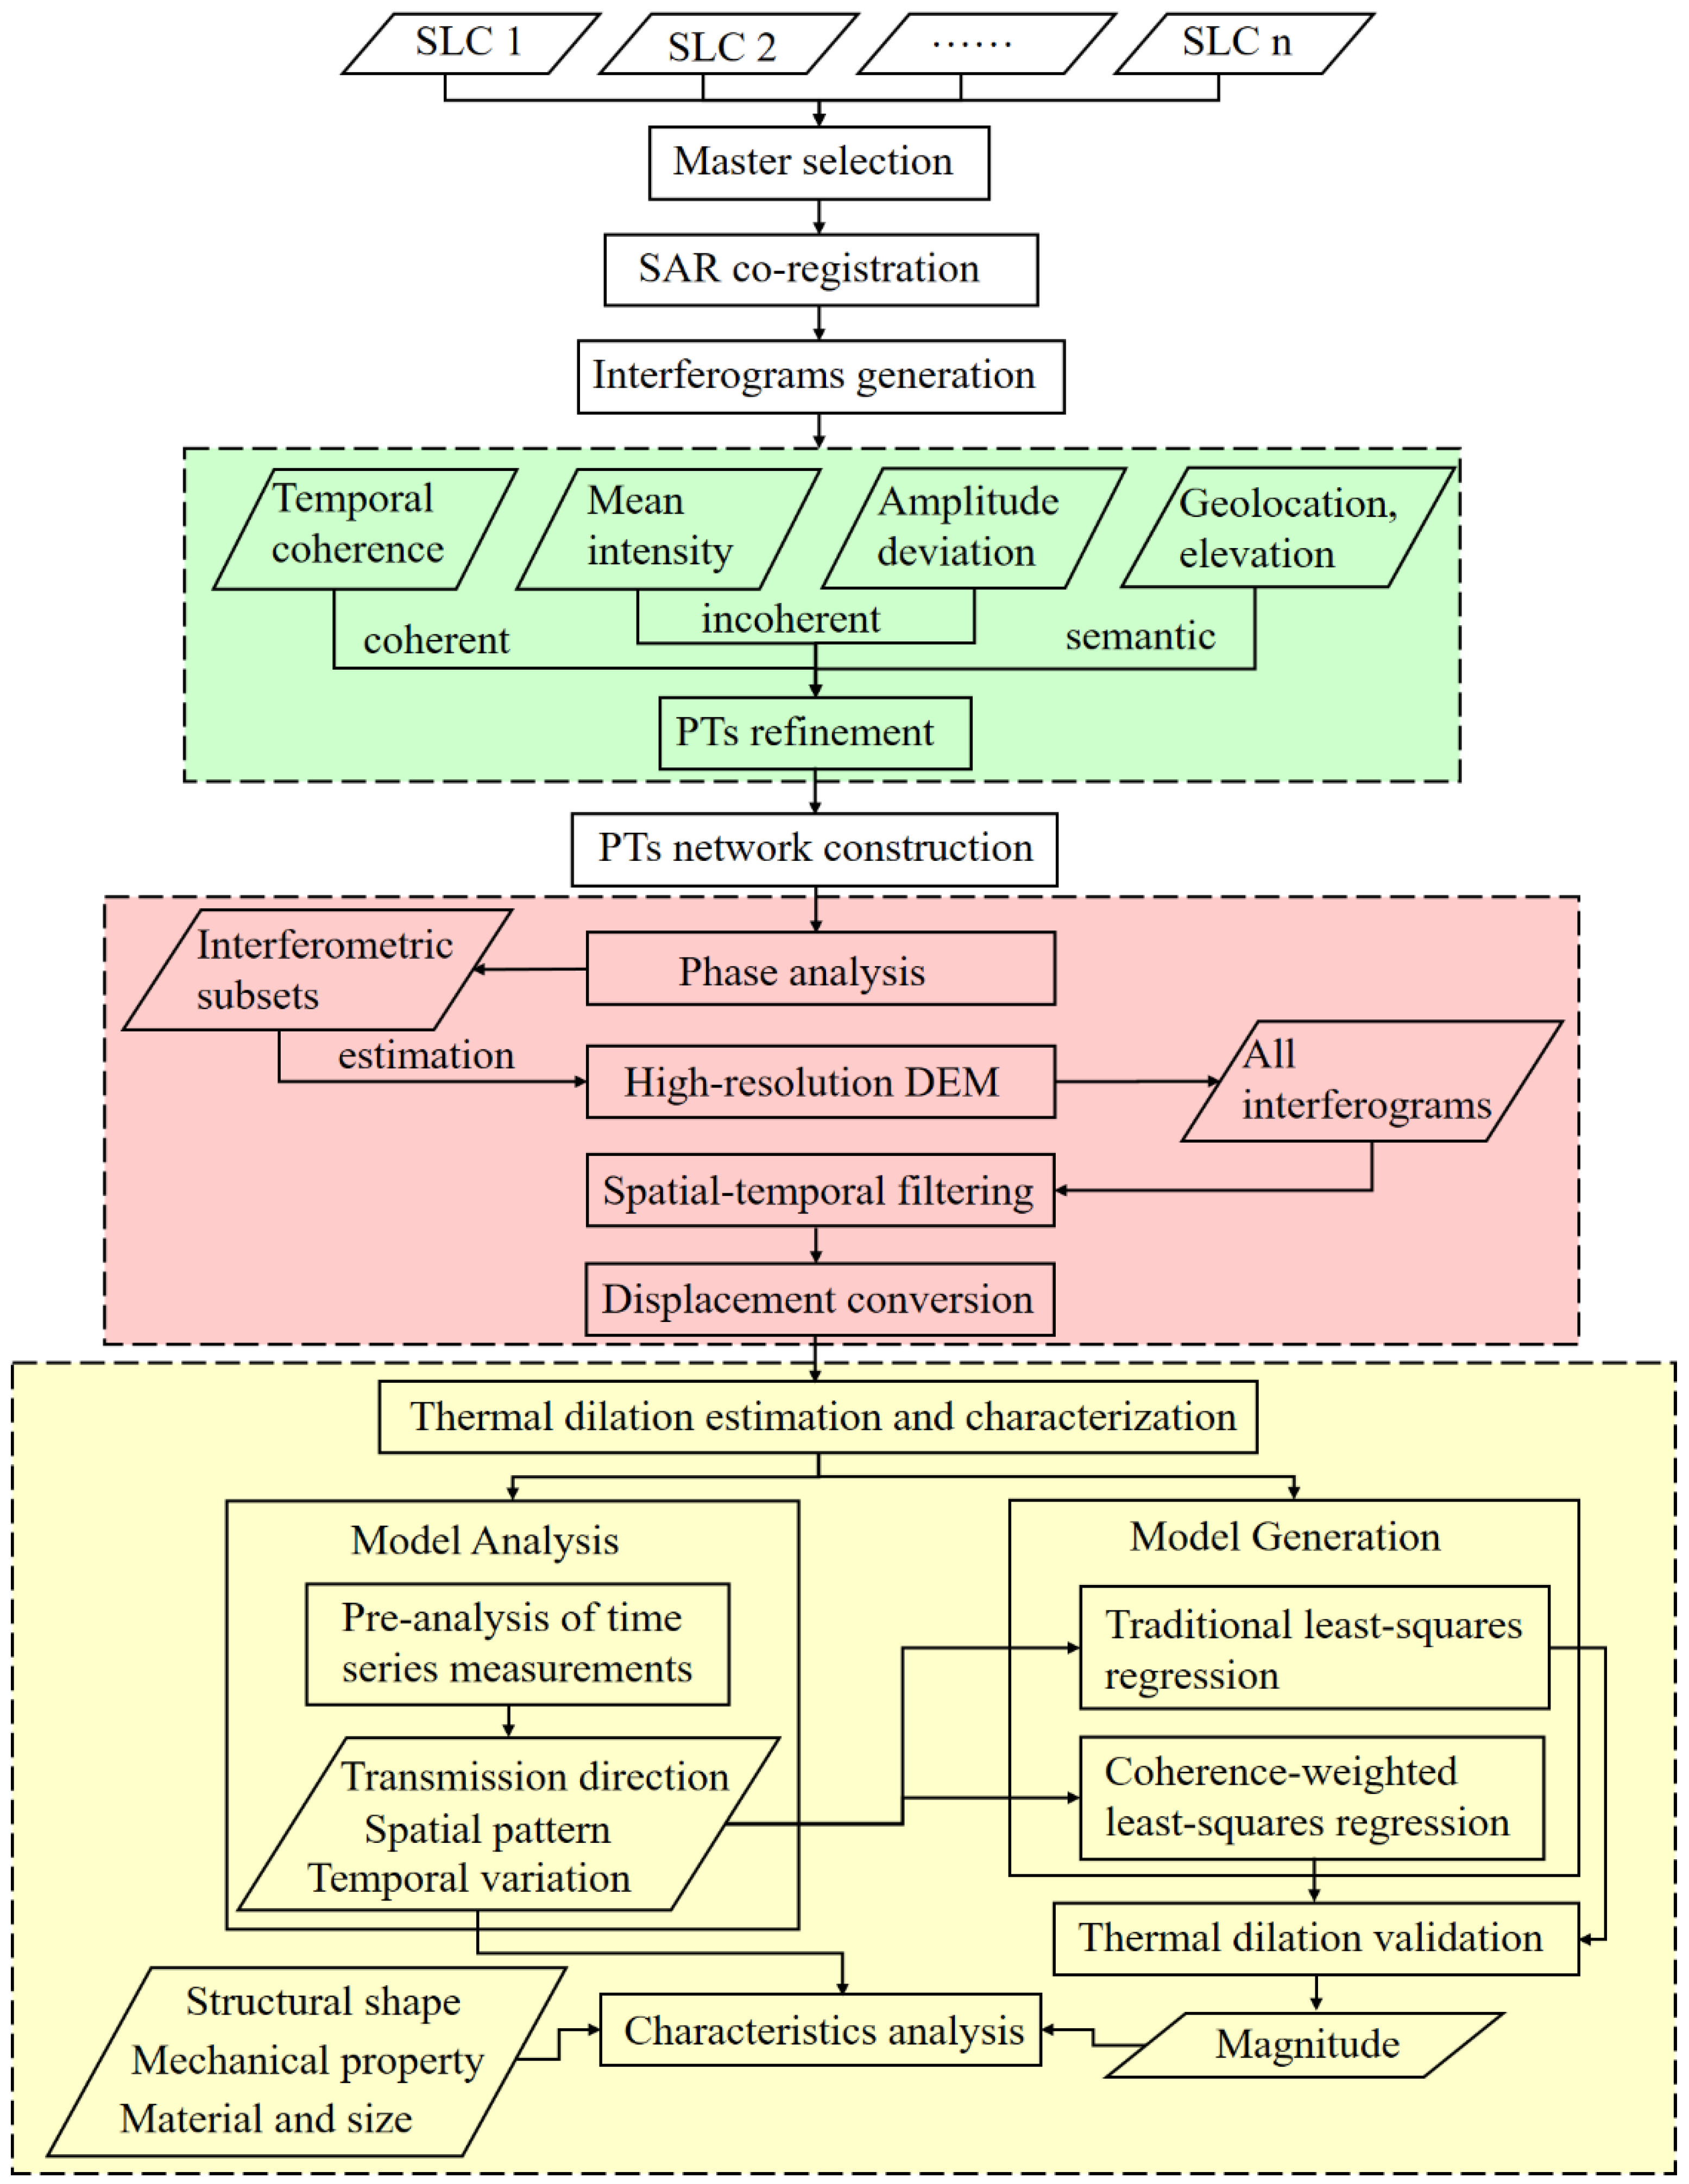
2. Methodology
2.1. Refined Point-Like Target Detection
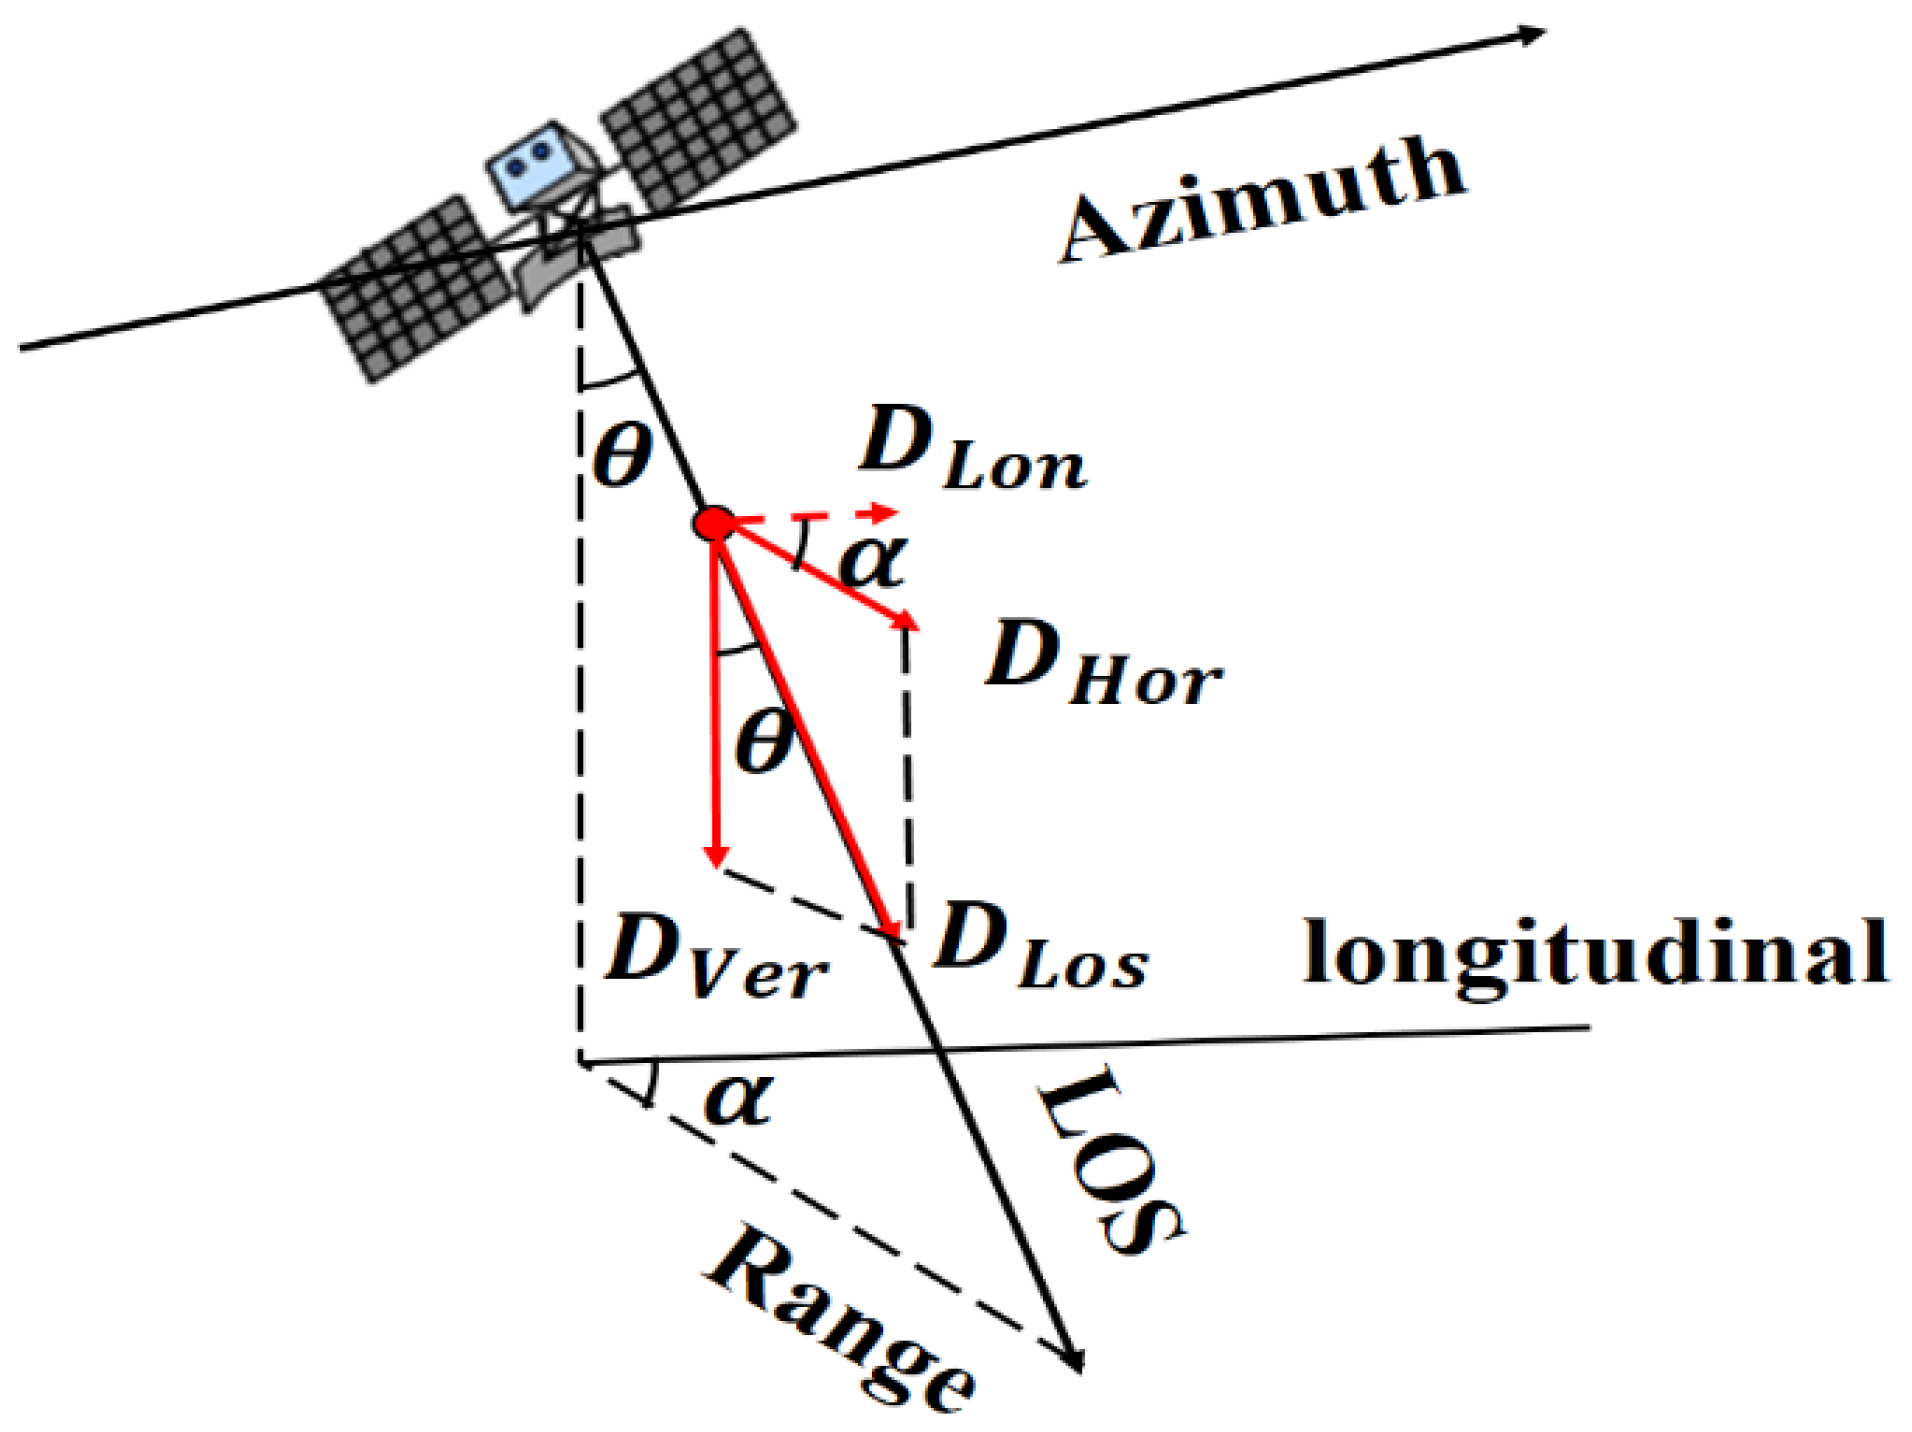
2.2. Topographic Phase Estimation and Displacement Retrieval
2.3. Thermal Dilation Mapping and Characterization
3. Case Studies and Preliminary Results
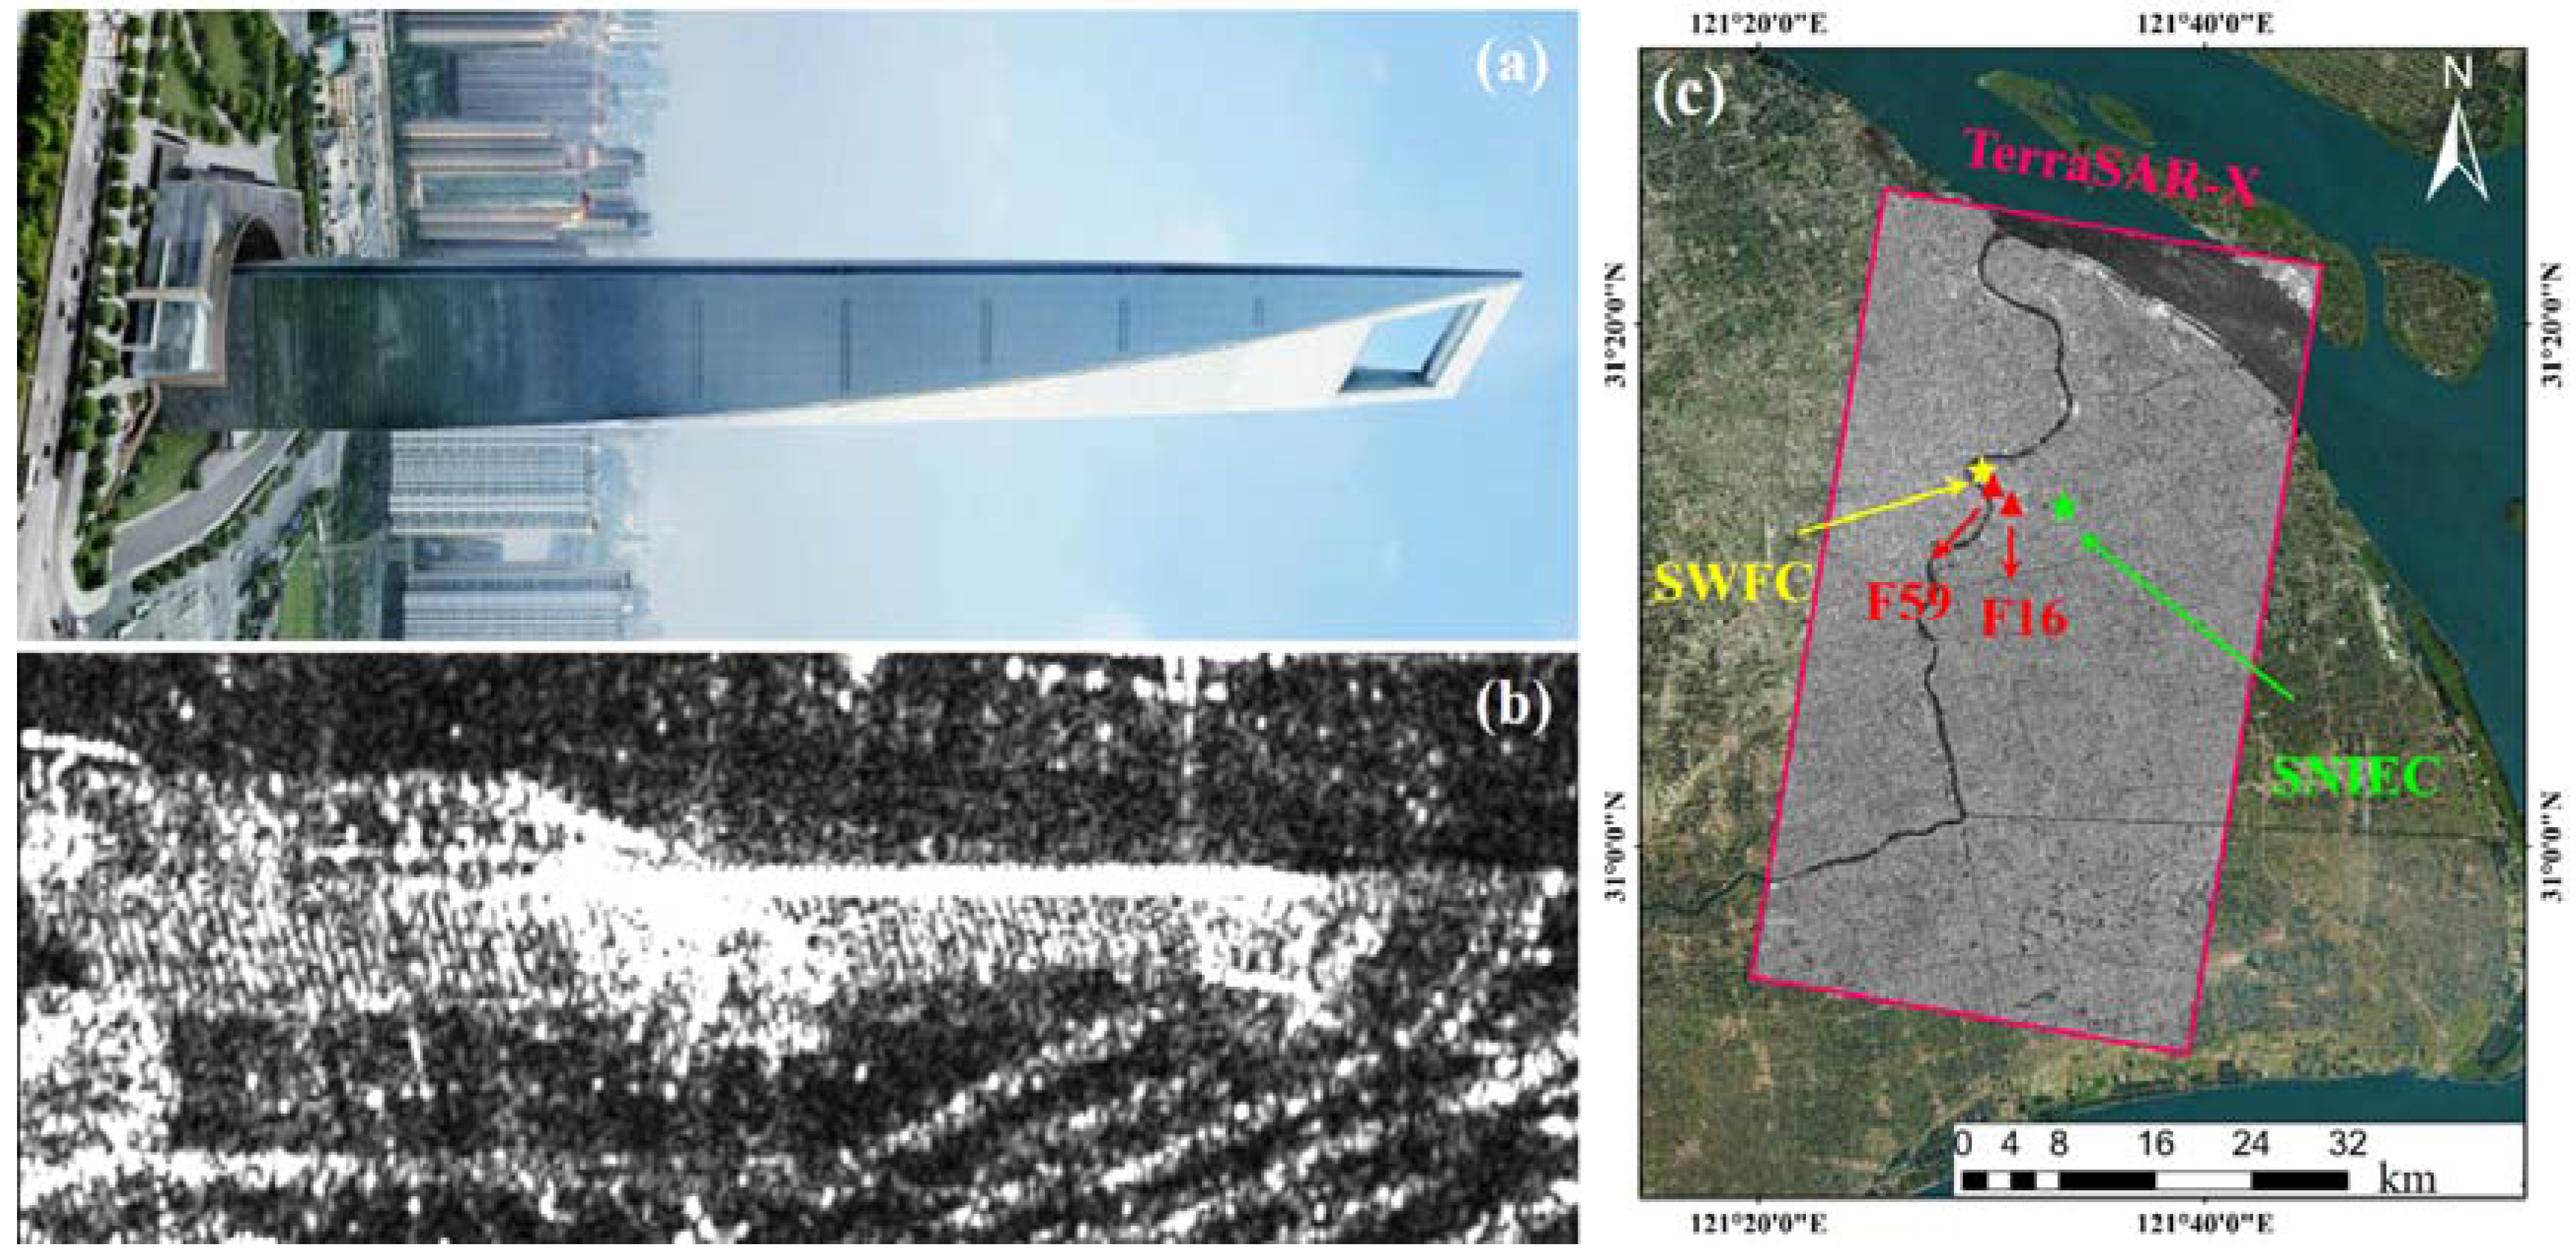
3.1. Skyscraper
3.1.1. The SWFC and SAR Data
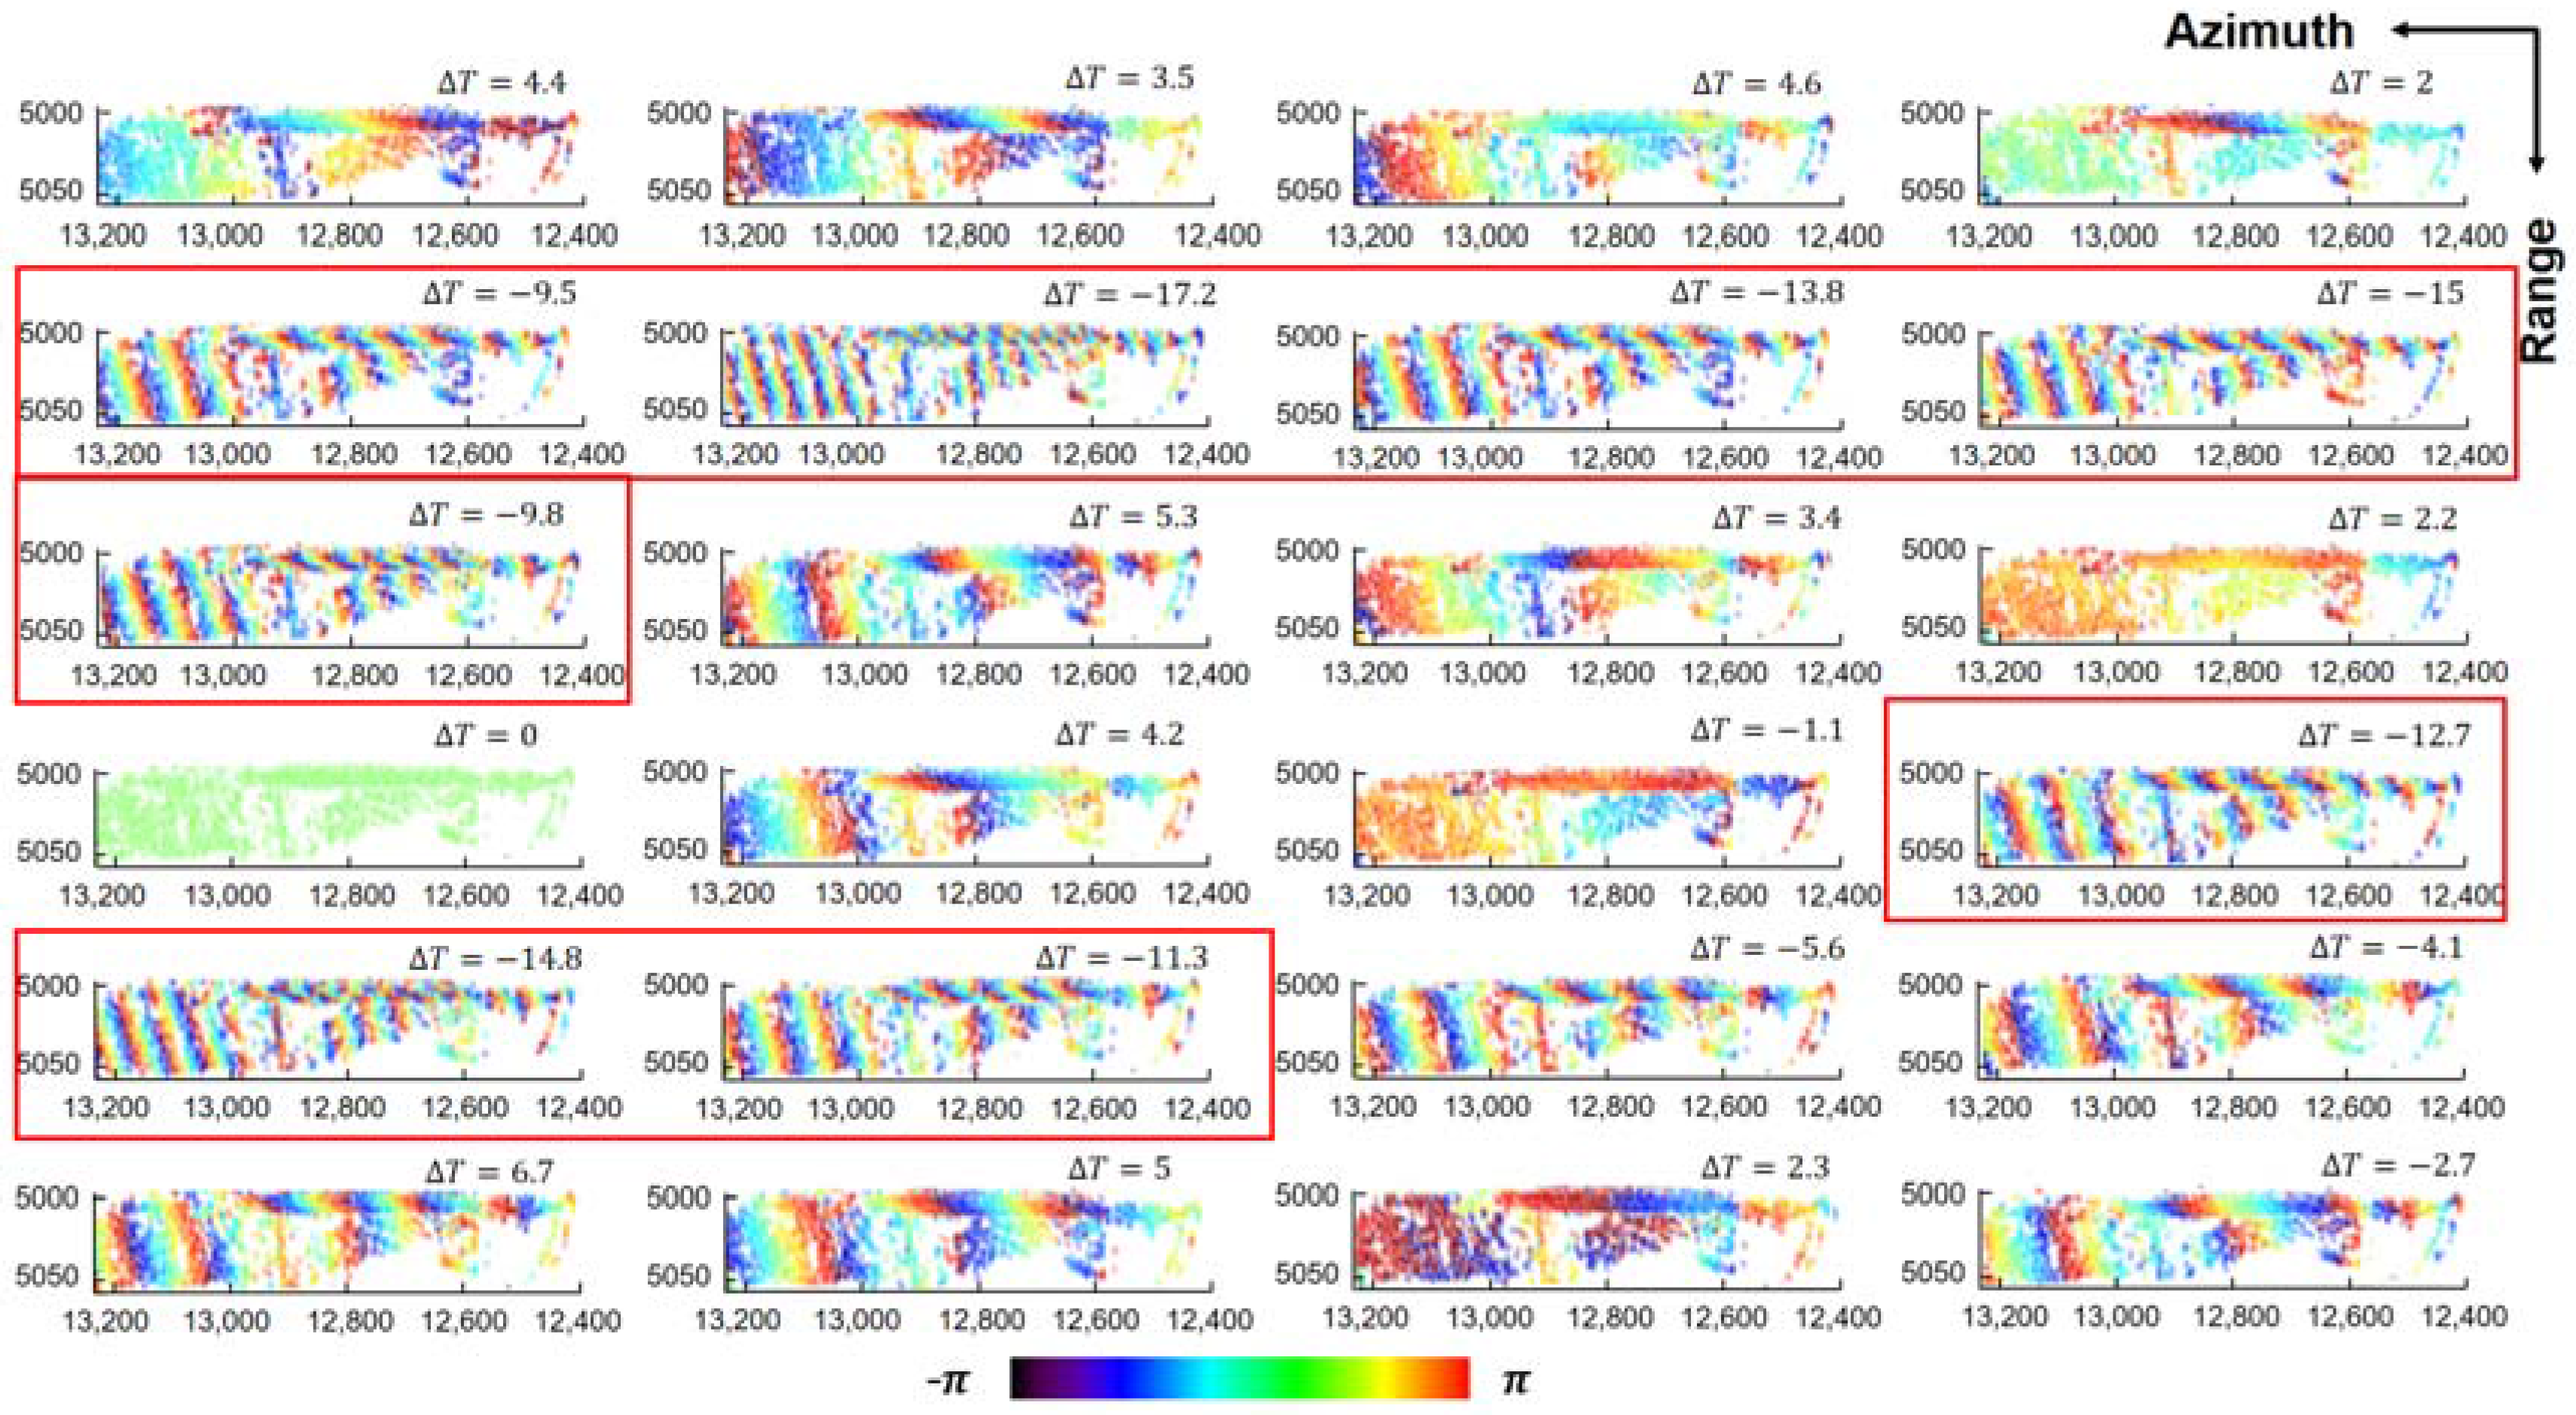
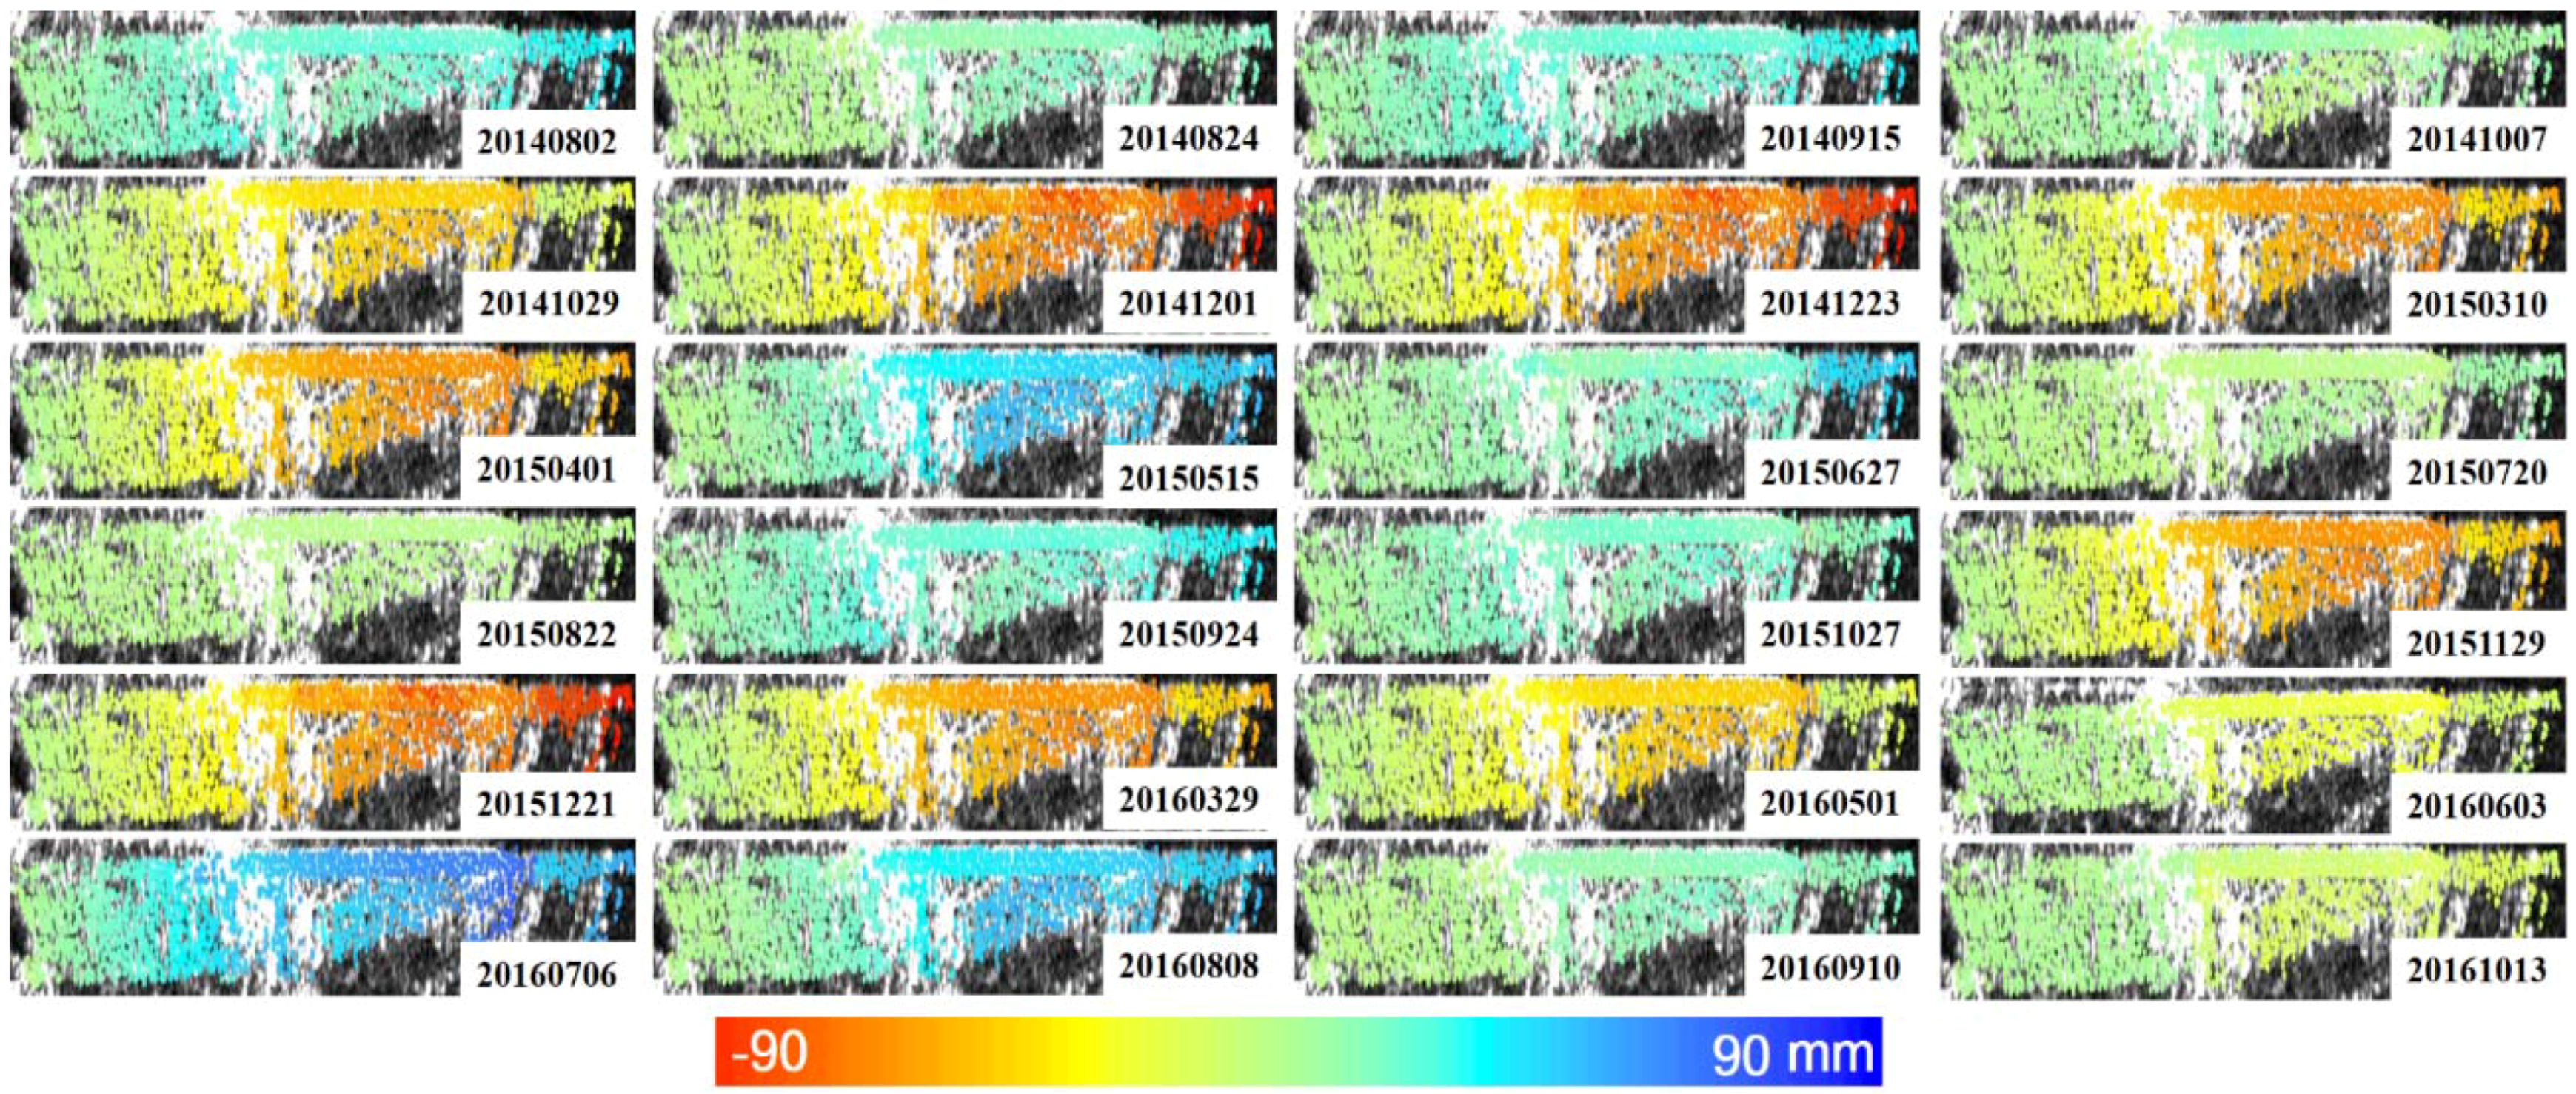
3.1.2. Thermal Dilation Results
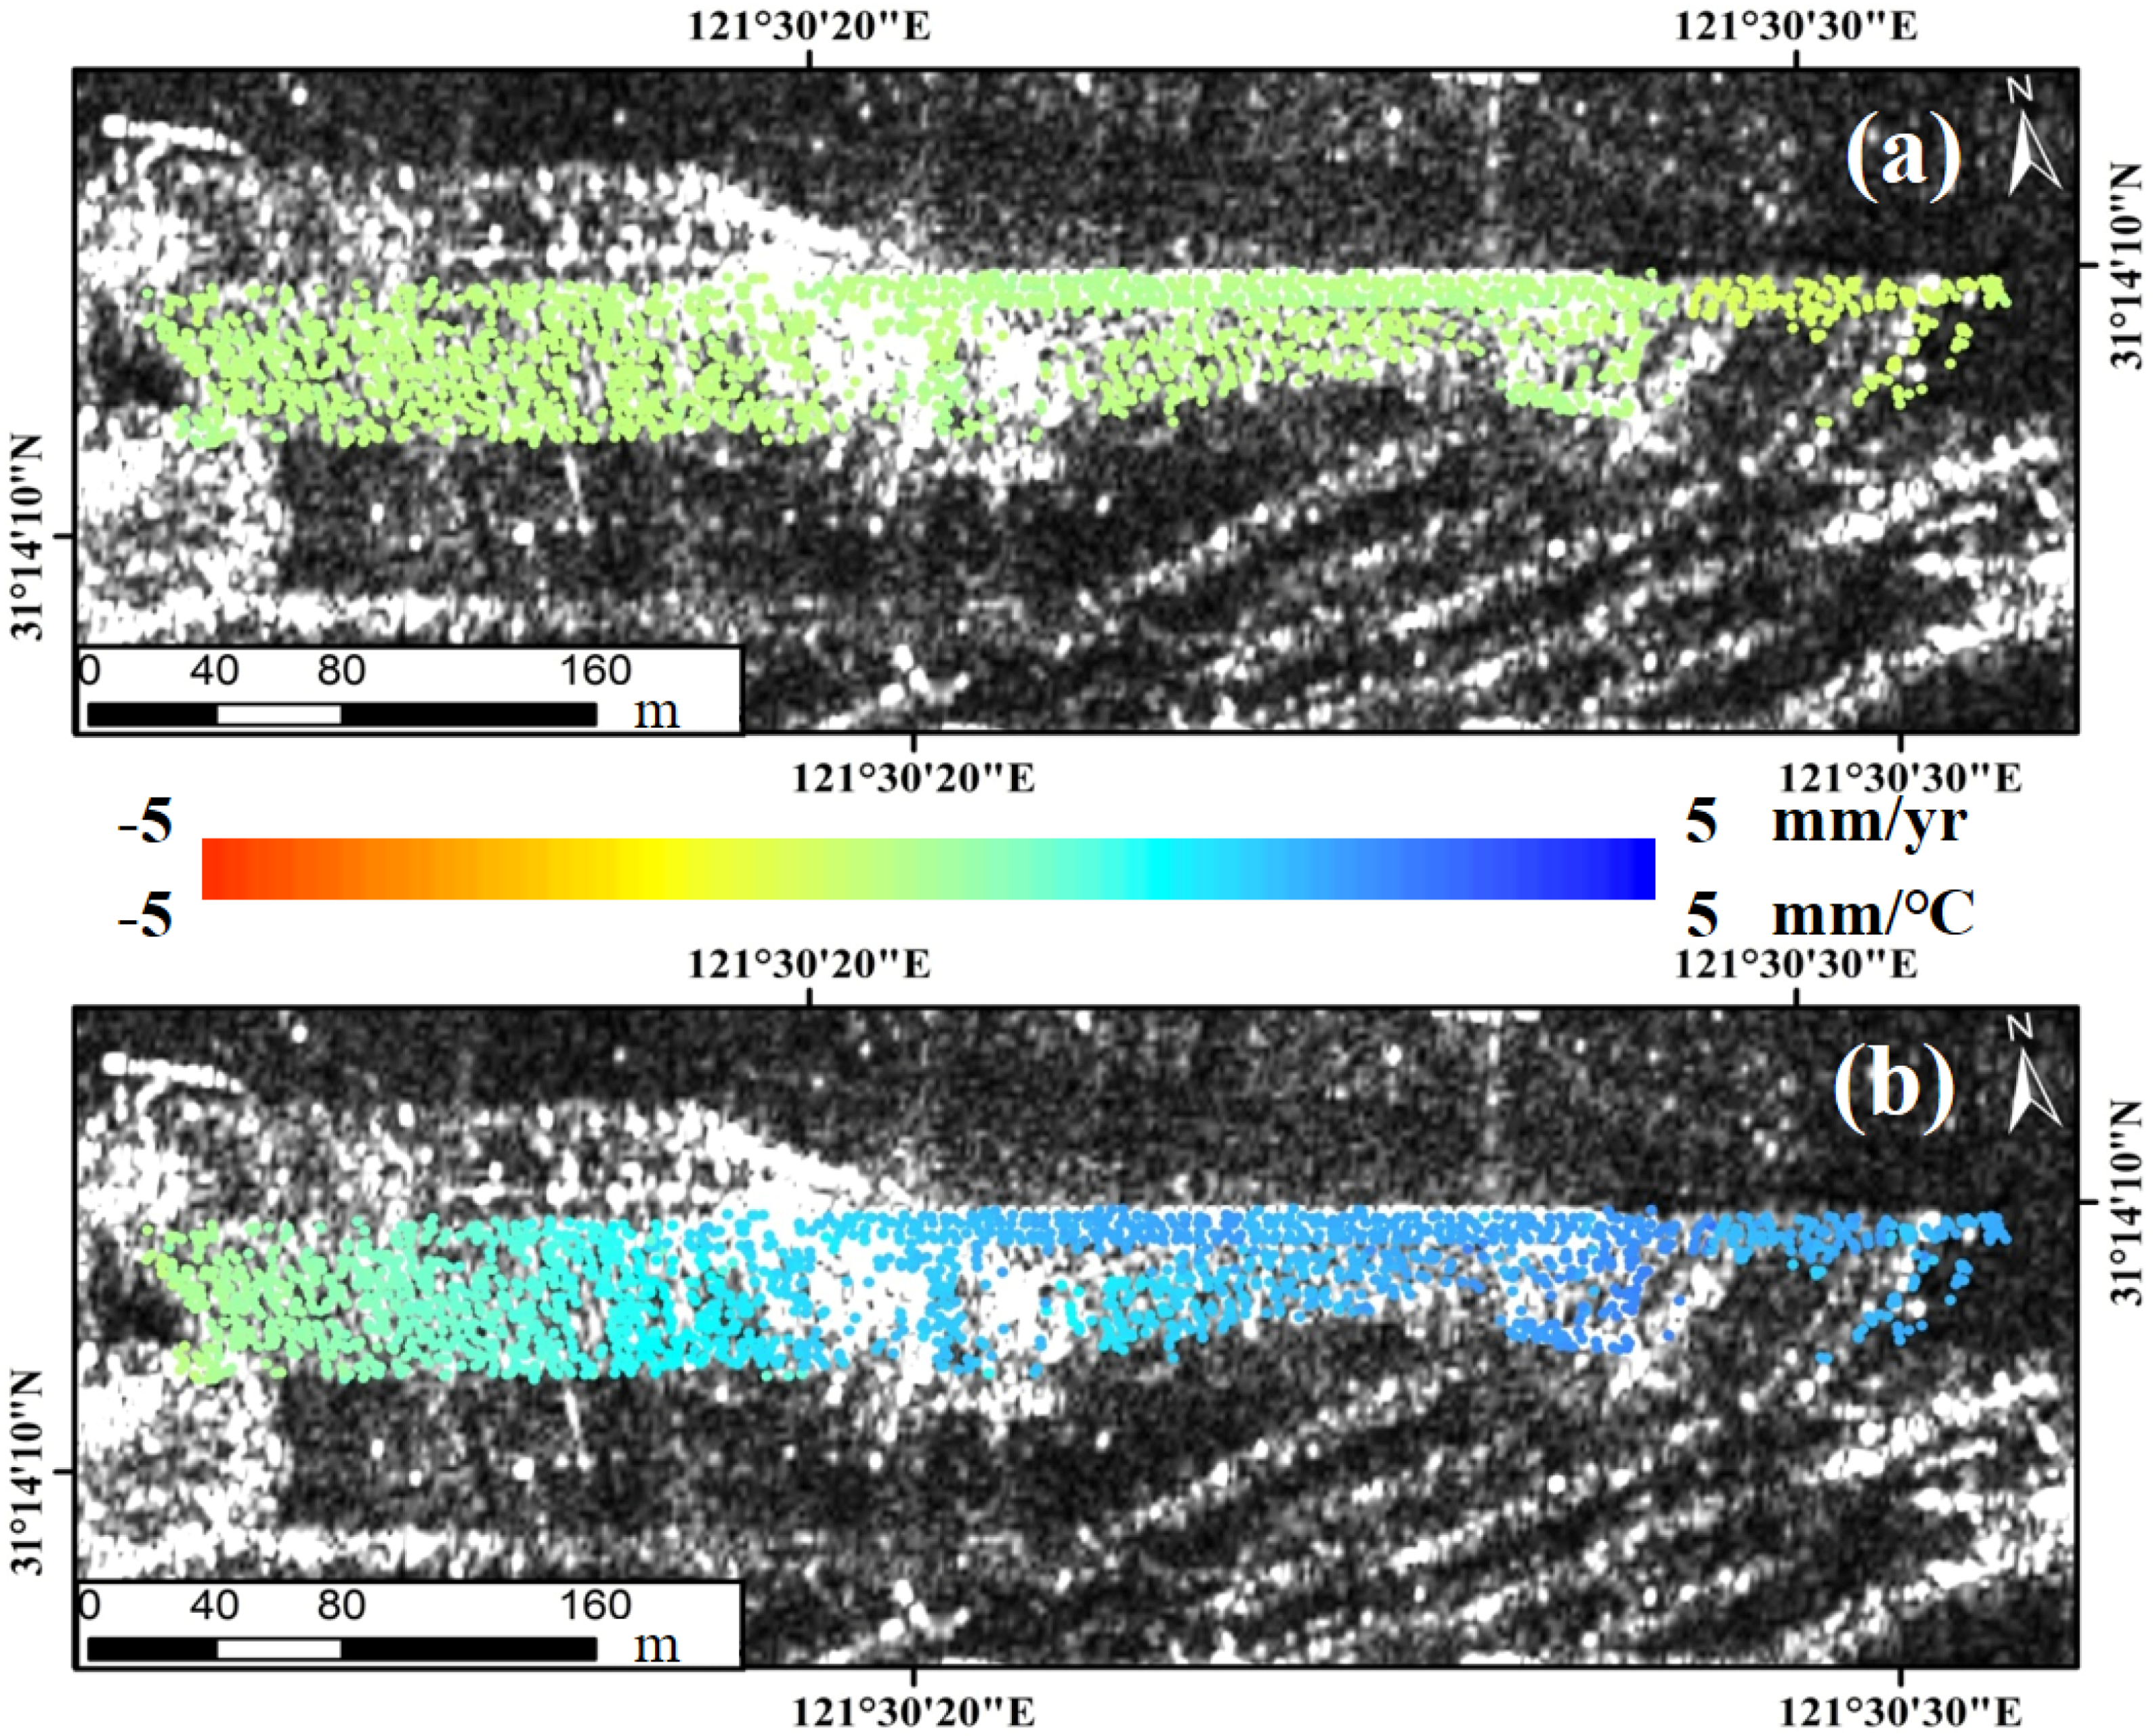
3.2. Low Buildings
3.2.1. The SNIEC and SAR Data
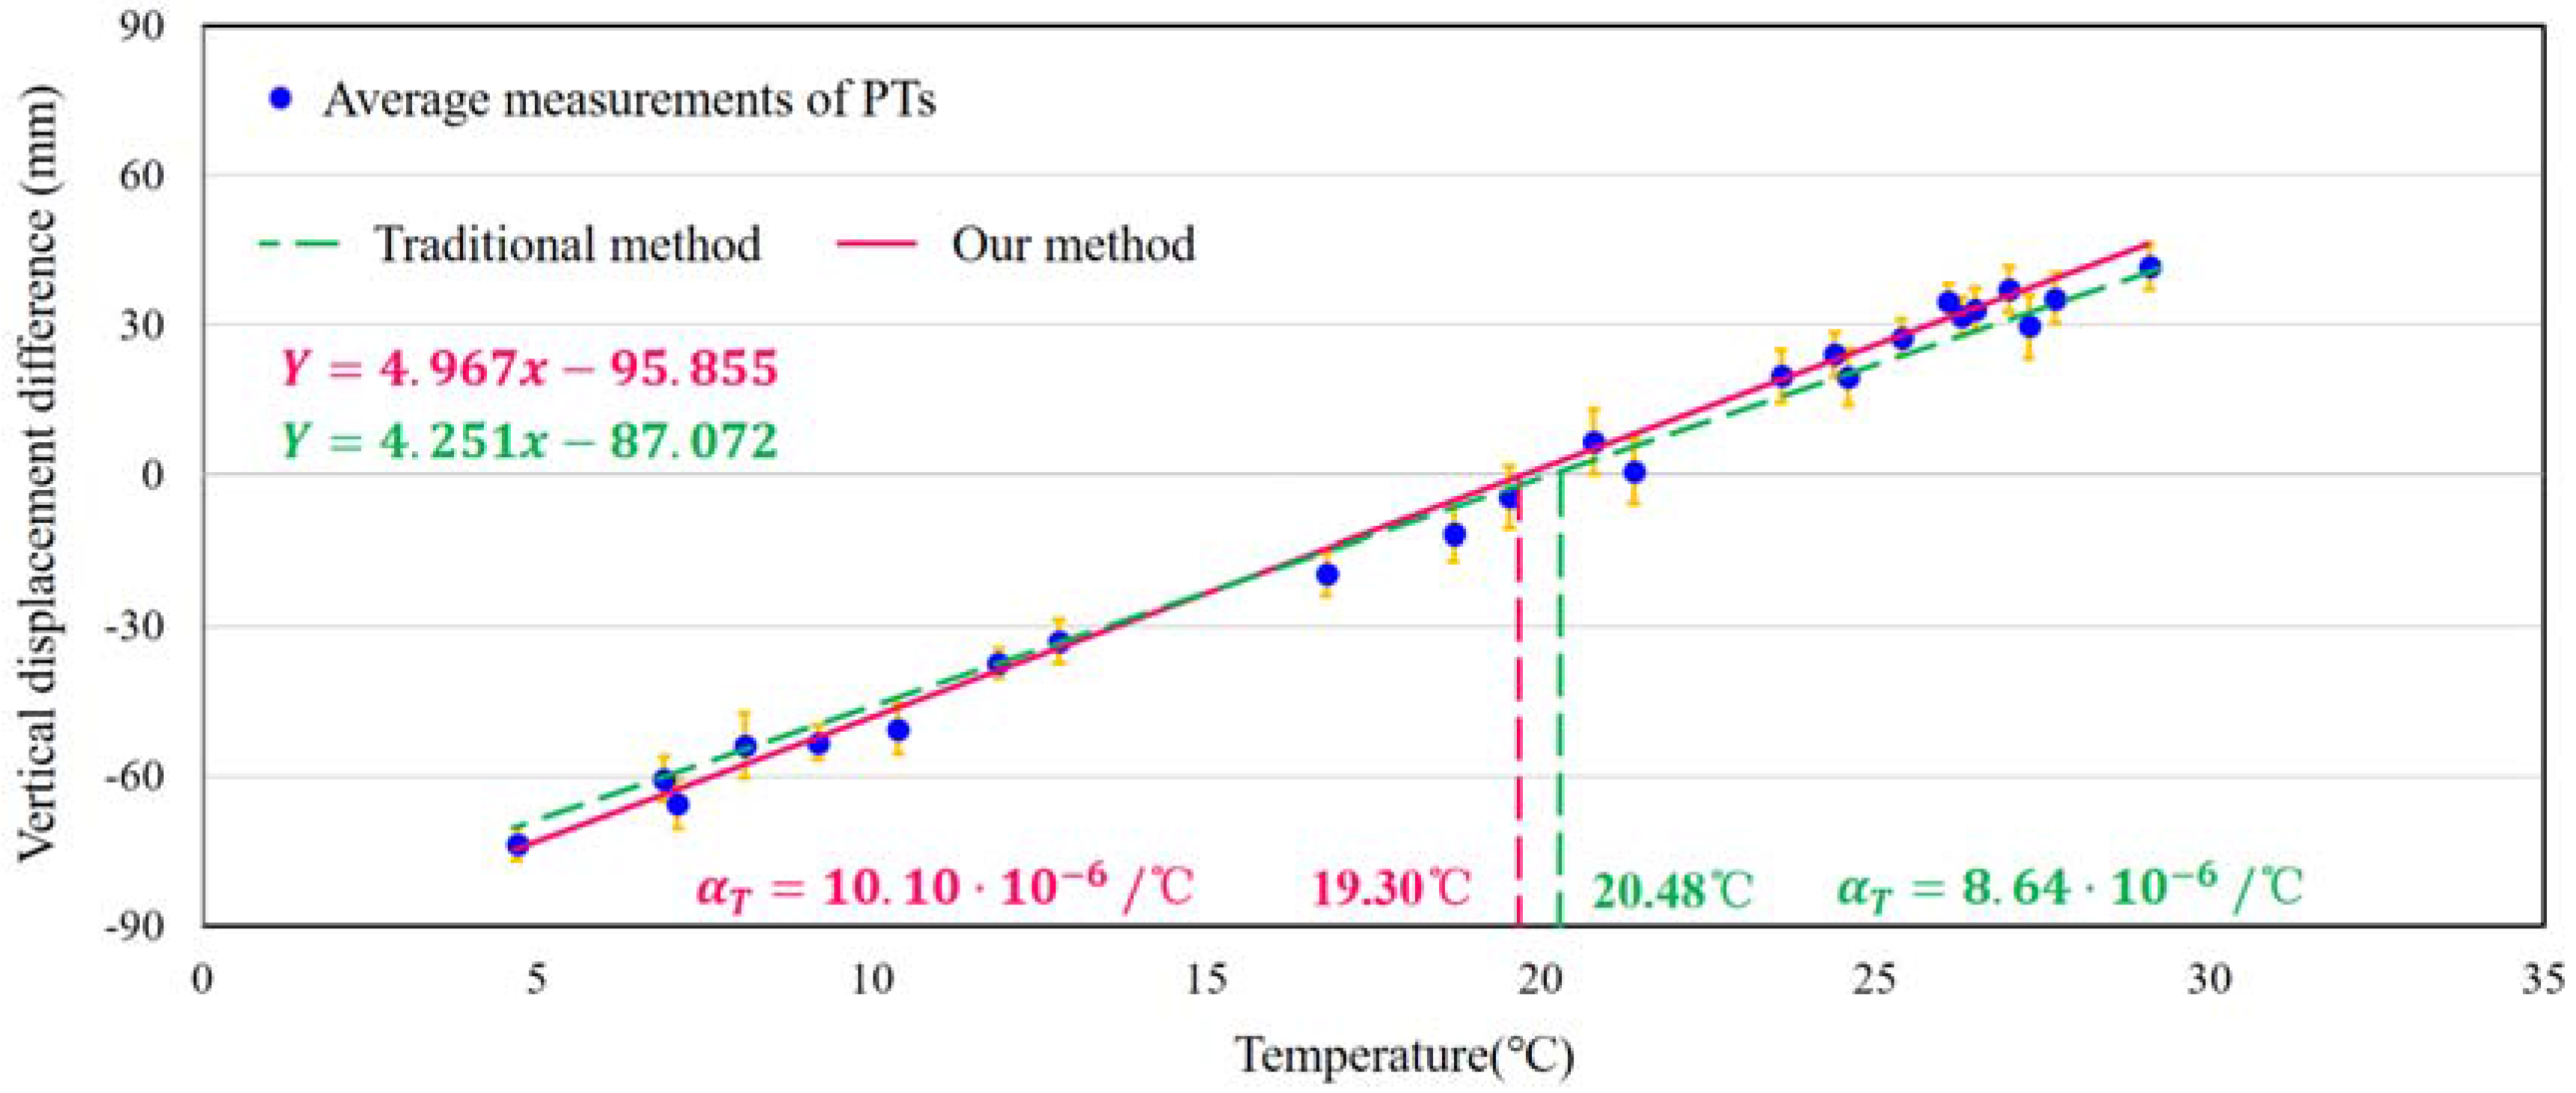
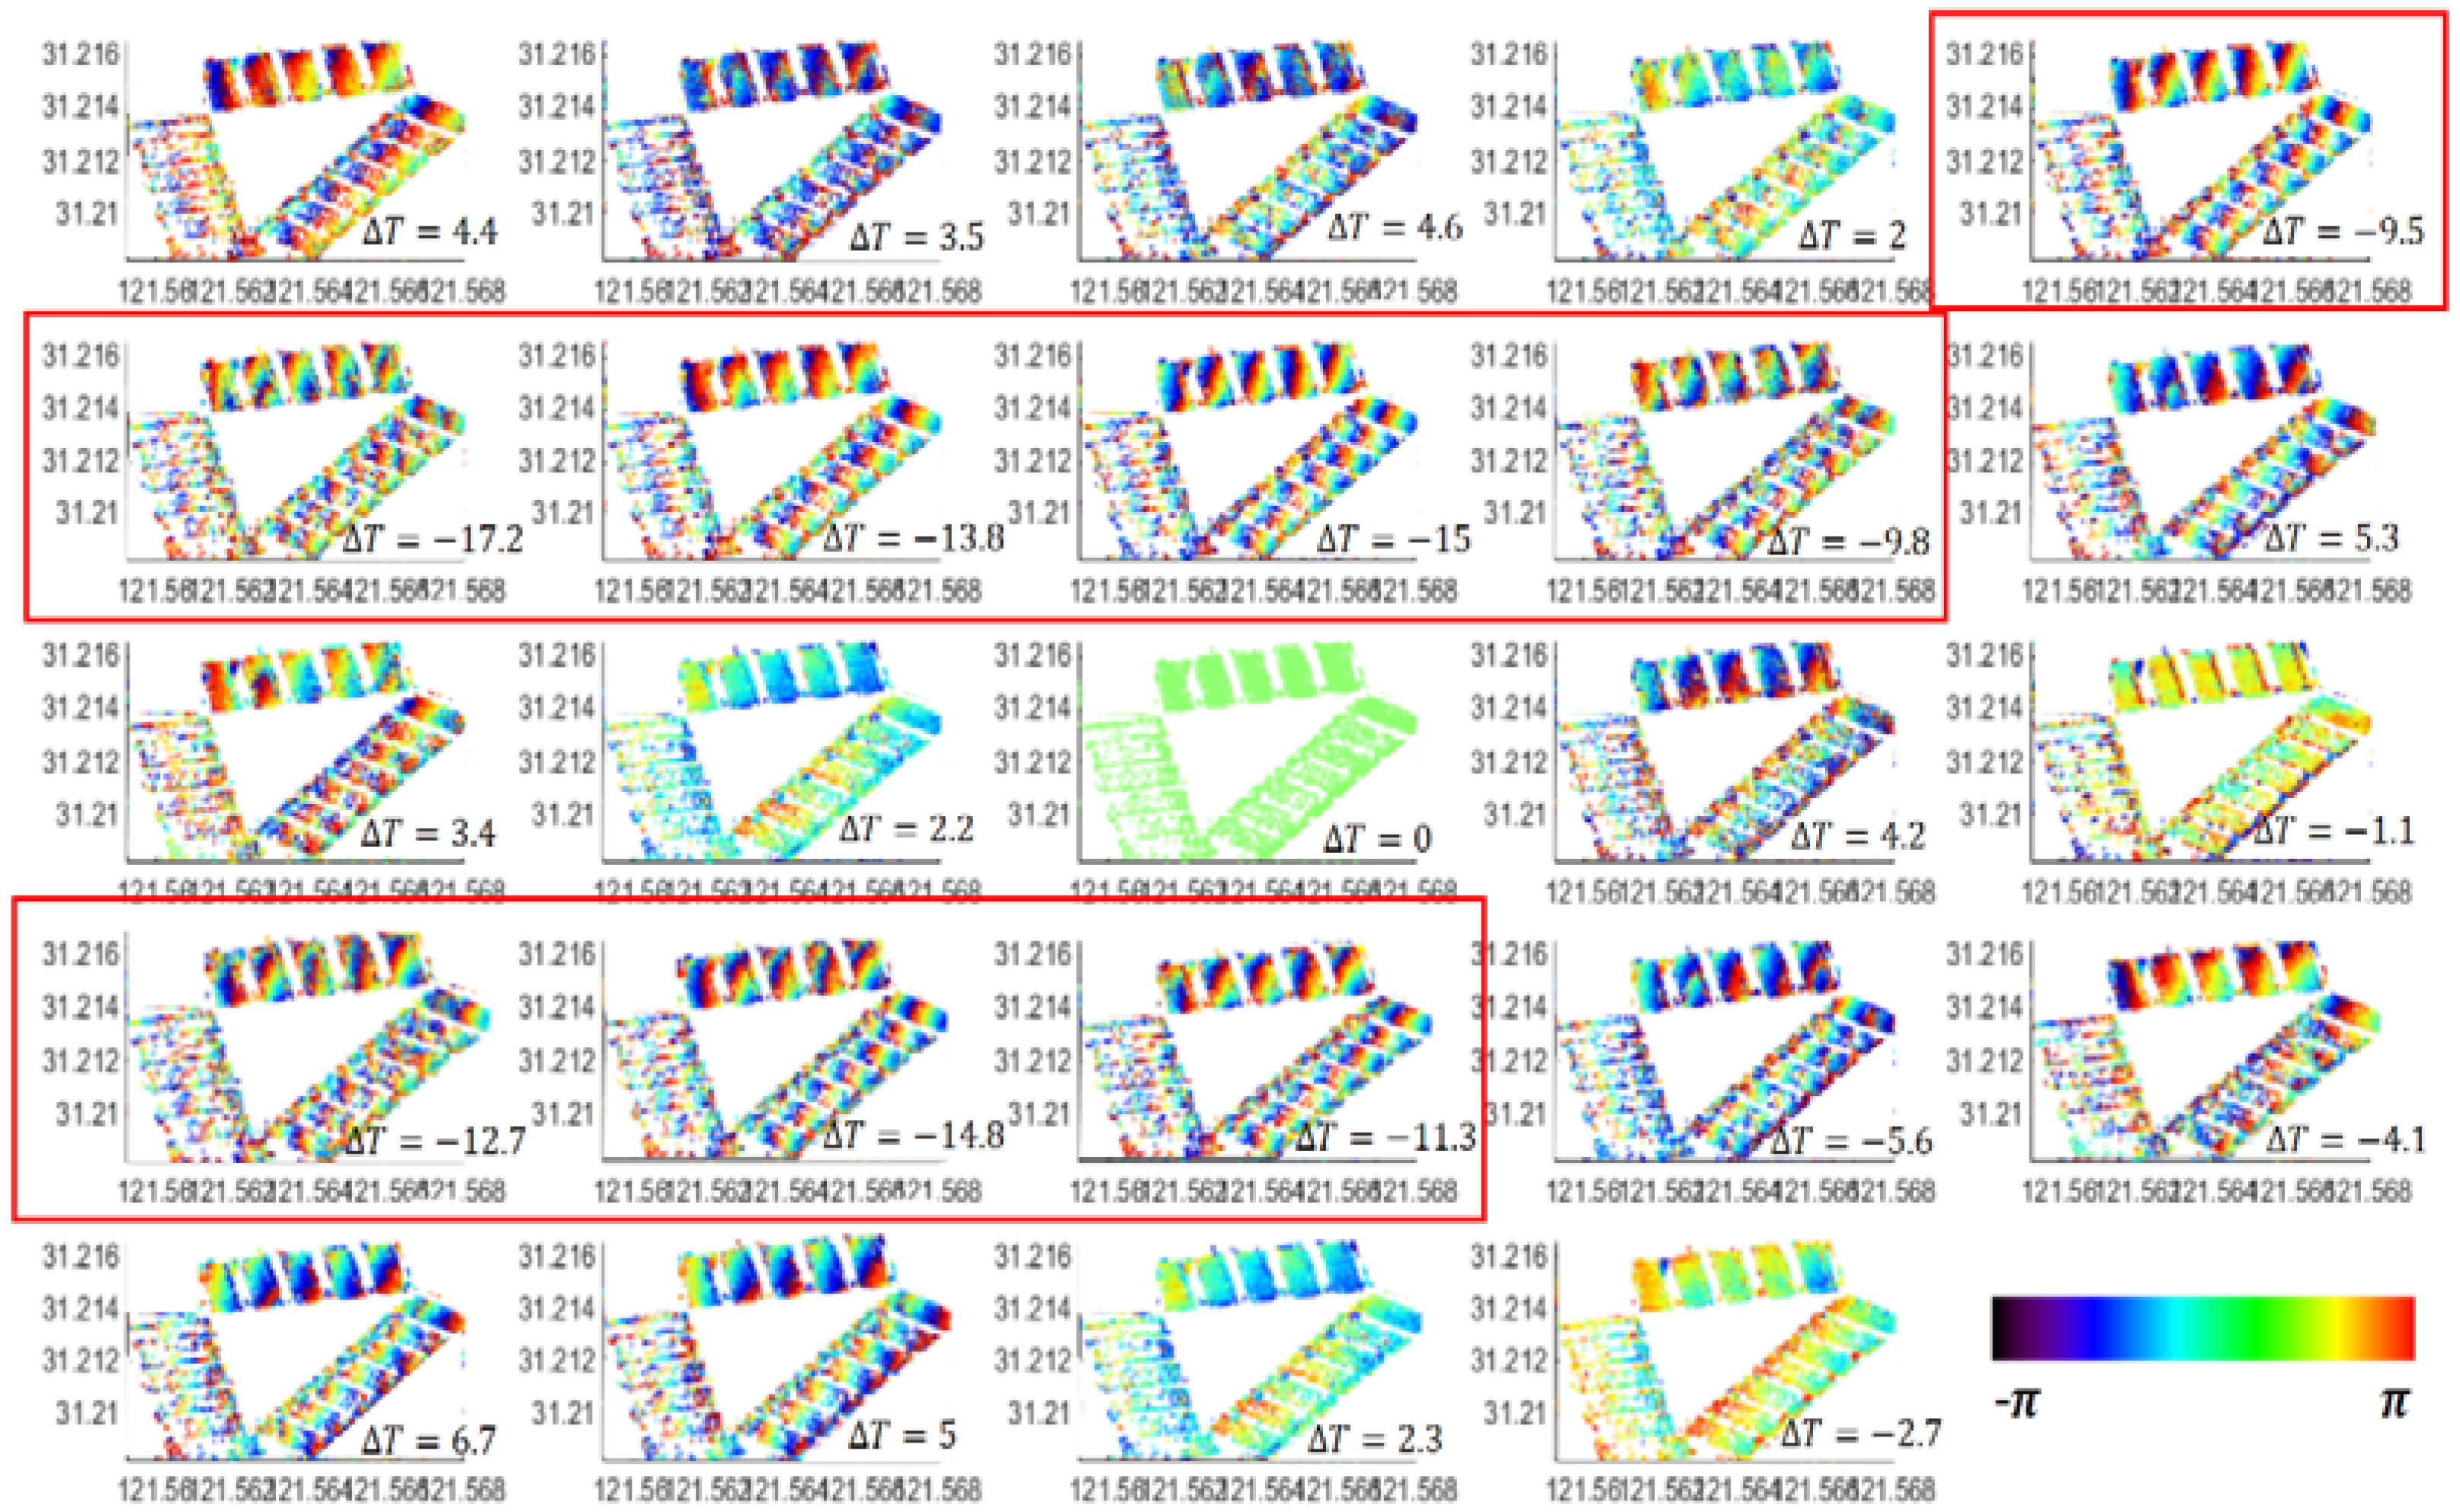
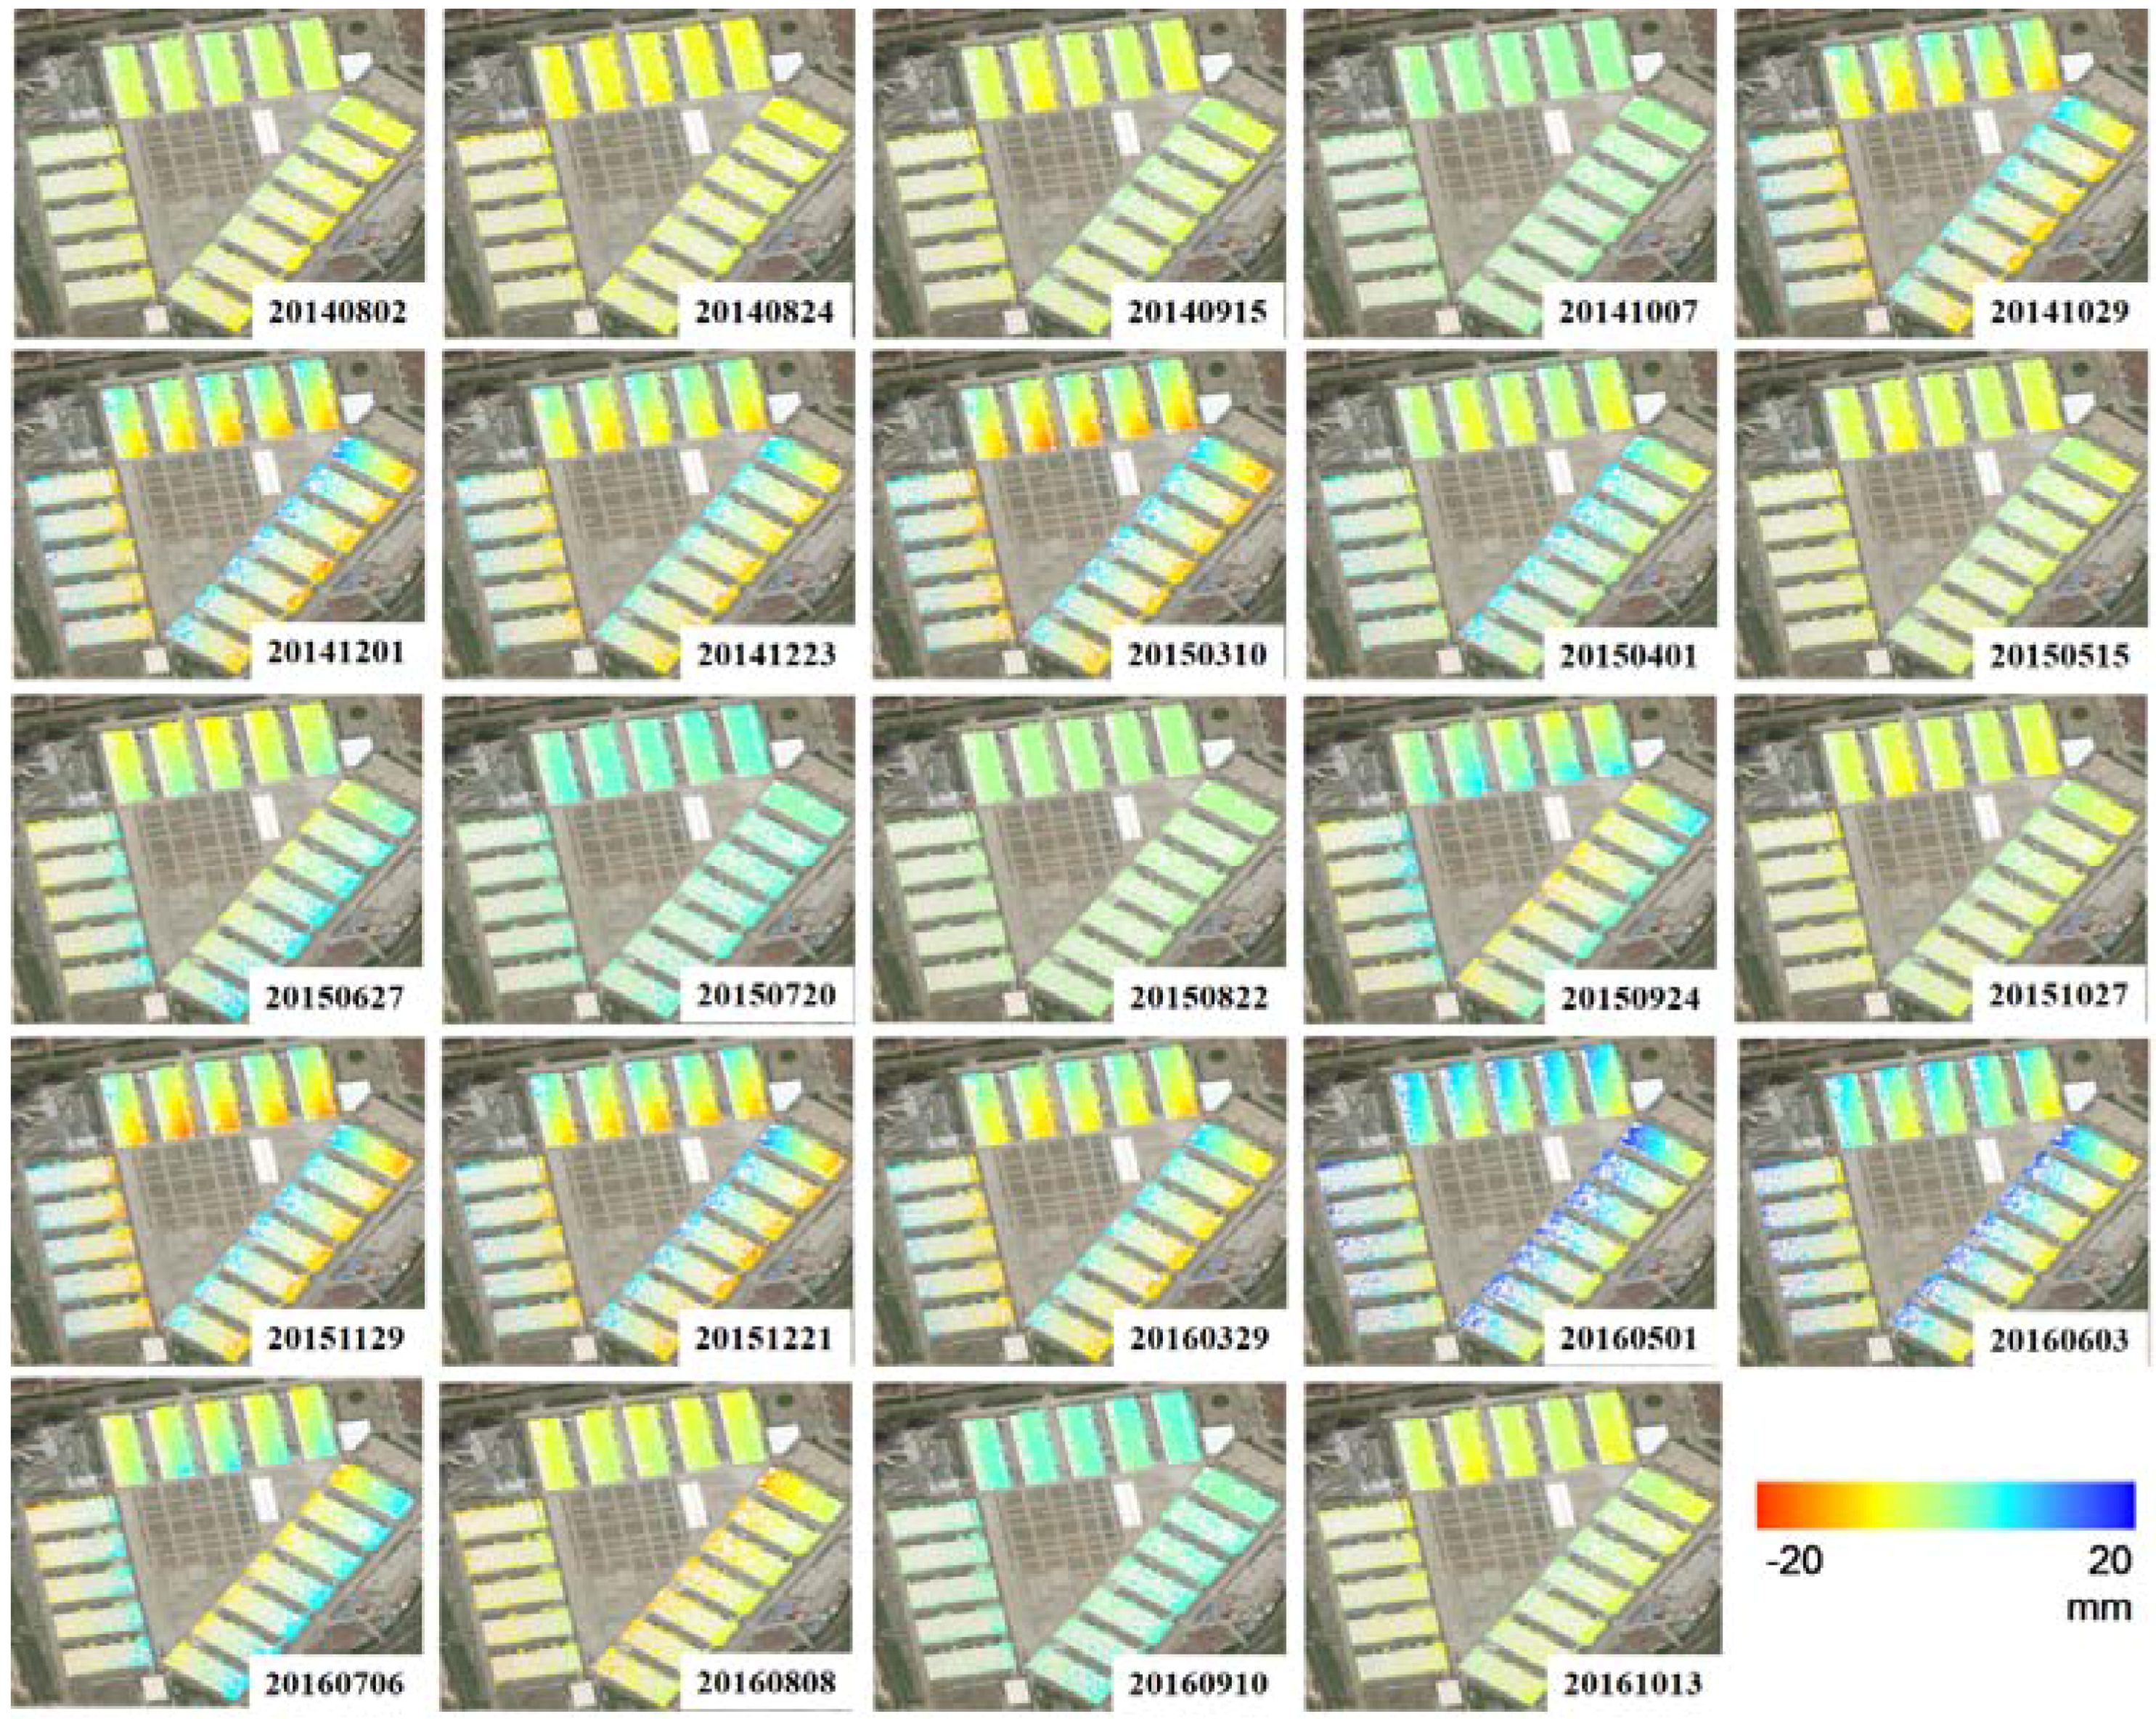
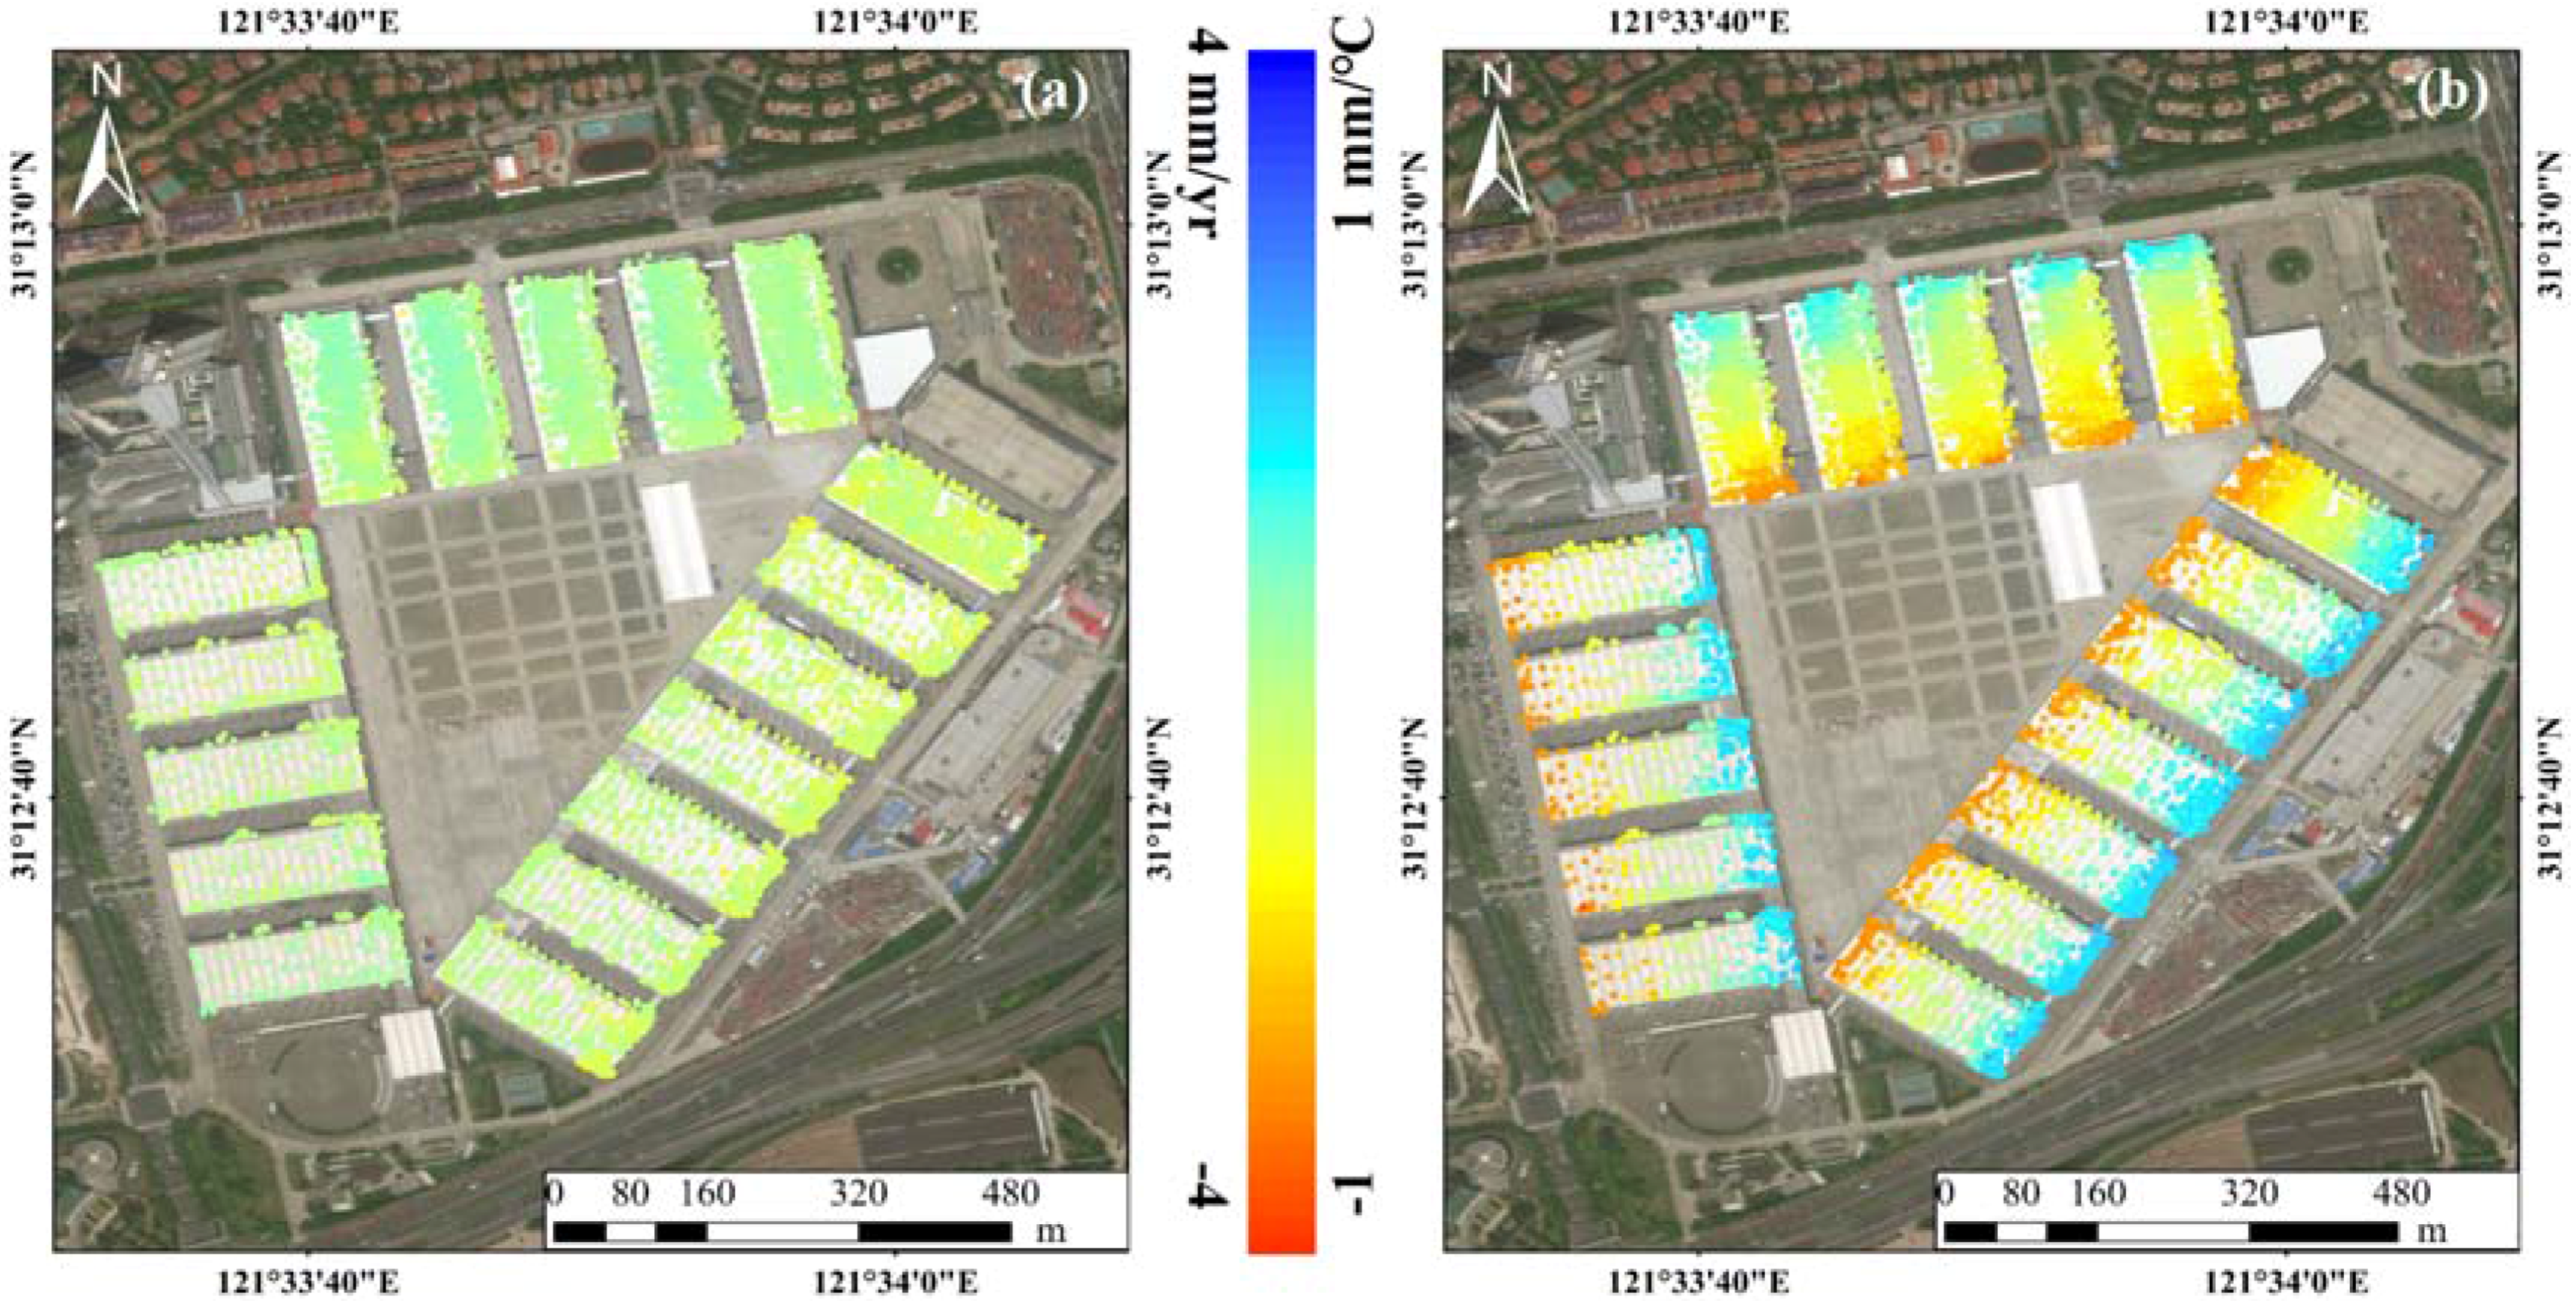
3.2.2. Thermal Dilation Results
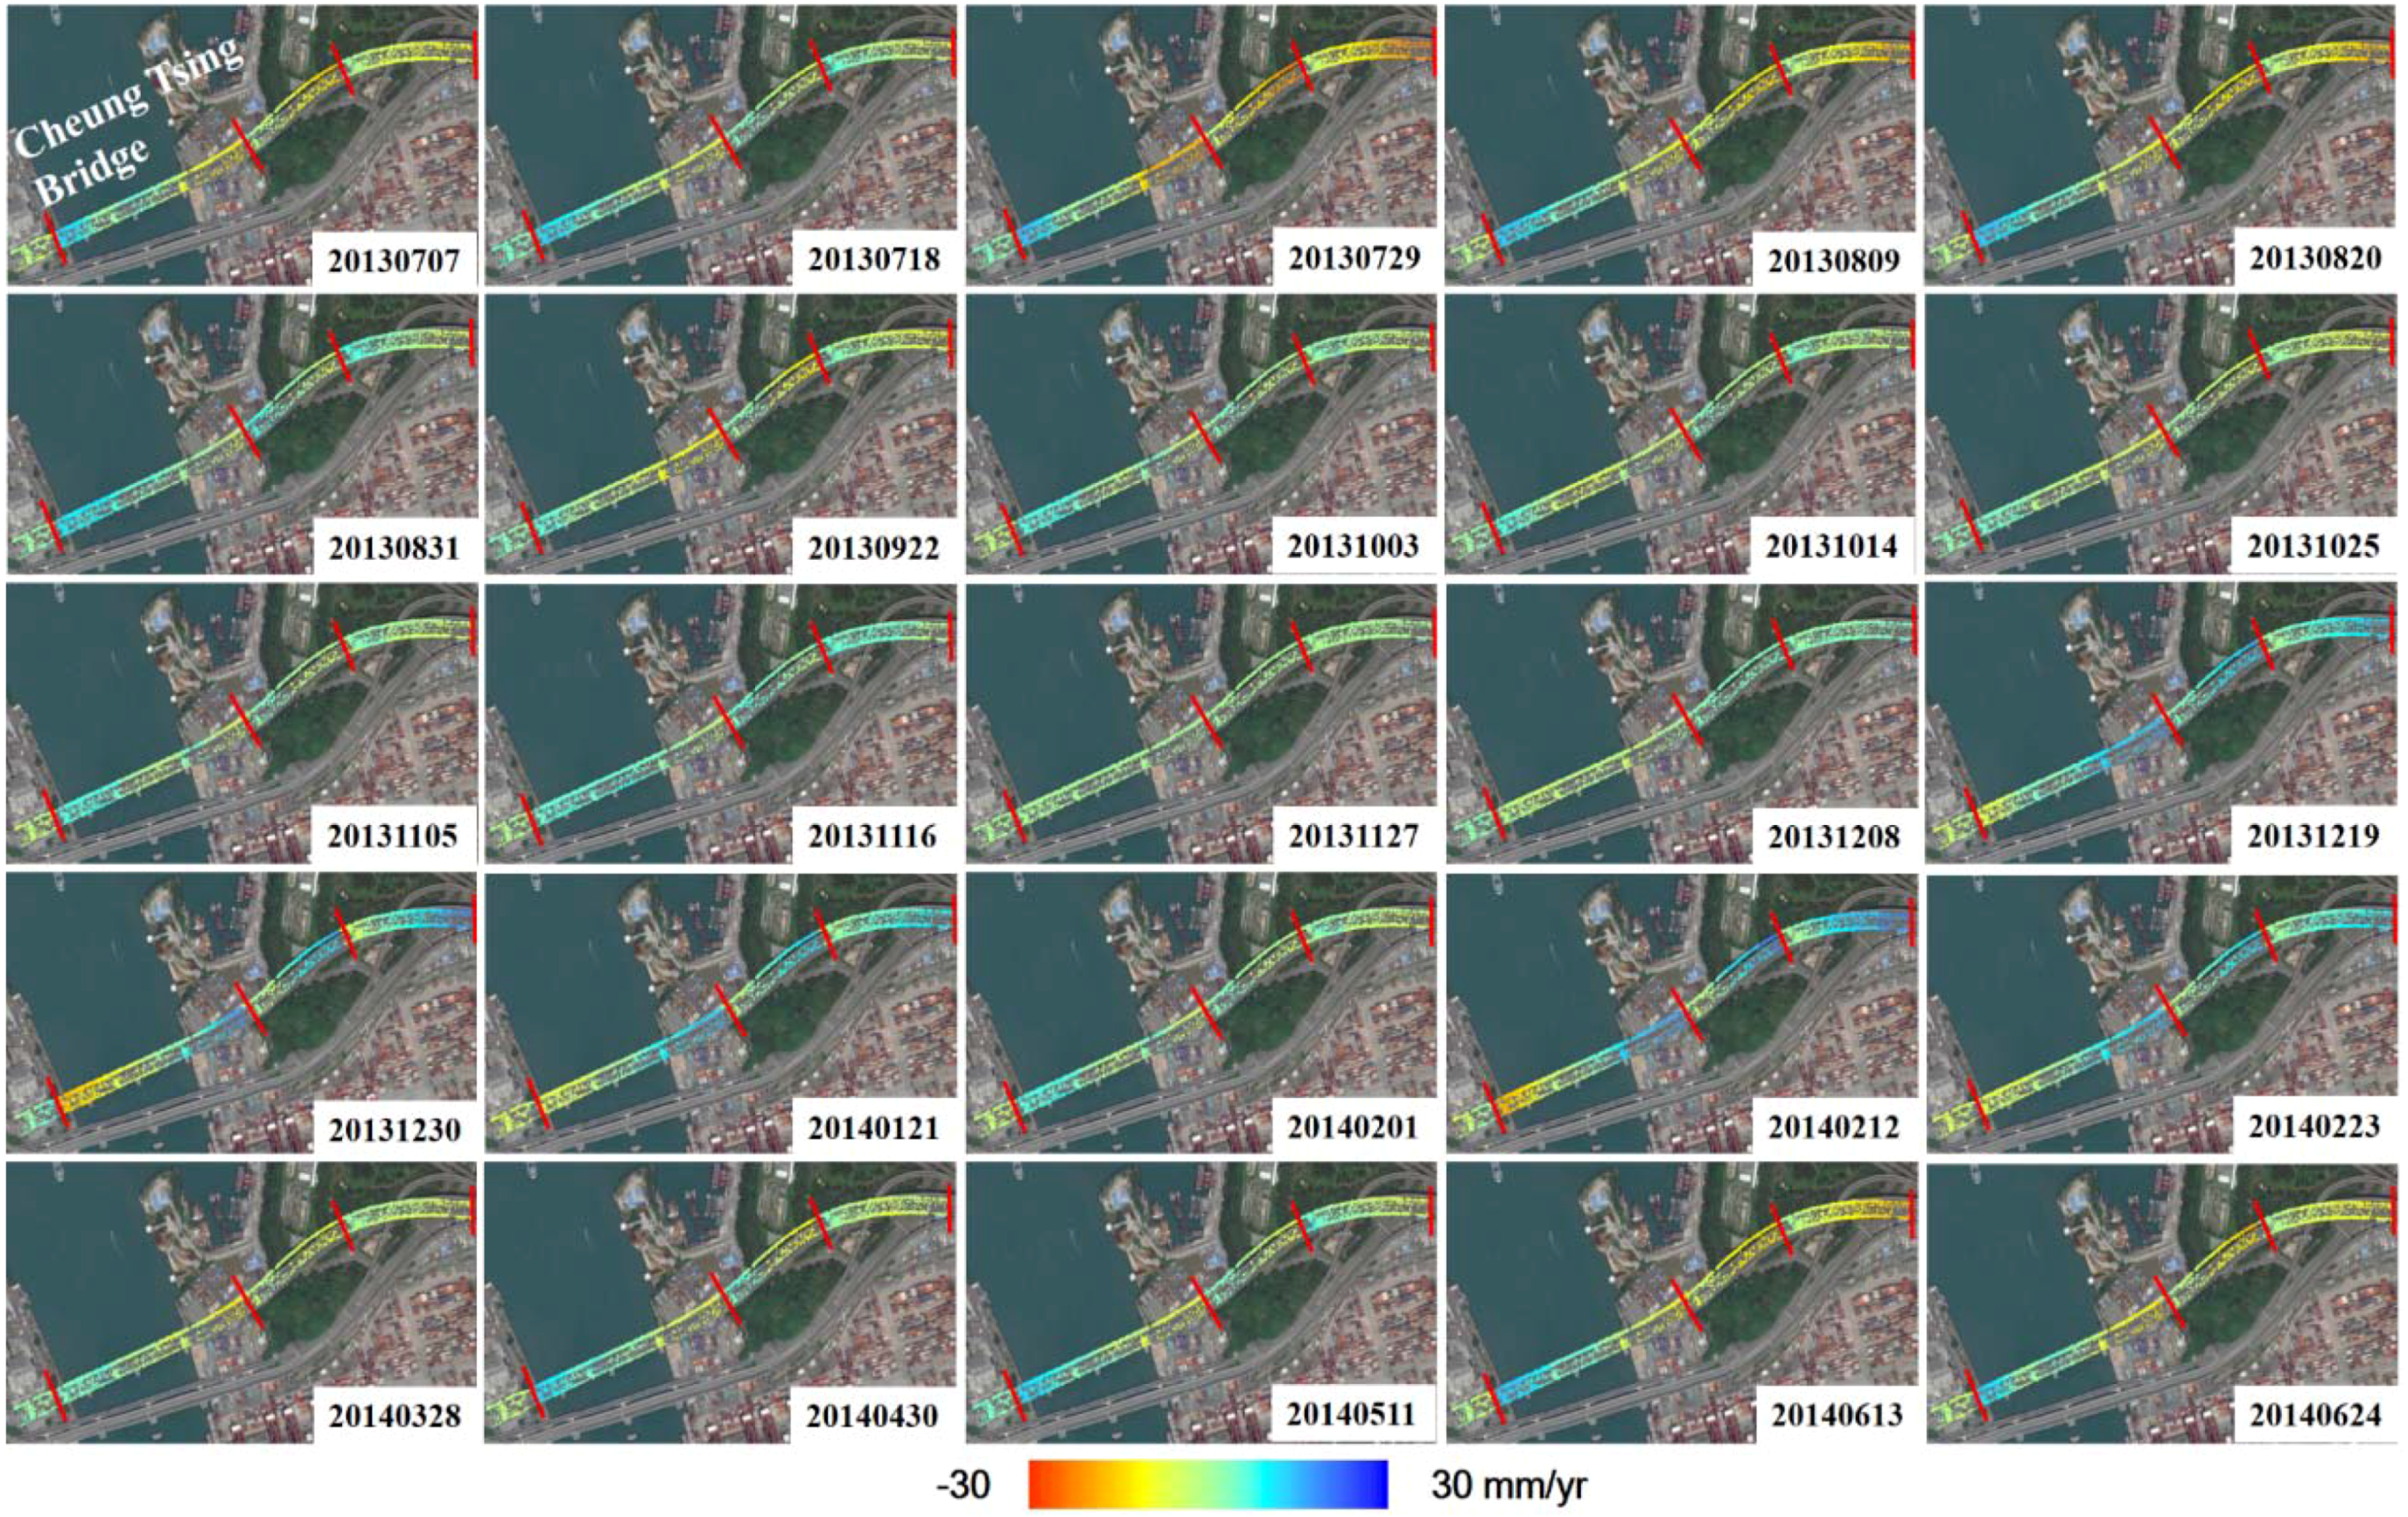
3.3. Highway
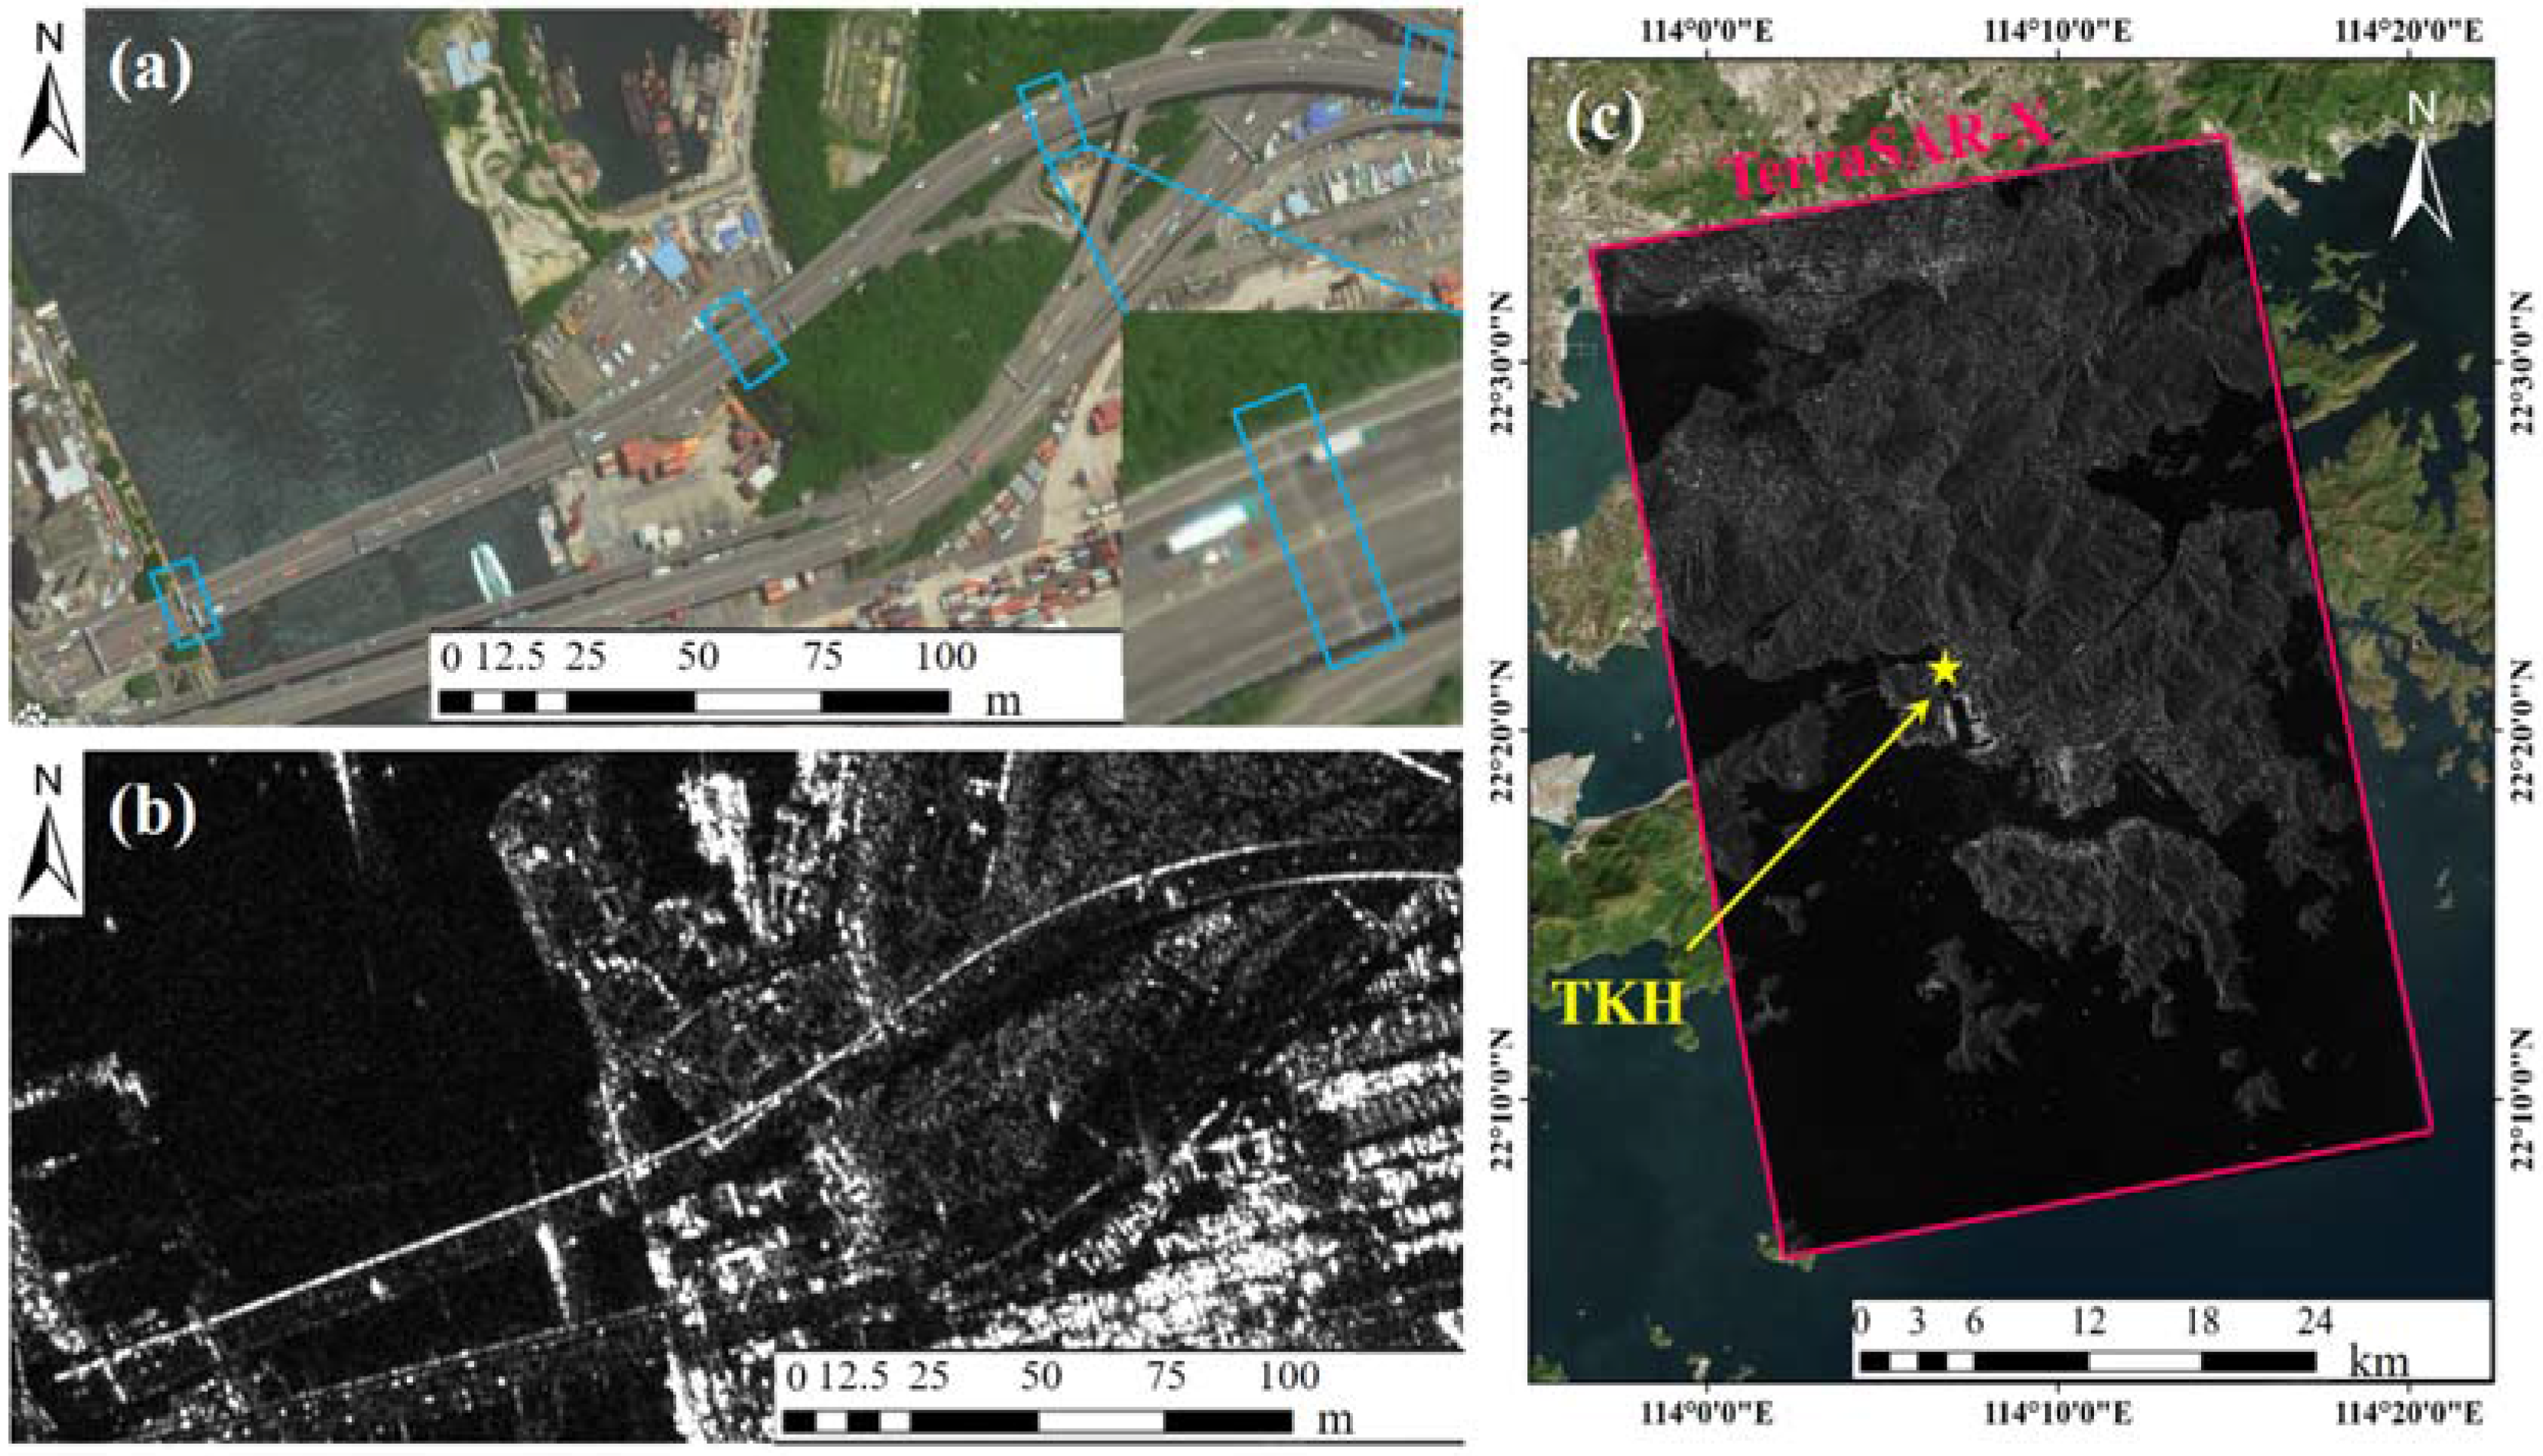
3.3.1. The TKH and SAR Data
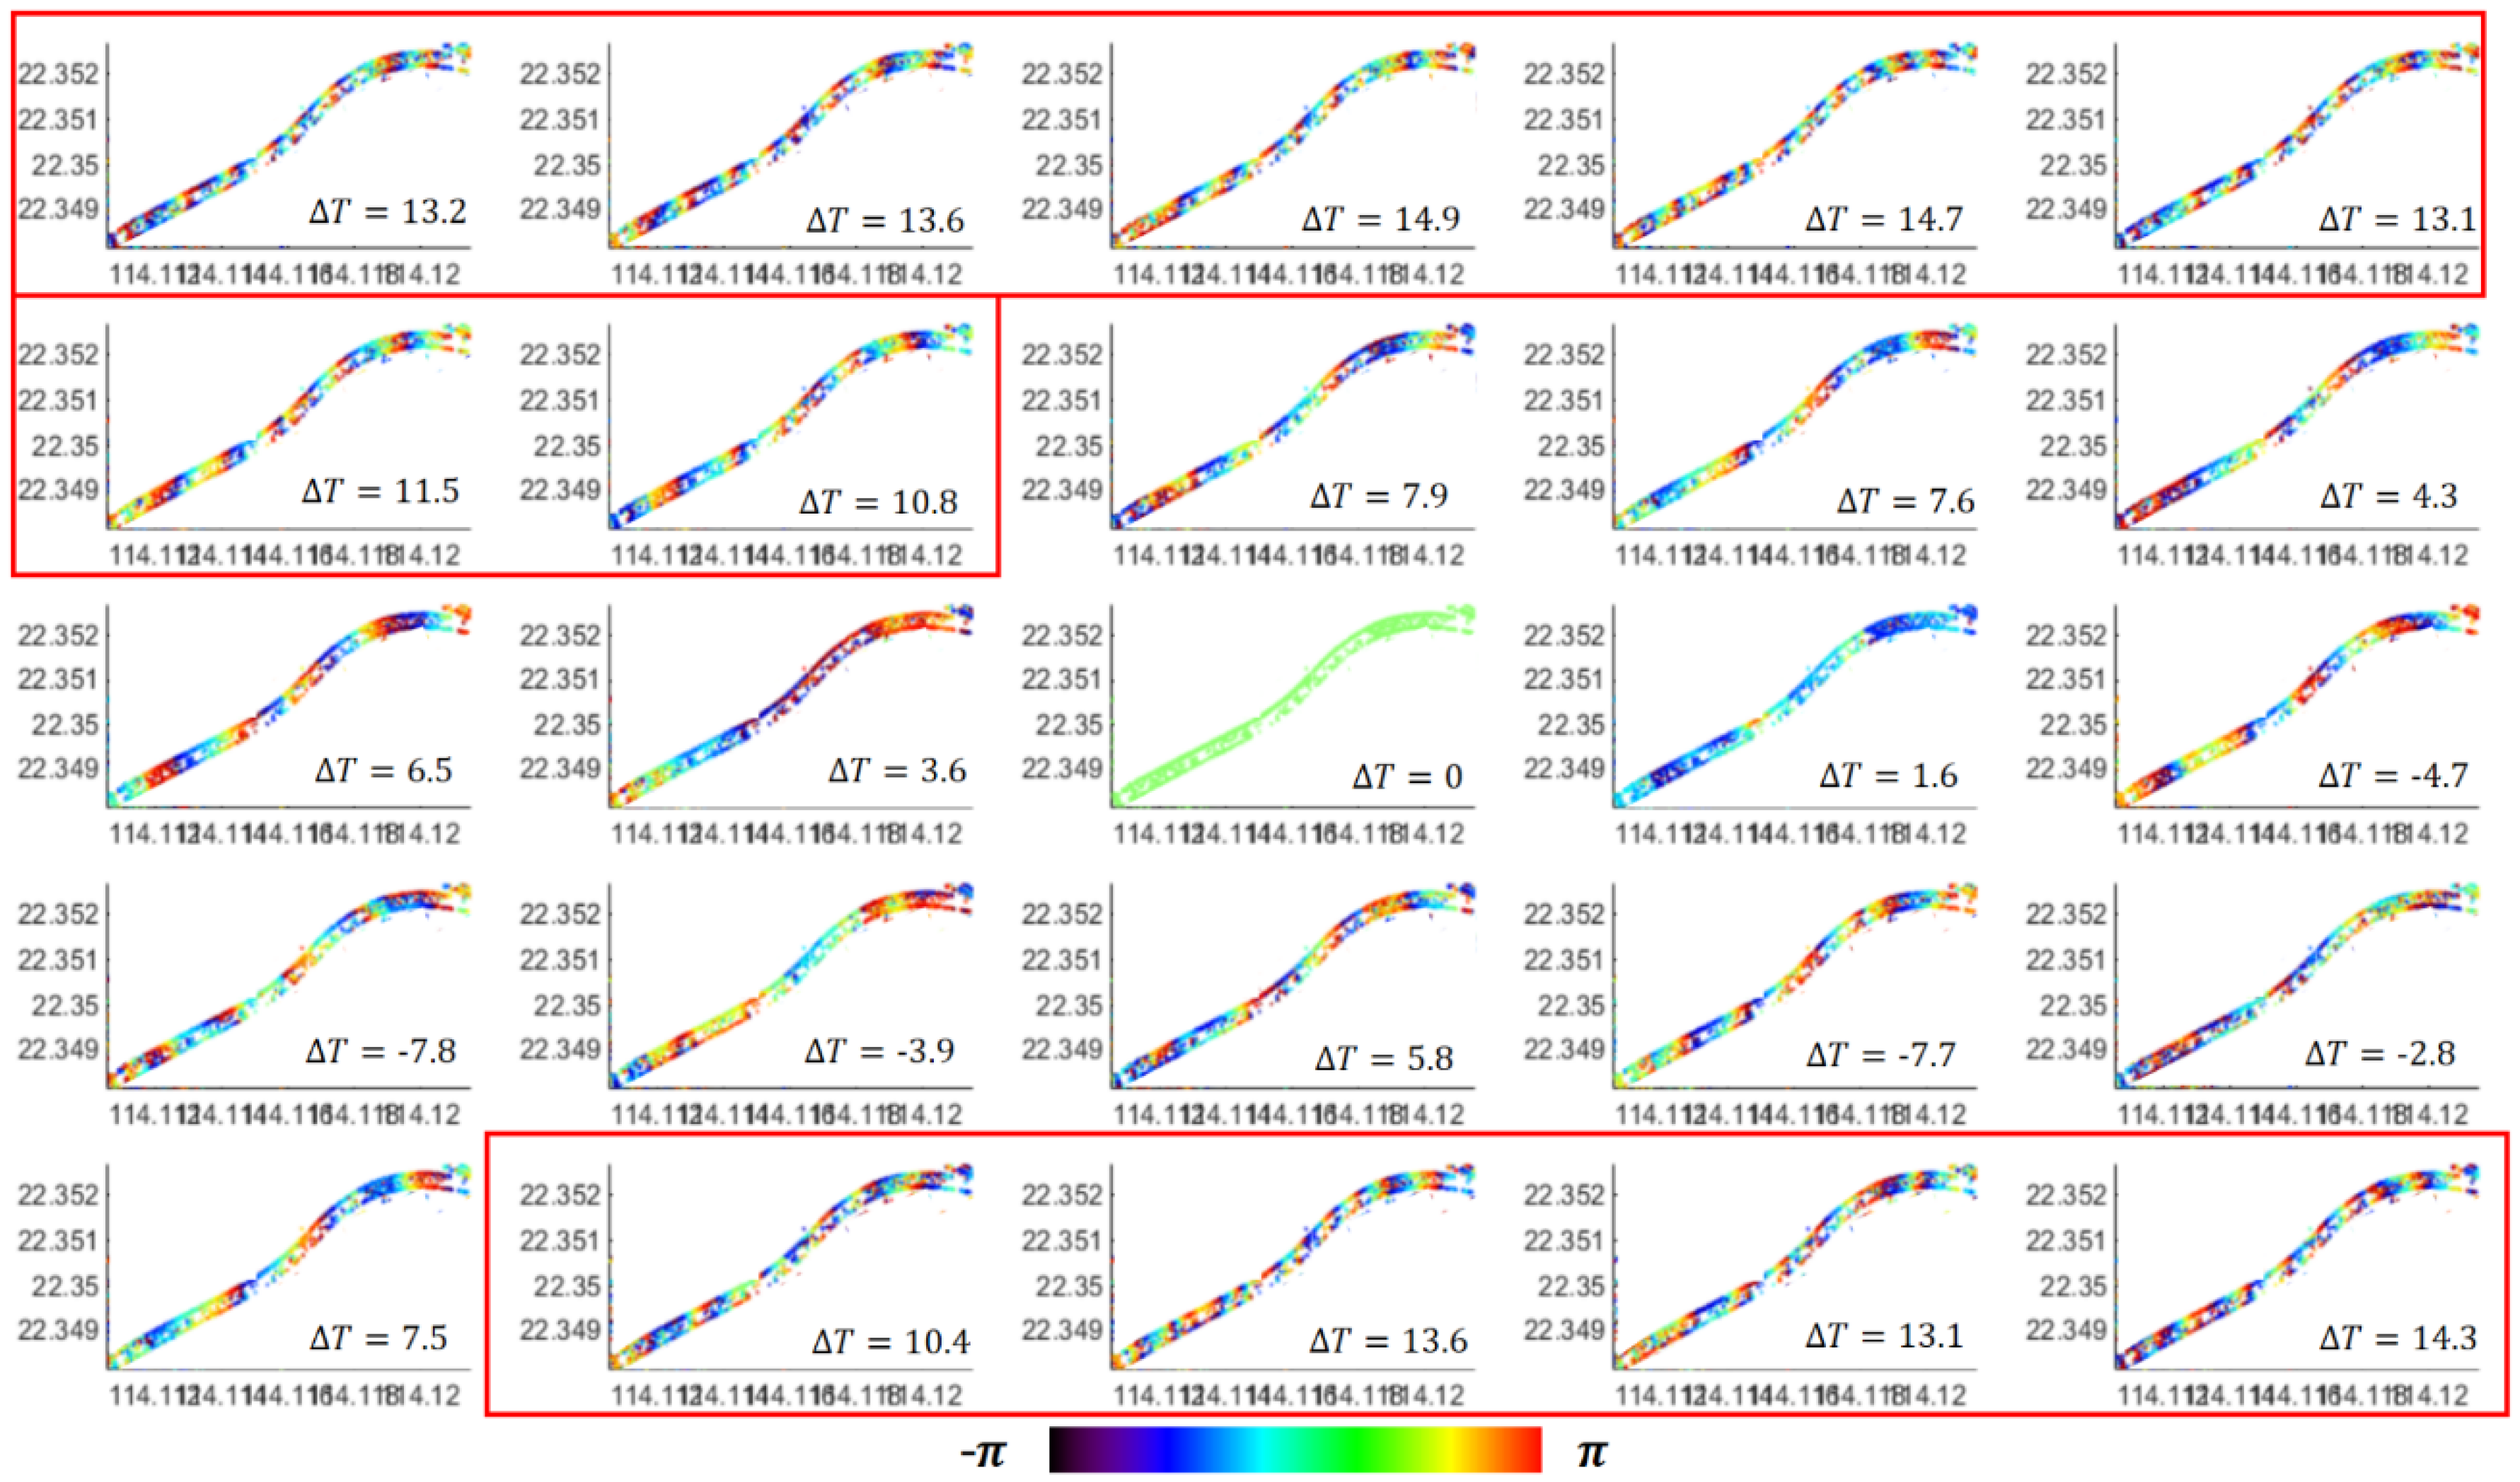
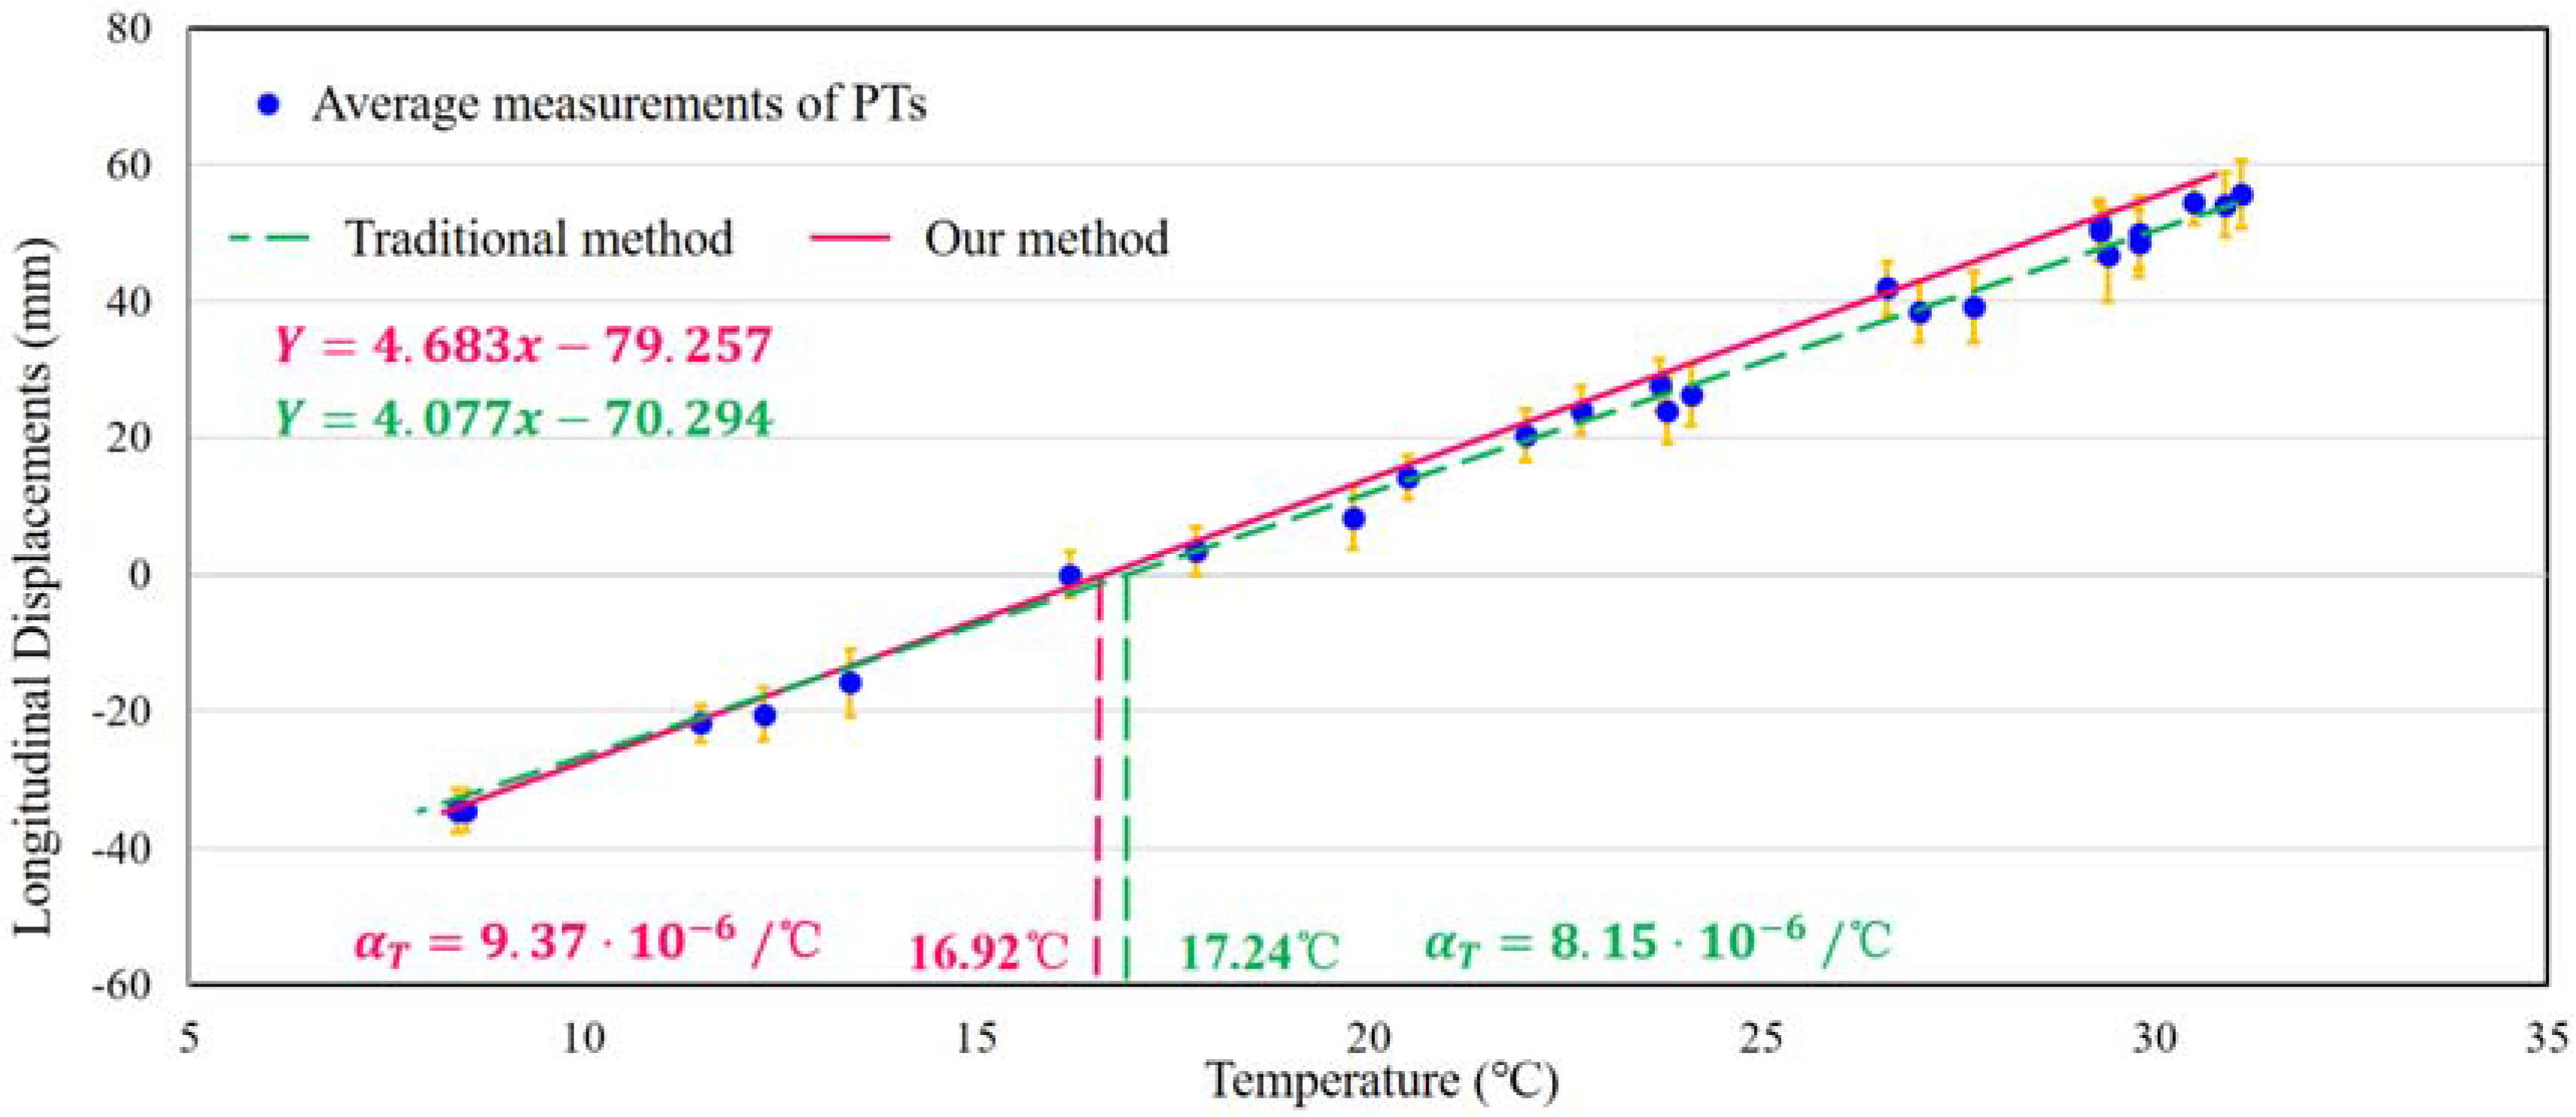
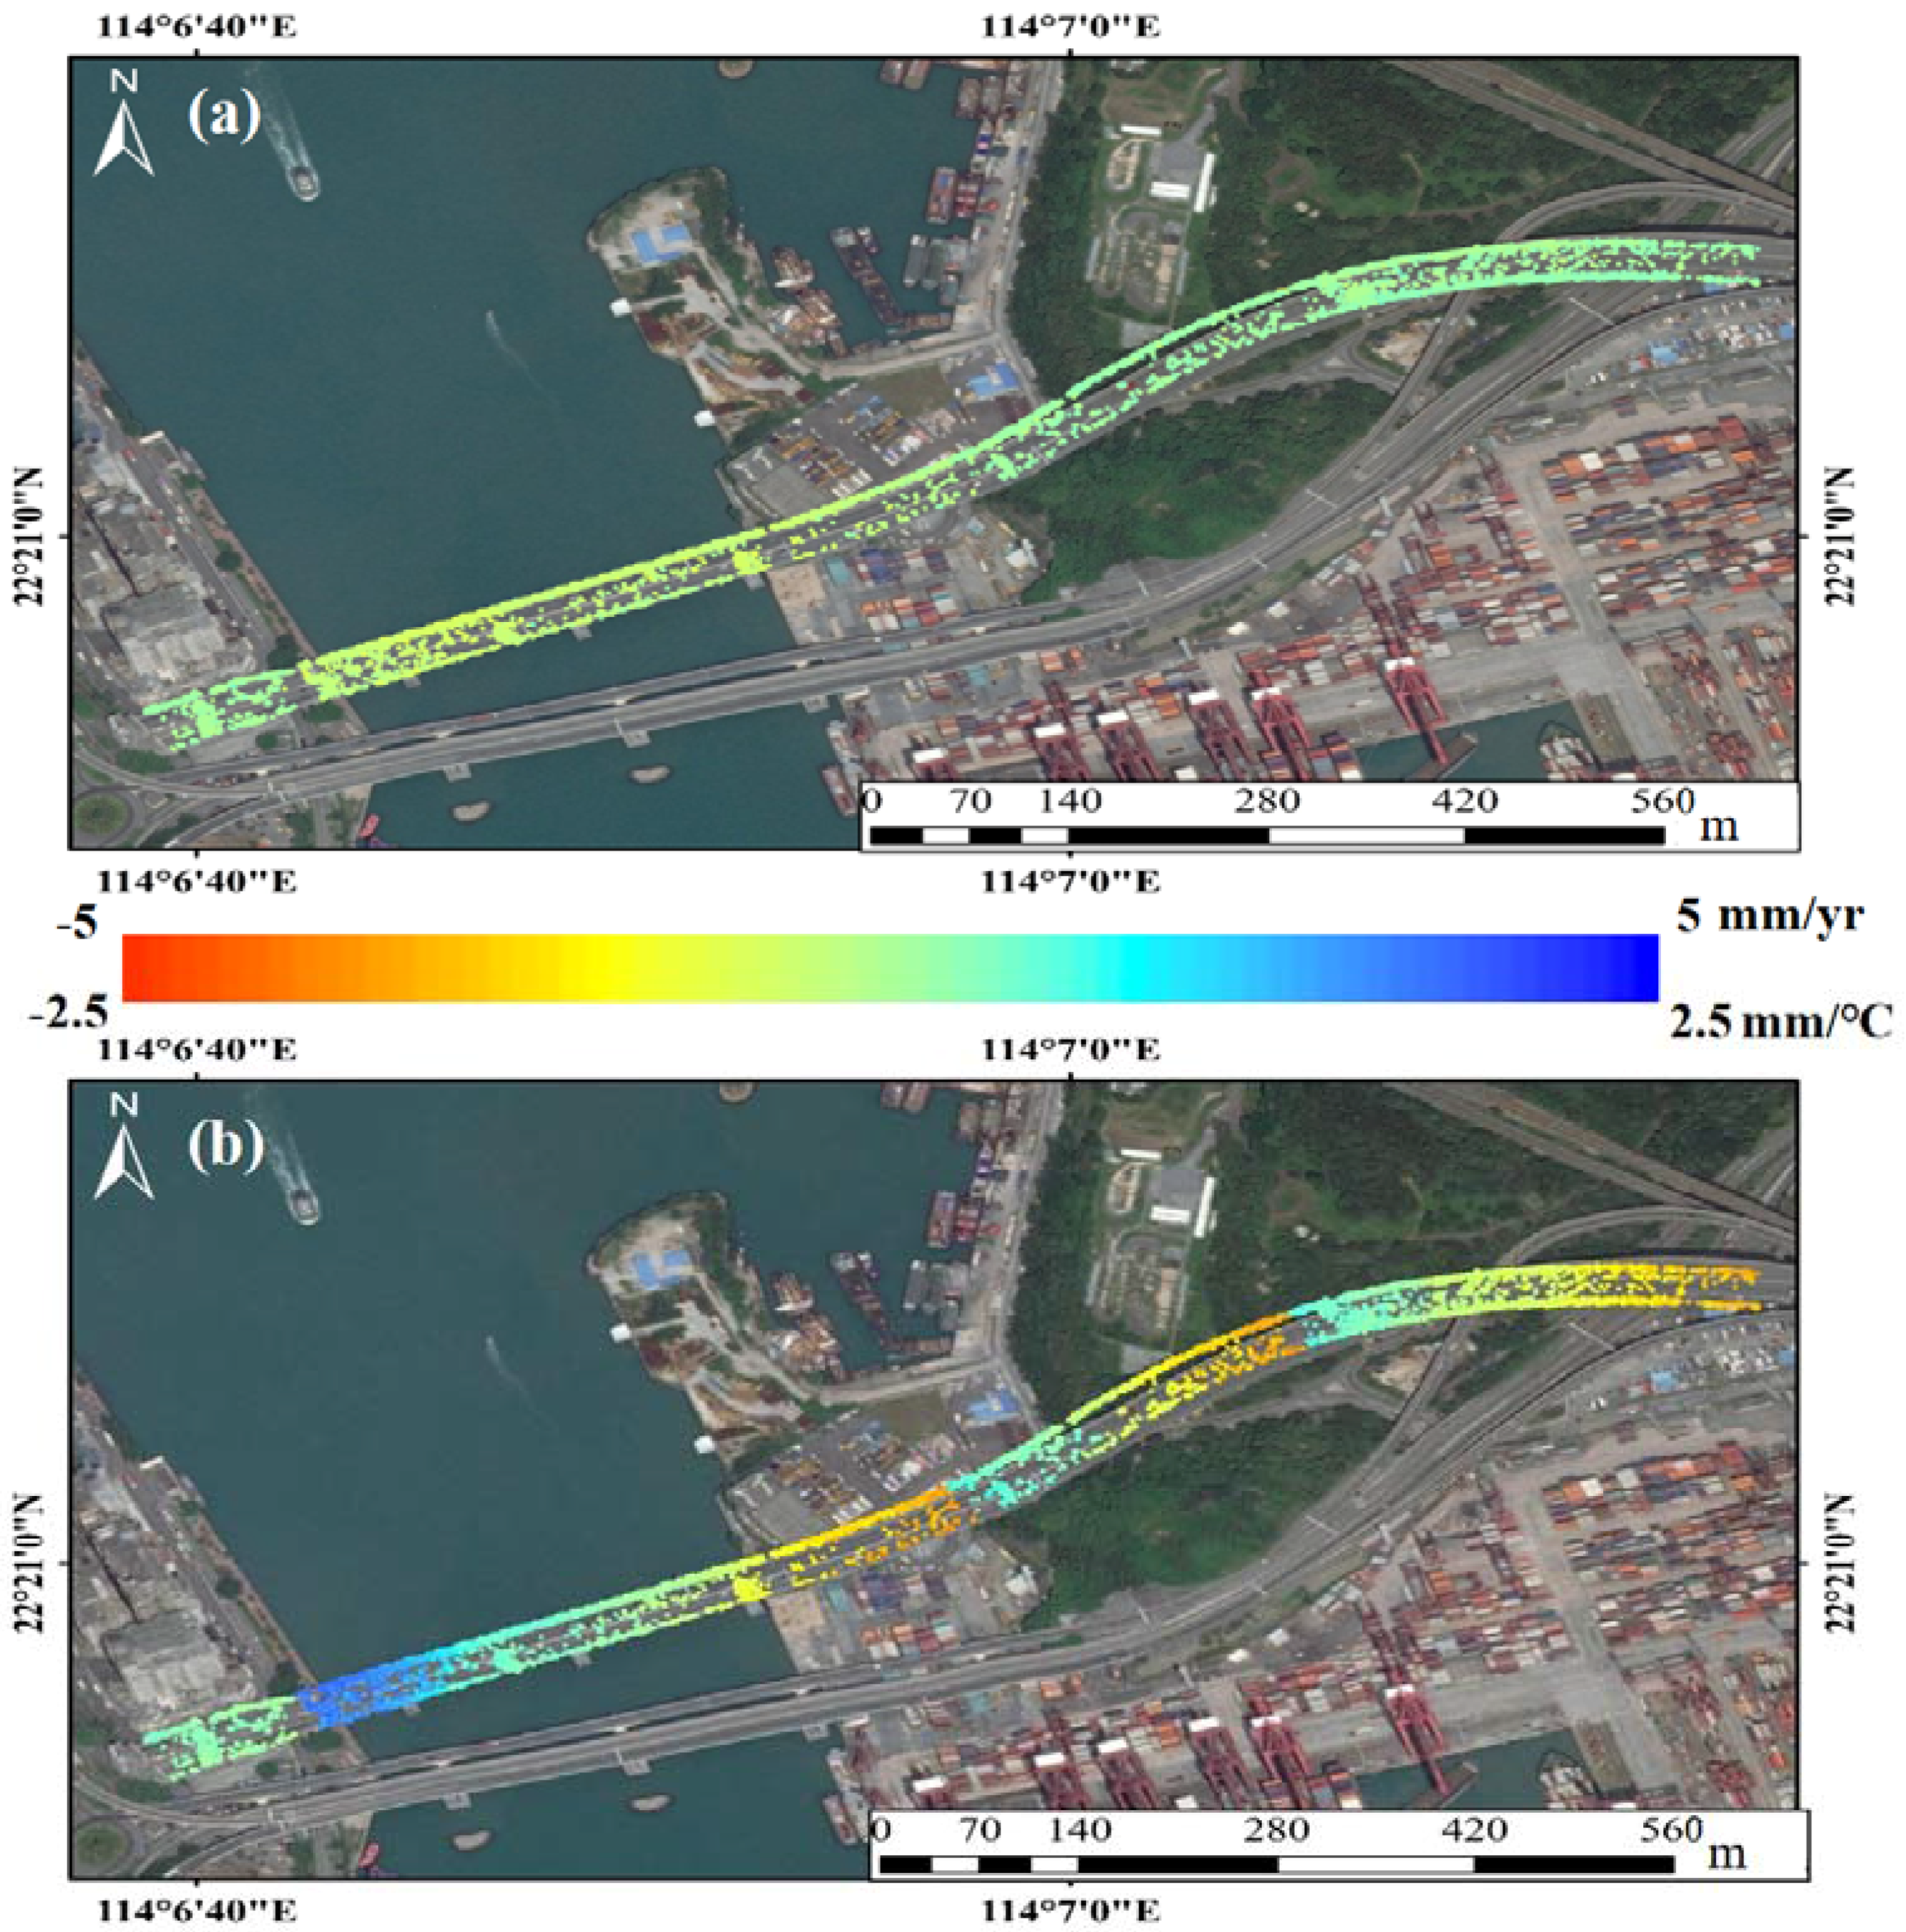
3.3.2. Thermal Dilation Results
4. Discussion of Thermal Dilation Mechanisms
5. Conclusions
Author Contributions
Funding
Acknowledgments
Conflicts of Interest
References
- Cusson, D.; Ghuman, P.; Mccardle, A. Satellite sensing technology to minitor bridges and other civil infrastrucures. In Proceedings of the 5th International Conference on Strucural Hwalth Monitoring of Intelligent and other Civil Infrastructres (SHMII-5), Cancun, Mexico, 4–8 December 2011; pp. 1–9. [Google Scholar]
- Chang, L.; Hanssen, R.F. Detection of cavity migration and sinkhole risk using radar interferometric time series. Remote Sens. Environ. 2014, 147, 56–64. [Google Scholar] [CrossRef]
- Lan, H.; Li, P.; Liu, H.; Yang, Z. Complex urban infrastructures deformation monitoring using high resolution PSI. IEEE J. Sel. Top. Appl. Earth Obs. Remote Sens. 2012, 5, 643–651. [Google Scholar] [CrossRef]
- Arangio, S.; Calo, F.; Mauro, M.D.; Bonano, M.; Marsella, M.; Manunta, M. An application of the SBAS-DInSAR technique for the assessment of structural damage in the city of Rome. Struct. Infrast. Eng. 2014, 10, 1469–1483. [Google Scholar] [CrossRef]
- Wang, H.; Chang, L.; Markine, V. Structural health monitoring of railway transition zones using satellite radat data. Sensors 2018, 18, 413. [Google Scholar] [CrossRef] [PubMed]
- Beshr, E.; Kallop, M. Monitoring bridge deformation using auto-correlation adjustment technique for total station observations. Positioning 2013, 4, 1–7. [Google Scholar] [CrossRef]
- Ferretti, A.; Prati, C.; Rocca, F. Permanent scatterers in sar interferometry. IEEE Trans. Geosci. Remote Sens. 2001, 39, 8–20. [Google Scholar] [CrossRef]
- Berardino, P.; Fornaro, G.; Lanari, R.; Sansosti, E. A new algorithm for surface deformation monitoring based on small baseline differential sar interferograms. IEEE Trans. Geosci. Remote Sens. 2002, 40, 2375–2383. [Google Scholar] [CrossRef]
- Jiang, Y.; Liao, M.; Wang, H.; Zhang, L.; Balz, T. Deformation monitoring and analysis of the geological enrionment of Pudong International Airport with persistent scatterer SAR interferometry. Remote Sens. 2016, 8, 1021. [Google Scholar] [CrossRef]
- Bai, L.; Jiang, L.; Wang, H.; Sun, Q. Spatiotemporal characterization of land subsidence and uplift (2009–2010) over Wuhan in central China revealed by TerraSAR-X InSAR Analysis. Remote Sens. 2016, 8, 350. [Google Scholar] [CrossRef]
- Hooper, A. A statistical-cost approach to unwrapping the phase of InSAR time series. In Proceedings of the Inernational Workshop on ERS SAR Interferometry, Frascati, Italy, 30 November–4 December 2009. [Google Scholar]
- Hooper, A. A multi-temporal InSAR method incorporating both scatterer and small baseline approaches. Geophys. Res. Lett. 2008, 35, L16302. [Google Scholar] [CrossRef]
- Hooper, A. Persistent Ascatter Radar Interferometry for Crustal Deformation Studies and Modelling of Volcanic Deformation. Ph.D. Thesis, Stanford University, Stanford, CA, USA, 2006. [Google Scholar]
- Milillo, P.; Giardina, G.; Matthew, J.; Perissin, D.; Milillo, G. Multi-temporal InSAR structural damage assessment: The London crossrail case study. Remote Sens. 2018, 10, 287. [Google Scholar] [CrossRef]
- Ma, P.; Lin, H. Robust detection of single and double persistent scatterers in urban built environments. IEEE Trans. Geosci. Remote Sens. 2016, 54, 2124–2139. [Google Scholar] [CrossRef]
- Eineder, M.; Adam, N.; Bamler, R.; Yague, M.; Breit, H. Spaceborne spotlight SAR interferometry with TerraSAR-X. IEEE Trans. Geosci. Remote Sens. 2009, 47, 1524–1535. [Google Scholar] [CrossRef]
- Gernhardt, S.; Adam, N.; Eineder, M.; Bamler, R. Potential of very high resolution SAR for persistent scatterer interferometry in urban areas. Geogr. Inf. Sci. 2010, 16, 103–111. [Google Scholar] [CrossRef]
- Daniele, P.; Wang, Z.; Lin, H. Shanghai subway tunnels and highways monitoring through Cosmo-SkyMed persistent scatterers. ISPRS J. Photogramm. Remote Sens. 2012, 73, 58–67. [Google Scholar] [CrossRef]
- Fornaro, G.; Reale, D.; Verde, S. Bridge thermal dialtion monitoring with millimeter sensitivity via multidimensional SAR imaging. IEEE Geosci. Remote Sens. Lett. 2013, 10, 677–681. [Google Scholar] [CrossRef]
- Shi, X.; Liao, M.; Wang, T.; Zhang, L. Expressway deformation mapping using high-resolution TerraSAR-X images. Remote Sen. Lett. 2014, 5, 194–203. [Google Scholar] [CrossRef]
- Qin, X.; Yang, T.; Zhang, L.; Yang, M.; Liao, M. Health disgnosis of major transporation infrastructures in Shanghai metropolis using high-resolution persistent scatterer interferometry. Sensors 2017, 17, 2770. [Google Scholar] [CrossRef] [PubMed]
- Chang, L.; Dollevoet, R.; Hanssen, R.F. Nationalwide railway monitoring using satellite SAR interferometry. IEEE J. Sel. Top. Appl. Earth Obs. Remote Sens. 2017, 10, 596–604. [Google Scholar] [CrossRef]
- Ma, P.; Lin, H.; Lan, H.; Chen, F. Multi-dimensional SAR tomograpgy for monitoring the deformation of newly built concrete buildings. ISPRS J. Photogramm. Remote Sens. 2015, 106, 118–128. [Google Scholar] [CrossRef]
- Bamler, R.; Eineder, M. The Pyramids of Gizeh seen by TerraSAR-X—A prime example for unexpected scattering mechanisms in SAR. IEEE Geosci. Remote Sens. Lett. 2008, 5, 468–470. [Google Scholar] [CrossRef]
- Gernhardt, S.; Bamler, R. Deformation monitoring of single buildings using meter-resolution SAR data in PSI. ISPRS J. Photogramm. Remote Sens. 2012, 73, 68–79. [Google Scholar] [CrossRef]
- Zhu, J.; Meng, Q. Effecitive and fine analysis for temperature effect of bridges in natural environmentals. J. Bridge Eng. 2017, 22, 04017017. [Google Scholar] [CrossRef]
- Xia, Y.; Chen, B.; Zhou, X.; Xu, Y. Field monitoring and numerical analysis of Tsing Ma suspension bridge termprature behavior. Struct. Control Health Monitor. 2013, 20, 560–575. [Google Scholar] [CrossRef]
- Crosetto, M.; Monserrat, O.; Cuevas-Gonzalez, M.; Devanthery, N.; Luzi, G.; Crippa, B. Measuring thermal expansion using X-band persistent scatterer interferometry. ISPRS J. Photogramm. Remote Sens. 2015, 100 (Suppl. S1), 84–91. [Google Scholar] [CrossRef]
- Cuevas, M.; Monserrat, O.; Crosetto, M.; Crippa, B. A new product from persistent scatterer interferometry: The thermal dilation maps. Urban Remote Sens. Event 2011, 50, 285–288. [Google Scholar] [CrossRef]
- Lazecky, M.; Hlavacova, I.; Bakon, M.; Sousa, J.; Perissin, D.; Patricio, G. Bridge displacements monitoring using space-boren X-band SAR interferometry. IEEE J. Sel. Top. Appl. Earth Obs. Remote Sens. 2017, 10, 205–210. [Google Scholar] [CrossRef]
- Qin, X.; Liao, M.; Zhang, L.; Yang, M. Structural health and stability assessment of high-speed railways via thermal dilation mapping with time-series InSAR analysis. IEEE J. Sel. Top. Appl. Earth Obs. Remote Sens. 2017, 10, 2999–3010. [Google Scholar] [CrossRef]
- Reale, D.; Fornaro, G.; Pauciullo, A. Extension of 4-D SAR imaging to thr monitoring of thermally dilation scatterers. IEEE Trans. Geosci. Remote Sens. 2013, 51, 5296–5306. [Google Scholar] [CrossRef]
- Monserrat, O.; Crosetto, M.; Cuevas, M.; Crippa, B. The thermal expansion component of persistent scatterer interferometry observations. IEEE Gecosci. Remote Sens. Lett. 2011, 8, 864–868. [Google Scholar] [CrossRef]
- Goel, K.; Gonzalez, F.R.; Adam, N.; Duro, J.; Gaset, M. Thermal dialtion monitoring of complex urban infrastructure using high resolution SAR data. In Proceedings of the 2014 IEEE International Geoscience and Remote Sensing Symposium (IGARSS), Quebec City, QC, Canada, 13–18 July 2014; pp. 954–957. [Google Scholar]
- Zhao, J.; Wu, J.; Ding, X. Elevation extraction and deformation monitoring by multitemporal InSAR of Lupu Bridge in Shanghai. Remote Sens. 2017, 9, 897. [Google Scholar] [CrossRef]
- Wu, J.C.; Hu, F.M. Monitoring ground subsidence along the Shanghai Maglev zone using TerraSAR-X images. IEEE Geosci. Remote Sens. Lett. 2017, 14, 117–121. [Google Scholar] [CrossRef]
- Huang, Q.; Crosetto, M.; Monserrat, O.; Crippa, B. Displacement monitoring and modelling of a high-speed railway bridge using C-band Sentinel-1 data. ISPRS J. Photogramm. Remote Sens. 2017, 128, 204–211. [Google Scholar] [CrossRef]
- Kromanis, R.; Kripakaran, P. Predicting thermal response of bridges using regression models derived from measurement histories. Comput. Struct. 2014, 136, 64–77. [Google Scholar] [CrossRef] [Green Version]
- Huber, P. Robust regression: Asymptotics, conjectures and monte carlo. Ann. Stat. 1973, 1, 799–821. [Google Scholar] [CrossRef]
- Ni, Y.; Hua, X.; Wong, K.; Ko, J.; Asce, F. Assessment of bridge expansion joints using long-term displacement and temperature measuremnt. J. Perform. Constr. Facil. 2007, 21, 143–151. [Google Scholar] [CrossRef]


| No | Date | Perpendicular Baseline (m) | Temporal Baseline (Days) | Acquisition Temperature (°C) |
|---|---|---|---|---|
| 1 | 2 August 2014 | −34.3 | −385 | 26.3 |
| 2 | 24 August 2014 | −74.1 | −363 | 25.4 |
| 3 | 15 September 2014 | −94.9 | −341 | 26.5 |
| 4 | 7 Octorber 2014 | −179.7 | −319 | 23.9 |
| 5 | 29 Octorber 2014 | −186 | −297 | 12.4 |
| 6 | 1 December 2014 | −104.4 | −264 | 4.7 |
| 7 | 23 December 2014 | −32.7 | −242 | 8.1 |
| 8 | 10 March 2015 | −35.3 | −165 | 6.9 |
| 9 | 1 April 2015 | −45.8 | −143 | 12.1 |
| 10 | 15 May 2015 | 22.9 | −99 | 27.2 |
| 11 | 27 June 2015 | 52.3 | −55 | 25.3 |
| 12 | 20 July 2015 | −126.2 | −33 | 24.1 |
| 13 | 22 August 2015 | 0 | 0 | 21.9 |
| 14 | 24 September 2015 | −43.9 | 33 | 26.1 |
| 15 | 27 Octorber 2015 | 255.8 | 66 | 20.8 |
| 16 | 29 November 2015 | −87.3 | 99 | 9.2 |
| 17 | 21 December 2015 | −54.4 | 121 | 7.1 |
| 18 | 29 March 2016 | −112.4 | 220 | 10.6 |
| 19 | 1 May 2016 | −94 | 253 | 16.3 |
| 20 | 3 June 2016 | 17.4 | 286 | 17.8 |
| 21 | 6 July 2016 | −110.8 | 319 | 28.6 |
| 22 | 8 August 2016 | −33.8 | 352 | 26.9 |
| 23 | 10 September 2016 | 121.2 | 385 | 24.2 |
| 24 | 13 Octorber 2016 | 64.4 | 418 | 19.2 |
| No | Date | Perpendicular Baseline (m) | Temporal Baseline (Days) | Acquisition Temperature (°C) |
|---|---|---|---|---|
| 1 | 7 July 2013 | 63 | −143 | 29.4 |
| 2 | 18 July 2013 | −40.3 | −132 | 29.8 |
| 3 | 29 July 2013 | 227.6 | −121 | 31.1 |
| 4 | 9 August 2013 | 141.6 | −110 | 30.9 |
| 5 | 20 August 2013 | 159.1 | −99 | 29.3 |
| 6 | 31 August 2013 | 158 | −88 | 27.7 |
| 7 | 22 September 2013 | 126.5 | −66 | 27.0 |
| 8 | 3 Octorber 2013 | 184.5 | −55 | 24.1 |
| 9 | 14 Octorber 2013 | 150 | −44 | 23.8 |
| 10 | 25 Octorber 2013 | 103.7 | −33 | 20.5 |
| 11 | 5 November 2013 | 160.1 | −22 | 22.7 |
| 12 | 16 November 2013 | 132.4 | −11 | 19.8 |
| 13 | 27 November 2013 | 0 | 0 | 16.2 |
| 14 | 8 December 2013 | −41.6 | 11 | 17.8 |
| 15 | 19 December 2013 | 141.6 | 22 | 11.5 |
| 16 | 30 December 2013 | 39.9 | 33 | 8.4 |
| 17 | 21 January 2014 | 30.2 | 55 | 12.3 |
| 18 | 1 February 2014 | −13.9 | 66 | 22.0 |
| 19 | 12 February 2014 | 178.4 | 77 | 8.5 |
| 20 | 23 February 2014 | 221.9 | 88 | 13.4 |
| 21 | 28 March 2014 | 240.3 | 121 | 23.7 |
| 22 | 30 April 2014 | −36.4 | 154 | 26.6 |
| 23 | 11 May 2014 | 156.9 | 165 | 29.8 |
| 24 | 13 June 2014 | 69.4 | 198 | 29.3 |
| 25 | 24 June 2014 | 78 | 209 | 30.5 |
| Thermal Dilation Mechanisms | The SWFC | The SNIEC | The TKH | Common |
|---|---|---|---|---|
| Transmission direction | Vertical | Horizontal | Horizontal | Longest side direction in geometry shape |
| Spatial pattern | Increased gradually from the bottom of building | Increased gradually from the middle of buildings but with opposite directions | Increased gradually from the middle of bridge but discontinuity at expansion joints | Provide the locations of structural key points |
| Magnitude | Largest | Smallest | Middle | Associated with materials and sizes |
© 2018 by the authors. Licensee MDPI, Basel, Switzerland. This article is an open access article distributed under the terms and conditions of the Creative Commons Attribution (CC BY) license (http://creativecommons.org/licenses/by/4.0/).
Share and Cite
Qin, X.; Zhang, L.; Ding, X.; Liao, M.; Yang, M. Mapping and Characterizing Thermal Dilation of Civil Infrastructures with Multi-Temporal X-Band Synthetic Aperture Radar Interferometry. Remote Sens. 2018, 10, 941. https://doi.org/10.3390/rs10060941
Qin X, Zhang L, Ding X, Liao M, Yang M. Mapping and Characterizing Thermal Dilation of Civil Infrastructures with Multi-Temporal X-Band Synthetic Aperture Radar Interferometry. Remote Sensing. 2018; 10(6):941. https://doi.org/10.3390/rs10060941
Chicago/Turabian StyleQin, Xiaoqiong, Lu Zhang, Xiaoli Ding, Mingsheng Liao, and Mengshi Yang. 2018. "Mapping and Characterizing Thermal Dilation of Civil Infrastructures with Multi-Temporal X-Band Synthetic Aperture Radar Interferometry" Remote Sensing 10, no. 6: 941. https://doi.org/10.3390/rs10060941