Subsidence Evolution of the Firenze–Prato–Pistoia Plain (Central Italy) Combining PSI and GNSS Data
by
 , ,
, ,
Matteo Del Soldato
1,* ,
,
Gregorio Farolfi
2,
Ascanio Rosi
1,
Federico Raspini
1 and
Nicola Casagli
1 1
Department of Earth Sciences, University of Firenze, Via La Pira 4, 50121 Firenze, Italy
2
Istituto Geografico Militare, Via Battisti, 10/12, 50121 Firenze, Italy
*
Author to whom correspondence should be addressed.
Remote Sens. 2018, 10(7), 1146; https://doi.org/10.3390/rs10071146
Submission received: 1 June 2018
/
Revised: 10 July 2018
/
Accepted: 18 July 2018
/
Published: 20 July 2018
(This article belongs to the Special Issue Radar Interferometry for Geohazards)
Abstract
:Subsidence phenomena, as well as landslides and floods, are one of the main geohazards affecting the Tuscany region (central Italy). The monitoring of related ground deformations plays a key role in their management to avoid problems for buildings and infrastructure. In this scenario, Earth observation offers a better solution in terms of costs and benefits than traditional techniques (e.g., GNSS (Global Navigation Satellite System) or levelling networks), especially for wide area applications. In this work, the subsidence-related ground motions in the Firenze–Prato–Pistoia plain were back-investigated to track the evolution of displacement from 2003 to 2017 by means of multi-interferometric analysis of ENVISAT and Sentinel-1 imagery combined with GNSS data. The resulting vertical deformation velocities are aligned to the European Terrestrial Reference System 89 (ETRS89) datum and can be considered real velocity of displacement. The vertical ground deformation maps derived by ENVISAT and Sentinel-1 data, corrected with the GNSS, show how the area affected by subsidence for the period 2003–2010 and the period 2014–2017 evolved. The differences between the two datasets in terms of the extension and velocity values were analysed and then associated with the geological setting of the basin and external factors, e.g., new greenhouses and nurseries. This analysis allowed for reconstructing the evolution of the subsidence for the area of interest showing an increment of ground deformation in the historic centre of Pistoia Town, a decrement of subsidence in the nursery area between Pistoia and Prato cities, and changes in the industrial sector close to Prato.
1. Introduction
Land subsidence is commonly defined as a gentle and gradual lowering or sudden sinking of the ground surface [1]. It can be caused by natural or anthropogenic processes or by a combination of both effects. Furthermore, it can be due to endogenic or exogenic phenomena, which refer to geological-related motions and the removal of underground materials, respectively [2]. Subsidence phenomena mainly affect urban areas [3] because of water overexploitation, with serious consequences such as damage to linear infrastructures, e.g., bridges, roads or railways, and building stability issues due to differential settlement [4,5,6].
Monitoring plays a key role in natural hazard management by providing cost-effective solutions to mitigate or minimize disaster losses. Traditionally, levelling networks [7] or GPS (Global Positioning System) techniques [8,9,10,11] were used to monitor land subsidence. In the last several decades, the SAR (Synthetic Aperture Radar) remote sensing methods have rapidly grown, and, currently, they are a common tool for natural hazard management. Earth Observation (EO) techniques can profitably support risk reduction strategies by taking advantage of their wide area coverage associated with a high cost/benefit ratio. One of these techniques, the Persistent Scatterers Interferometry (PSI) [12], has been successfully adopted for a wide range of applications in disaster management, and it has extensively proven to be a valuable tool to detect ground deformations due to landslides [13,14,15,16,17,18], subsidence [19,20,21,22,23,24,25,26,27,28], volcanoes [29,30] and earthquakes [31].
Subsidence is one of the main geological hazards in Tuscany, as well as landslides [32] and floods [33], but it is usually less studied. By combining the interferometric data from images acquired by the ENVISAT satellite, Rosi et al. [34] mapped the subsidence in the whole Tuscany region (central Italy) by a simple model [35] able to discriminate subsiding areas from other ground deformation.
In this work, the procedure presented by Rosi et al. [34], enhanced by combining SAR and GNSS (Global Navigation Satellite System), has been applied to both ENVISAT (acquired between 2003 and 2010) and Sentinel-1 (acquired between 2014 and 2017) datasets, focusing on the subsidence phenomena affecting the Firenze–Prato–Pistoia (FPP) plain. The radar images were processed according to the PSI (Persistent Scatterers Interferometry) technique in order to investigate the velocity of ground displacement of the Area of Interest (AoI). Successively, the resulting PS data were corrected according to the GNSS data to analyse absolute displacement and to therefore improve the precision of the investigation with respect to the usual multitemporal A-DInSAR (Advanced Interferometric SAR) analysis. The comparison between ENVISAT and Sentinel-1 data allows for investigating the evolution of zones continuously affected by ground lowering and highlighting areas characterized by trend changes. Three cross-sections were traced along the AoI to analyse the subsidence profiles and to investigate the temporal evolution from 2003 to 2017.
The main aim of the work is the monitoring of the spatial and temporal evolution of subsidence in the last 15 years in order to further develop previous works. The area of interest is historically affected by ground deformation due to its geological features and external factors, e.g., new greenhouses and nurseries. In this work, ENVISAT (2003–2010) and Sentinel-1 (2014–2017) SAR data were combined with GNSS data to correct the relative velocity of displacement in real velocity for monitoring this phenomenon.
2. Study Area
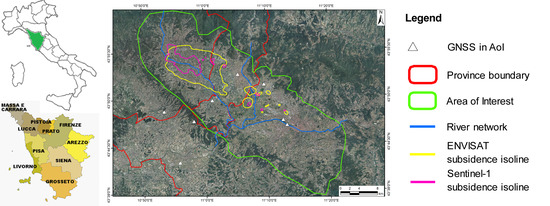
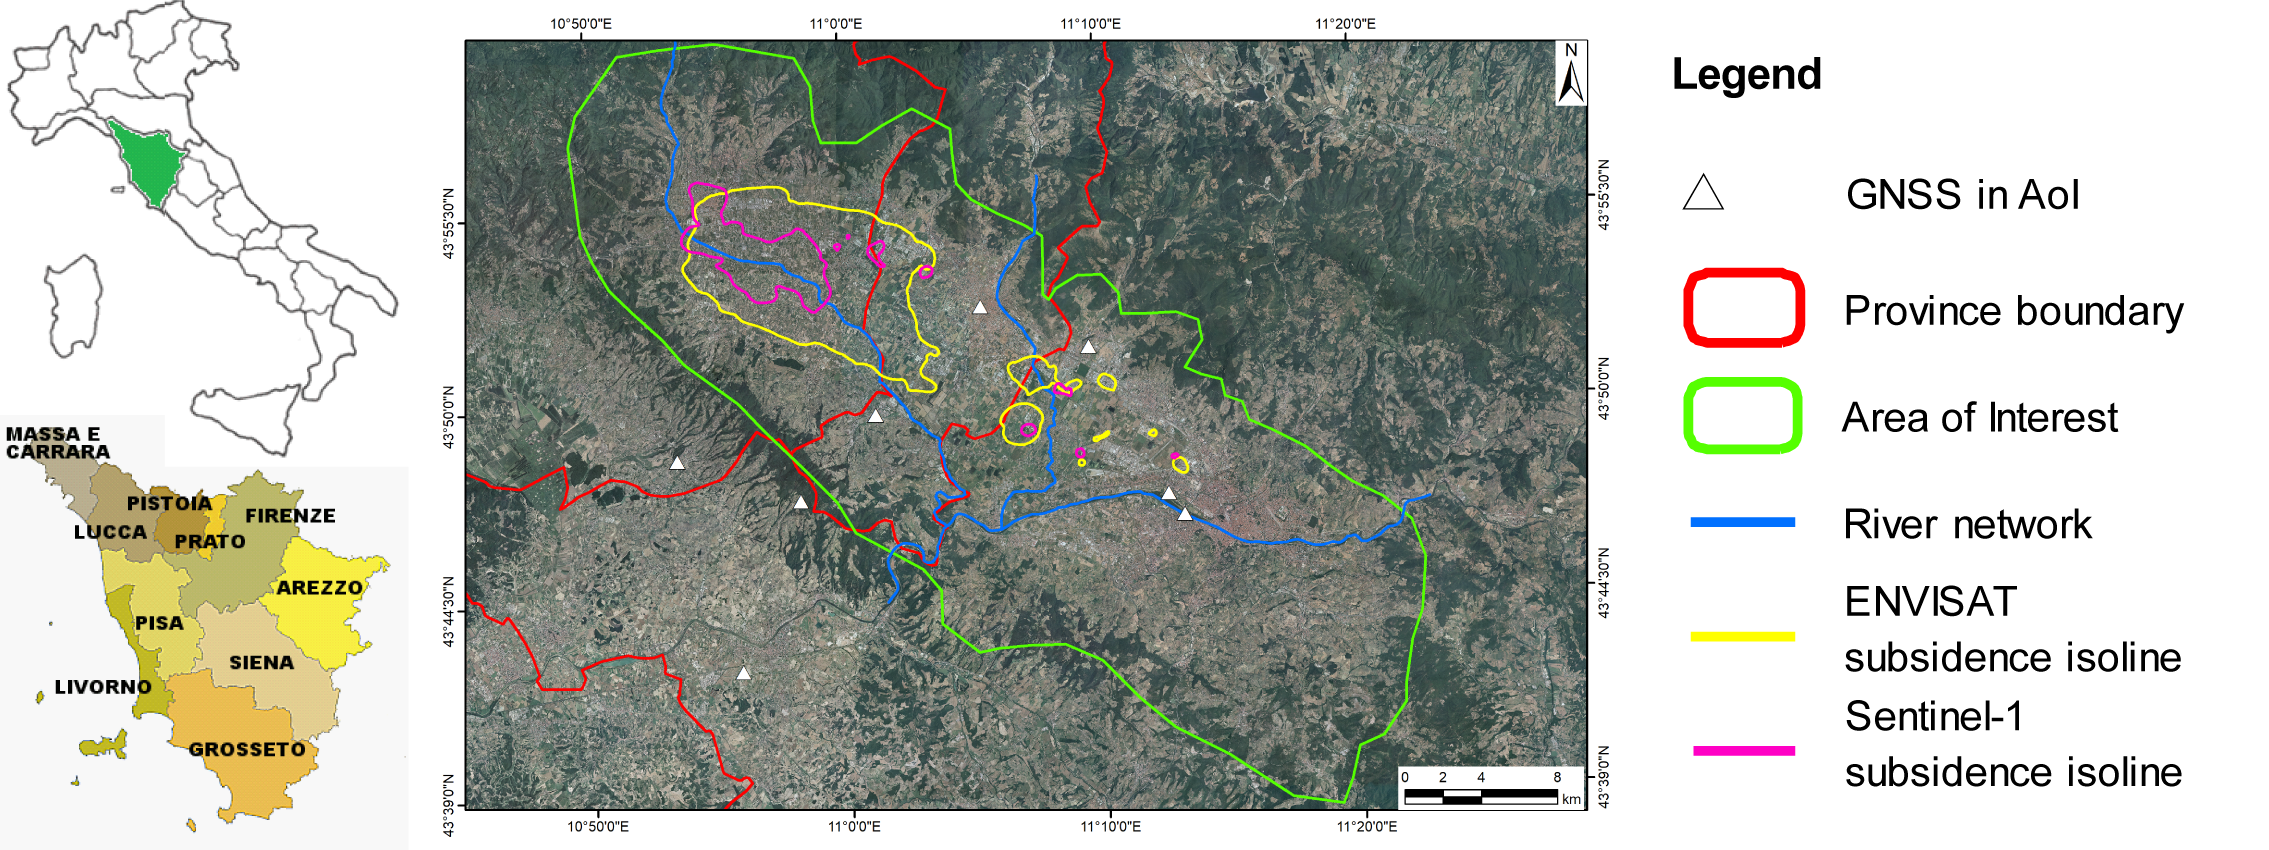
The area of interest is the Firenze–Prato–Pistoia basin located in the Tuscany region, central Italy (Figure 1). It has an extension of approximately 824 km2 and a mean elevation of ca. 50 m a.s.l. The plain is part of the 8.4% of the flat areas [36] of the Tuscany region, and it is crossed by the Ombrone creek in the Pistoia area, the Bisenzio River in the Prato province and the Arno River in the Florence area. The valley is bordered by the Northern Apennines in the north and in the east, by the Chianti and Senese hillslopes in the south, and by the Valdinievole valley and the Serravalle Pistoiese relief in the west. The plain has an elongated shape in the NW–SE direction and is approximately 35 km wide and 100 km long; three main cities are presented: Florence, Prato and Pistoia.
This plain is an intermontane valley formed during the late extensional phase of the formation of the northern Apennines and later filled with alluvial deposits, reaching a thickness of hundreds of metres. The shape is defined by normal faults in the NO flank forming a semi-graben (late Pliocene) filled by a relevant thickness of marshy-lacustrine sediments [37]. The soft sediments are subsiding due to groundwater overexploitation, the tree nursery industry and the load of the urban centre [34,35,38], which has been reported since the 18th and 19th centuries [39,40].
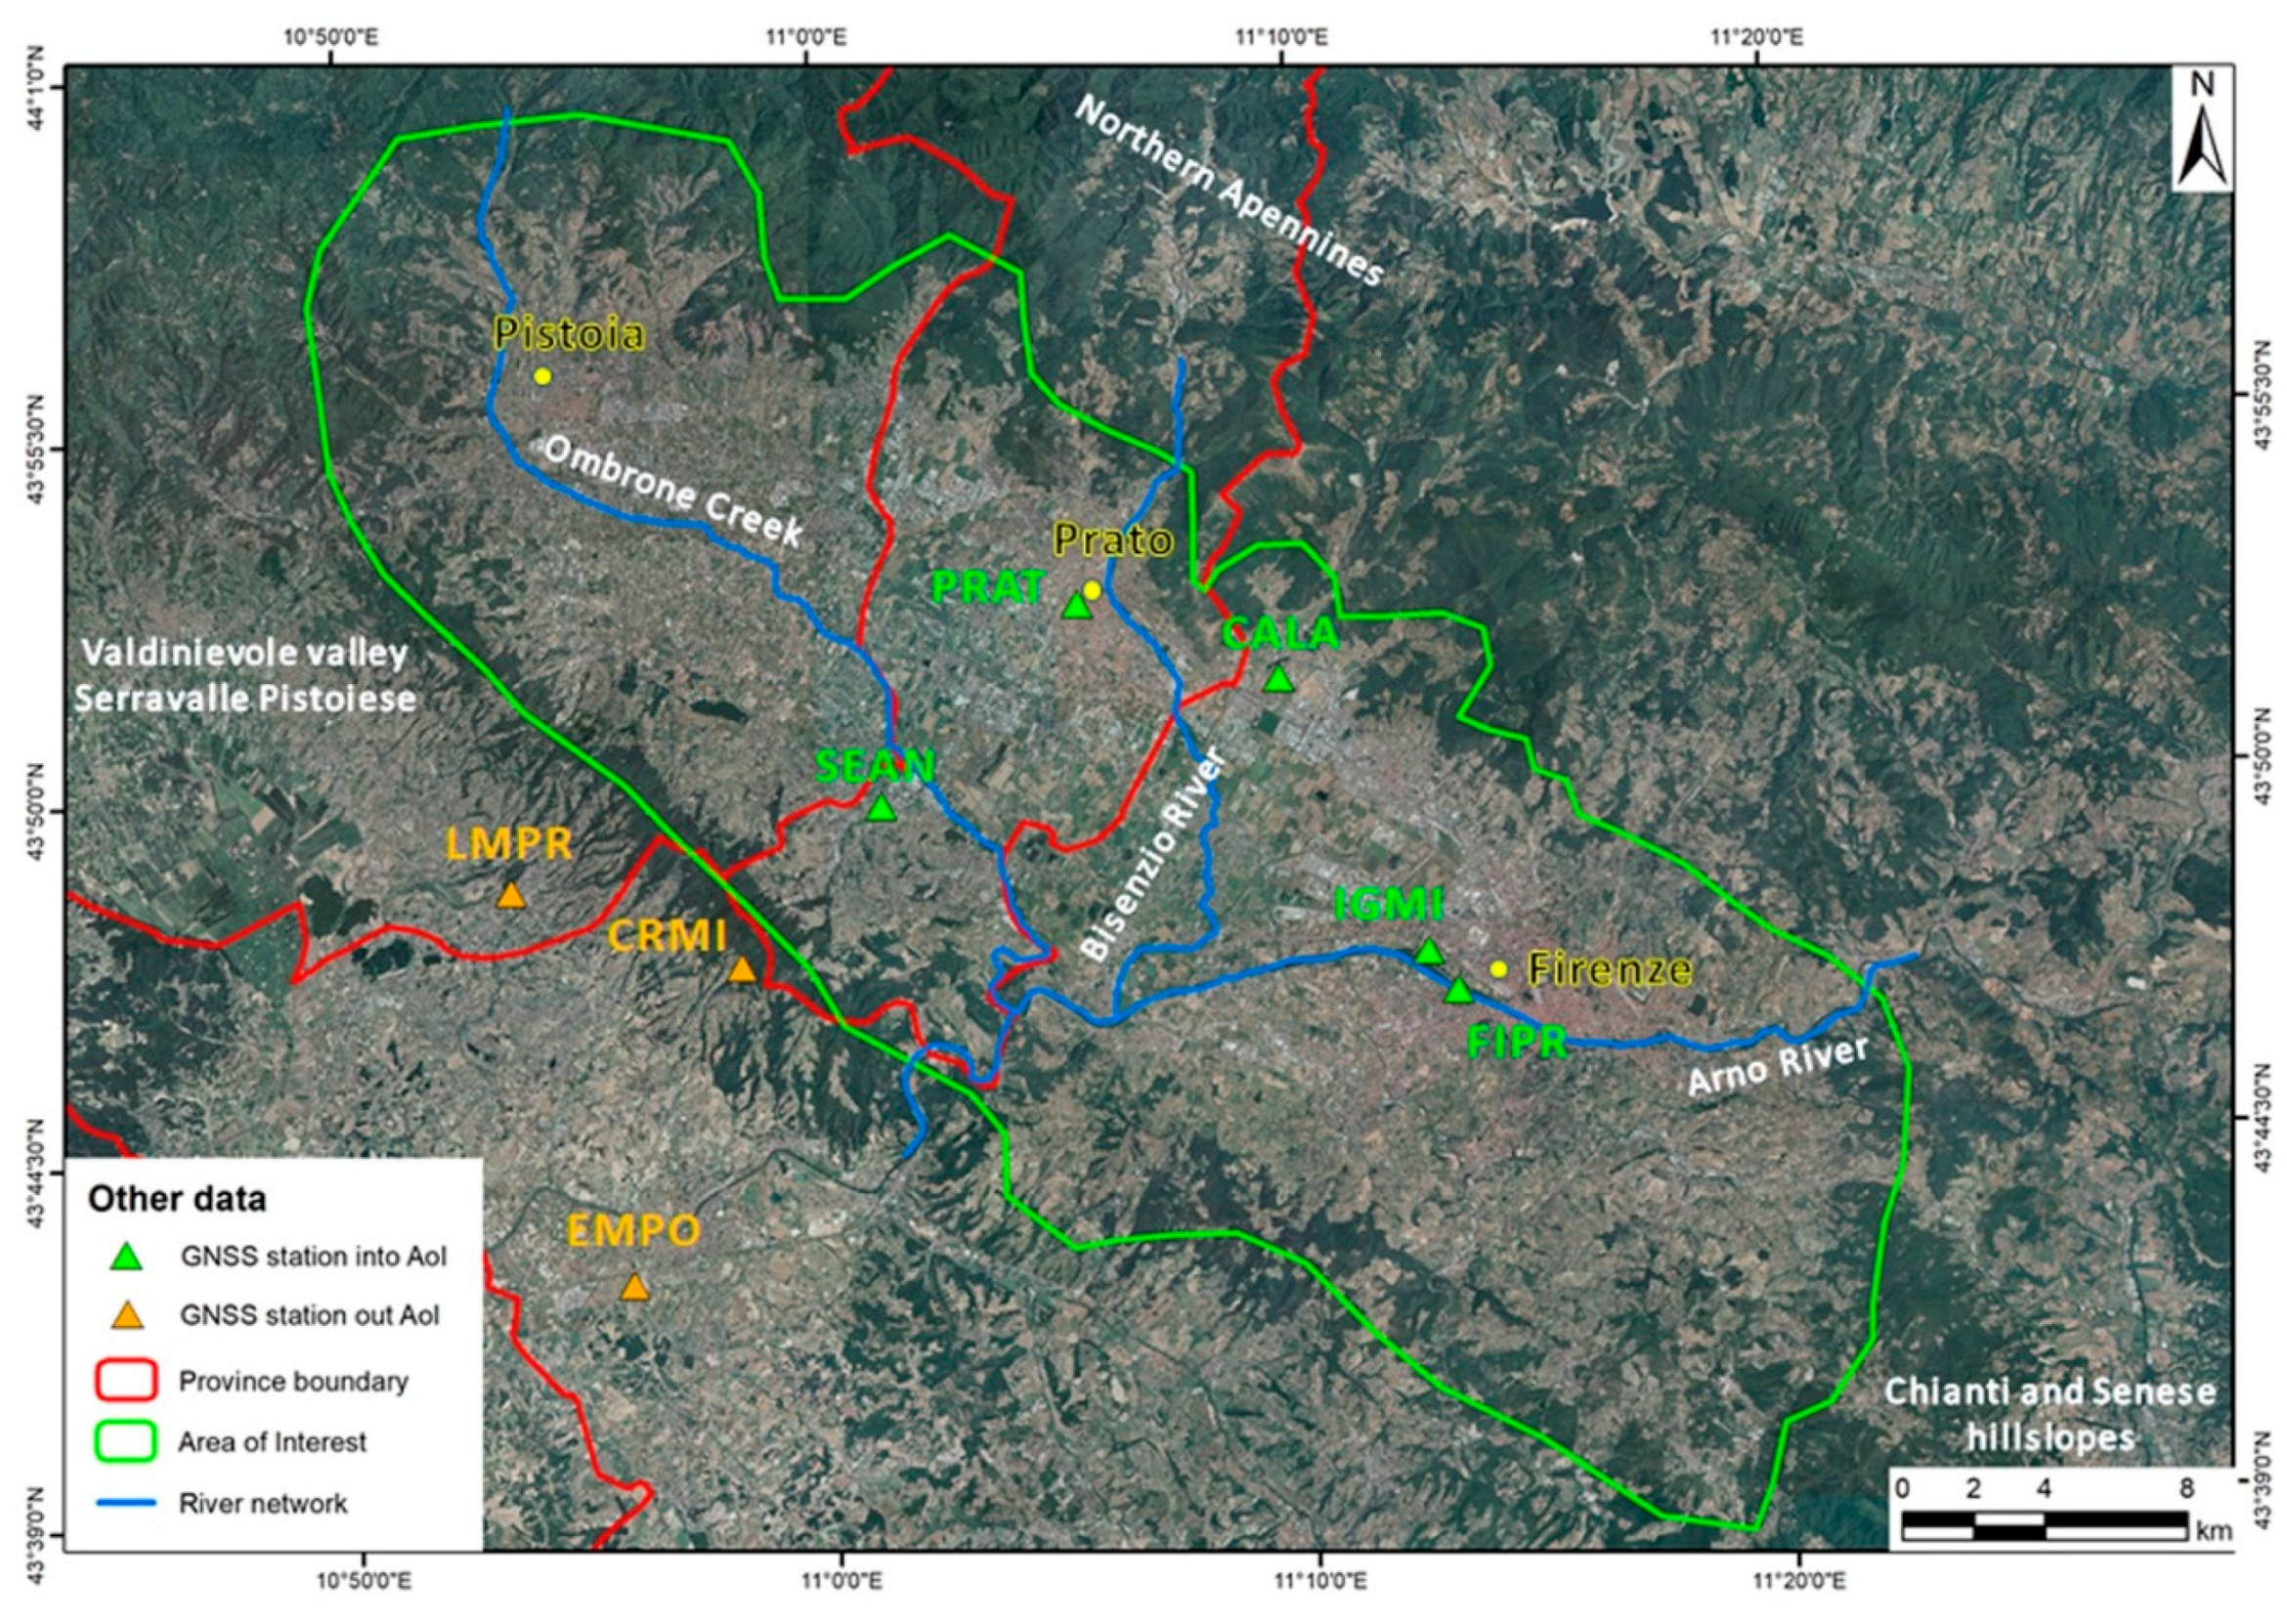
From a geological point of view, the basin is comprised from the bottom to the top [36] (Figure 2) the Macigno formation composed of sandy flysch (Oligocene-Miocene), the Canetolo Complex clayschists (Eocene–Oligocene), Ophiolitic Complex (Lower Jurassic–Lower Cretaceous) and the Calvana Supergroup (Upper Cretaceous–middle Eocene). The stratigraphy is covered by lacustrine, locally fluvial sediments with different thicknesses based on the localization in the AoI and with respect to the boundary of the valley. Generally, the deposits are constituted by pebbles with variable dimensions from centimetres to metres and the presence of gravel, sand and clay. The percentage of these components depends on the distance with respect to the main rivers of the area, e.g., Arno, Ombrone and Bisenzio Rivers.
3. Materials and Data
To investigate the subsidence phenomena and evolution between 2003 and 2017 in the AoI, satellite SAR data were combined with the derived information from eight GNSS permanent stations installed in the study area, which has presented continuous and accurate time series over the last several decades. These data have the relevant advantage of recurrent information with a high cost/benefit ratio over wide areas and millimetric precision. In addition, ancillary data such as a 10 m resolution DEM (Digital Elevation Model), derived maps (aspect and slope maps), and the geology of the study area were used to characterize and investigate the vertical ground displacements affecting the area.
The PSI processing is organized in clusters, and, for each cluster, a ground fiducial point assumed to be stable, the reference point, is chosen during the processing phase on the basis of the geological features of the area and the high coherence and reflectivity of the radar images. This means that the recorded PS displacements, derived from a differential technique, are calculated by assuming the stability of the reference points, even if it is not connected to any geodetic reference frame [42]. To by-pass the problem and then to represent the PS velocities in the same geodetic reference frame, GNSS permanent station data were involved to provide the datum alignment.
3.1. SAR Data
PSI data from ENVISAT satellite (2003–2010) are made available, in both ascending and descending orbits, from the Portale Cartografico Nazionale (PCN) of the Italian Ministry of Environment and Territory of the Sea (METS) [43] (http://www.pcn.minambiente.it/), while Sentinel-1 radar images can be freely downloaded from Sentinel Scientific Data Hub [44] (https://scihub.copernicus.eu). The Sentinel-1 constellation is composed of Sentinel-1A and Sentinel-1B, which have the same reference orbit with a 180-degree orbital phasing difference, allowing a short revisiting time [32]; in addition, it is a continuation of the ENVISAT mission. Both satellites carry sensors in C-band (wavelength 5.6 cm), so they can be easily compared, even if they have different revisit times: Sentinel satellite has a revisiting period of 12 days from April 2014 and of six days from April 2016 when the twin satellite was launched, while the ENVISAT constellation had a revisiting period of 35 days. Details on the ENVISAT and Sentinel-1 data available and used for the investigation of the FPP plain are reported in Table 1.
The ENVISAT data have been processed by the PSP-DIFSAR (Persistent Scatterers Pairs Differential InSAR) [45] and PSInSAR [13] approaches by e-GEOS and TRE-Altamira companies, respectively [34], while the Sentinel-1 images were elaborated by TRE-Altamira company by the SqueeSAR technique [46]. Both ENVISAT and Sentinel-1 PSI products cover the entire area with a good point density due to the high amount of reflecting elements, e.g., urban areas, and the advantageous morphology. The difference in the PS number between the ENVISAT and the Sentinel-1 data is due to the algorithm used for the processing of radar images, as described before, and the different coherence thresholds applied in the processing phase (0.6 for the ENVISAT products and 0.7 for the Sentinel-1 data).
3.2. GNSS Data
Eight GNSS permanent stations (Figure 1), which have been continuously collecting data for several years, are present inside and close to the study area. Two of them, Florence (IGMI) and Prato (PRAT), belong to the European GNSS Permanent Network (EPN) and to the Italian GNSS Geodetic Reference System named Rete Dinamica Nazionale (RDN). Three of these GNSS stations are located outside of the FPP basin (EMPO, CRMI and LMPR), one in the city centre (FIPR) and one in the periphery (IGMI) of Florence. The other three GNSS stations are located in the town of Calenzano (CALA) near Florence, in the city of Prato (PRAT) and in Seano village (SEAN), on the east side of Prato city (Table 2). The data availability of the GNSS stations start in 1998 for PRAT station, 2006 for IGMI and CRMI, and 2010 for the remaining sites. Note that the GNSS and PSI datasets overlap for more than seven years, and the hypothesis of linear motions has been assumed to extrapolate the GNSS velocities. The reason is that all the GNSS sites located in study area present velocities determined by GNSS and PSI techniques that are characterized by a linear and almost constant pattern across time in horizontal and vertical components but with different rates. The GNSS data processing was performed using Bernese GPS Software (Version 5.0. 2007, Astronomical Institute of University of Bern (AIUB); Bern, Switzerland) following the strategy processing of the International Earth Rotation and Reference Systems Service Conventions 2010 and EUREF (European Reference Frame) guideline. Daily double differenced GNSS phase observations were used to estimate station coordinates and the velocity uncertainties were estimated with the combination of flicker and white noise. Daily free normal equation solutions were stacked to produce a single weekly normal equation. Time series weekly positioning solutions were analysed for determining the velocity by checking for the possible outliers and estimating the annual and semi-annual seasonal effects, correcting the eventual discontinuities and aligning with the ETRS89 reference frame [47,48].
4. Methodology
The subsidence mapping by ENVISAT and Sentinel-1 data is based on two steps. The first step aims to correct the SAR velocities since they are calculated with respect to a set of unknown reference points defined during the processing phase as motionless stable points according to the geological data and high coherence. This hypothesis that reference points are motionless causes incorrect determination of PS velocities in the case that reference points are not stable. In detail, the displacements and velocities determined with SAR interferometry can represent only relative motions, which is, in the case of PS Interferometry, the relative motion between the PS points. In order to obtain absolute measurements, it is necessary to determine displacements and velocities with respect to a geodetic datum (ETRS89), a step that was performed by using the GNSS technique. In particular, a set of GNSS permanent stations located in the study area were involved in the calibration of SAR images. GNSS permanent stations collect data every 30 s, 24 h a day, seven days a week and these conditions permit determining their positions with millimetric accuracy. The determination of the horizontal and vertical components of velocity of each GNSS site is calculated by the analysis of time series positions after removing periodic fluctuations and eventual discontinuities.
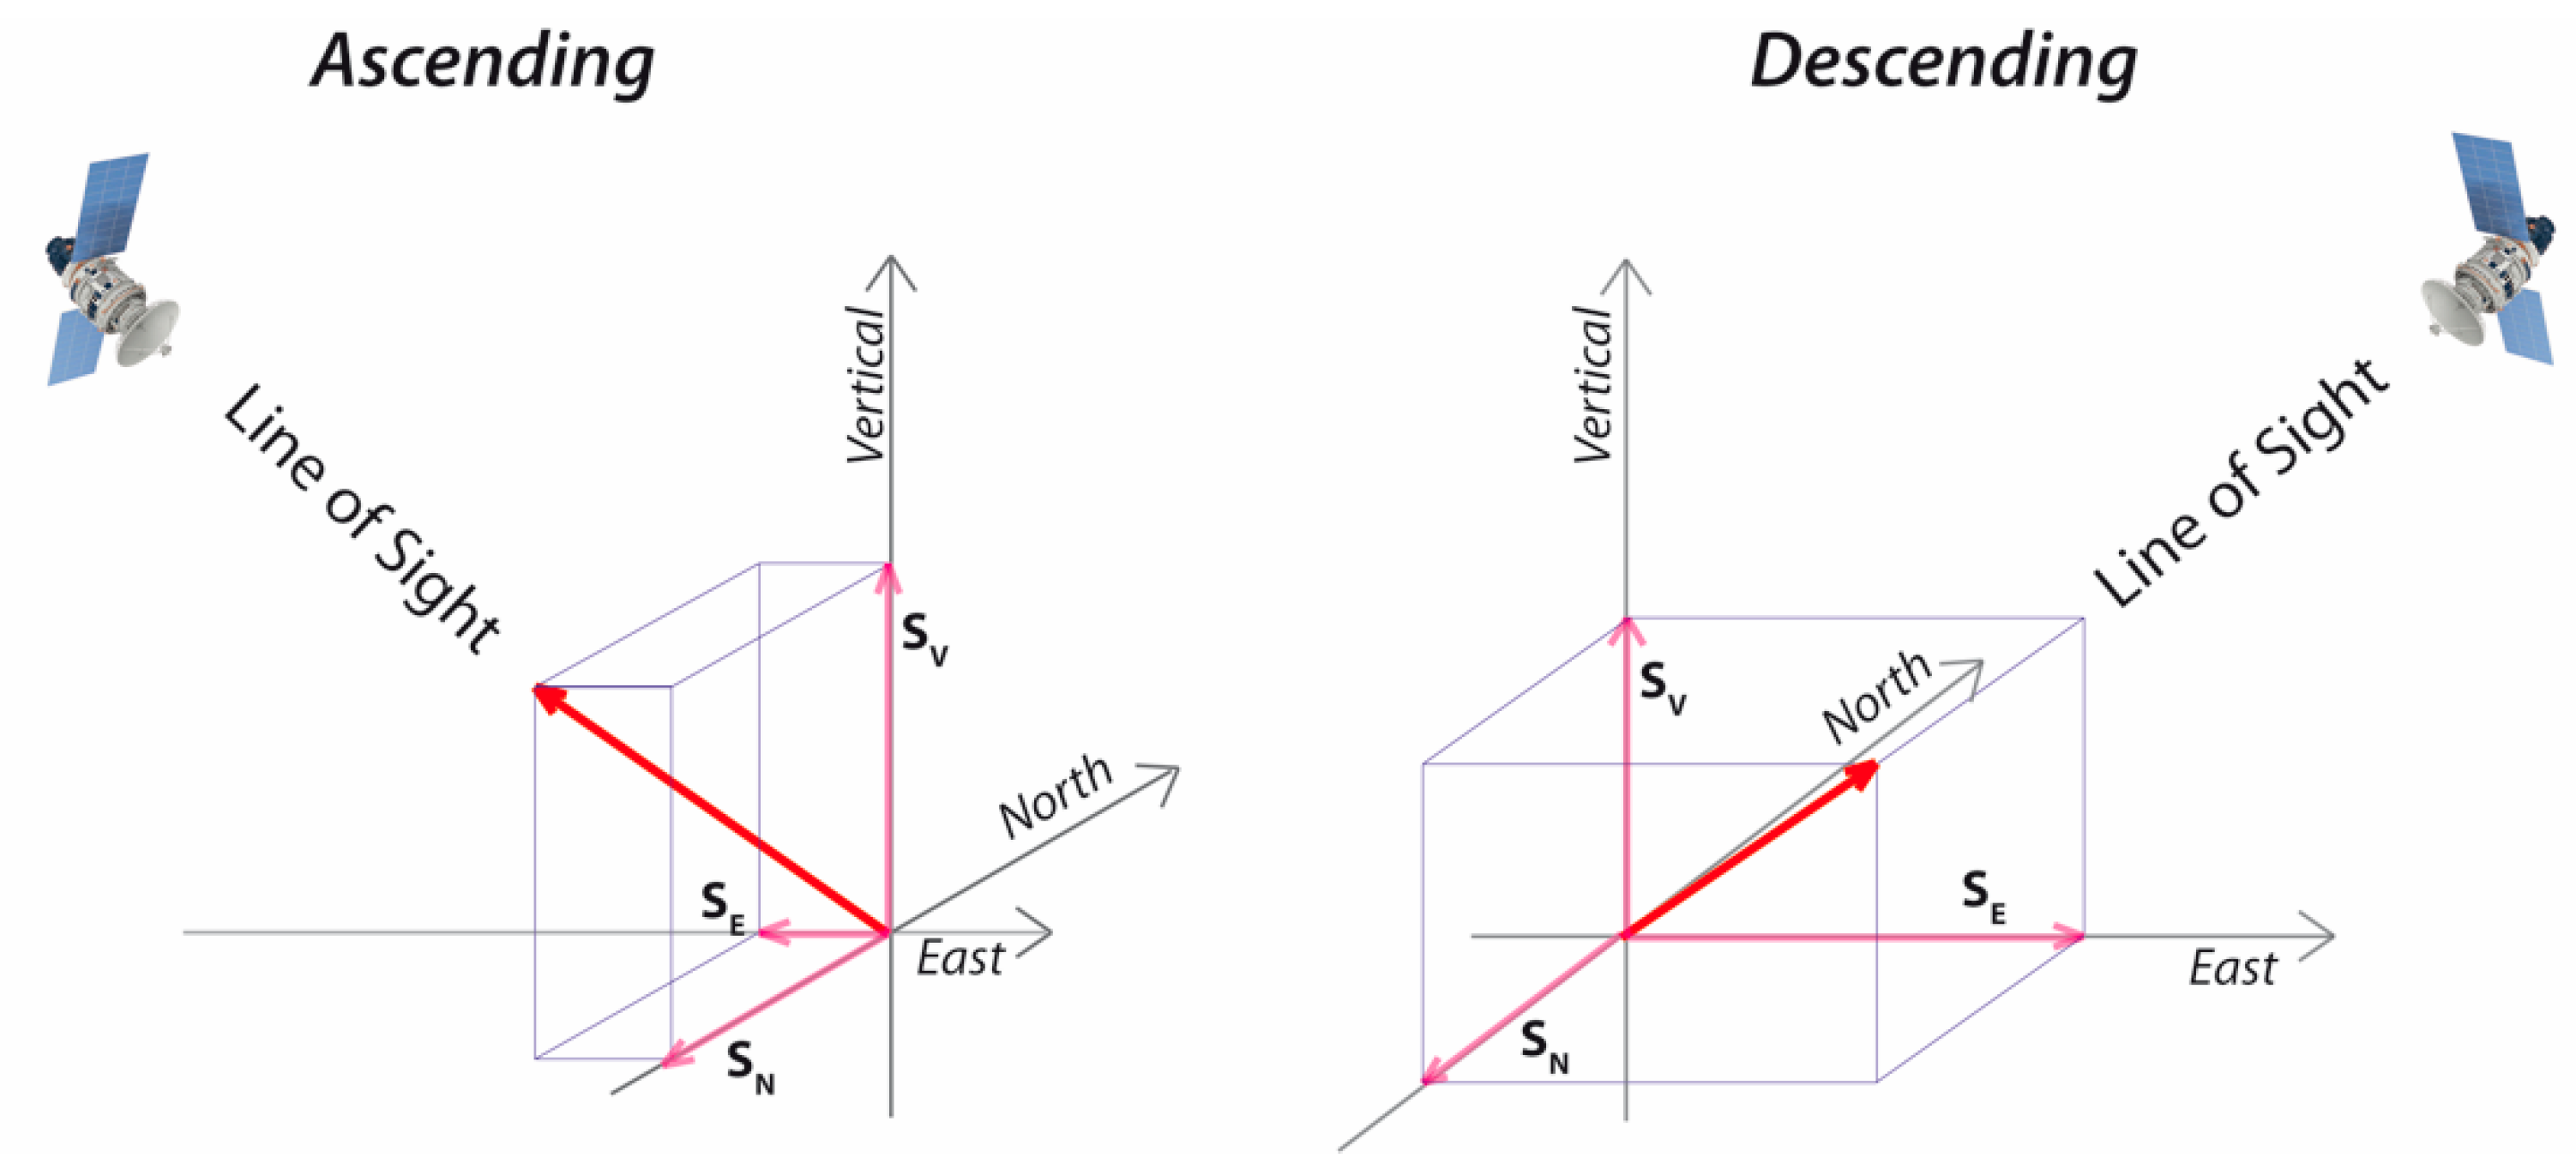
To compare PS displacements and velocities with GNSS, SAR measurement vectors that are recorded along the satellite LOS (Line Of Sight) direction must be projected into their horizontal and normal components with respect to the international ellipsoid (GR80) such as the GNSS dataset. The velocity measured by the SAR satellite for a ground movement can be represented by the direction cosine that identifies the unit vector in the direction from the ground to the satellite (LOS direction) (Figure 3):
The component of unit vector for ascending (SA) and descending (SD) orbits are derived by the inclination of the orbits with respect to the equator, , and the mean off-nadir, :
Writing Equation (1) for the ascending (VA) and descending (VD) velocities by using the direction cosine gives the following:
Equation (3) is a system of two equations with three variables and is thus not solvable. Displacements occurring along the north–south direction, almost parallel to the satellite orbit, cannot be measured accurately, as their projection along the LOS is negligible for both the ascending and descending orbits. Assuming that the projection of the north component of the velocity along the LOS is negligible in both satellites, Equation (3) can be approximated as:
where the two components of velocity v can be derived as follows:
The parameters of ENVISAT and Sentinel-1 constellations, i.e., the orbit inclinations with respect to the equator and the mean off-nadir angle and the modules of the components, are presented in Table 3.
The GNSS velocities derived by the permanent station located in the study area were used for the data alignment of the PS velocities to the ETRS89 reference frame. The correction value to be applied to the PS dataset is determined in each GNSS site by the difference of the velocity measured with the GNSS and PS techniques. The difference of the velocity derived by these techniques for each GNSS site consists of a set of sparse correction velocities. According to the ground deformation maps made by the vertical velocity corrected by the GNSS data and the approach described by Crisci et al. [33] to identify the areas affected by vertical displacement, the available PS velocities were interpolated by Inverse Distance Weight (IDW) [49,50] applying a weight calculated as the inverse of the square of the Euclidean distance. After the correction, the resulting PS velocities were aligned to the European geodetic reference frame ETRS89. These absolute (not the mathematical meaning) values of vertical velocity were then used to map the subsidence in the AoI from 2003 to 2017.
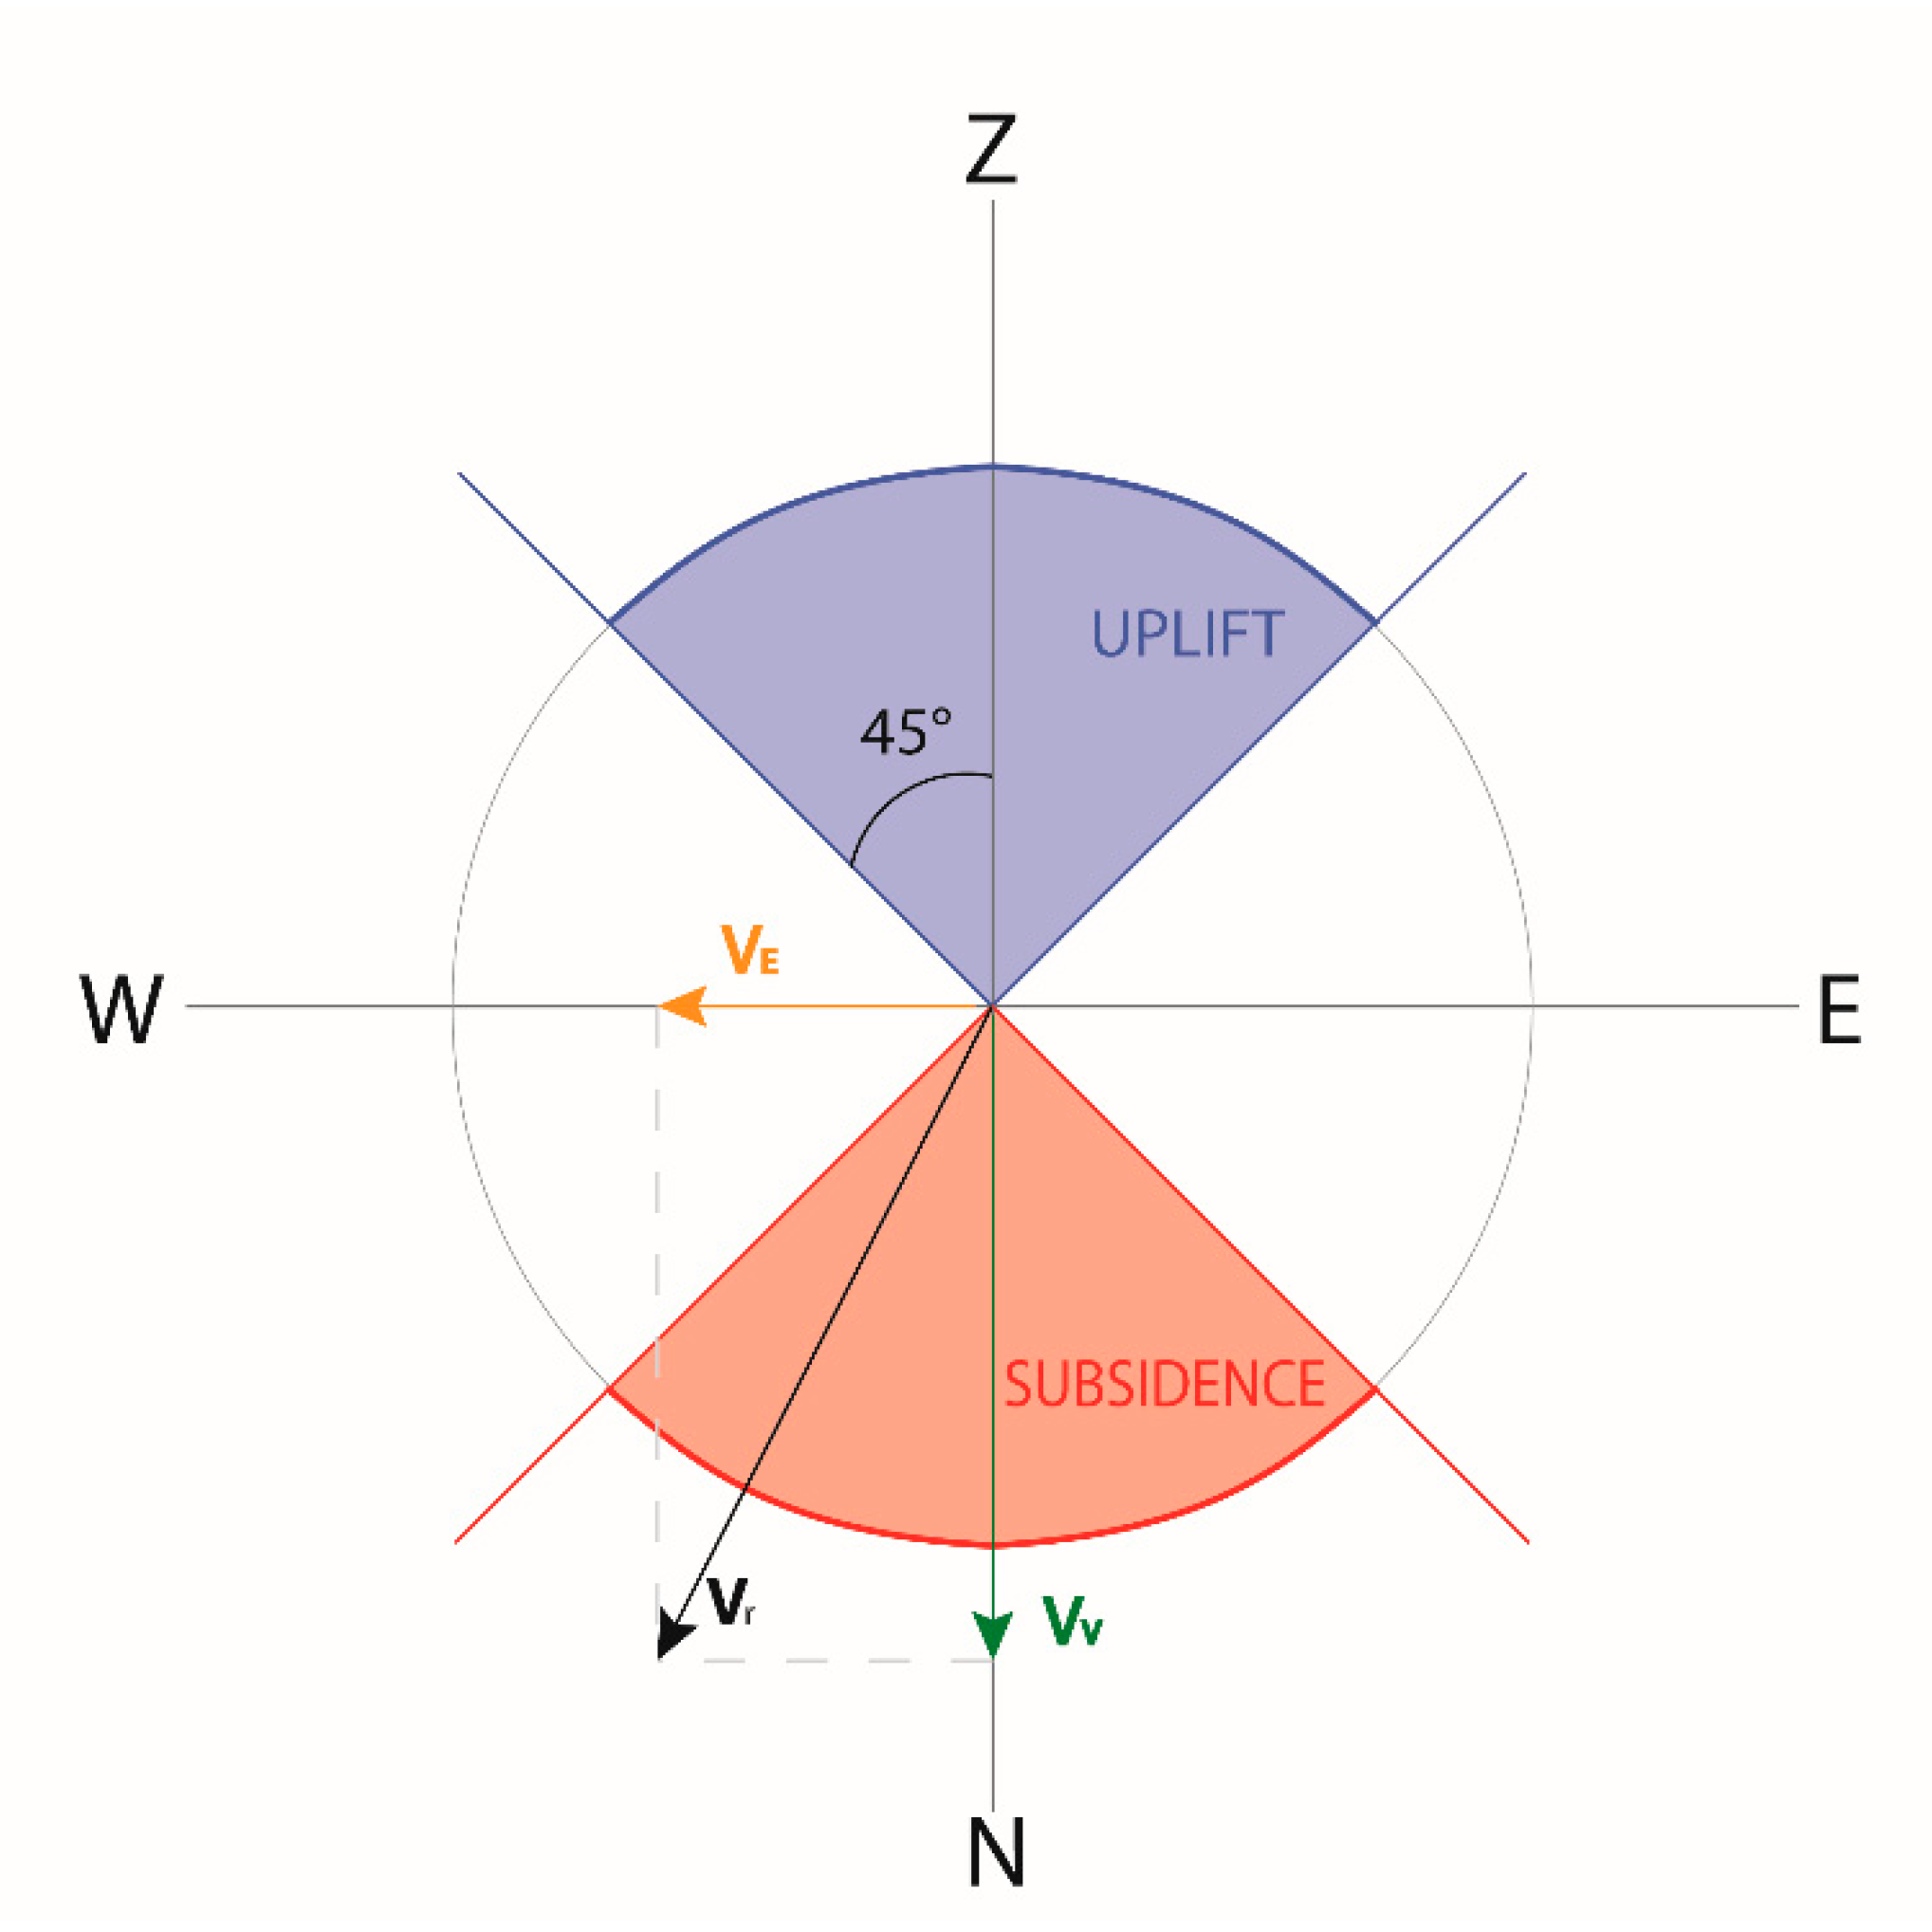
To calculate the subsidence rate, the corrected data from both ENVISAT and Sentinel-1 were analysed using the procedure described by Rosi et al. [35]. This procedure was developed to map the subsidence at regional scale, taking into account the variations in the morphology of a certain study area. This procedure, starting from the vertical and horizontal components of displacements measured by the satellite, is based on the calculation of the direction of the displacement; then, the horizontal and vertical displacements are divided, and the ground movements that are mainly horizontal are filtered out since subsidence (or uplift) can be considered as mainly vertical movements (Figure 4).
5. Results
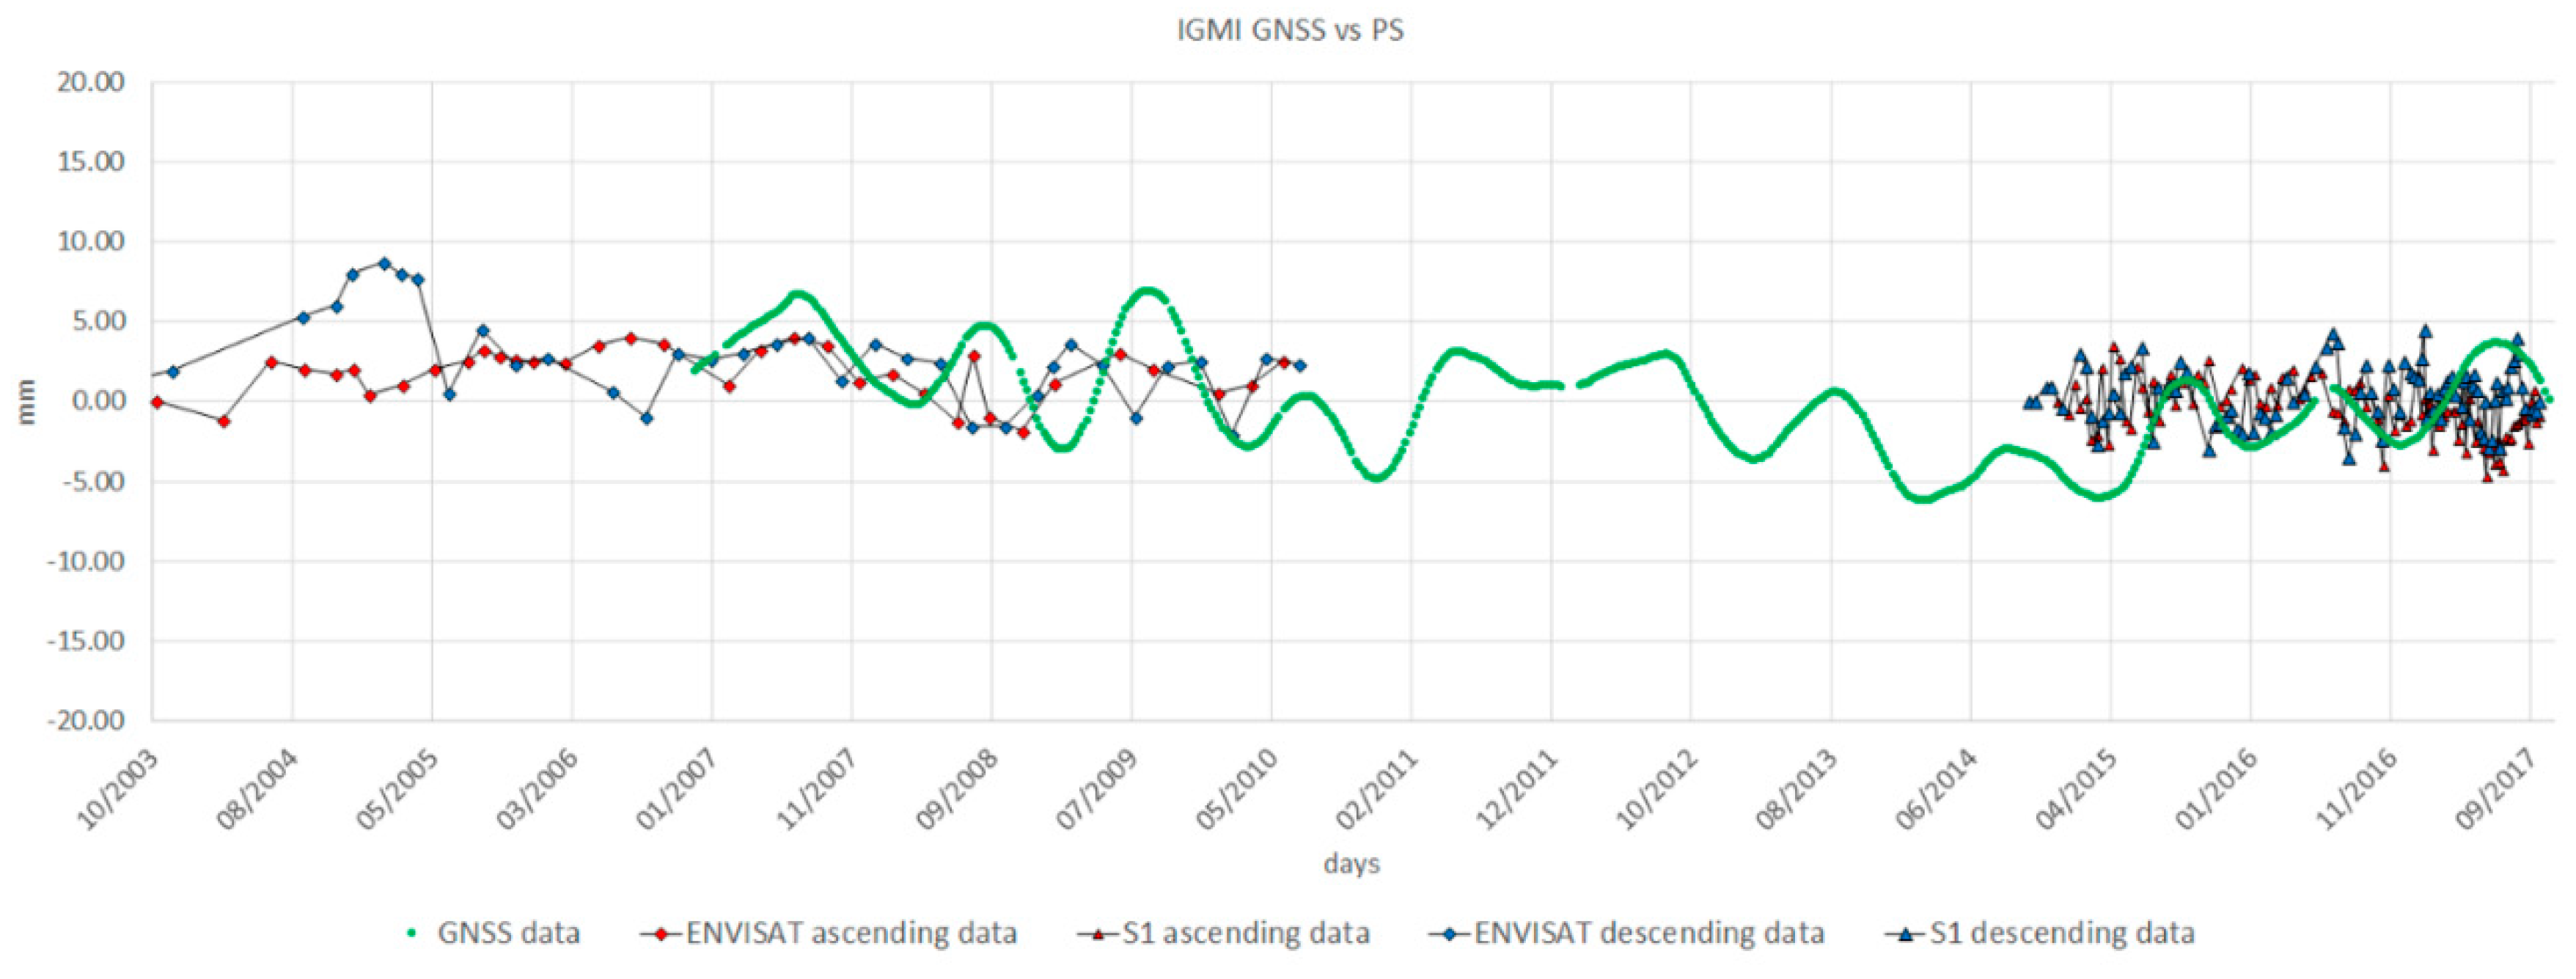
The analysis of the GNSS data demonstrated that the areas considered as stable are instead affected by the continuous displacement of the surface. In the study area, the GNSS time series exhibit fluctuant and cyclical ground movement by means of a millimetric accuracy and daily values that generally follow a linear velocity trend. The time series of the vertical component of PS data around each GNSS station do not show any cyclical short-term oscillations (Figure 5) but confirm the general trend of deformation, which is comparable with the outcomes of two recent studies [51,52] about the geodynamics of the Italian peninsula.
The absolute values of the vertical ground displacement of the FPP basin were assessed for both the ENVISAT and Sentinel-1 SAR data.
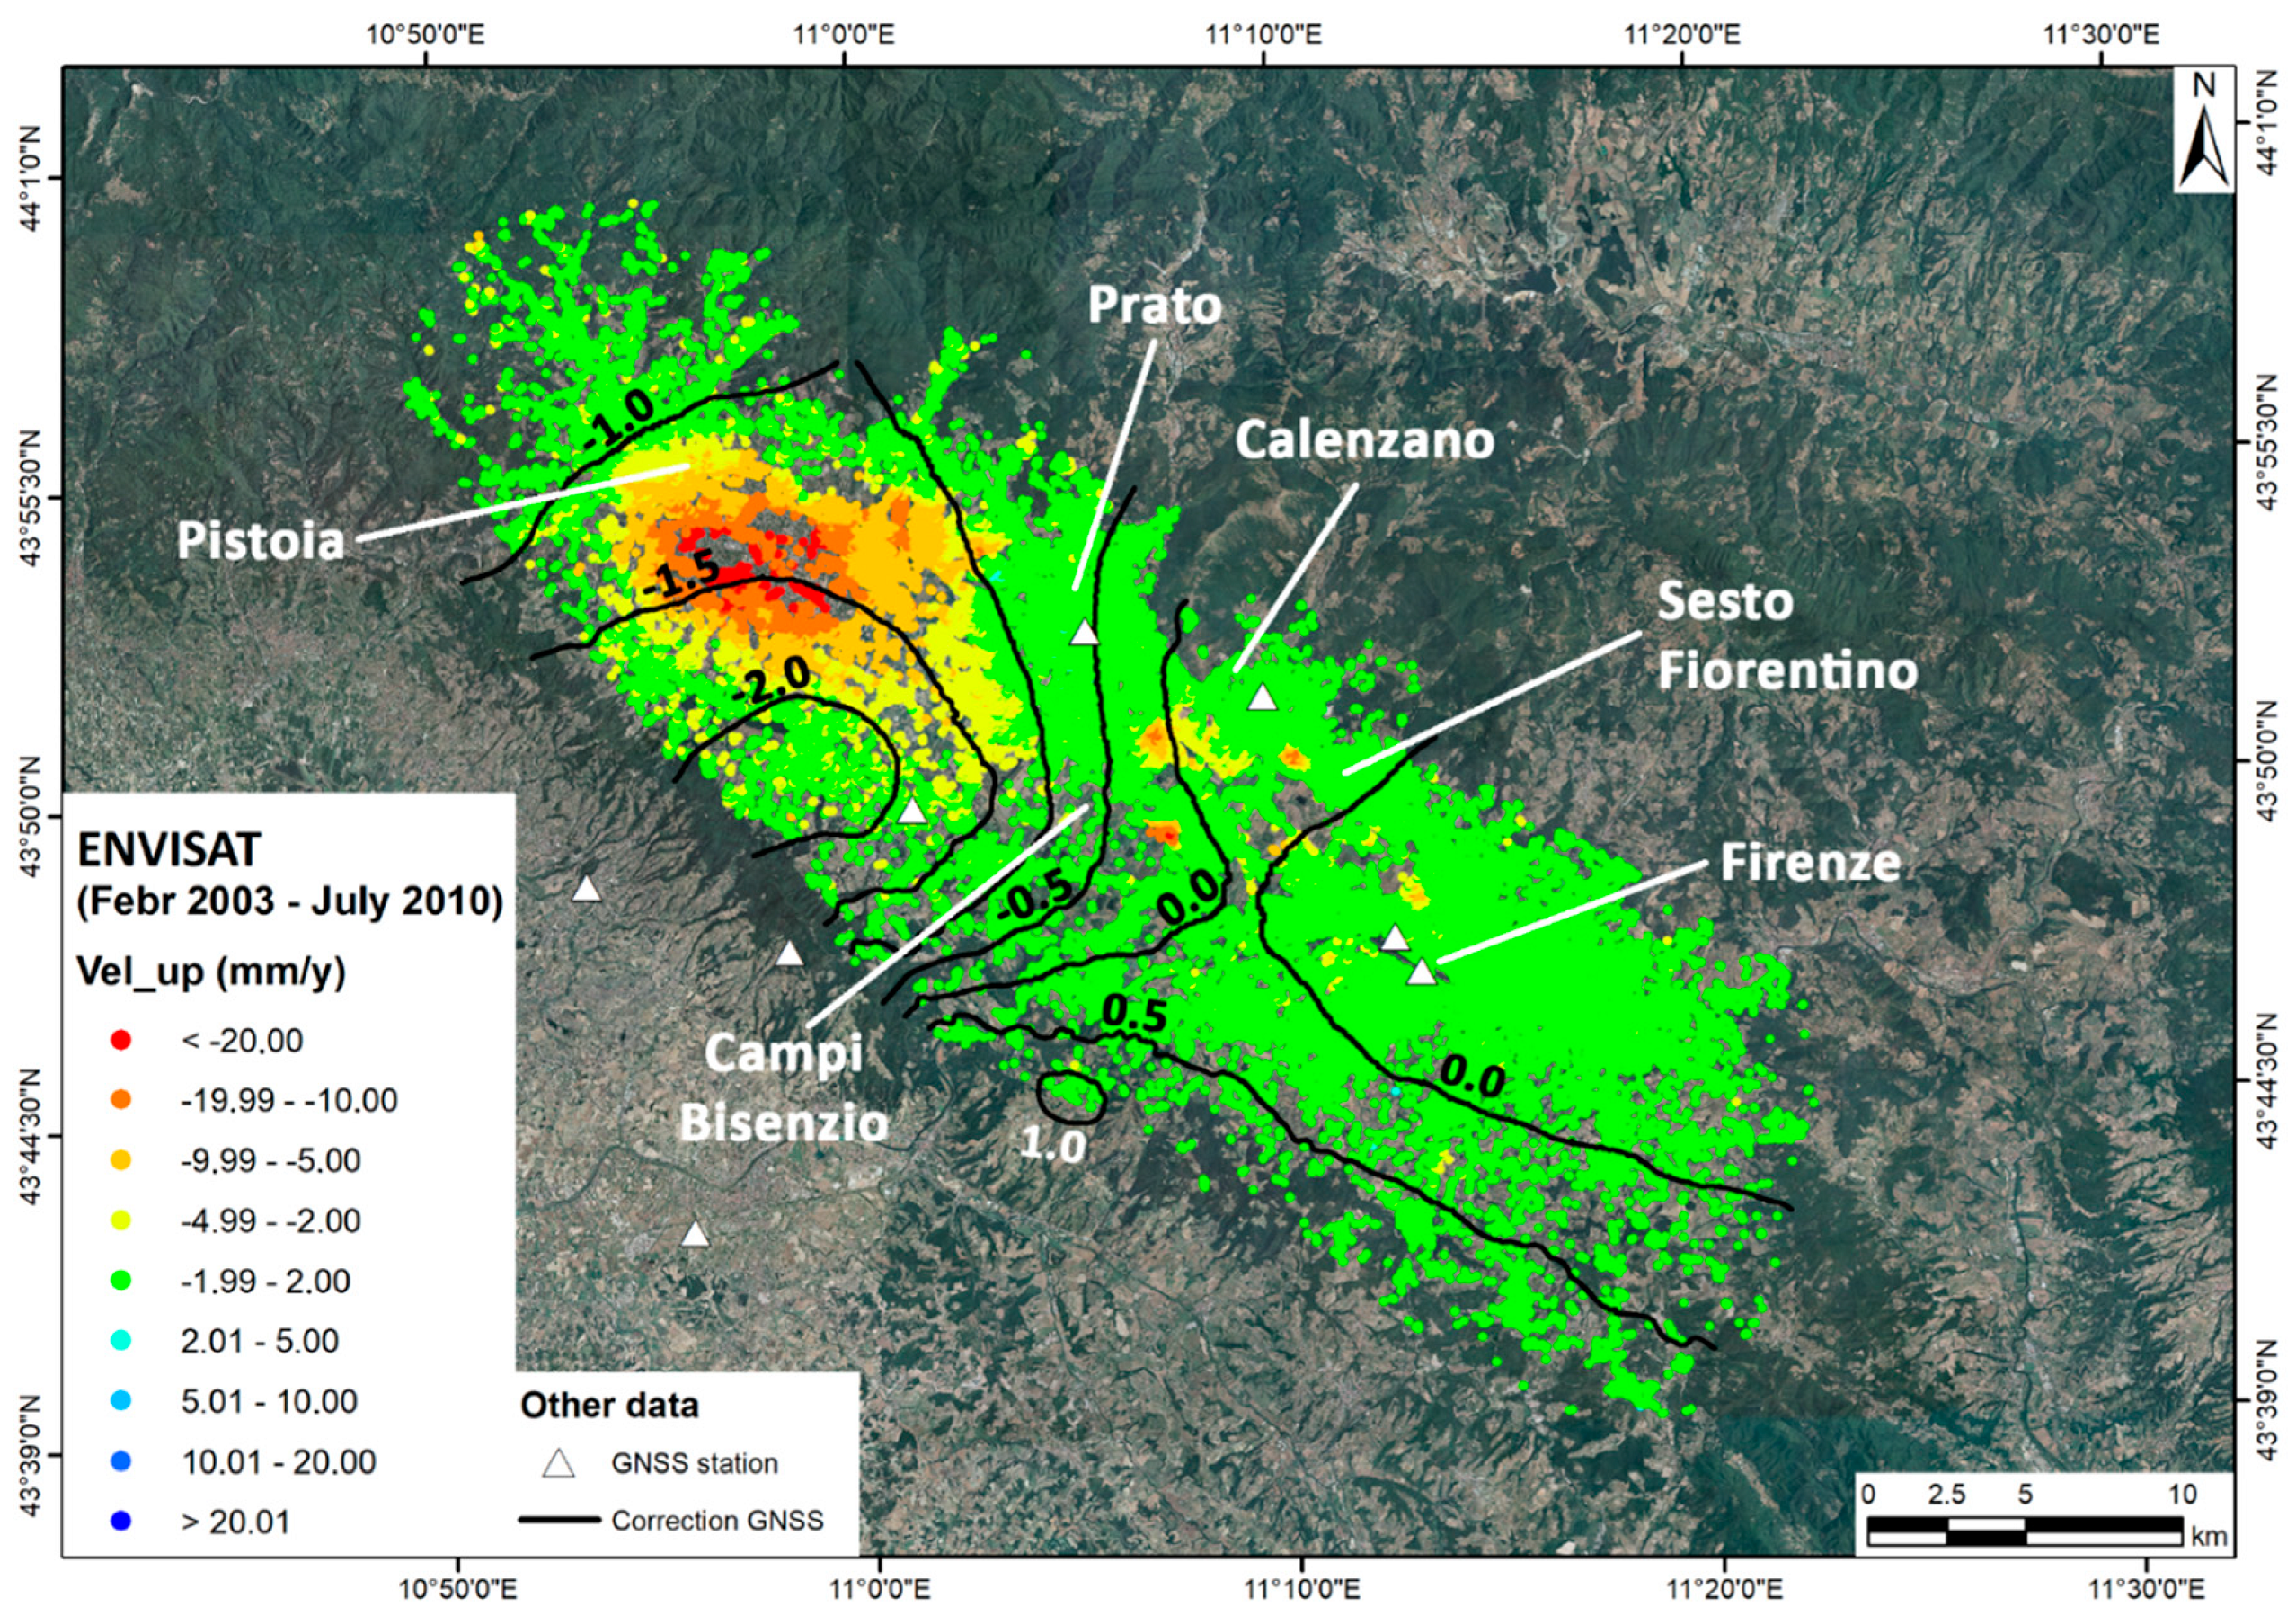
The differences in the vertical displacements detected by the ENVISAT satellites before and after the GNSS correction range between +1 mm/year in the southwest boundary of the AoI and −2 mm/year close to the central part of the AoI (Figure 6). The southeastern portion of the plain has a good correlation with the geodetic data, and the correction is close to zero, whereas the correlation is higher in the southwestern sector of the AoI with values of approximately −2 mm/year. The corrected vertical velocities show relevant ground subsidence in the southern area of Pistoia Province, with values higher than −20 mm/year. The involved area is approximatively 80 km2 wide and has a NW–SE elongated shape. In addition, some localized subsidence areas can be identified close to Campi Bisenzio town, with a peak of −20 mm/year of subsidence, and at two zones in the southern portion of Prato city and in the industrial area between Calenzano and Sesto Fiorentino towns, with displacement velocities of approximately −13 mm/year and −10 mm/year, respectively. Except for these two localized cases, the Firenze Province results in being stable and without evident vertical ground deformations from 2003 to 2010.
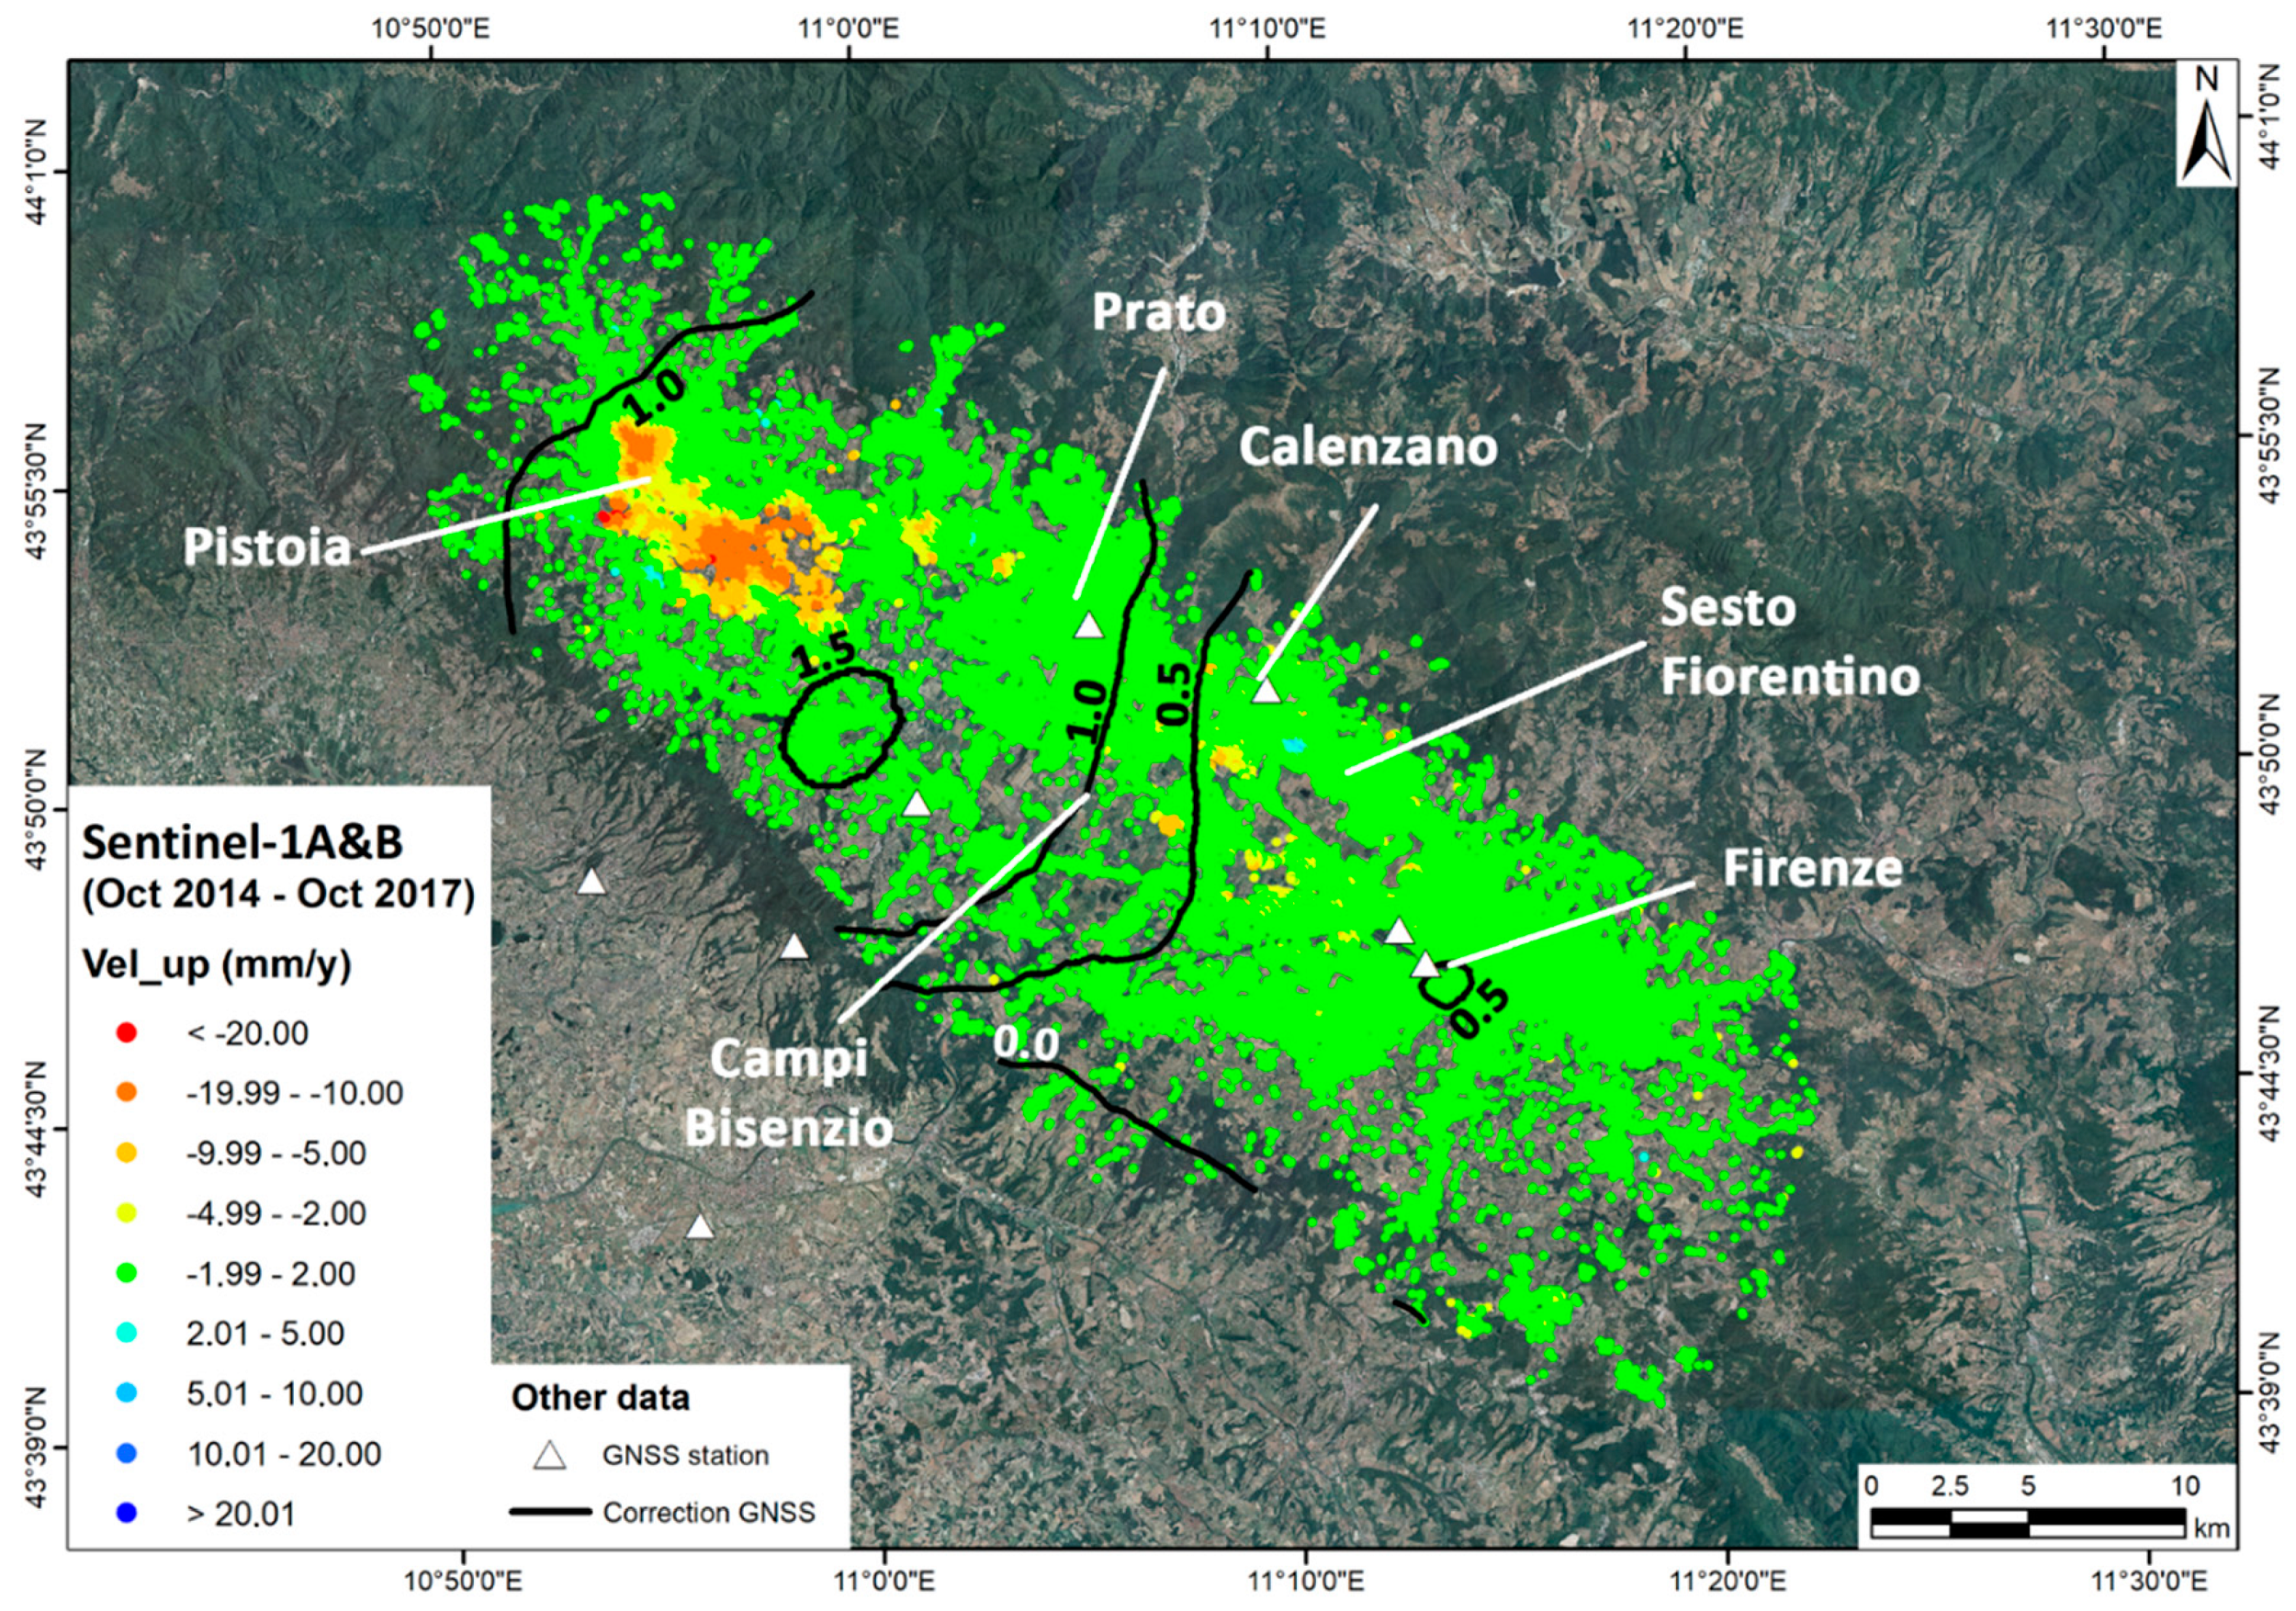
The differences between the Sentinel data before and after the GNSS correction are lower than those for the ENVISAT data, ranging from less than 0.5 mm/year in the southeastern end of the AoI, i.e., Firenze Province, to approximately 1.0 mm/year in Pistoia Province, with a peak of 1.5 mm/year close to Prato Province (Figure 7). The period monitored by the Sentinel-1 constellation shows a general reduction in the ground movements in the AoI. The two areas with higher ground deformations (Pistoia and Campi Bisenzio) in the period monitored with the ENVISAT satellites show different vertical displacements from 2014 to 2017. In the Pistoia Province, a smaller subsiding area is recognizable in the south end of the city, and the elongated shape extending in the SE direction disappeared, i.e., the area subsided over time by approximatively 50 km2. On the other hand, two new subsidence areas are recognizable with respect to the previous dataset: (i) the historical centre of Pistoia, characterized by a ground subsidence of ca. 13 mm/year and (ii) the SSW part of Pistoia, a recently urbanized territory where the ground subsidence is higher than 20 mm/year. Moreover, a small region of uplift, with values of approximately 5 mm/year, is recognizable in the northwest part of the AoI between the cities of Prato and Firenze.
The area of Campi Bisenzio town and the region between Campi Bisenzio and Calenzano towns show values of approximately −5.8 mm/year and −3.5 mm/year, respectively, which is lower than the previous deformation map made from the ENVISAT data. The area of Sesto Fiorentino exhibits an uplift with values of approximately 4 mm/year, contrary to the subsidence recorded in the same area during the period of 2003–2010 by the ENVISAT constellation.
The stability of the southern portion of the AoI (Firenze Province) is confirmed since areas with significant uplift or subsidence were not detected; these results for Firenze are in agreement with the previous deformation map covered by the ENVISAT data.
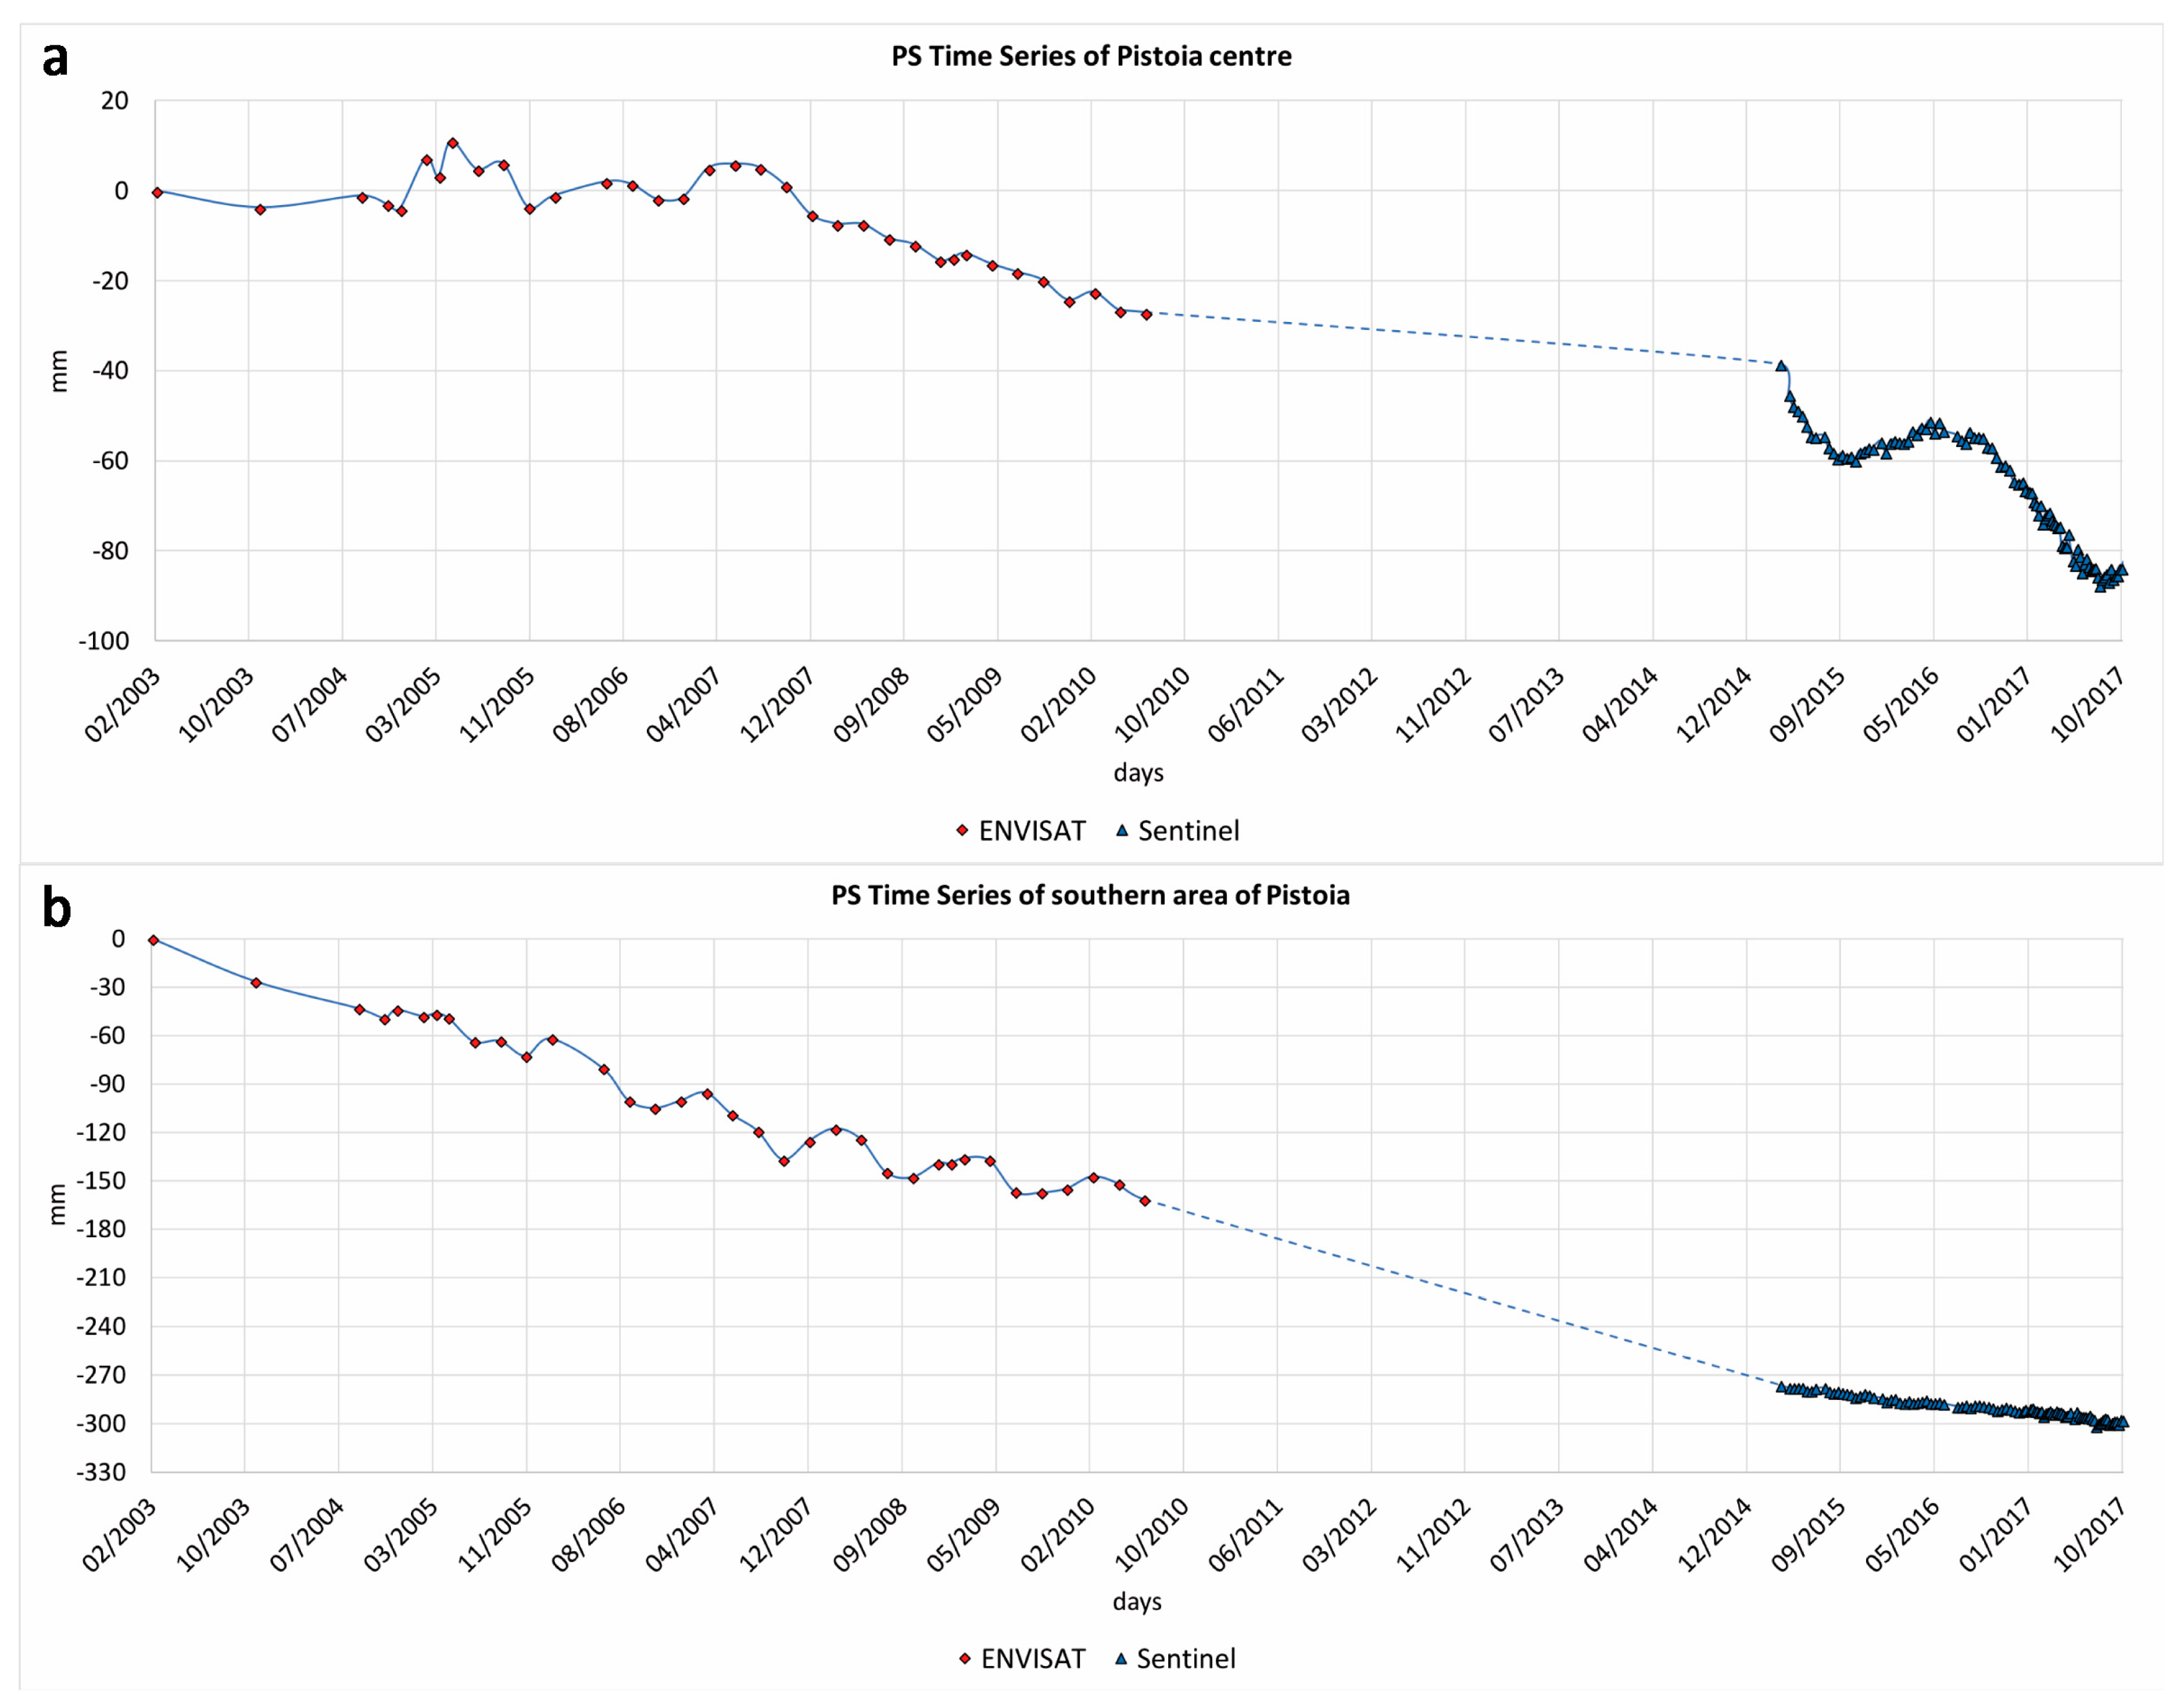
Two time series for the main subsiding area (Pistoia area), the first time series in the Pistoia centre and the second time series in the southern part of the town, were realized combining the ENVISAT (2003–2010) and the Sentinel-1 (2014–2017) information in order to visualize the entire subsidence evolution of the two areas. To stich the two time series, the value of the cumulative displacement of the first acquisition of Sentinel-1 was predicted on the basis of the ENVISAT data assuming a linear trend of deformation.
The cumulative time series shows different evolutions for the two sites (Figure 8a), as already recognized by the visual comparison of the deformation maps from ENVISAT and Sentinel-1. The historic centre of Pistoia shows a stable trend, even if partially affected by signal noise, until December 2007 in the period monitored by the ENVISAT constellation, while, successively until July 2010, the area slowly subsided. An important increase in the subsidence rate was recorded starting at the end of 2014 by the Sentinel-1 sensors.
The southern area of Pistoia Province shows, instead, an opposite behaviour. In the period monitored by the ENVISAT constellation, an important and constant trend of subsidence is recognizable, while the displacement recorded by the Sentinel-1 satellites show a lower rate of subsidence, with a relatively stable trend in the last period of 2017 (Figure 8b).
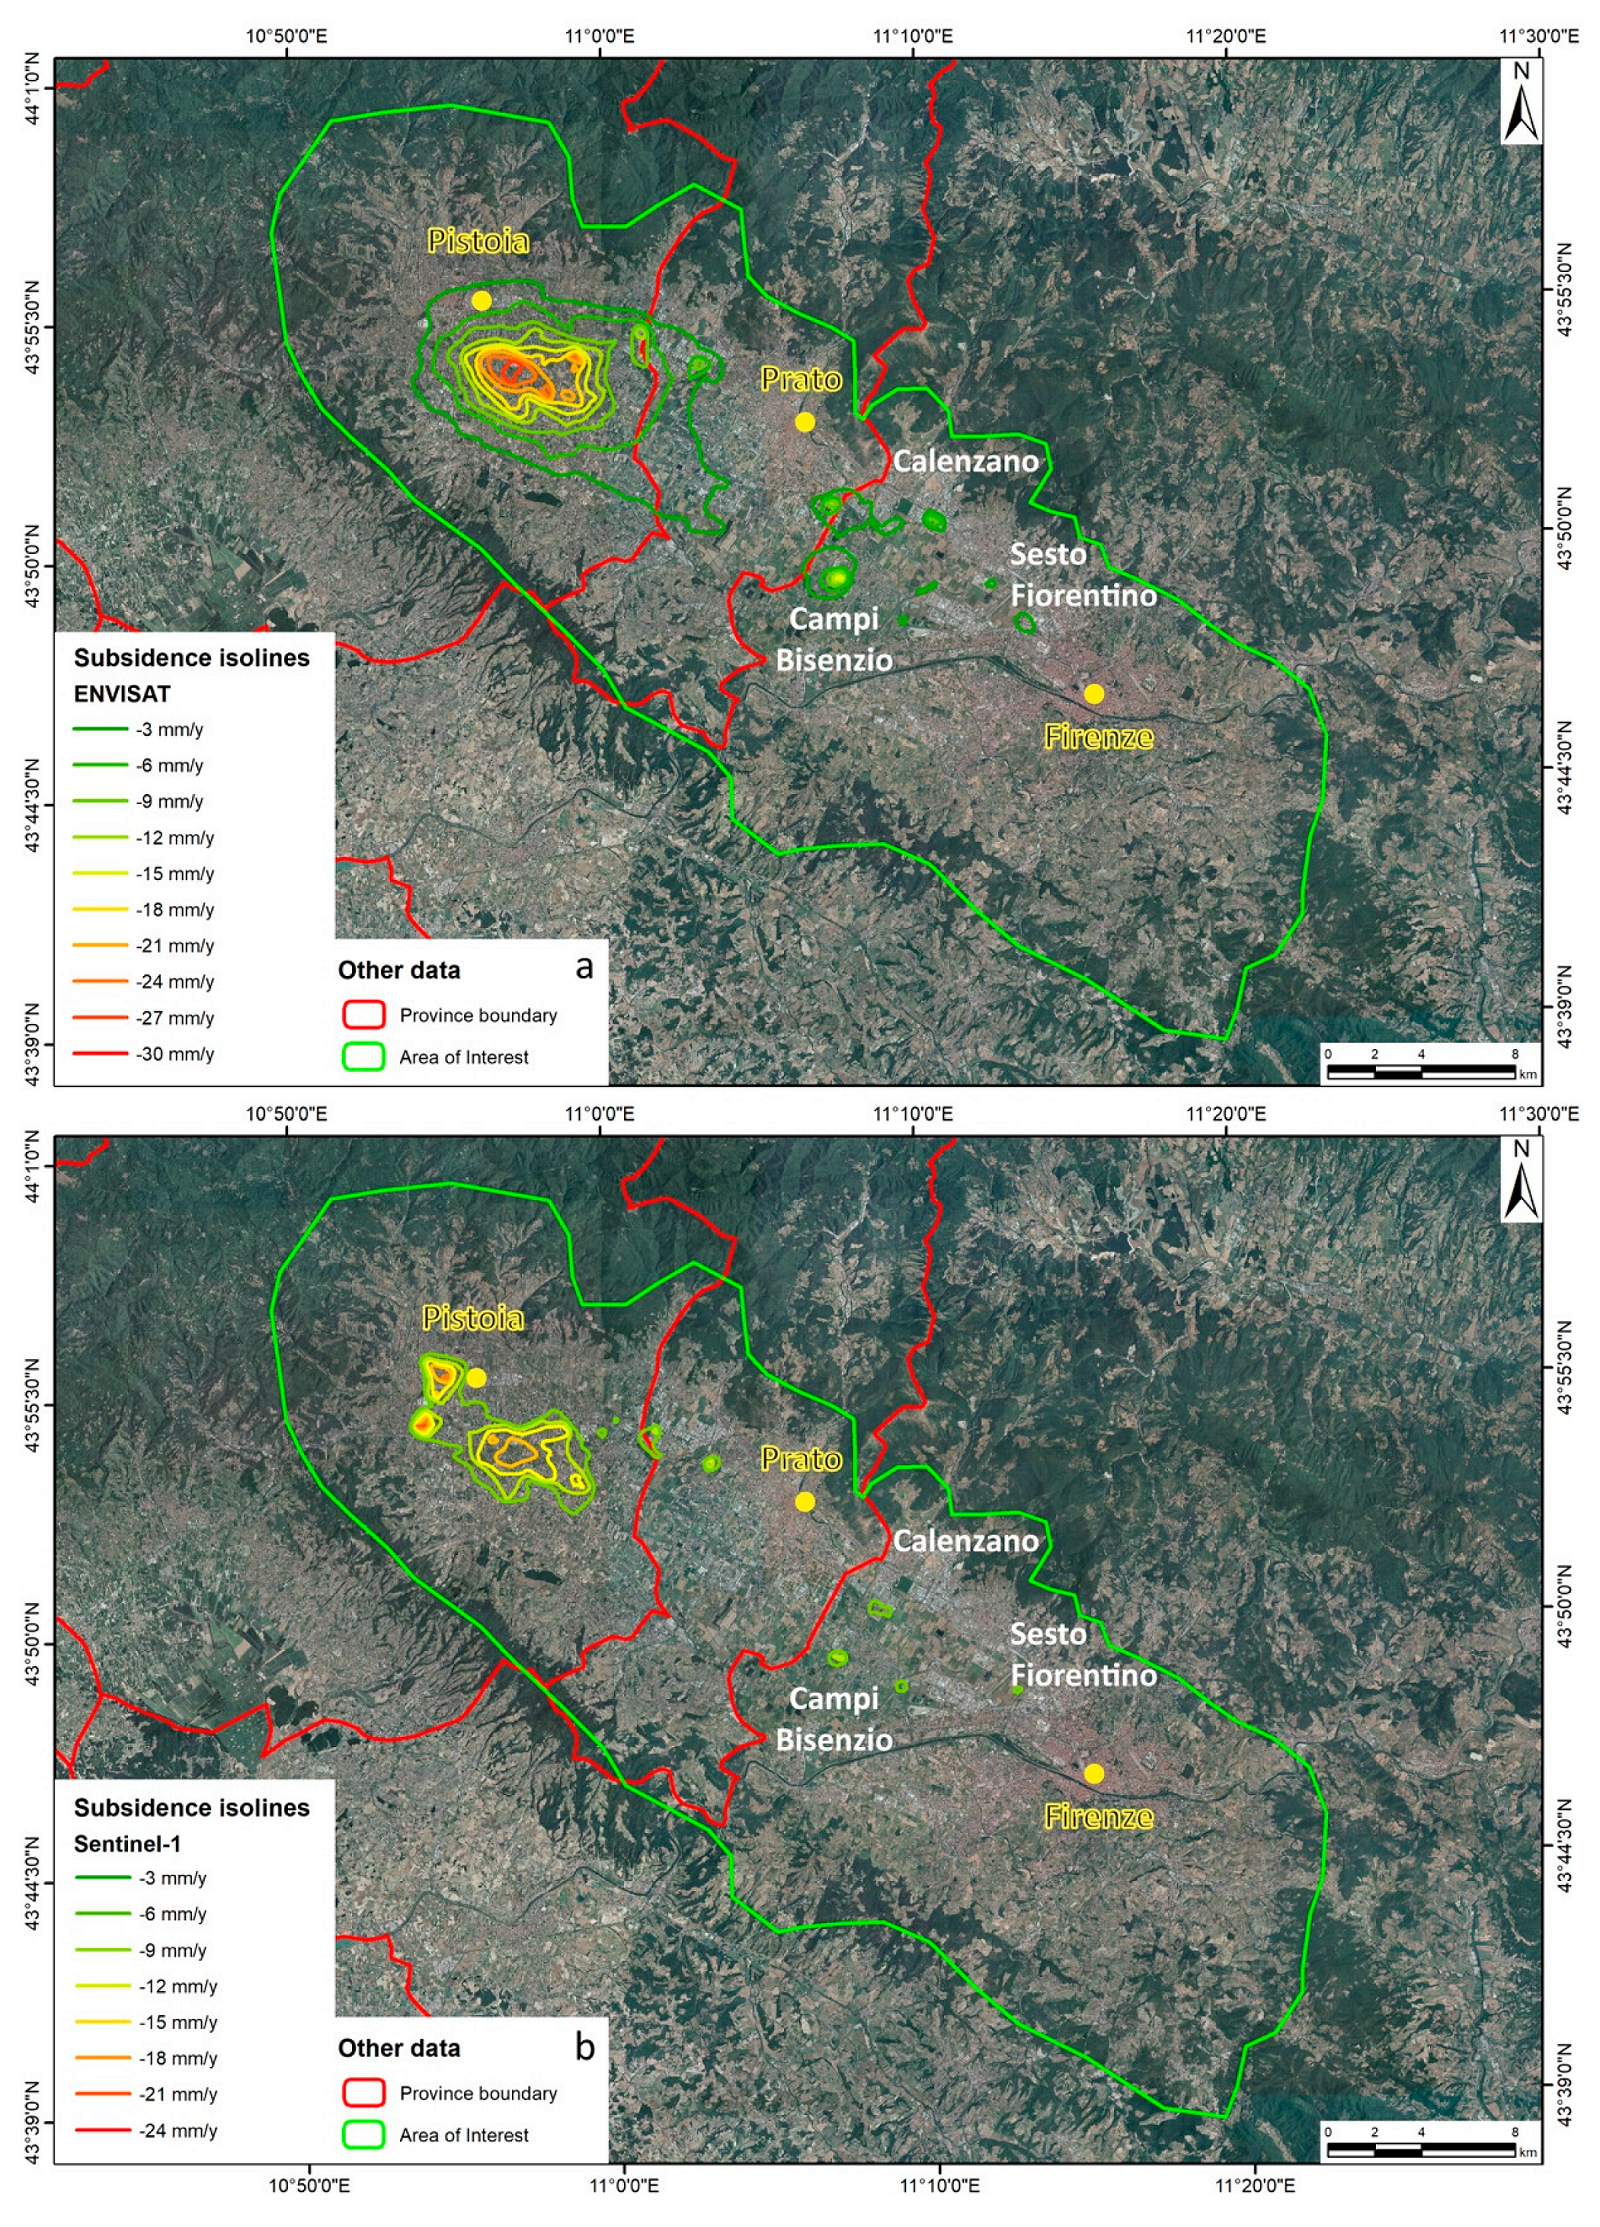
A successive step was the creation of a contour map of the areas affected by the subsidence in the periods 2003–2010 and 2014–2017 in order to analyse the evolution of the subsidence bowls. According to the ground deformation maps made by the vertical velocity corrected by the GNSS data and the approach described by Crisci et al. [33] to identify areas affected by vertical displacement, the available PS data were interpolated by means of the inverse IDW method [49]. The result is a raster map from which it is possible to extract displacement isolines for both the ENVISAT (Figure 9a) and Sentinel-1 data (Figure 9b).
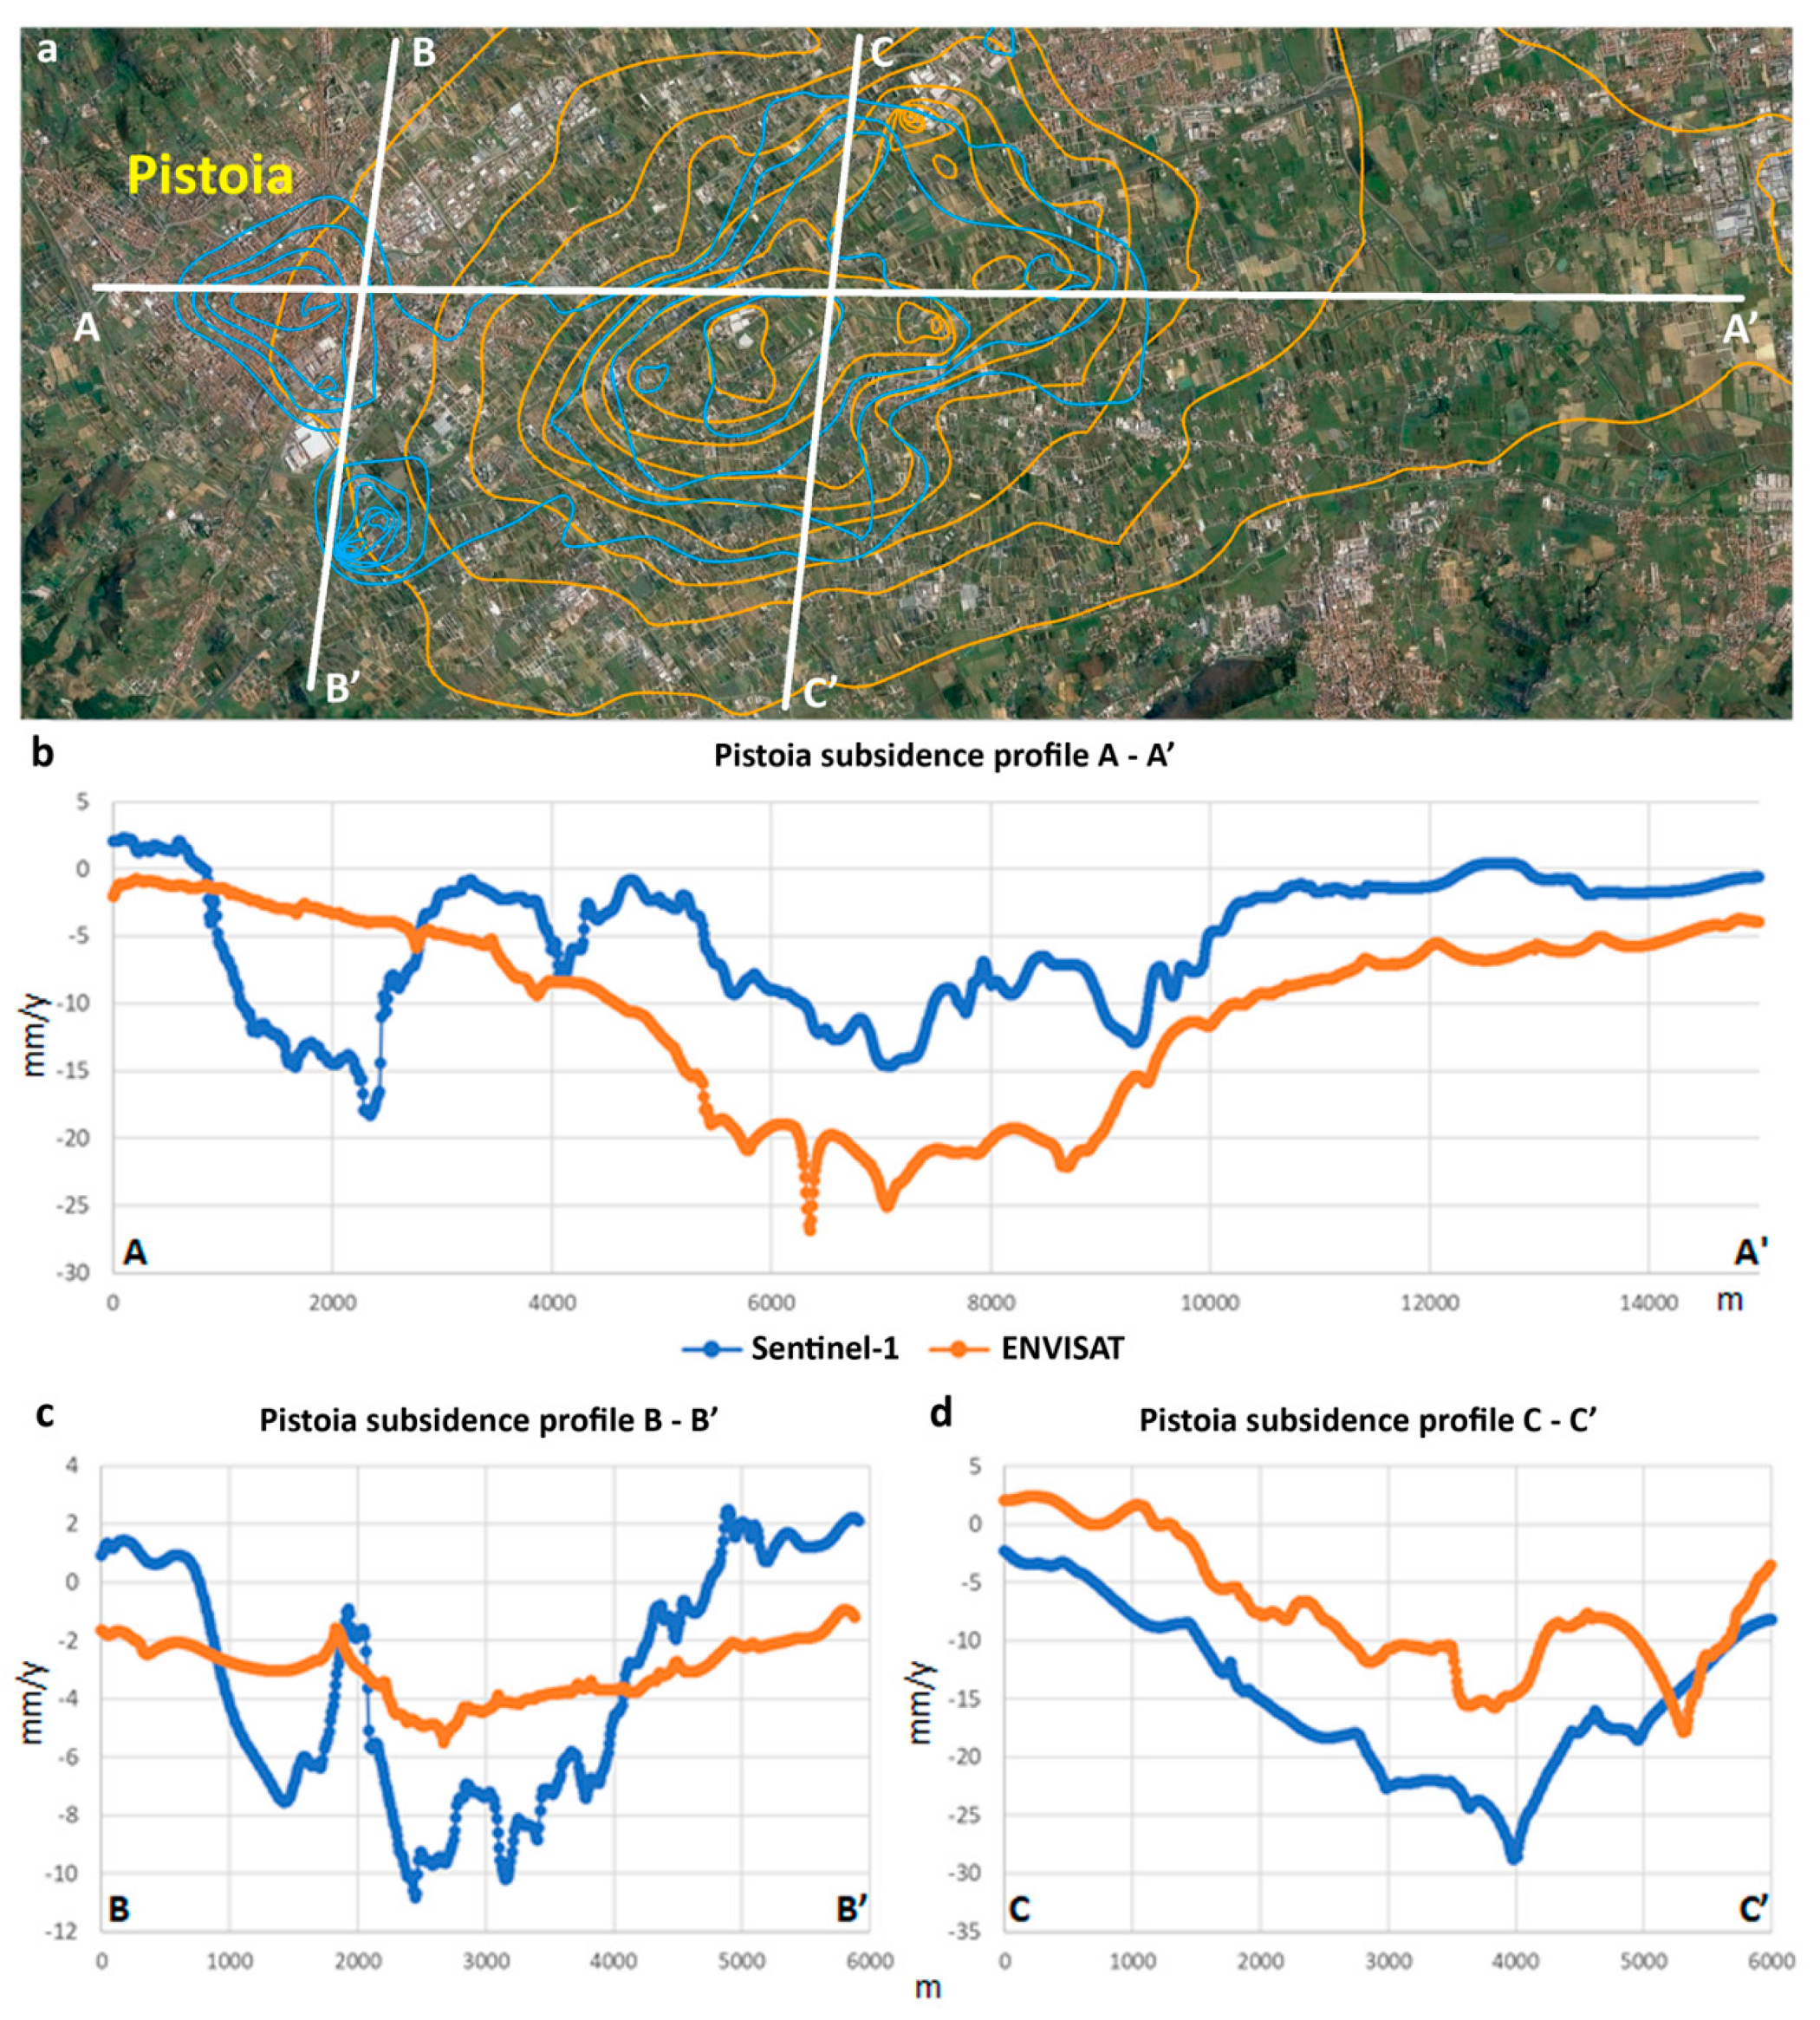
To better highlight the spatial subsidence evolution, three sections, one longitudinal (NW-SE) and two transversals (NE-SW), were traced for both Pistoia (Figure 10a) and Prato (Figure 11a) cities.
The comparison of the profiles extracted for the ENVISAT (orange lines) and the Sentinel-1 (blue lines) confirm the interpretations made by the ground deformations and by the time series. In profile A-A’ (Figure 10b), it is evident that the southern area of Pistoia is affected by the ground subsidence, mainly in the period 2003–2010, while the centre of Pistoia (2000 m in the x-axis of Figure 10b) in the period 2014–2017 was affected by an important subsidence event that was not detected before. The same phenomenon is identifiable on the left side (corresponding to the northwestern part of Pistoia) of transversal section B-B’ (Figure 10c), while the right side adequately represents the subsidence affecting the recently built district. The third profile C-C’ (Figure 10d) shows that the evolution of the subsidence in the southern area close to Pistoia is still substantial.
The same analysis was conducted for Prato city (Figure 11a).
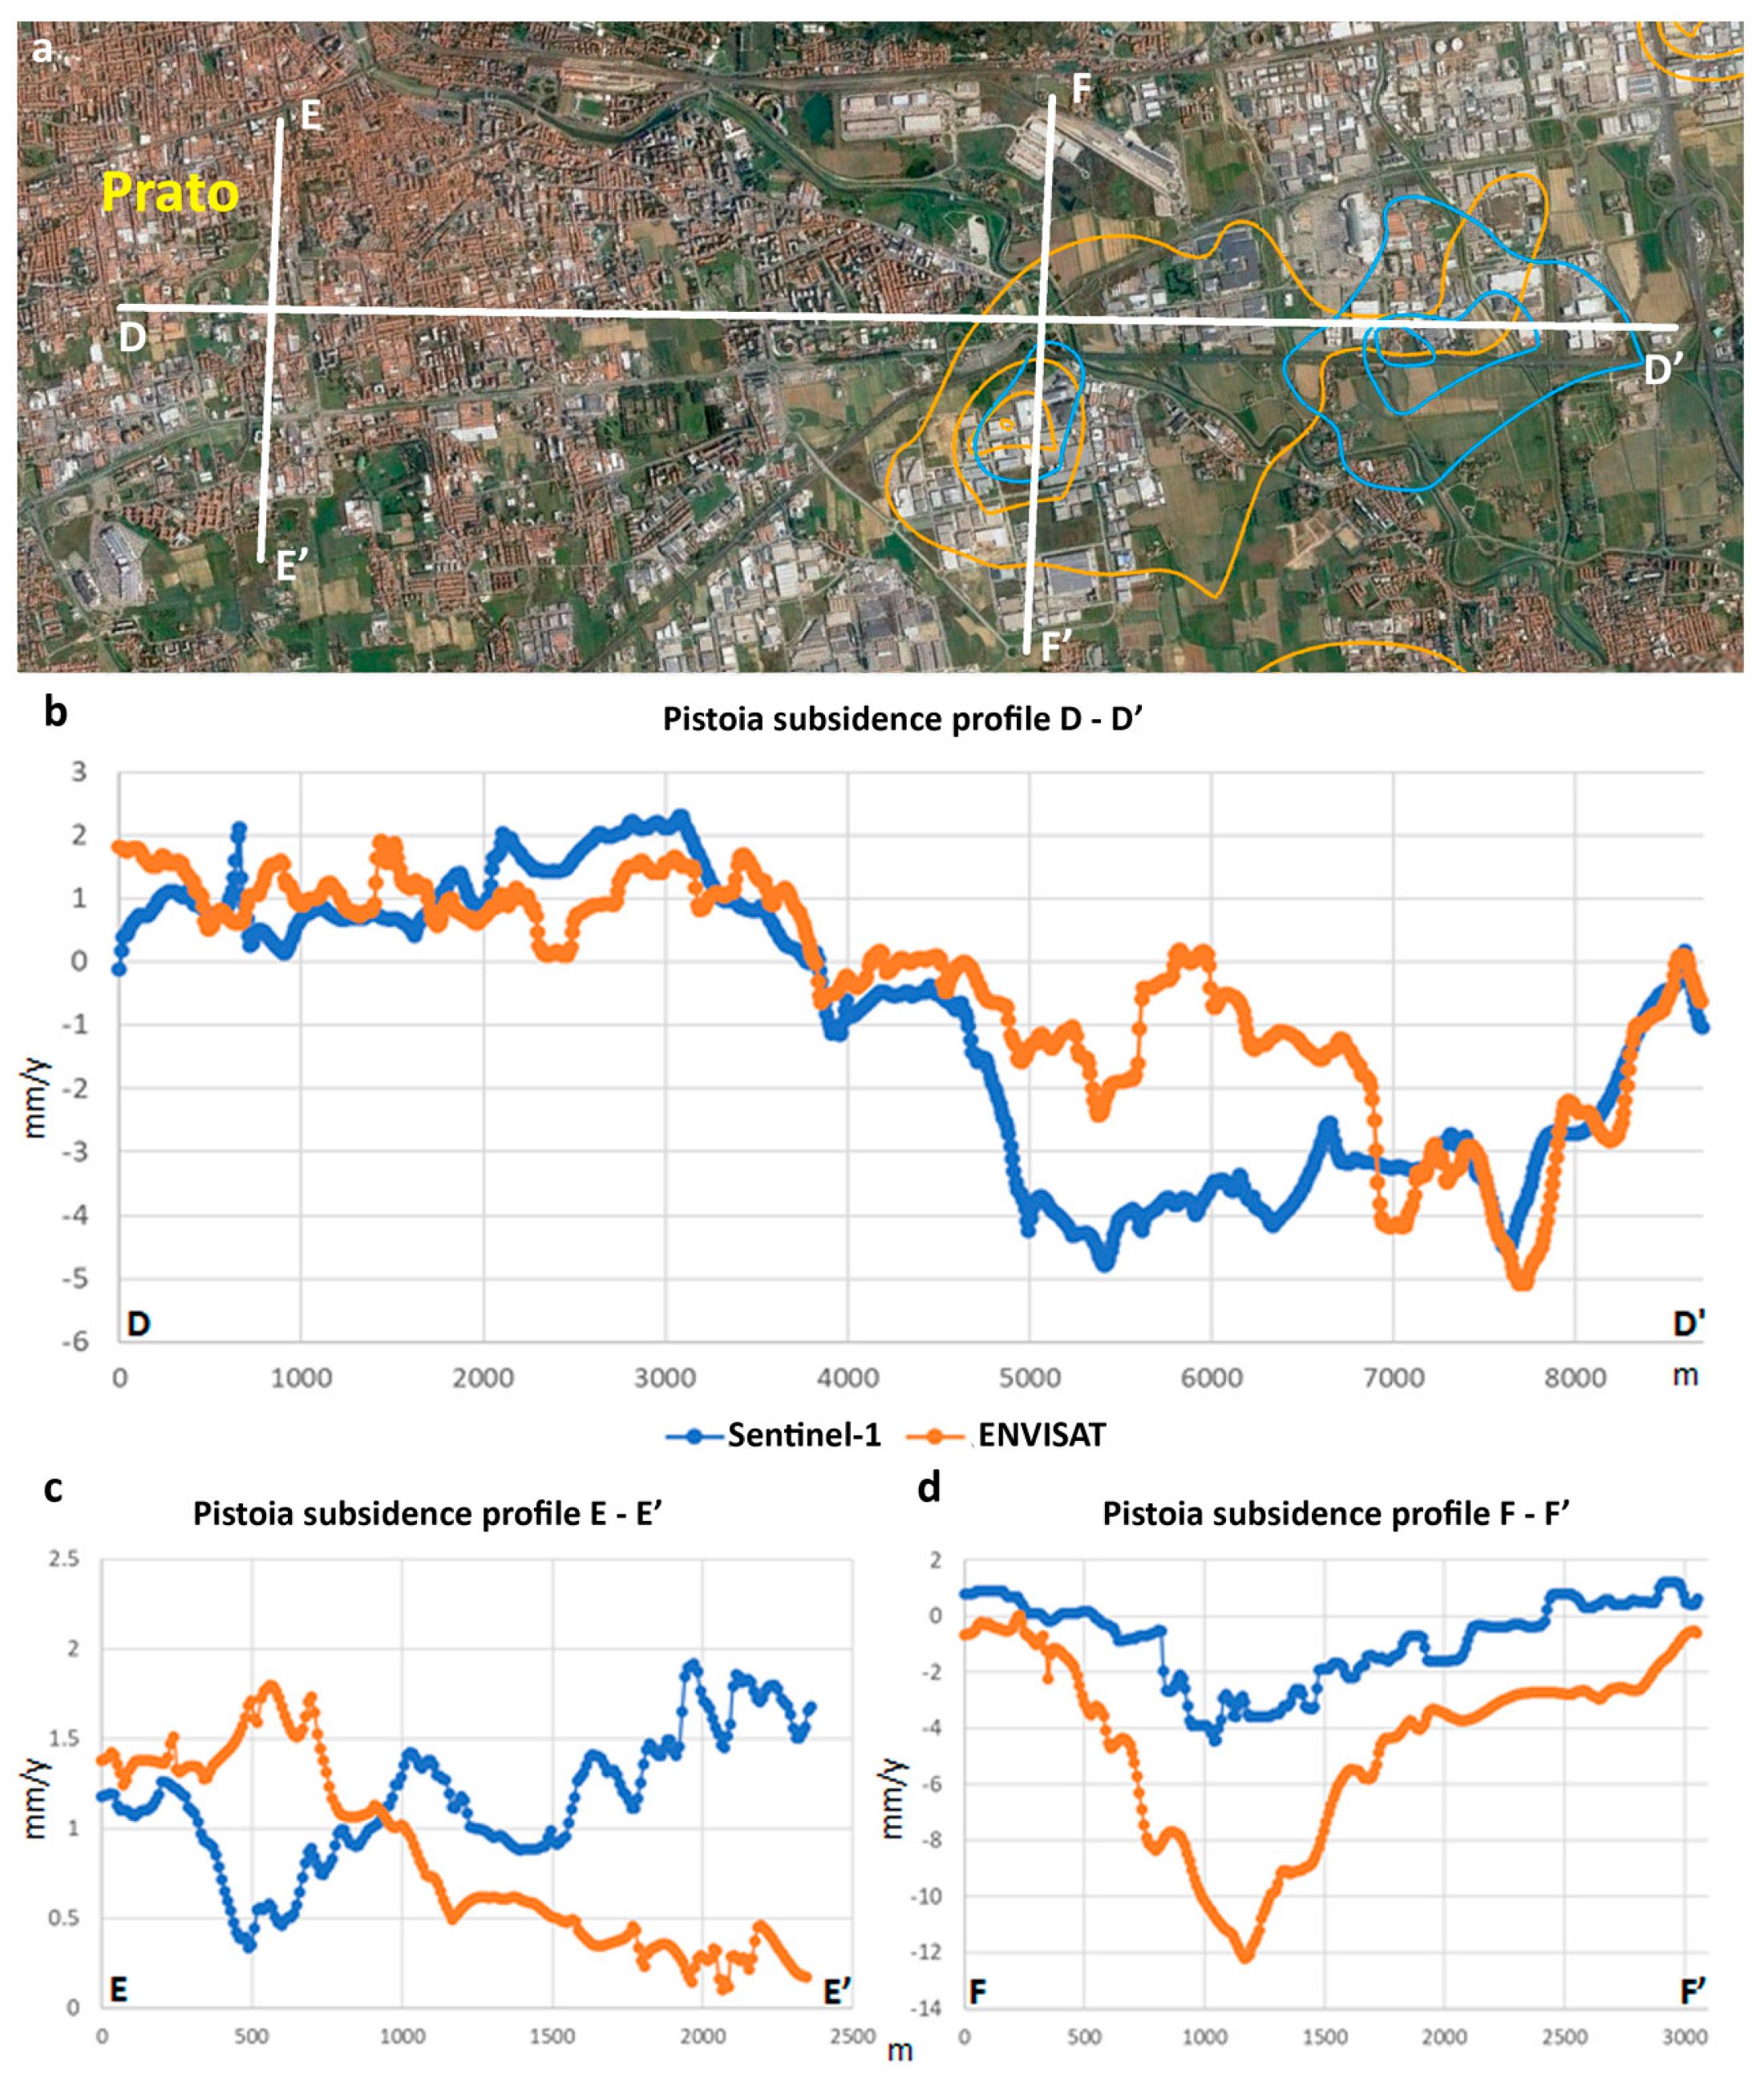
Profile D-D’ (Figure 11b) shows that the subsidence affecting the southeastern region of Prato increased in the recent period monitored by the Sentinel-1 constellation (blue line) with respect to the previous period monitored by the ENVISAT satellite (orange line). An apparent inversion of the displacement trend is shown in profile E-E’ (Figure 11c), but the velocity values are within one standard deviation of the data (±2.0 mm/year), which is considered the stability range. Profile F-F’ (Figure 11d) confirms the detected reduction in the involved area affected by ground subsidence. The same decrease in the subsidence during the recent period of 2014–2017 was also recorded by the deformation maps and highlighted by the contours of the subsidence areas during 2003–2010 in the south of Prato, the industrial district between Sesto Fiorentino and Calenzano towns.
6. Discussion
The analysis and monitoring of the subsidence phenomena affecting the Firenze–Prato–Pistoia plain is important to control the evolution of this natural hazard to avoid the occurrences of issues for buildings and infrastructure. In this work, ancillary, geodetic and SAR data, i.e., ENVISAT (2003–2010) and Sentinel-1 (2014–2017) were combined and compared to monitor the evolution of the subsidence in the AoI from 2003 to 2017.
The PS data velocities are relative measurements reported to reference points assumed stable according to geological and signal analysis. To have absolute values of the velocity displacement, the PS data for both the ENVISAT and Sentinel-1 constellations were projected into vertical and horizontal components, i.e., east–west and zenith–nadir, and then the vertical component was corrected by the GNSS network to estimate the subsidence rate in the AoI, which is historically known for subsidence phenomena.
This approach allowed the identification of different areas affected by subsidence during both monitored periods: 2003–2010 with ENVISAT and 2014–2017 by Sentinel-1 satellites. The comparison of these data was used to investigate the evolution of the subsidence in the AoI according to the vertical absolute displacement and to trace the limits of the subsiding areas for both investigated periods.
Pistoia town and the surrounding area of Prato city show the most relevant ground deformation evolutions, while the Florence Province results are stable in both datasets, except for in three localized zones.
During the period monitored by the ENVISAT satellite, an important subsidence event affecting the southern region of Pistoia Province was identified, with an elongated shape in the SE direction (Figure 9a). In addition, three subsiding areas were identified, i.e., Campi Bisenzio town, the region between Campi Bisenzio and Calenzano towns, and Sesto Fiorentino city. During the period monitored by the Sentinel-1 satellites, the area of Pistoia town affected by the lowering of the ground had lower subsidence rates than before, but two subsidence bowls were identified for the first time: one in the historical city centre and the second in a recently built-up area to the northwest with strategic infrastructure, i.e., the hospital (Figure 8b). Furthermore, some localized subsidence events were identified in the Eastern Pistoia Province, even if with lower values and smaller extensions.
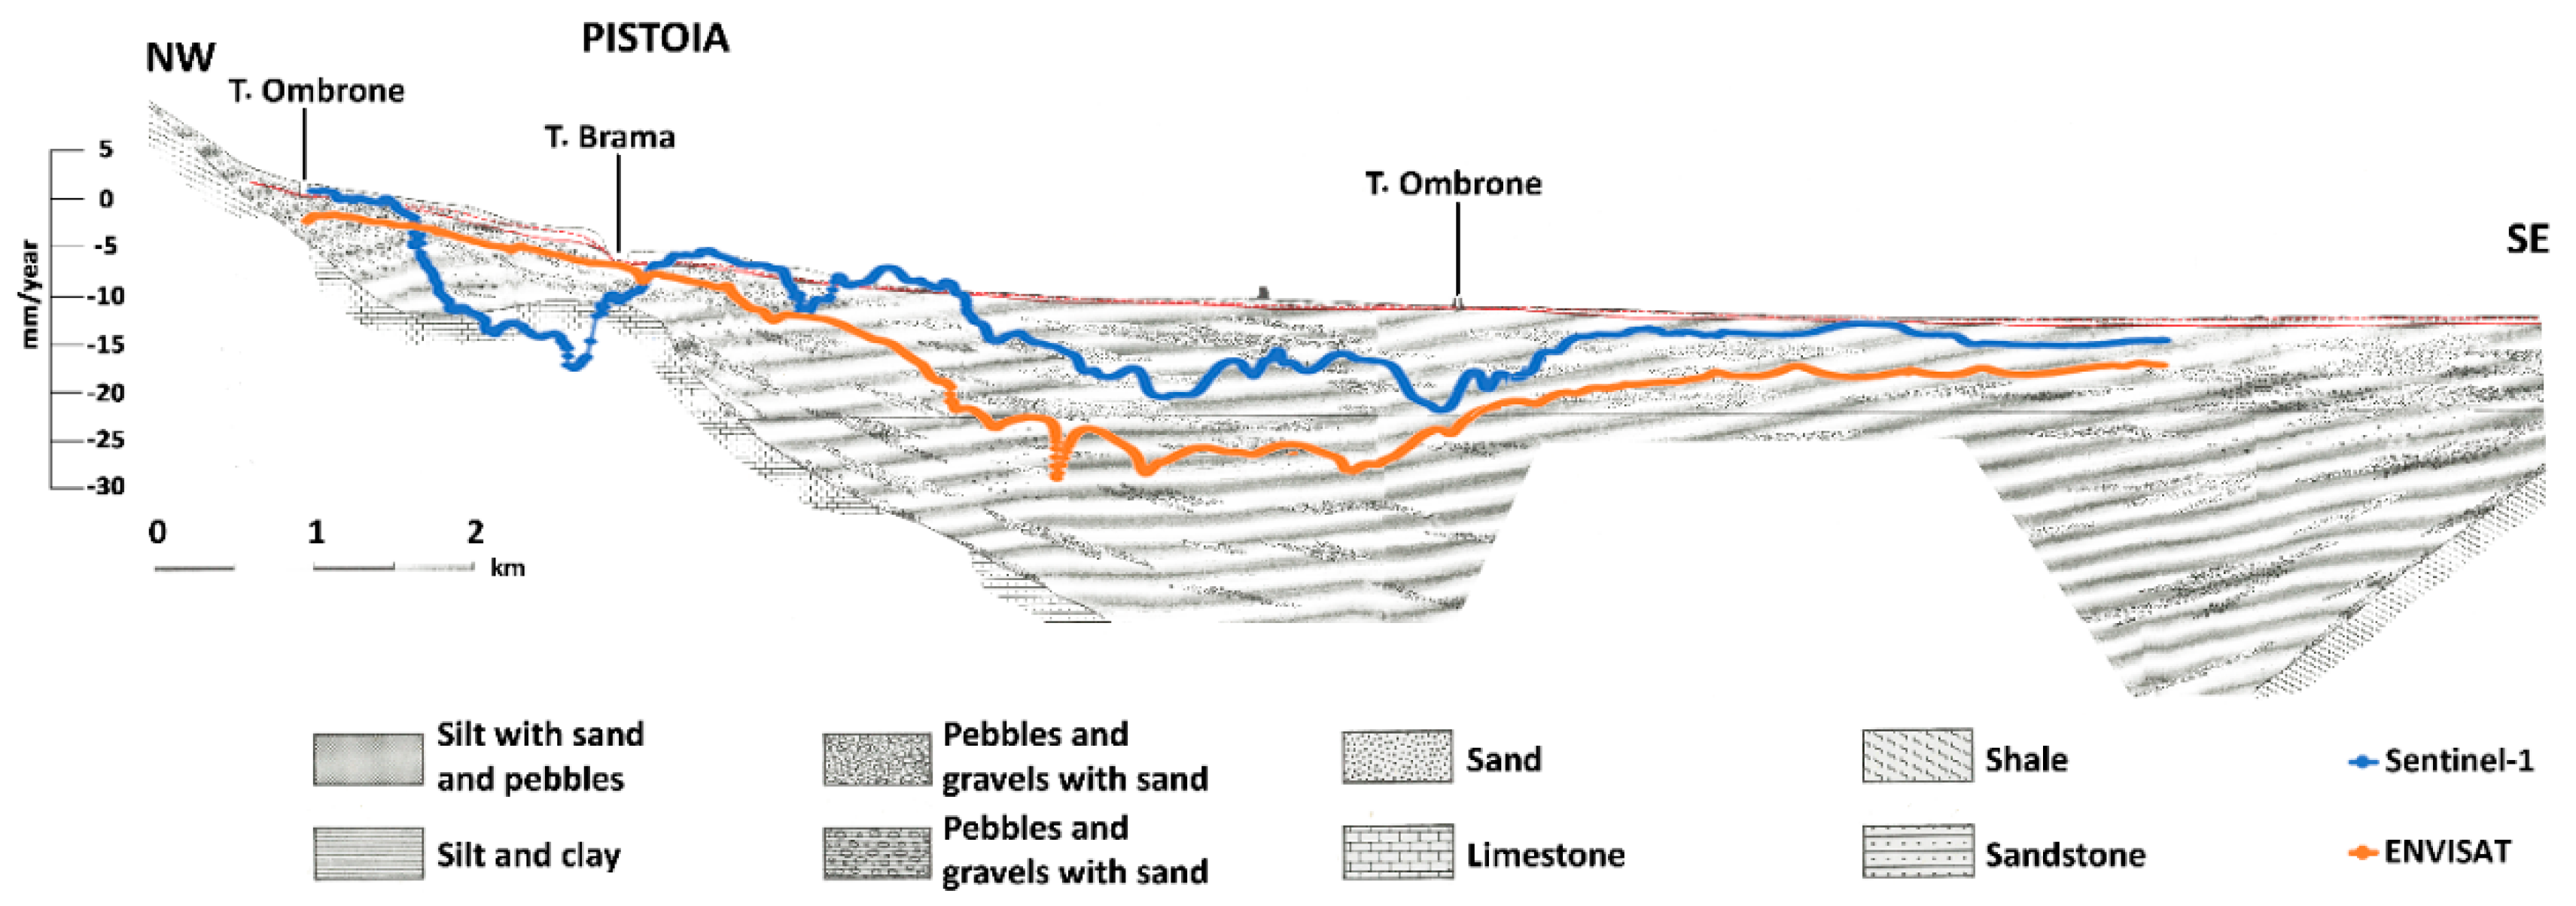
A comparison between the subsidence profile (Figure 10b) and a geological cross section (Figure 12) [24], traced close section A-A’, allowed the proposal of a theory about the subsidence causes and evolution. The main subsidence area is located ca. in the central part of the sedimentary valley (between Brama stream to the NW and Ombrone River to the SE in Figure 12), where very thick sediments occur. It is also possible to notice that, between 2003 and 2010, the subsidence gradually decreased from SE to NW in the same direction that the sediment thickness decreased. From 2014, however, it is possible to notice a subsiding area in the historical centre of Pistoia with velocities up to ca. 20 mm/year; in the cross section in Figure 12, this subsiding area is located between the Ombrone River to the NW and Brama stream to the SE, where the sediment layers are thinner.
Furthermore, it is possible to highlight the presence of a sort of step corresponding to Brama stream that separates the main valley to the SE and a secondary valley to the NW. Figure 10b shows that the subsidence in the SE part of Pistoia has recently decreased, probably because of the diffusion of several industries in this area.
At the beginning of the 21st century, several greenhouses and nurseries were opened, causing substantial subsidence because of the overexploitation of groundwater. The high request of this resource from these companies could have caused a rapid reduction in the groundwater level, with the relevant consequence of ground subsidence, which was probably due to the compaction of the soft layers in the sedimentary deposits. Furthermore, the initial widening of the cone of depression around the exploitation area could lead to a progressive expansion of the area affected by sediment compaction, which can explain the linearly decreasing subsidence rate from the SE (where well fields are located) towards the NW. In the following years (2014–2017), the area was influenced by the decreasing subsidence, probably due to the stabilization of the ground water level and the consequent reduction in the compaction rate of the soft layers of sediment.
The cause of the recent evolution of subsidence in the historical centre of Pistoia could be ascribed to the ongoing widening of the depression cone around the groundwater exploitation area in the SE part of Pistoia. This widening could be caused by the reduction in water pressure in the alluvial/lacustrine deposits of the NW basin, with a consequent compaction and settlement of the soft layers.
The zone characterized by a lower rate of subsidence between the two main subsiding areas corresponds to the step under the Brama stream. Here, the thickness of the deposits is lower than that in the other two valleys, while their granulometry is generally higher; this could lead to a lower compaction of the sediments and subsequently to a lower subsidence rate. It is obvious that this is only a theoretical scenario, since direct groundwater level measurements or characterizations of the deposits are not available.
The area surrounding Prato shows a reduction in the subsidence due to the continuous decrease in the textile industries in this area. Several companies were moved to other countries to reduce the manpower costs; this means lower groundwater exploitation and, therefore, a rise in the groundwater level.
7. Conclusions
The evolution of ground deformation in the Firenze–Prato–Pistoia basin, historically known for subsidence phenomena, was investigated for the periods 2003–2010 and 2014–2017. The analysis was conducted by means of a combined use of ENVISAT and Sentinel-1 satellite data and GNSS data to investigate the absolute velocity values of displacements affecting the AoI. In the period monitored with the ENVISAT satellite, an area close to Pistoia of approximately 80 km2 that was affected by subsidence was identified, with velocities higher than 20 mm/year. In addition, three more subsiding areas in Prato, Campi Bisenzio and in the territory between Calenzano and Sesto Fiorentino were identified and mapped. The Sentinel-1 data showed that the subsiding area close to Pistoia is reducing, from 80 km2 to ca. 50 km2, but with similar subsidence rates. The work allowed for highlighting a general reduction of both subsidence rates and extension in the whole plain, but two new areas affected by ground deformation after 2014 were identified in the NW part of the plain: (i) the historical centre of Pistoia and (ii) the recently urbanized area in the SSW end of Pistoia. In the same period, the other areas showed a lower subsidence rate or uplift than that in the Sesto Fiorentino area. As a result of the investigation of the ground deformation over the whole plain, the isolines of the subsidence rates for both monitoring periods were created. The investigation of the differences between the ENVISAT and Sentinel-1 data allowed the evaluation of the evolution of the deformation in the AoI; for this purpose, several sections in the main subsiding areas were traced to analyse the subsidence profiles. These sections were later compared with a geological section to define a plausible hypothesis about the causes and the geological mechanism of the subsidence of Pistoia.
Author Contributions
Intellectual content for the conception and design, acquisition of data and analysis were contributed by M.D.S., F.R. and N.C. M.D.S., F.R., and A.R. provided the geological settings and geodynamic analysis. G.F. developed the method to integrate GNSS with SAR data and performed the geodetic processing. Drafting the article and critically revising it for important intellectual content came from the contributions of all the authors.
Funding
This research received no external funding.
Acknowledgments
This research was supported by the University of Florence, Department of Earth Sciences. We thank the colleagues who run and maintain the various regional and global networks (EPN, ASI, INGV, Leica Geosystems S.P.A. (Calenzano, Italy), NetGEO and others) and publicly share the continuous GNSS.
Conflicts of Interest
The authors declare no conflict of interest.
References
- Galloway, D.L.; Burbey, T.J. Regional land subsidence accompanying groundwater extraction. Hydrogeol. J. 2011, 19, 1459–1486. [Google Scholar] [CrossRef]
- Prokopovich, N.P. Genetic classification of land subsidence. In Evaluation and Prediction of Subsidence; ASCE: Reston, VA, USA, 1979; pp. 389–399. [Google Scholar]
- Hu, B.; Wang, H.-S.; Sun, Y.-L.; Hou, J.-G.; Liang, J. Long-term land subsidence monitoring of Beijing (China) using the small baseline subset (sbas) technique. Remote Sens. 2014, 6, 3648–3661. [Google Scholar] [CrossRef]
- Tomás, R.; Romero, R.; Mulas, J.; Marturià, J.J.; Mallorquí, J.J.; López-Sánchez, J.M.; Herrera, G.; Gutiérrez, F.; González, P.J.; Fernández, J. Radar interferometry techniques for the study of ground subsidence phenomena: A review of practical issues through cases in Spain. Environ. Earth Sci. 2014, 71, 163–181. [Google Scholar] [CrossRef] [Green Version]
- Del Soldato, M.; Tomas, R.; Pont, J.; Herrera, G.; Garcia Lopez-Davalillos, J.C.; Mora, O. A multi-sensor approach for monitoring a road bridge in the valencia harbor (se Spain) by sar interferometry (insar). Rend. Online Soc. Geol. Italiana 2016, 41, 235–238. [Google Scholar] [CrossRef]
- Faunt, C.C.; Sneed, M.; Traum, J.; Brandt, J.T. Water availability and land subsidence in the Central Valley, california, USA. Hydrogeol. J. 2016, 24, 675–684. [Google Scholar] [CrossRef]
- Teatini, P.; Tosi, L.; Strozzi, T.; Carbognin, L.; Wegmüller, U.; Rizzetto, F. Mapping regional land displacements in the venice coastland by an integrated monitoring system. Remote Sens. Environ. 2005, 98, 403–413. [Google Scholar] [CrossRef]
- Abidin, H.Z.; Djaja, R.; Darmawan, D.; Hadi, S.; Akbar, A.; Rajiyowiryono, H.; Sudibyo, Y.; Meilano, I.; Kasuma, M.; Kahar, J. Land subsidence of jakarta (Indonesia) and its geodetic monitoring system. Nat. Hazards 2001, 23, 365–387. [Google Scholar] [CrossRef]
- Psimoulis, P.; Ghilardi, M.; Fouache, E.; Stiros, S. Subsidence and evolution of the thessaloniki plain, Greece, based on historical leveling and gps data. Eng. Geol. 2007, 90, 55–70. [Google Scholar] [CrossRef]
- Bitelli, G.; Bonsignore, F.; Unguendoli, M. Levelling and gps networks to monitor ground subsidence in the Southern Po Valley. J. Geodyn. 2000, 30, 355–369. [Google Scholar] [CrossRef]
- Béjar-Pizarro, M.; Guardiola-Albert, C.; García-Cárdenas, R.P.; Herrera, G.; Barra, A.; López Molina, A.; Tessitore, S.; Staller, A.; Ortega-Becerril, J.A.; García-García, R.P. Interpolation of gps and geological data using insar deformation maps: Method and application to land subsidence in the alto guadalentín aquifer (se Spain). Remote Sens. 2016, 8, 965. [Google Scholar] [CrossRef]
- Ferretti, A.; Prati, C.; Rocca, F. Permanent scatterers in sar interferometry. IEEE Trans. Geosci. Remote Sens. 2001, 39, 8–20. [Google Scholar] [CrossRef]
- Solari, L.; Raspini, F.; Del Soldato, M.; Bianchini, S.; Ciampalini, A.; Ferrigno, F.; Tucci, S.; Casagli, N. Satellite radar data for back-analyzing a landslide event: The ponzano (central Italy) case study. Landslides 2018, 15, 1–10. [Google Scholar] [CrossRef]
- Del Soldato, M.; Riquelme, A.; Bianchini, S.; Tomàs, R.; Di Martire, D.; De Vita, P.; Moretti, S.; Calcaterra, D. Multisource data integration to investigate one century of evolution for the Agnone landslide (Molise, Southern Italy). Landslides 2018. [Google Scholar] [CrossRef]
- Ciampalini, A.; Raspini, F.; Frodella, W.; Bardi, F.; Bianchini, S.; Moretti, S. The effectiveness of high-resolution lidar data combined with psinsar data in landslide study. Landslides 2016, 13, 399–410. [Google Scholar] [CrossRef]
- Intrieri, E.; Raspini, F.; Fumagalli, A.; Lu, P.; Del Conte, S.; Farina, P.; Allievi, J.; Ferretti, A.; Casagli, N. The maoxian landslide as seen from space: Detecting precursors of failure with sentinel-1 data. Landslides 2018, 15, 123–133. [Google Scholar] [CrossRef]
- Tofani, V.; Raspini, F.; Catani, F.; Casagli, N. Persistent scatterer interferometry (psi) technique for landslide characterization and monitoring. Remote Sens. 2013, 5, 1045–1065. [Google Scholar] [CrossRef]
- Rosi, A.; Vannocci, P.; Tofani, V.; Gigli, G.; Casagli, N. Landslide characterization using satellite interferometry (psi), geotechnical investigations and numerical modelling: The case study of ricasoli village (Italy). Int. J. Geosci. 2013, 4, 904. [Google Scholar] [CrossRef]
- Ferretti, A.; Prati, C.; Rocca, F. Nonlinear subsidence rate estimation using permanent scatterers in differential sar interferometry. IEEE Trans. Geosci. Remote Sens. 2000, 38, 2202–2212. [Google Scholar] [CrossRef]
- Solari, L.; Ciampalini, A.; Raspini, F.; Bianchini, S.; Moretti, S. Psinsar analysis in the Pisa urban area (Italy): A case study of subsidence related to stratigraphical factors and urbanization. Remote Sens. 2016, 8, 120. [Google Scholar] [CrossRef]
- Bonì, R.; Meisina, C.; Cigna, F.; Herrera, G.; Notti, D.; Bricker, S.; McCormack, H.; Tomás, R.; Béjar-Pizarro, M.; Mulas, J. Exploitation of satellite a-dinsar time series for detection, characterization and modelling of land subsidence. Geosciences 2017, 7, 25. [Google Scholar] [CrossRef]
- Da Lio, C.; Teatini, P.; Strozzi, T.; Tosi, L. Understanding land subsidence in salt marshes of the venice lagoon from sar interferometry and ground-based investigations. Remote Sens. Environ. 2018, 205, 56–70. [Google Scholar] [CrossRef]
- Da Lio, C.; Tosi, L. Land subsidence in the Friuli venezia giulia coastal plain, Italy: 1992–2010 results from sar-based interferometry. Sci. Total Environ. 2018, 633, 752–764. [Google Scholar] [CrossRef] [PubMed]
- Gao, M.; Gong, H.; Chen, B.; Li, X.; Zhou, C.; Shi, M.; Si, Y.; Chen, Z.; Duan, G. Regional land subsidence analysis in eastern Beijing plain by insar time series and wavelet transforms. Remote Sens. 2018, 10, 365. [Google Scholar] [CrossRef]
- Hung, W.-C.; Hwang, C.; Chen, Y.-A.; Zhang, L.; Chen, K.-H.; Wei, S.-H.; Huang, D.-R.; Lin, S.-H. Land subsidence in Chiayi, Taiwan, from compaction well, leveling and alos/palsar: Aquaculture-induced relative sea level rise. Remote Sens. 2017, 10, 40. [Google Scholar] [CrossRef]
- Minh, D.H.T.; Van Trung, L.; Toan, T.L. Mapping ground subsidence phenomena in Ho Chi Minh city through the radar interferometry technique using alos palsar data. Remote Sens. 2015, 7, 8543–8562. [Google Scholar] [CrossRef] [Green Version]
- Aslan, G.; Cakır, Z.; Ergintav, S.; Lasserre, C.; Renard, F. Analysis of secular ground motions in istanbul from a long-term insar time-series (1992–2017). Remote Sens. 2018, 10, 408. [Google Scholar] [CrossRef]
- Sun, H.; Zhang, Q.; Zhao, C.; Yang, C.; Sun, Q.; Chen, W. Monitoring land subsidence in the southern part of the lower liaohe plain, China with a multi-track ps-insar technique. Remote Sens. Environ. 2017, 188, 73–84. [Google Scholar] [CrossRef]
- Hooper, A.; Segall, P.; Zebker, H. Persistent scatterer interferometric synthetic aperture radar for crustal deformation analysis, with application to Volcán Alcedo, Galápagos. J. Geophys. Res. Solid Earth 2007, 112. [Google Scholar] [CrossRef] [Green Version]
- Hooper, A.; Zebker, H.; Segall, P.; Kampes, B. A new method for measuring deformation on volcanoes and other natural terrains using insar persistent scatterers. Geophys. Res. Lett. 2004, 31. [Google Scholar] [CrossRef]
- Tralli, D.M.; Blom, R.G.; Zlotnicki, V.; Donnellan, A.; Evans, D.L. Satellite remote sensing of earthquake, volcano, flood, landslide and coastal inundation hazards. ISPRS J. Photogramm. Remote Sens. 2005, 59, 185–198. [Google Scholar] [CrossRef]
- Rosi, A.; Tofani, V.; Tanteri, L.; Stefanelli, C.T.; Agostini, A.; Catani, F.; Casagli, N. The new landslide inventory of tuscany (Italy) updated with ps-insar: Geomorphological features and landslide distribution. Landslides 2018, 15, 5–19. [Google Scholar] [CrossRef]
- Crisci, A.; Gozzini, B.; Meneguzzo, F.; Pagliara, S.; Maracchi, G. Extreme rainfall in a changing climate: Regional analysis and hydrological implications in Tuscany. Hydrol. Process. 2002, 16, 1261–1274. [Google Scholar] [CrossRef]
- Rosi, A.; Tofani, V.; Agostini, A.; Tanteri, L.; Stefanelli, C.T.; Catani, F.; Casagli, N. Subsidence mapping at regional scale using persistent scatters interferometry (psi): The case of tuscany region (Italy). Int. J. Appl. Earth Obs. Geoinf. 2016, 52, 328–337. [Google Scholar] [CrossRef]
- Rosi, A.; Agostini, A.; Tofani, V.; Casagli, N. A procedure to map subsidence at the regional scale using the persistent scatterer interferometry (psi) technique. Remote Sens. 2014, 6, 10510–10522. [Google Scholar] [CrossRef]
- Rosi, A.; Segoni, S.; Catani, F.; Casagli, N. Statistical and environmental analyses for the definition of a regional rainfall threshold system for landslide triggering in tuscany (Italy). J. Geogr. Sci. 2012, 22, 617–629. [Google Scholar] [CrossRef]
- Capecchi, F.; Guazzone, G.; Pranzini, G. Il bacino lacustre di firenze-prato-pistoia; geologia del sottosuolo e ricostruzione evolutiva. Boll. Soc. Geol. Italiana 1975, 94, 637–660. [Google Scholar]
- Colombo, D.; Farina, P.; Moretti, S.; Nico, G.; Prati, C. Land Subsidence in the Firenze-Prato-Pistoia Basin Measured by Means of Spaceborne SAR Interferometry. In Proceedings of the IGARSS 2003 IEEE International Geoscience and Remote Sensing Symposium, Toulouse, France, 21–25 July 2003; IEEE: Piscataway, NJ, USA, 2003; pp. 2927–2929. [Google Scholar]
- Cocchi, I. L’uomo Fossile nell’italia Centrale; Giuseppe Bernardoni: Milano, Italy, 1867. [Google Scholar]
- Targioni-Tozzetti, G. Relazioni D’alcuni Viaggi Fatti in Diverse Parti della Toscana per Osservare le Produzioni Naturali, e Gli Antichi Monumenti di Essa; Per Gaetano Cambiagi: Firenze, Italy, 1768. [Google Scholar]
- Canuti, P.; Casagli, N.; Farina, P.; Ferretti, A.; Marks, F.; Menduni, G. Analisi dei fenomeni di subsidenza nel bacino del fiume arno mediante interferometria radar. Giornale Geol. Appl. 2006, 4, 131–136. [Google Scholar]
- Colesanti, C.; Ferretti, A.; Prati, C.; Rocca, F. Monitoring landslides and tectonic motions with the permanent scatterers technique. Eng. Geol. 2003, 68, 3–14. [Google Scholar] [CrossRef]
- Available online: http://www.pcn.minambiente.it (accessed on 20 July 2018).
- Available online: https://scihub.copernicus.eu (accessed on 20 July 2018).
- Costantini, M.; Ferretti, A.; Minati, F.; Falco, S.; Trillo, F.; Colombo, D.; Novali, F.; Malvarosa, F.; Mammone, C.; Vecchioli, F. Analysis of surface deformations over the whole italian territory by interferometric processing of ers, envisat and cosmo-skymed radar data. Remote Sens. Environ. 2017, 202, 250–275. [Google Scholar] [CrossRef]
- Ferretti, A.; Fumagalli, A.; Novali, F.; Prati, C.; Rocca, F.; Rucci, A. A new algorithm for processing interferometric data-stacks: Squeesar. IEEE Trans. Geosci. Remote Sens. 2011, 49, 3460–3470. [Google Scholar] [CrossRef]
- Farolfi, G.; Del Ventisette, C. Monitoring the Earth’s ground surface movements using satellite observations: Geodinamics of the Italian peninsula determined by using GNSS networks. In Proceedings of the 2016 IEEE Metrology for Aerospace (MetroAeroSpace), Florence, Italy, 22–23 June 2016; pp. 479–483. [Google Scholar]
- Farolfi, G.; Del Ventisette, C. Contemporary crustal velocity field in Alpine Mediterranean area of Italy from new geodetic data. GPS Solut. 2016, 20, 715–722. [Google Scholar] [CrossRef]
- Shepard, D. A Two-Dimensional Interpolation Function for Irregularly-Spaced Data. In Proceedings of the 1968 23rd ACM National Conference, Las Vegas, NV, USA, 27–29 August 1968; ACM: New York, NY, USA, 1956; pp. 517–524. [Google Scholar]
- Bartier, P.M.; Keller, C.P. Multivariate interpolation to incorporate thematic surface data using inverse distance weighting (idw). Comput. Geosci. 1996, 22, 795–799. [Google Scholar] [CrossRef]
- Farolfi, G.; Del Ventisette, C. Strain rates in the alpine mediterranean region: Insights from advanced techniques of data processing. GPS Solut. 2017, 21, 1027–1036. [Google Scholar] [CrossRef]
- Palano, M. On the present-day crustal stress, strain-rate fields and mantle anisotropy pattern of Italy. Geophys. J. Int. 2014, 200, 969–985. [Google Scholar] [CrossRef]
Figure 1.
Locations of the Area of Interest (AoI) and the eight GNSS stations used for the geodetic correction: five stations are inside the AoI and three are outside the AoI but close to the FPP plain.
Figure 1.
Locations of the Area of Interest (AoI) and the eight GNSS stations used for the geodetic correction: five stations are inside the AoI and three are outside the AoI but close to the FPP plain.

Figure 2.
Sample of a stratigraphic column of the AoI (modified from [36]).
Figure 2.
Sample of a stratigraphic column of the AoI (modified from [36]).

Figure 3.
Representation of the cosine directors in both ascending and descending geometries for decomposing the LOS velocity in Vertical and Horizontal components.
Figure 3.
Representation of the cosine directors in both ascending and descending geometries for decomposing the LOS velocity in Vertical and Horizontal components.

Figure 4.
Filtering of the data. E: East, W: West, Z: Zenith, and N: Nadir (from [35]).
Figure 4.
Filtering of the data. E: East, W: West, Z: Zenith, and N: Nadir (from [35]).

Figure 5.
Comparison of the GNSS data recorded by the IGMI station and the nearby ENVISAT and Sentinel-1 PS data.
Figure 5.
Comparison of the GNSS data recorded by the IGMI station and the nearby ENVISAT and Sentinel-1 PS data.

Figure 6.
Corrected ENVISAT data (vertical velocity) and isolines of the correction values adopted for the vertical velocities.
Figure 6.
Corrected ENVISAT data (vertical velocity) and isolines of the correction values adopted for the vertical velocities.

Figure 7.
Corrected Sentinel-1 data (vertical velocity) and isolines of the correction values adopted for the vertical velocities.
Figure 7.
Corrected Sentinel-1 data (vertical velocity) and isolines of the correction values adopted for the vertical velocities.

Figure 8.
Time series of the two PS sites in the two areas affected by subsidence in Pistoia Province: city centre of Pistoia (a) and southern area of Pistoia (b).
Figure 8.
Time series of the two PS sites in the two areas affected by subsidence in Pistoia Province: city centre of Pistoia (a) and southern area of Pistoia (b).

Figure 9.
Boundary of the subsidence areas recorded by the ENVISAT (2003–2010, (a)) and Sentinel-1 (2014–2017, (b)) constellations. Different subsidence rates between the two monitored periods may be due to changes in groundwater exploitation rates.
Figure 9.
Boundary of the subsidence areas recorded by the ENVISAT (2003–2010, (a)) and Sentinel-1 (2014–2017, (b)) constellations. Different subsidence rates between the two monitored periods may be due to changes in groundwater exploitation rates.

Figure 10.
Subsidence trace (a) and cross section of Pistoia. One N-S profile (A-A’, (b)) and two E-W profiles (B-B’, (c), and C-C’, (d)). ENVISAT data acquired from 2003 to 2010, Sentinel-1 data acquired from 2014 to 2017.
Figure 10.
Subsidence trace (a) and cross section of Pistoia. One N-S profile (A-A’, (b)) and two E-W profiles (B-B’, (c), and C-C’, (d)). ENVISAT data acquired from 2003 to 2010, Sentinel-1 data acquired from 2014 to 2017.

Figure 11.
Subsidence line (a) cross sections of Prato. One N-S profile (D-D’, (b)) and two E-W profiles (E-E’, (c), and F-F’, (d)). ENVISAT data acquired from 2003 to 2010, Sentinel-1 data acquired from 2014 to 2017.
Figure 11.
Subsidence line (a) cross sections of Prato. One N-S profile (D-D’, (b)) and two E-W profiles (E-E’, (c), and F-F’, (d)). ENVISAT data acquired from 2003 to 2010, Sentinel-1 data acquired from 2014 to 2017.

Figure 12.
Geological section of Pistoia town (modified from [37]) across to nearly section A-A’ in Figure 10.


Table 1.
Details of the available datasets of ENVISAT and Sentinel-1A and Sentinel-1B used to investigate the ground deformation in the Firenze–Prato–Pistoia plain.
Table 1.
Details of the available datasets of ENVISAT and Sentinel-1A and Sentinel-1B used to investigate the ground deformation in the Firenze–Prato–Pistoia plain.
| Satellite | Track Number | Orbit | Covered Time Period (dd/mm/yyyy) | Number of Images | PS Number | PS Density |
|---|---|---|---|---|---|---|
| ENVISAT | 444 | Ascending | 10/06/2003 27/05/2010 | 35 | 183354 | 222.5 |
| ENVISAT | 394 | Descending | 10/02/2003 19/04/2010 | 35 | 251885 | 305.7 |
| Sentinel-1 | 117 | Ascending | 12/12/2014 09/10/2017 | 101 | 119710 | 145.3 |
| Sentinel-1 | 168 | Descending | 22/03/2015 13/10/2017 | 98 | 123852 | 150.3 |
| Sentinel-1 | 95 | Descending | 12/10/2014 08/10/2017 | 95 |
Table 2.
Information about the GNSS stations in the study area.
| GNSS Station | Location | Network | Coordinates (°) | Start Date |
|---|---|---|---|---|
| IGMI | Istituto Geografico Militare Italiano, Peripheria of Firenze (Novoli) | EPN, RDN, INGV | Long: 11.2150 Lat: 43.4744 | December 2006 |
| FIPR | Centre of Firenze | INGV | Long: 11.2268 Lat: 43.7848 | June 2010 |
| CALA | Calenzano city | INGV | Long: 11.1643 Lat: 43.8678 | June 2010 |
| SEAN | Seano hamlet | INGV | Long: 11.0258 Lat: 43.8310 | September 2010 |
| PRAT | Prato city | EPN, RDN, INGV | Long: 11.0991 Lat: 43.8856 | May 1998 |
| EMPO | Empoli city | INGV | Long: 10.9347 Lat: 43.7151 | June 2010 |
| CRMI | Carmignano town | INGV | Long: 10.9795 Lat: 43.7956 | October 2006 |
| LMPR | Lamporecchio town | INGV | Long: 10.8907 Lat: 43.8114 | September 2010 |
Table 3.
Parameters of the Sentinel and ENVISAT images used for this work.
| Satellite | Satellite Geometry | Satellite Track | Los Angle θ (°) | Azimuth Angle δ (°) | |||
|---|---|---|---|---|---|---|---|
| ENVISAT | Descending | 394 | 23.3 | ~23 | −0.05 | 0.38 | 0.92 |
| ENVISAT | Ascending | 444 | 23.3 | ~23 | −0.05 | −0.38 | 0.92 |
| Sentinel-1 | Descending | 95 | 40.44 | 8.05 | −0.091 | 0.642 | 0.761 |
| Sentinel-1 | Ascending | 117 | 36.34 | 12.14 | −0.125 | −0.579 | 0.805 |
| Sentinel-1 | Descending | 168 | 37.23 | 9.40 | −0.099 | 0.597 | 0.796 |
© 2018 by the authors. Licensee MDPI, Basel, Switzerland. This article is an open access article distributed under the terms and conditions of the Creative Commons Attribution (CC BY) license (http://creativecommons.org/licenses/by/4.0/).
Share and Cite
MDPI and ACS Style
Del Soldato, M.; Farolfi, G.; Rosi, A.; Raspini, F.; Casagli, N. Subsidence Evolution of the Firenze–Prato–Pistoia Plain (Central Italy) Combining PSI and GNSS Data. Remote Sens. 2018, 10, 1146. https://doi.org/10.3390/rs10071146
AMA Style
Del Soldato M, Farolfi G, Rosi A, Raspini F, Casagli N. Subsidence Evolution of the Firenze–Prato–Pistoia Plain (Central Italy) Combining PSI and GNSS Data. Remote Sensing. 2018; 10(7):1146. https://doi.org/10.3390/rs10071146
Chicago/Turabian StyleDel Soldato, Matteo, Gregorio Farolfi, Ascanio Rosi, Federico Raspini, and Nicola Casagli. 2018. "Subsidence Evolution of the Firenze–Prato–Pistoia Plain (Central Italy) Combining PSI and GNSS Data" Remote Sensing 10, no. 7: 1146. https://doi.org/10.3390/rs10071146
Note that from the first issue of 2016, this journal uses article numbers instead of page numbers. See further details here.