Resolving Surface Displacements in Shenzhen of China from Time Series InSAR
by
 , , and
Peng Liu
1,2,* ,
,
Xiaofei Chen
2,
Zhenhong Li
3 ,
,
Zhenguo Zhang
2,
Jiankuan Xu
1,2,
Wanpeng Feng
4,
Chisheng Wang
5,
Zhongwen Hu
5,
Wei Tu
5 and
Hongzhong Li
6 1
SUSTech Academy for Advanced Interdisciplinary Studies, Southern University of Science and Technology, Shenzhen 518055, China
2
Department of Earth and Space Sciences, Southern University of Science and Technology, Shenzhen 518055, China
3
School of Engineering, Newcastle University, Newcastle upon Tyne NE1 7RU, UK
4
Guangdong Provincial Key Laboratory of Geodynamics and Geohazards, School of Earth Sciences and Engineering, Sun Yat-Sen University, Guangzhou 510275, China
5
School of Architecture and Urban Planning, Shenzhen University, Shenzhen 518060, China
6
Shenzhen Institutes of Advanced Technology, Chinese Academy of Sciences, Shenzhen 518055, China
*
Author to whom correspondence should be addressed.
Remote Sens. 2018, 10(7), 1162; https://doi.org/10.3390/rs10071162
Submission received: 6 June 2018
/
Revised: 15 July 2018
/
Accepted: 22 July 2018
/
Published: 23 July 2018
(This article belongs to the Special Issue Radar Interferometry for Geohazards)
Abstract
:Over the past few decades, the coastal city of Shenzhen has been transformed from a small fishing village to a mega city as China’s first Special Economic Zone. The rapid economic development was matched by a sharp increase in the demand for usable land and coastal reclamation has been undertaken to create new land from the sea. However, it has been reported that subsidence occurred in land reclamation area and around subway tunnel area. Subsidence and the additional threat of coastal inundation from sea-level rise highlight the necessity of displacement monitoring in Shenzhen. The time Series InSAR technique is capable of detecting sub-centimeter displacement of the Earth’s surface over large areas. This study uses Envisat, COSMO-SkyMed, and Sentinel-1 datasets to determine the surface movements in Shenzhen from 2004 to 2010 and from 2013 to 2017. Subsidence observed can be attributable to both land reclamation and subway construction. Seasonal displacements are likely to be associated with precipitation. The influence of ocean tidal level changes on seasonal displacement is not strongly evident from the results and requires further investigations. In general, InSAR has proven its ability to provide accurate measurements of ground stability for the city of Shenzhen.
1. Introduction
Interferometric Synthetic Aperture Radar (InSAR) is a powerful geodetic tool to detect Earth surface displacements in Radar line of sight (LOS) direction [1,2]. It has been used to investigate Earthquake deformation [3], volcano activities [4], landslides [5], subsidence [6], permafrost deformation [7], and other events. Using time series technique [8,9,10,11], the deformation details can be estimated with higher temporal resolution if the atmospheric effects, orbital errors, topography errors, and observation noises are well constrained [12].
Land subsidence was observed in many places around the world, including Beijing [13], Shanghai [14], Jakarta [15], Bangkok [16], Phoenix [17], and Mexico City [18] from time series InSAR. Subsidence can be caused by sediment compaction [19], ground water extraction [20], oil extraction [21], and mining activities [22]. Land subsidence poses threaten to human lives and cause damages to infrastructures. Hence it is of vital importance to monitor the evolution of land subsidence continuously, especially in densely populated area.
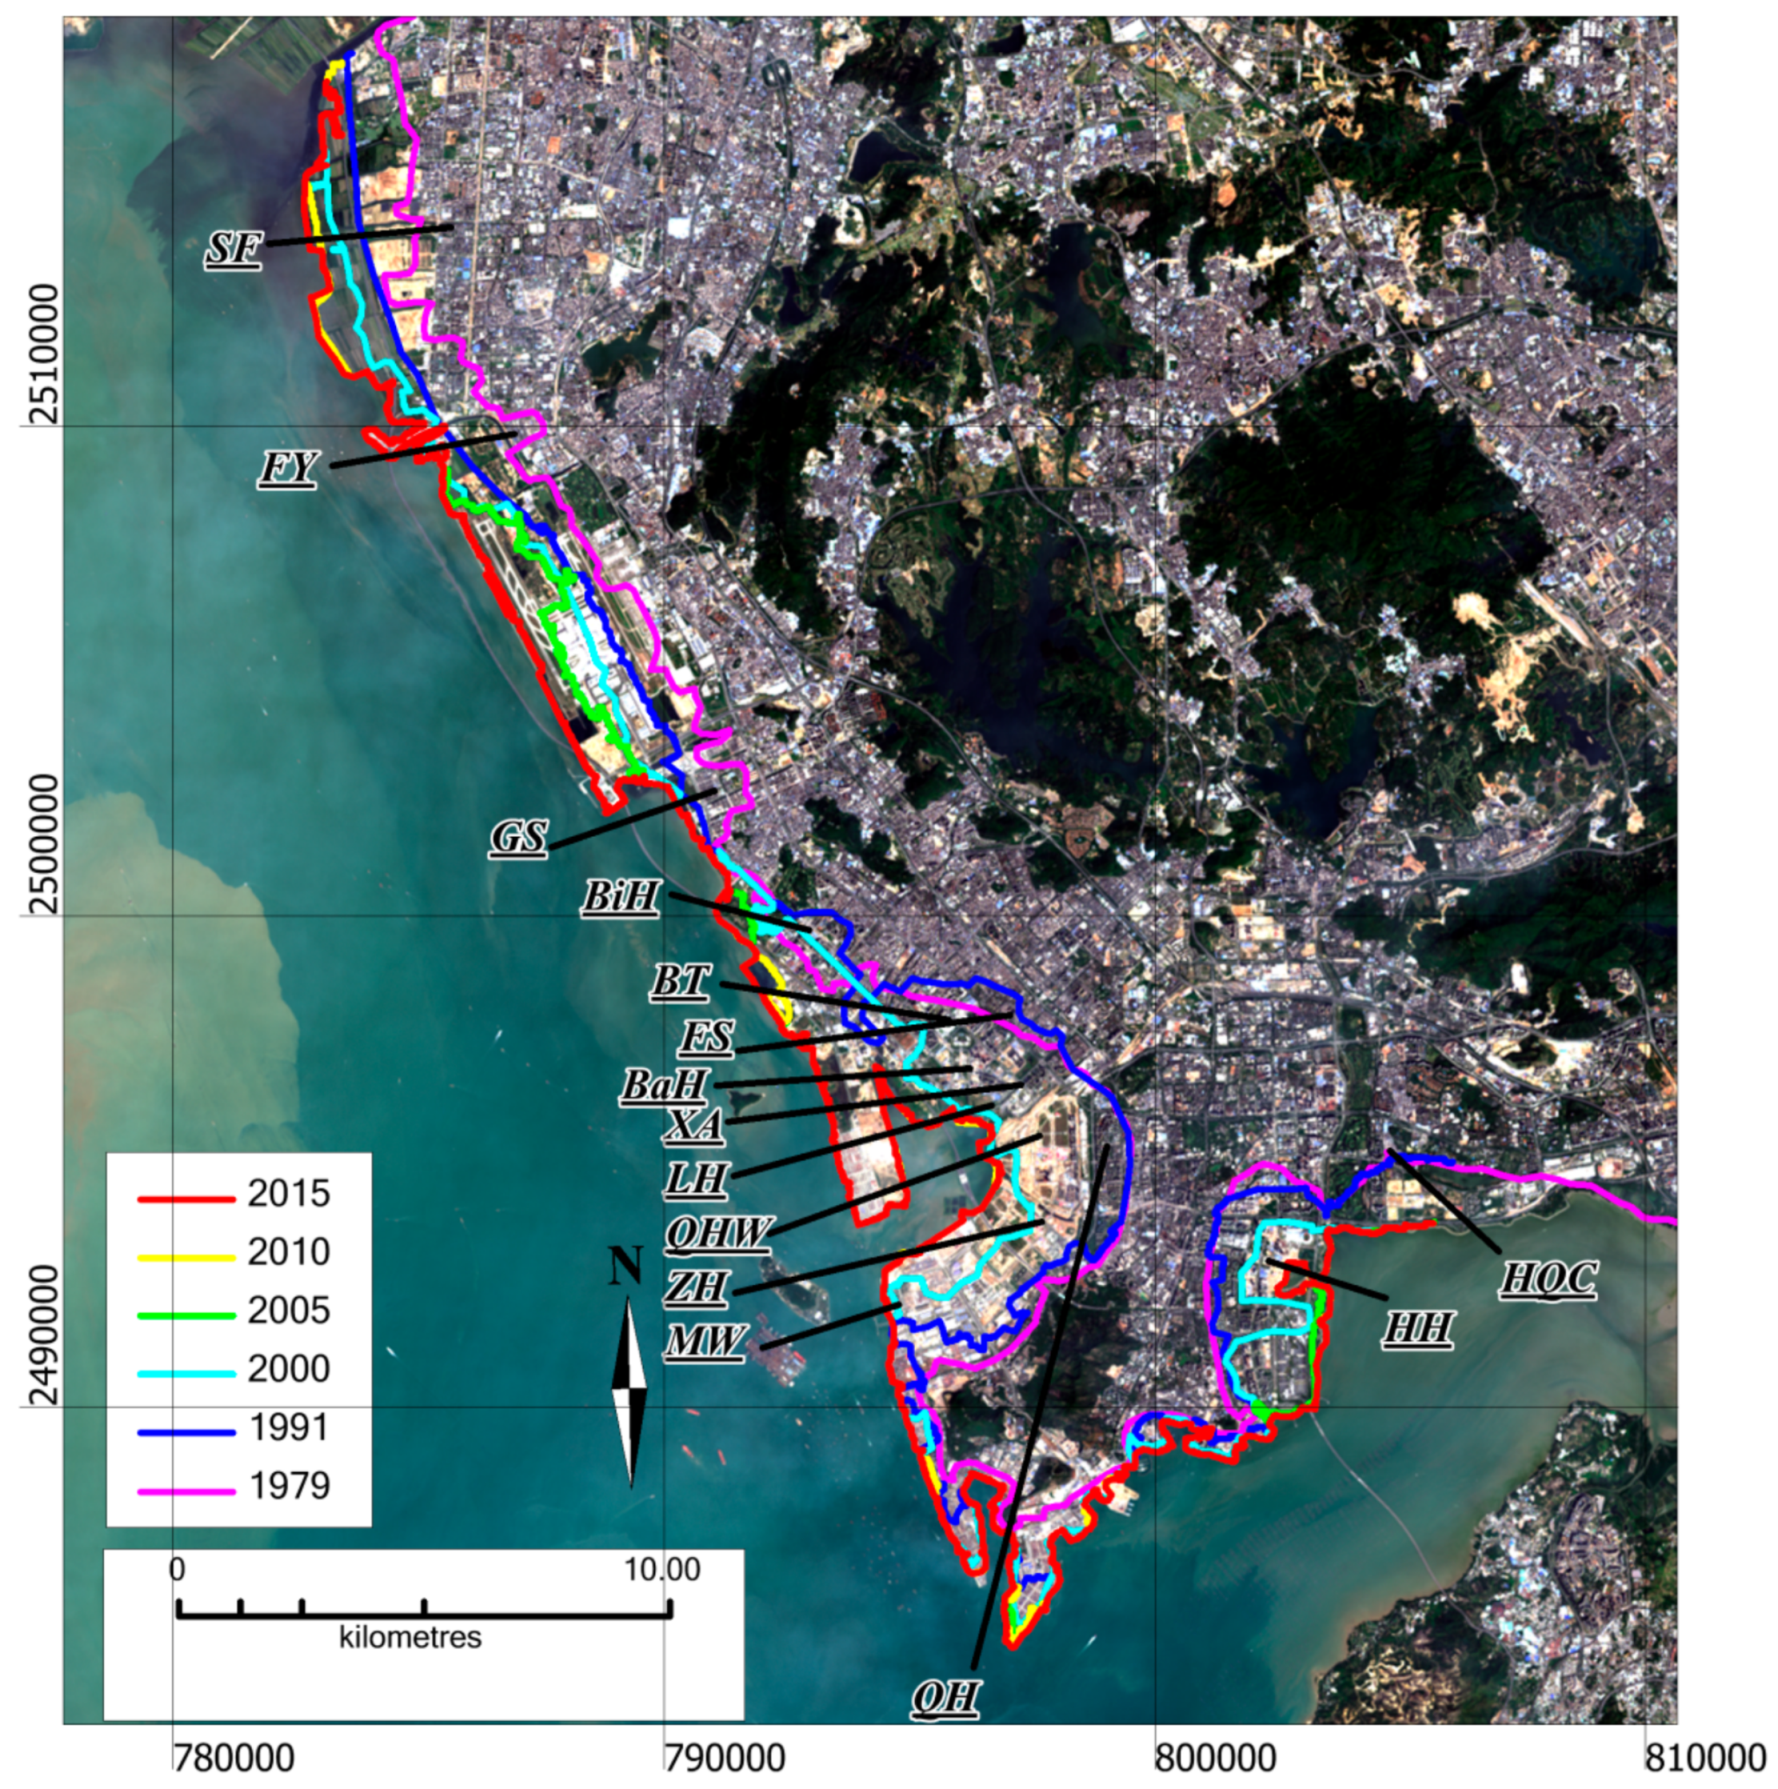
The Pearl River enters the South China Sea. Shenzhen is located on the eastern side of Pearl River delta. It was only a small fishing village 40 years ago, but now it is China’s fourth largest city in terms of economy. The population of Shenzhen is 119 million with an annual growing rate of 4.7% in 2016. However, the land area of Shenzhen is only 1991 km2 [23], roughly 1/8 of Beijing or 1/3 of Shanghai or Guangzhou. Because of limited land resources, Shenzhen has reclaimed about 100 km2 of land from sea in the past 30 years [24]. Land reclamation area includes Shekou Industrial Zone, Yantian Port, Qianhai Free Trade Zone, Binhai Road and Shenzhen Airport. The land reclamation is concentrated on the west coast of Shenzhen (Figure 1) except for Yantian Port on the east coast. Subsidence is reported in land reclamation area of Shenzhen with cracks opening up over pavements [25,26]. Other subsidence phenomena also occurred in Shenzhen due to sinkhole collapse or subway construction [27].
Previous studies of subsidence in Shenzhen mainly use Envisat ASAR images collected between 2006 and 2010 [28,29,30]. Another study used ASAR, ALOS, and TerraSAR-X datasets to investigate the effects of DEM on PS-InSAR in Shenzhen [31]. In this work, apart from using ASAR images acquired between 2004 and 2010, both COSMO-SkyMed images from 2013 to 2016 and Sentinel-1 images from 2015 to 2017 are employed to recover the evolution of Earth surface displacements in Shenzhen. Our results suggest that subsidence in Shenzhen is mainly located in the area of coastal reclamation. Subsidence can also be observed along subways especially when they approaching land reclamation area like Qianhai and Houhai and in built up area of northwest Shenzhen. In addition to the secular subsidence trend, seasonal displacements are analyzed for their possible driven factors. Precipitation is likely a factor influencing the displacement seasonality. However, whether ocean tidal levels contribute to the displacement seasonality or not is still questionable and further observations are still needed to analyze it.
This work focuses on the interpretation of both long term subsidence and seasonal deformation signals in Shenzhen. The displacement time series are retrieved with the StaMPS package using PS-InSAR method [8]. The periodicity of seasonal displacement and its relationship with precipitation are investigated using wavelet tools [32]. The spatial-temporal characteristics of surface displacements are analyzed together with land reclamation and subway construction to address the role of human activity in Earth surface evolution.
2. Study Area
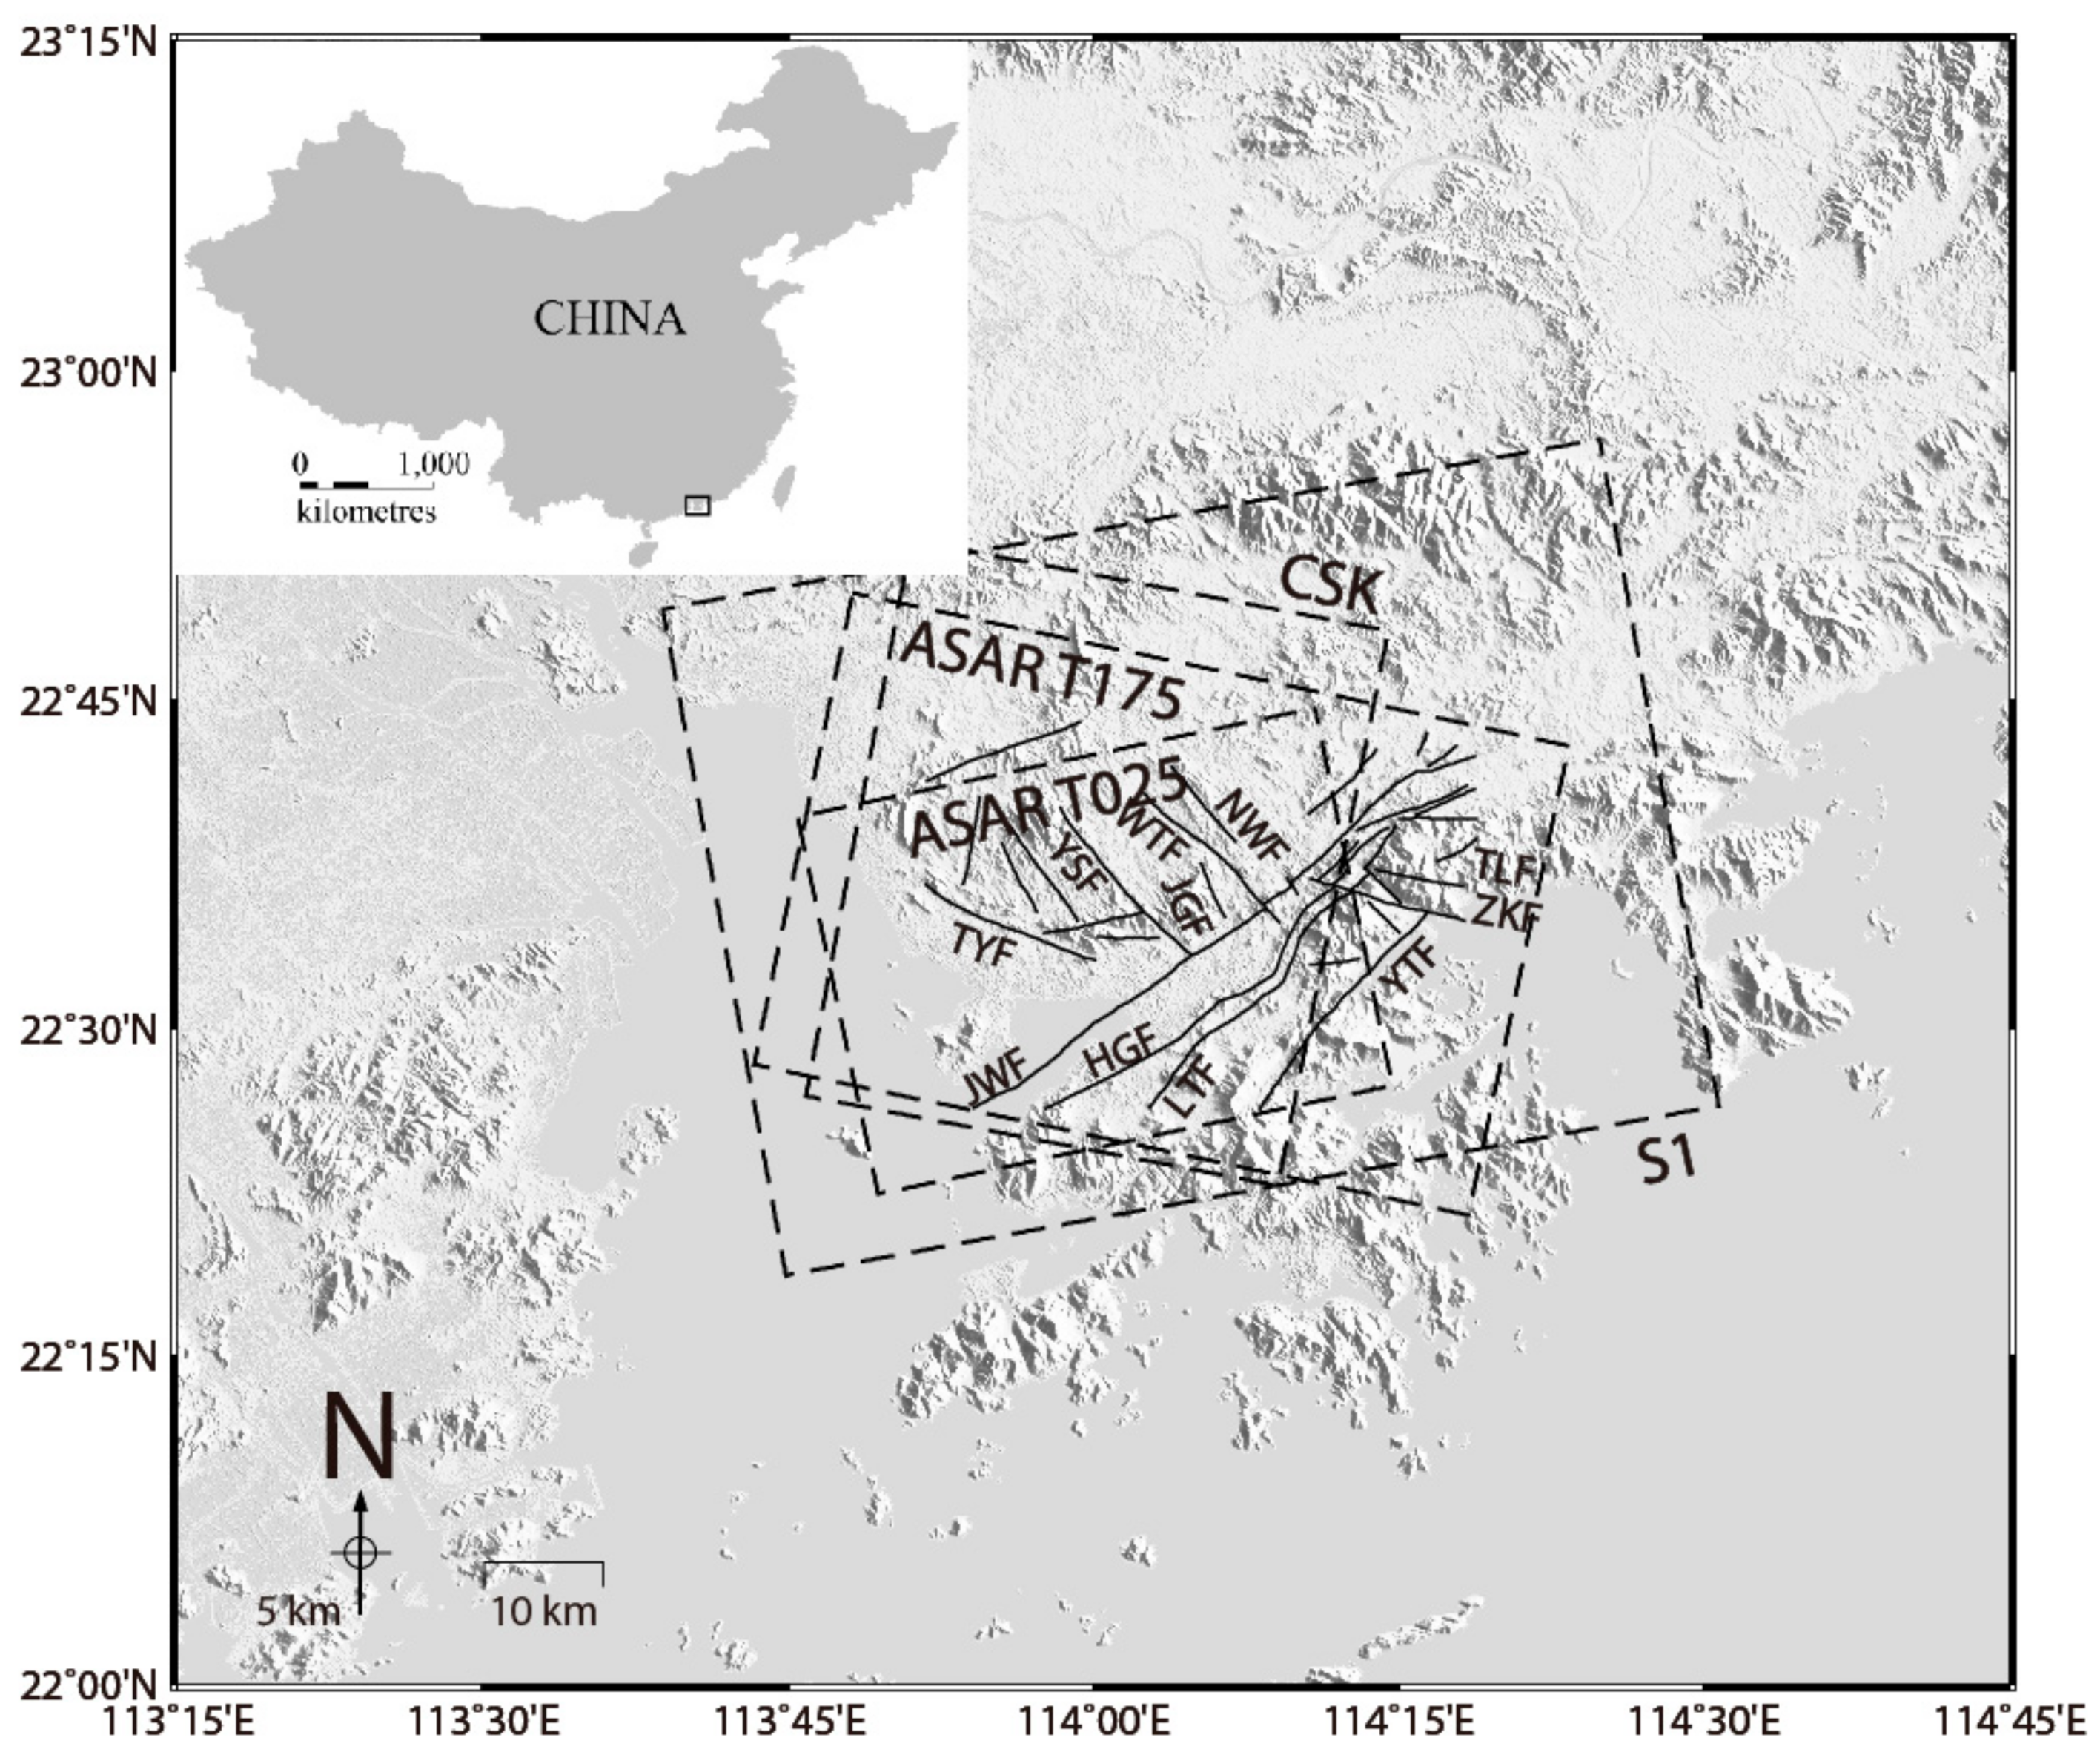
The megacity of Shenzhen is located at the southern coastline of Guangdong province. Shenzhen is bounded to the west by the Pearl River estuary, to the east by Huizhou City and Daya Bay, and to the south by Shenzhen Bay, Hong Kong Special Administration Region, and Dapeng Bay. The altitudes range from zero along the coast to 430 m in Tanglang hill for our study area. Pingluan hill, Yangtai hill, and Tanglang hill are the highest peaks in our study area. There are 4 North East trending faults and 7 North West trending faults in this area (Figure 2) [33].
Exposed soil strata in Shenzhen include Quaternary, Tertiary, Cretaceous, Jurassic, Triassic, Carboniferous, Devonian, Nanhua, Lixian, Ordovician, and Sinian. The Quaternary soil ranges from 0 to 40 m with sand, silt, and clay compositions [34]. Quaternary soil is underlain by weathered granite [35]. The outcrop area of granite rock in Shenzhen reaches 760 km2 [34], which is about 38% of the land area in Shenzhen. Tertiary to Ordovician rocks consist of sandstone, granite, mudstone, shale, limestone and marble [34]. The buried depth of bedrock ranges between 10 m and 60 m seen from cross sections located in Shekou [35].
3. Data and Method
3.1. Data
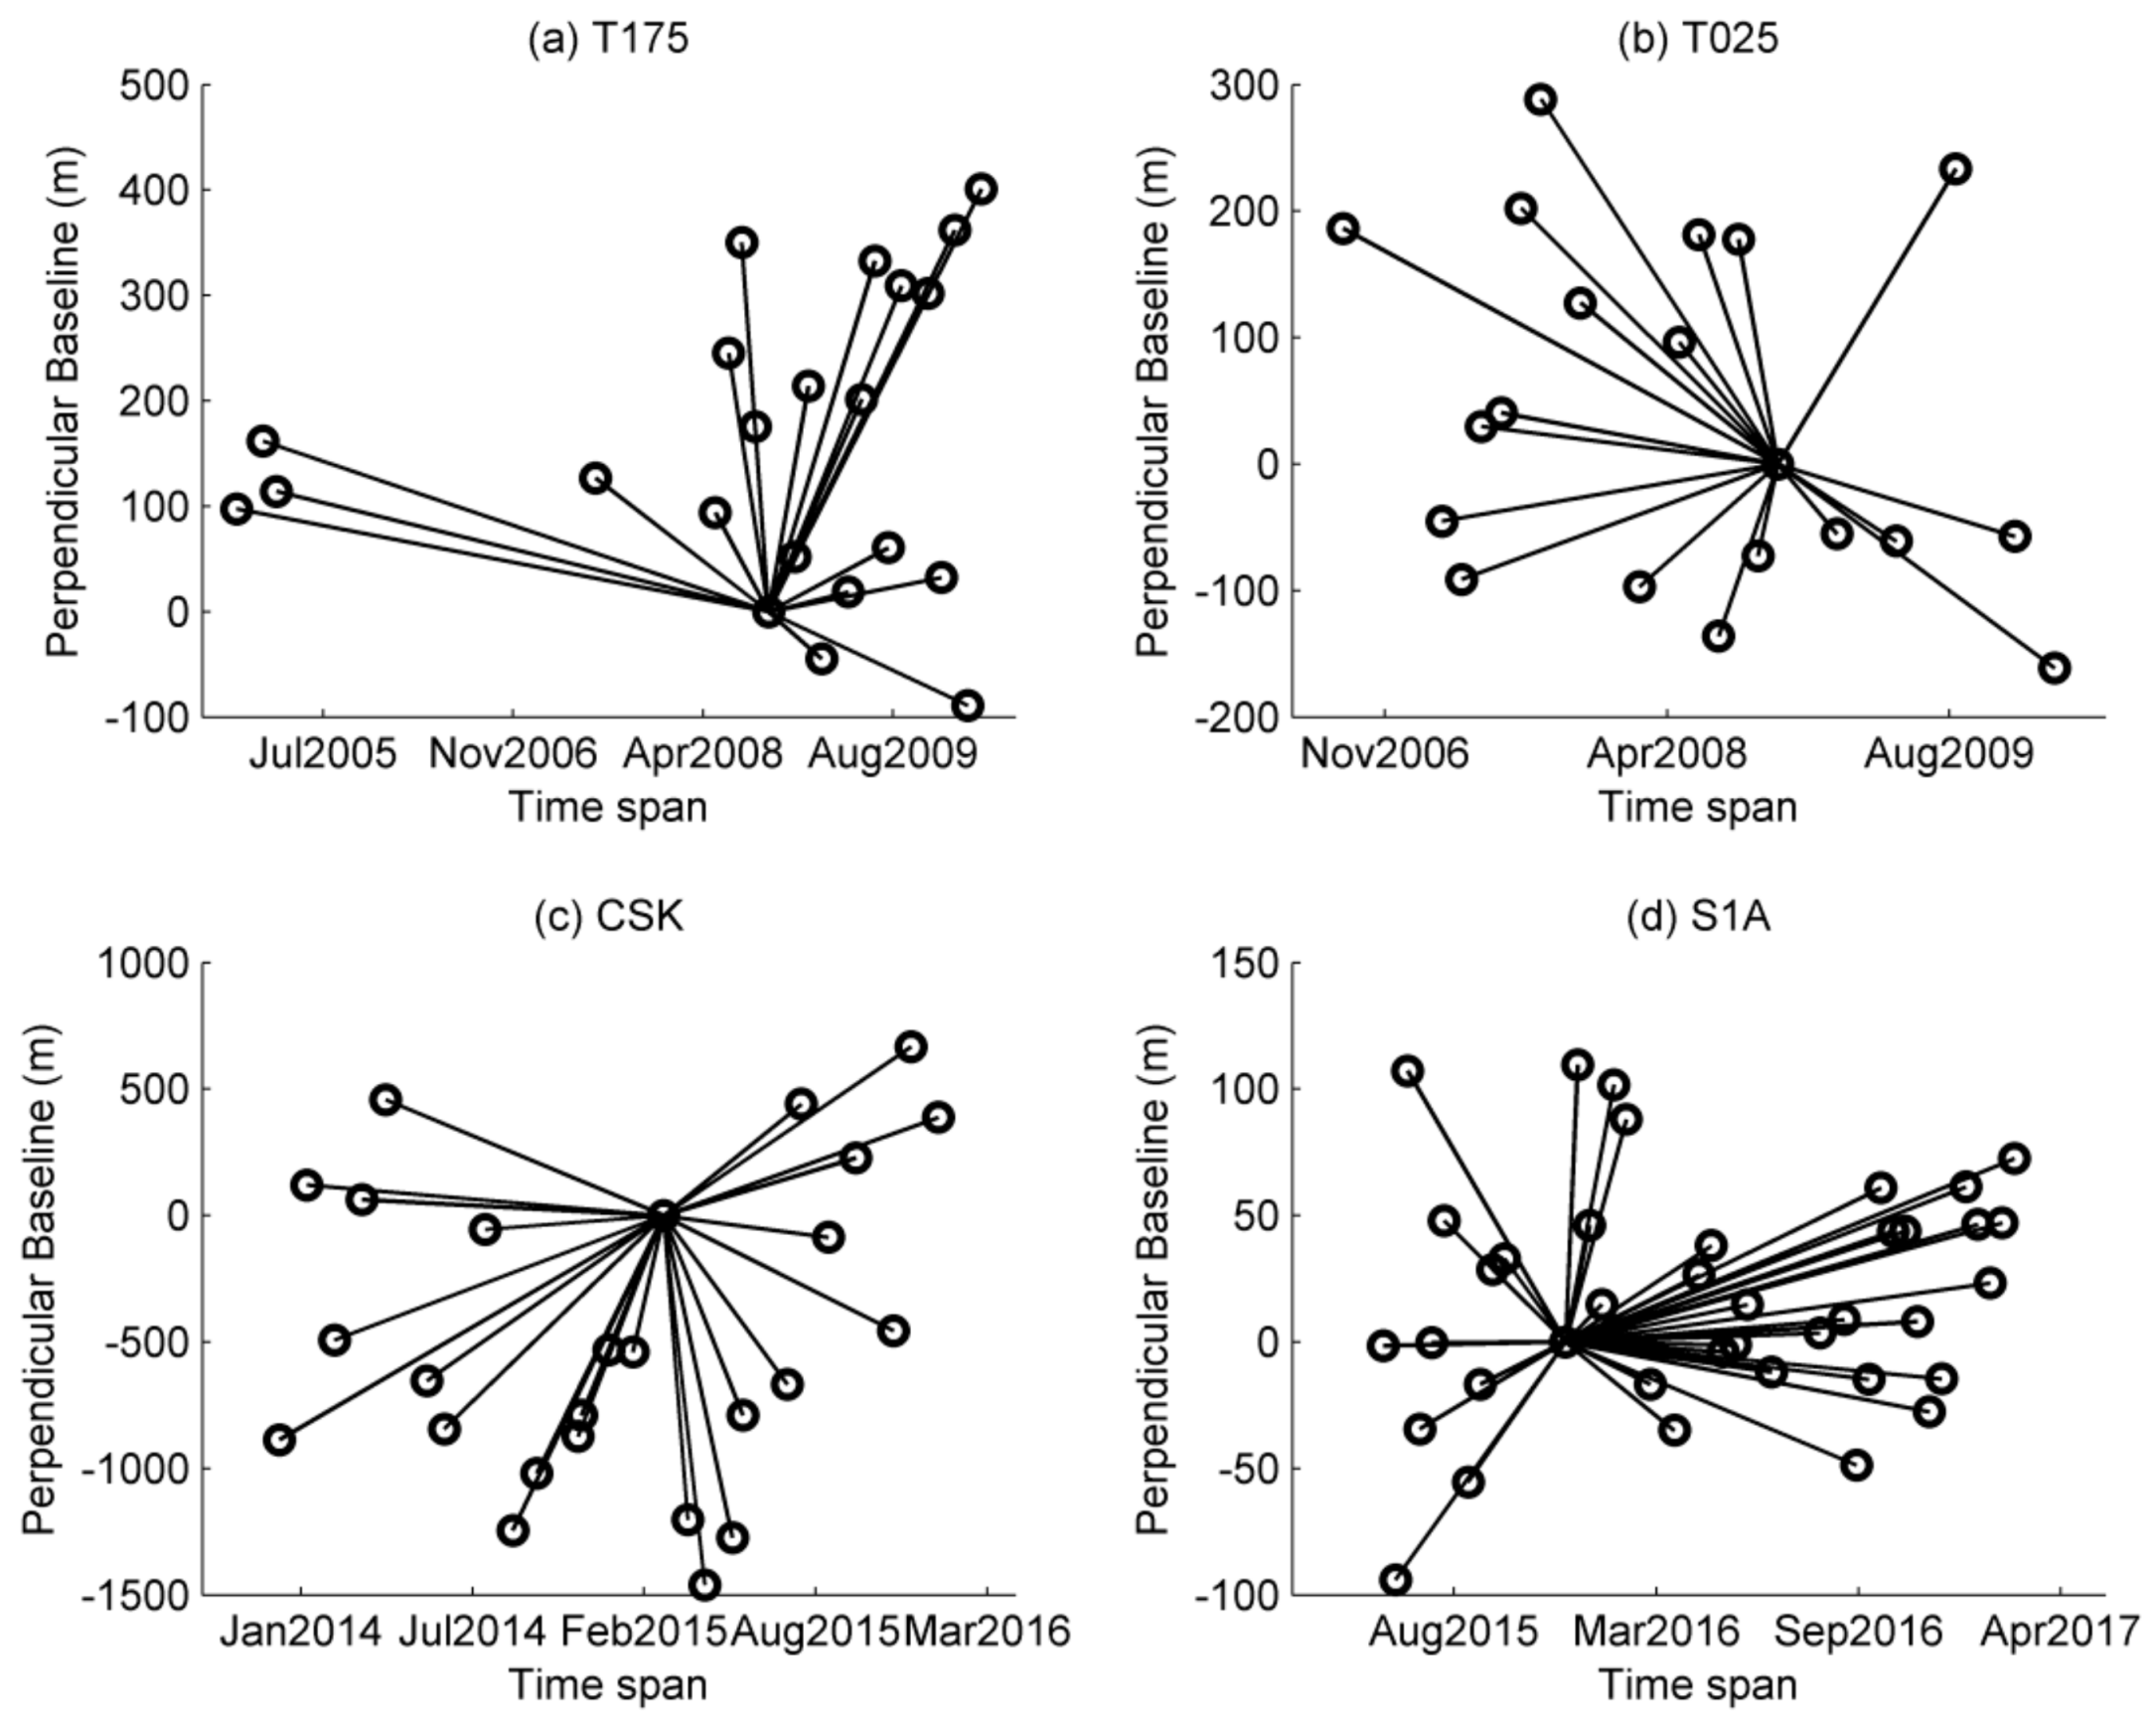
Time series InSAR method is used to obtain surface displacements in Shenzhen exploring C band (56.2 mm) Envisat ASAR (Figure 3a,b), X-band (31.2 mm) COSMO-SkyMed (hereafter referred as CSK) data (Figure 3c) and C-band (55.5 mm) Sentinel-1 (hereafter referred as S1) data (Figure 3d). The radar line of sight look angles are 23°, 29° and 44° off nadir for ASAR, CSK and S1 respectively. The azimuth angles are 167.2°, 12.8°, 169.2° and 12.3° counter clockwise from north for ASAR T175, ASAR T025, CSK and S1 respectively. In other words, ASAR T175 and CSK are descending, while ASAR T025 and S1 are ascending. The ground range × azimuth resolution of ASAR, CSK and S1 images are approximately, 20 × 4 m, 3 × 3 m, and 5 × 20 m, respectively. ASAR T025 datasets span between 6 September 2006 and 17 February 2010, while ASAR T175 datasets span between 21 November 2004 and 4 April 2010. The two ASAR datasets overlap during the period between 2007 and 2010. The CSK datasets range between 7 December 2013 and 14 January 2016, while S1 datasets range between 15 June 2015 and 28 February 2017. The CSK and S1 datasets overlap in the second half year of 2015. The ASAR datasets are not time-overlapping with CSK or S1 datasets, and there is a temporal gap of 44 months between ASAR and CSK images.
3.2. Methods
For Envisat ASAR and CSK datasets, ROI_PAC was used to generate Single Look Complex (SLC) images from raw data, and Doris was then used to generate interferograms [1,36]. GAMMA was used to process S1 datasets from SLC to interferograms [37]. SRTM (NASA’s Shuttle Radar Topography Mission) with a 90 m resolution was used to flatten interferograms [38]. The StaMPS (Stanford Method for Persistent Scatterers) package was used for time series analysis [8,39].
StaMPS relies on phase spatial correlation to identify Persistent Scatterers (PS) pixels, nevertheless amplitude analysis was also used to reduce the number of PS candidates [11,36,40]. Both the deformation phase and atmospheric effects are spatially correlated and they are estimated together by band pass filtering. While the look angle (DEM) errors are perpendicular baseline correlated and they are estimated by least squares method. Subtracting the spatially correlated and baseline correlated phase components from wrapped phase, the residual phase are used for time series coherence (gamma value) estimation [41]. PS candidates with gamma values above the thresholds are selected as PS points.
The phase of selected PS points are still wrapped. The Statistical-Cost, Network-Flow Algorithm for Phase Unwrapping (SNAPHU) algorithm is used to add integer numbers of 2π to the wrapped phase for a continuous phase field in space and time [42]. The unwrapped phase is then re-estimated for look angle (DEM) and the atmospheric effects [8]. The atmospheric effects are estimated by atmosphere filtering [8]. The atmospheric effects are temporally uncorrelated but spatially correlated. Hence the atmosphere filter is a combination of temporal high pass filter and spatial low pass filter. The orbital errors and long-wavelength atmospheric effects are mitigated by a best fit plane.
4. Results
The mean phase values were initially used as the reference in time series analysis due to the lack of ground truth data. One of the area with no obvious displacements was then chosen as the reference area (small triangle in Figure 4 and Figure 5). The reference area is a 88 m high hill called Shekou hill, of which the exposed bedrock is granite. Hence it is a stable area less affected by land reclamation or sediment compaction.
In earthquake, volcano, and landslide studies, to separate horizontal and vertical displacements, the pixel offset tracking and Multi-Aperture Interferometry (MAI) methods can be employed to build extra observations [43,44,45]. However, the accuracy of pixel offset tracking or MAI method is limited to tens of centimeters and they can only provide information on the horizontal component of the displacement [46], which is not suitable for this study.
For Envisat ASAR datasets, both ascending (T025) and descending (T175) observations are available from 2007 and 2010. The initial displacements from time series InSAR are in radar line of sight (LOS) direction. The north, east and up (NEU) LOS vectors are [0.0800 0.3798 0.9216] for T175 and [0.0803–0.3788 0.922] for T025. The north components are assumed as zero to solve east and up components from T175 and T025 LOS displacements due to the insensitivity of LOS direction to north components. However, the solved east component is not spatially correlated. It is likely that the vertical displacement dominates the observed deformation due to the nature of subsoil consolidation in coastal reclamation area. The east component is insignificant and its solution is affected by InSAR uncertainties.
CSK and S1 are not contemporary observations and are not used to solve horizontal motions. As the horizontal displacements are not effectively estimated, LOS PS rates are converted to zenith using the inverse of the cosine of the incidence angle. The InSAR displacements shown in this study are in vertical direction.
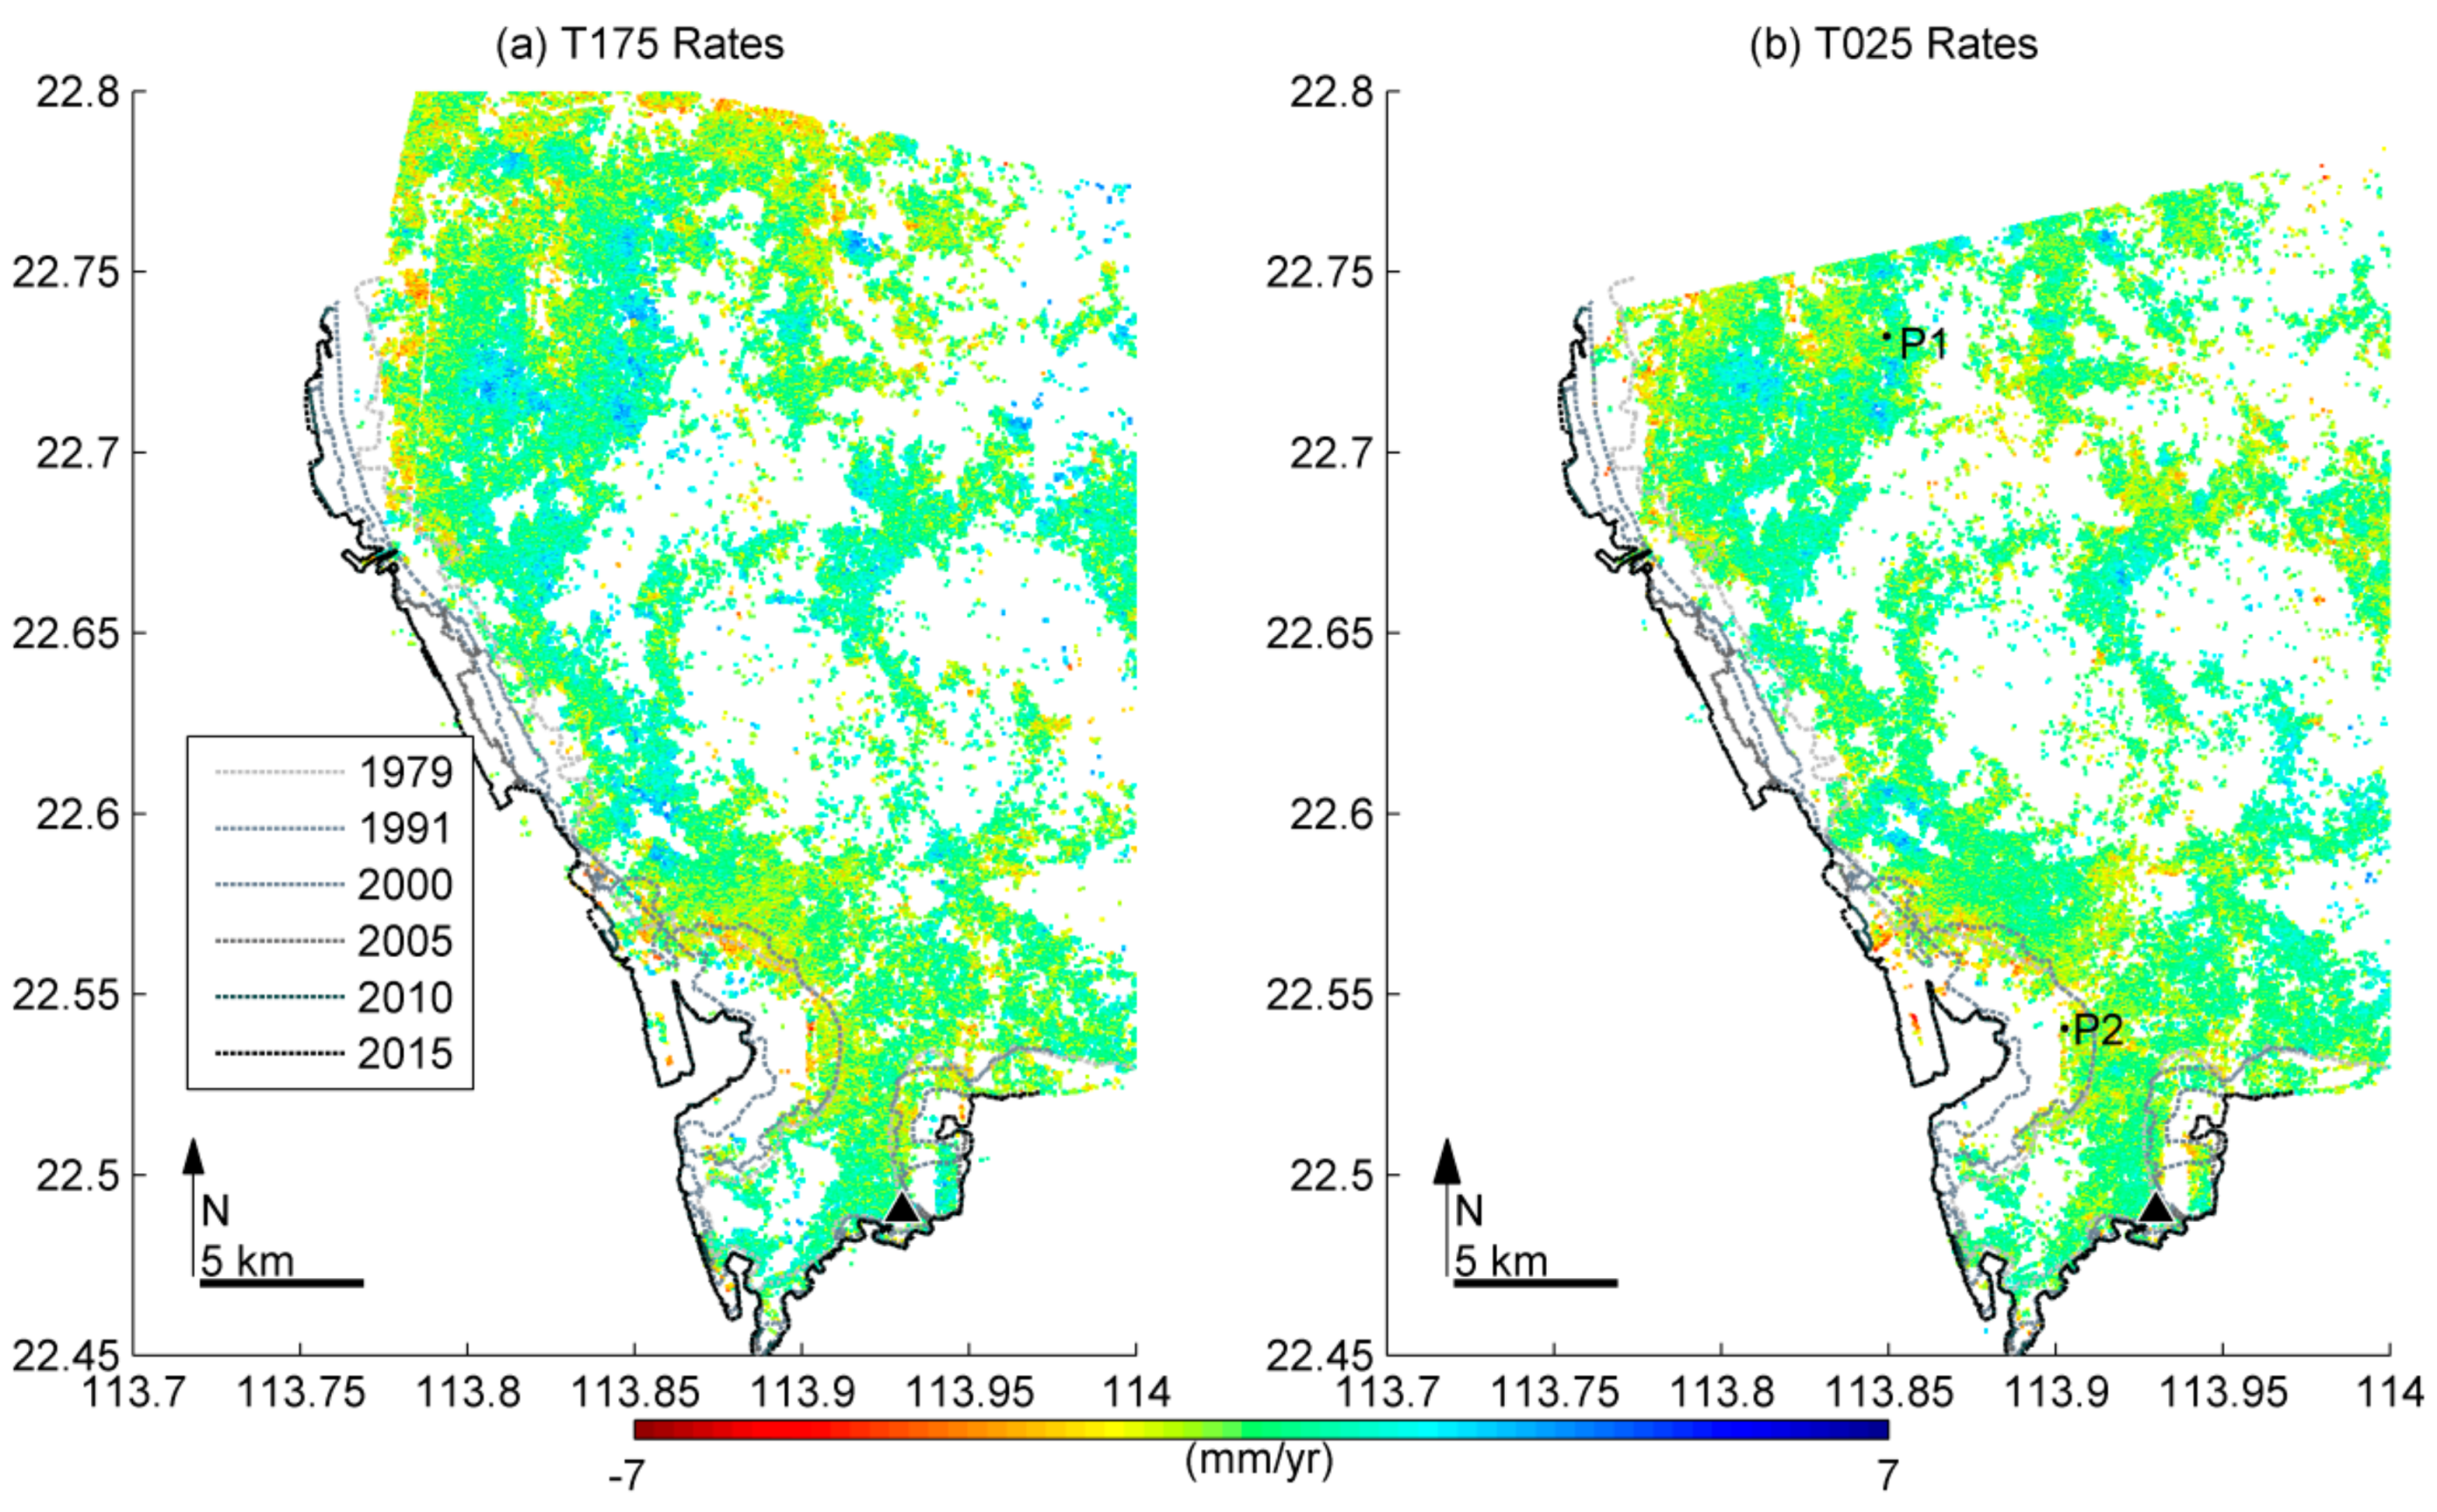
The mean displacement rates from Track 175 and Track 025 are compared (Figure 6). The overall root mean square (RMS) difference is 1.03 mm/year between the two tracks. The displacement differences can be expected due to different geometry conditions for image acquisitions (e.g., descending and ascending).
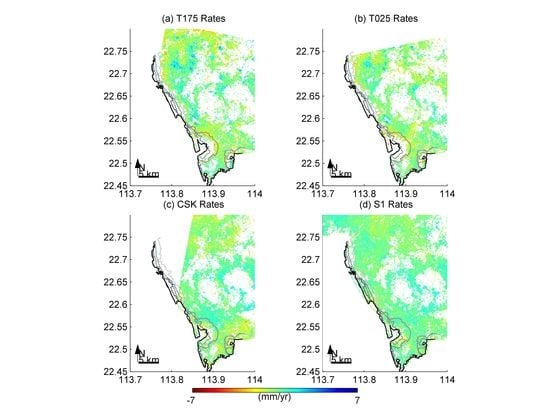
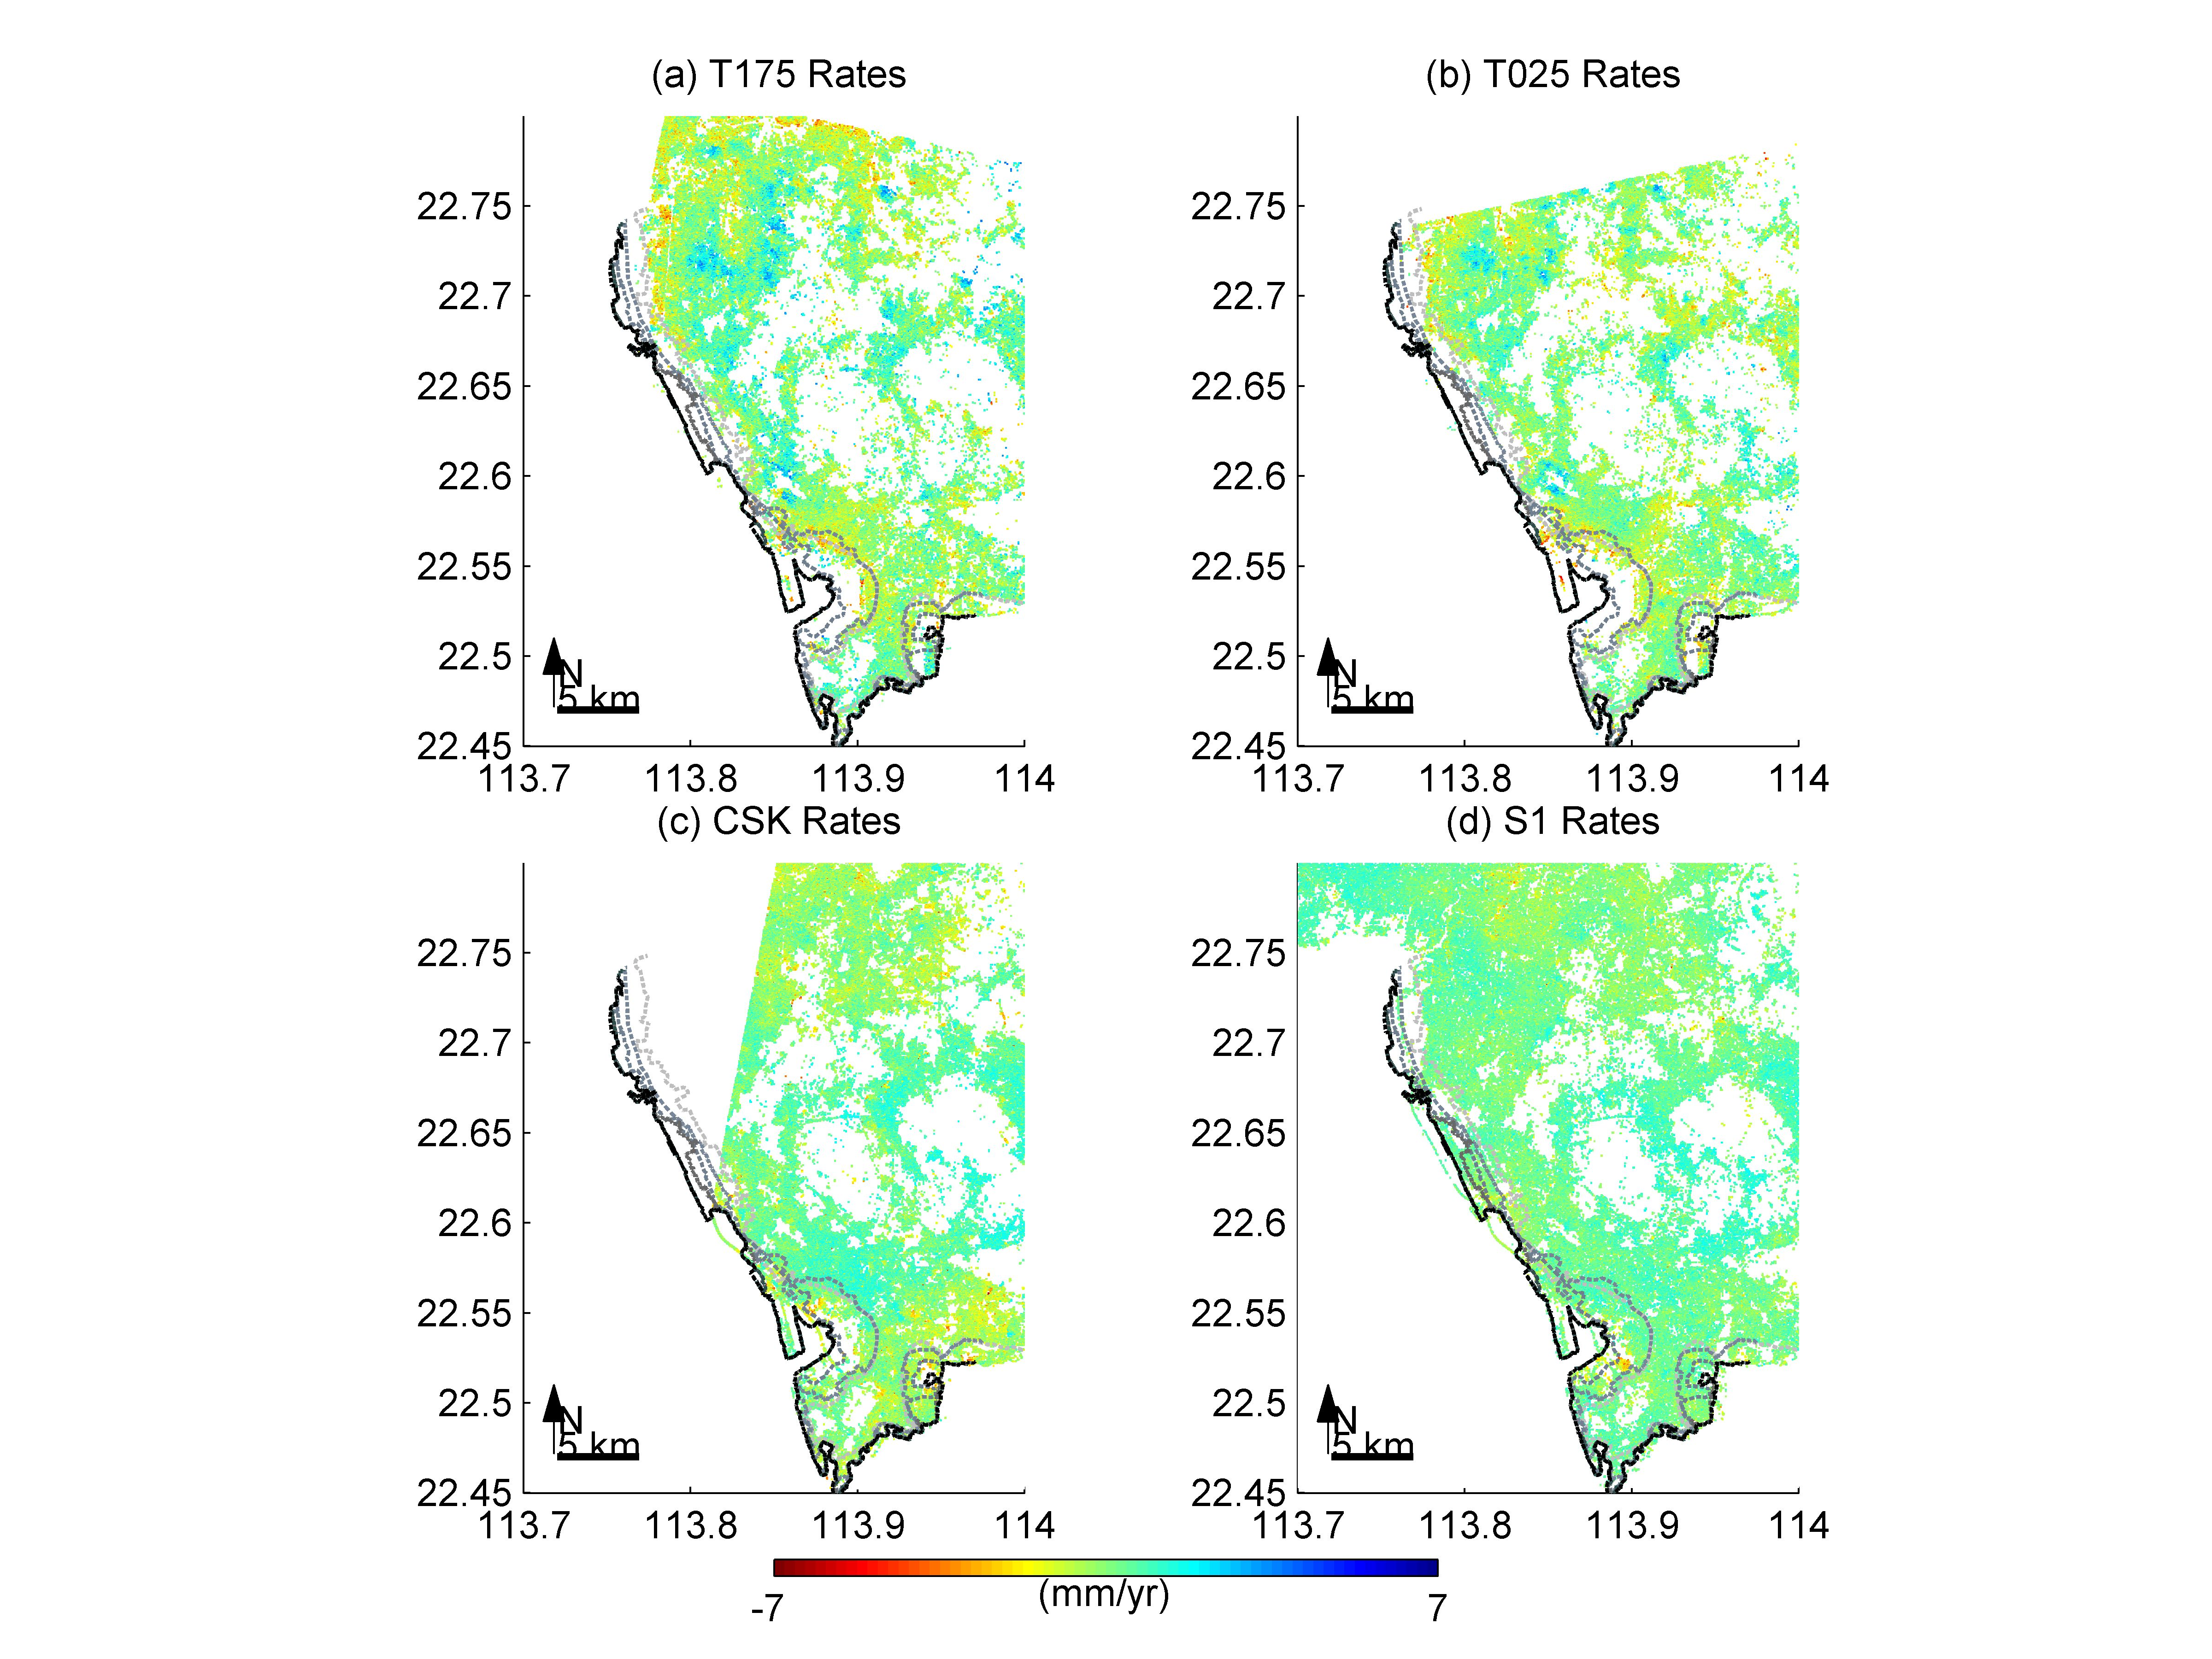
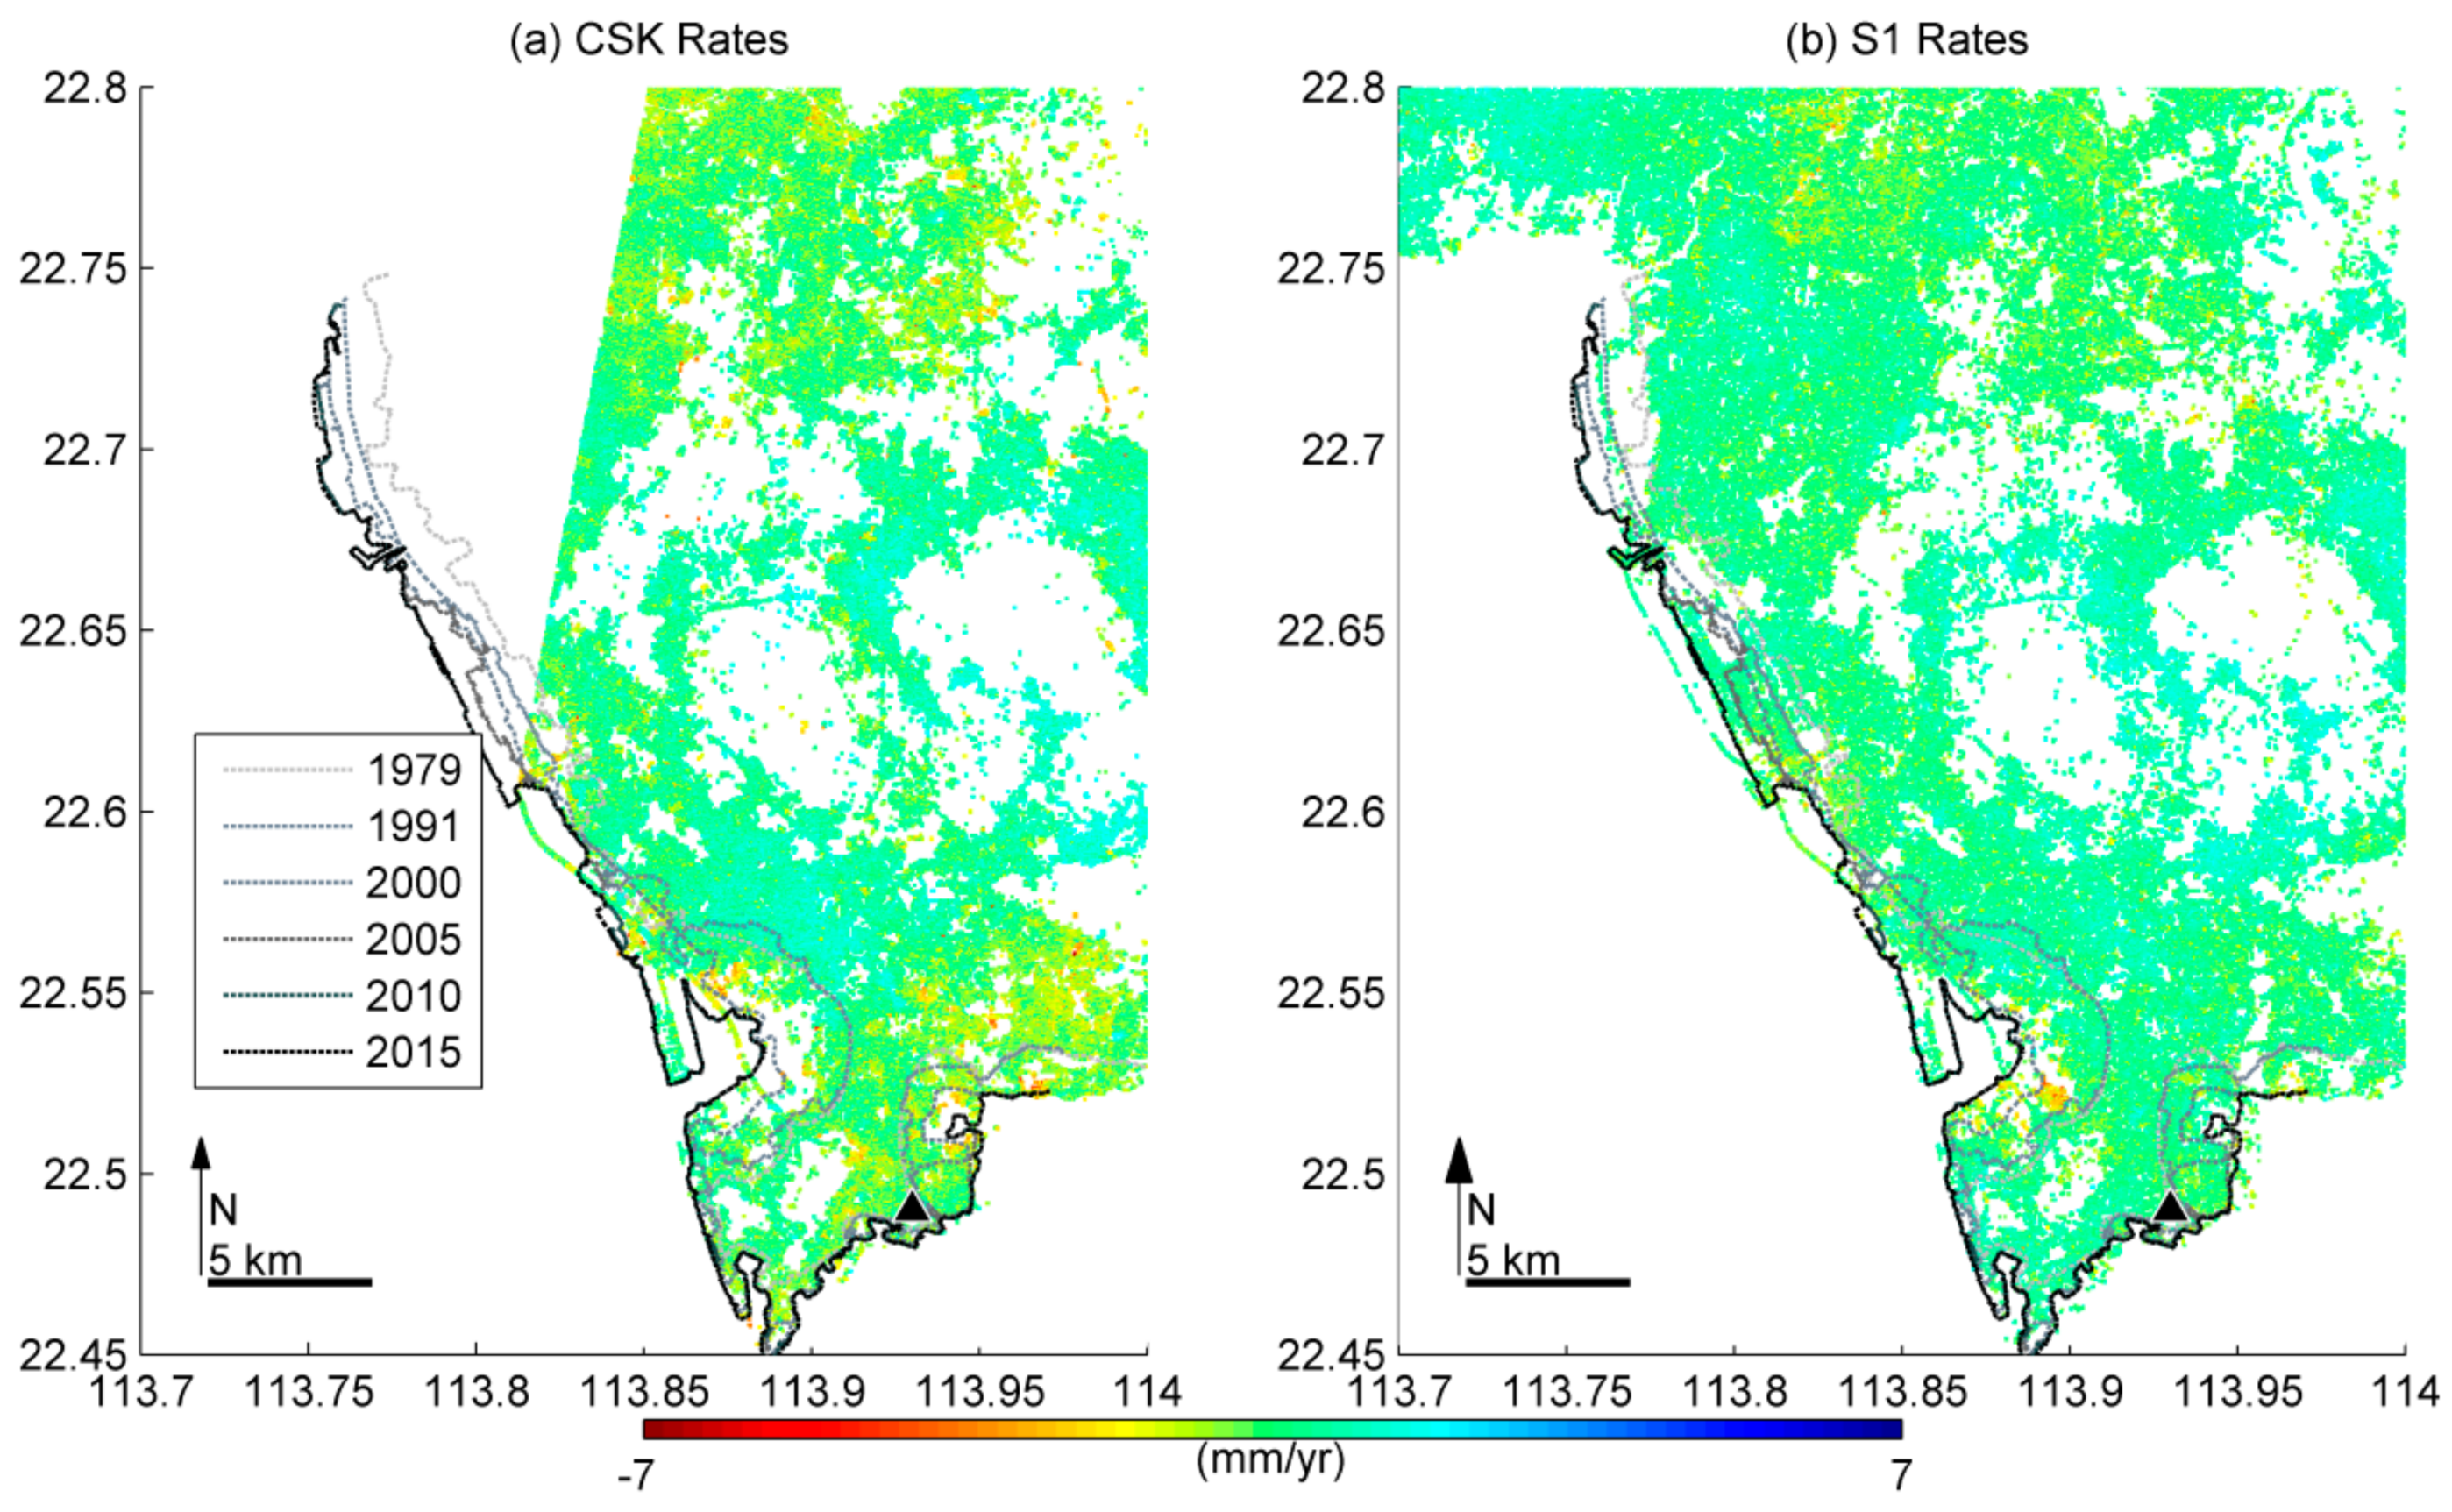
Displacement mean rates are consistent between T175 and T025 (Figure 4). Subsidence can be found around the coast, especially in Qianhai and Houhai areas from T175 and T025. CSK results show subsidence to the south of Bao’an International Airport. Subsidence in Qianhai and Houhai can be found in CSK results too, but the area of subsidence in Qianhai has been substantially reduced in CSK results (Figure 5a). S1 results show isolated subsidence areas, e.g., to the south of Bao’an International Airport and also in Qianhai. Subsidence can also be observed in northwest Shenzhen from ASAR T175, T025, CSK and S1 results. A hotspot analysis confirmed subsidence pattern seen from the displacement rates (Appendix A).
4.1. Subsidence in Qianhai
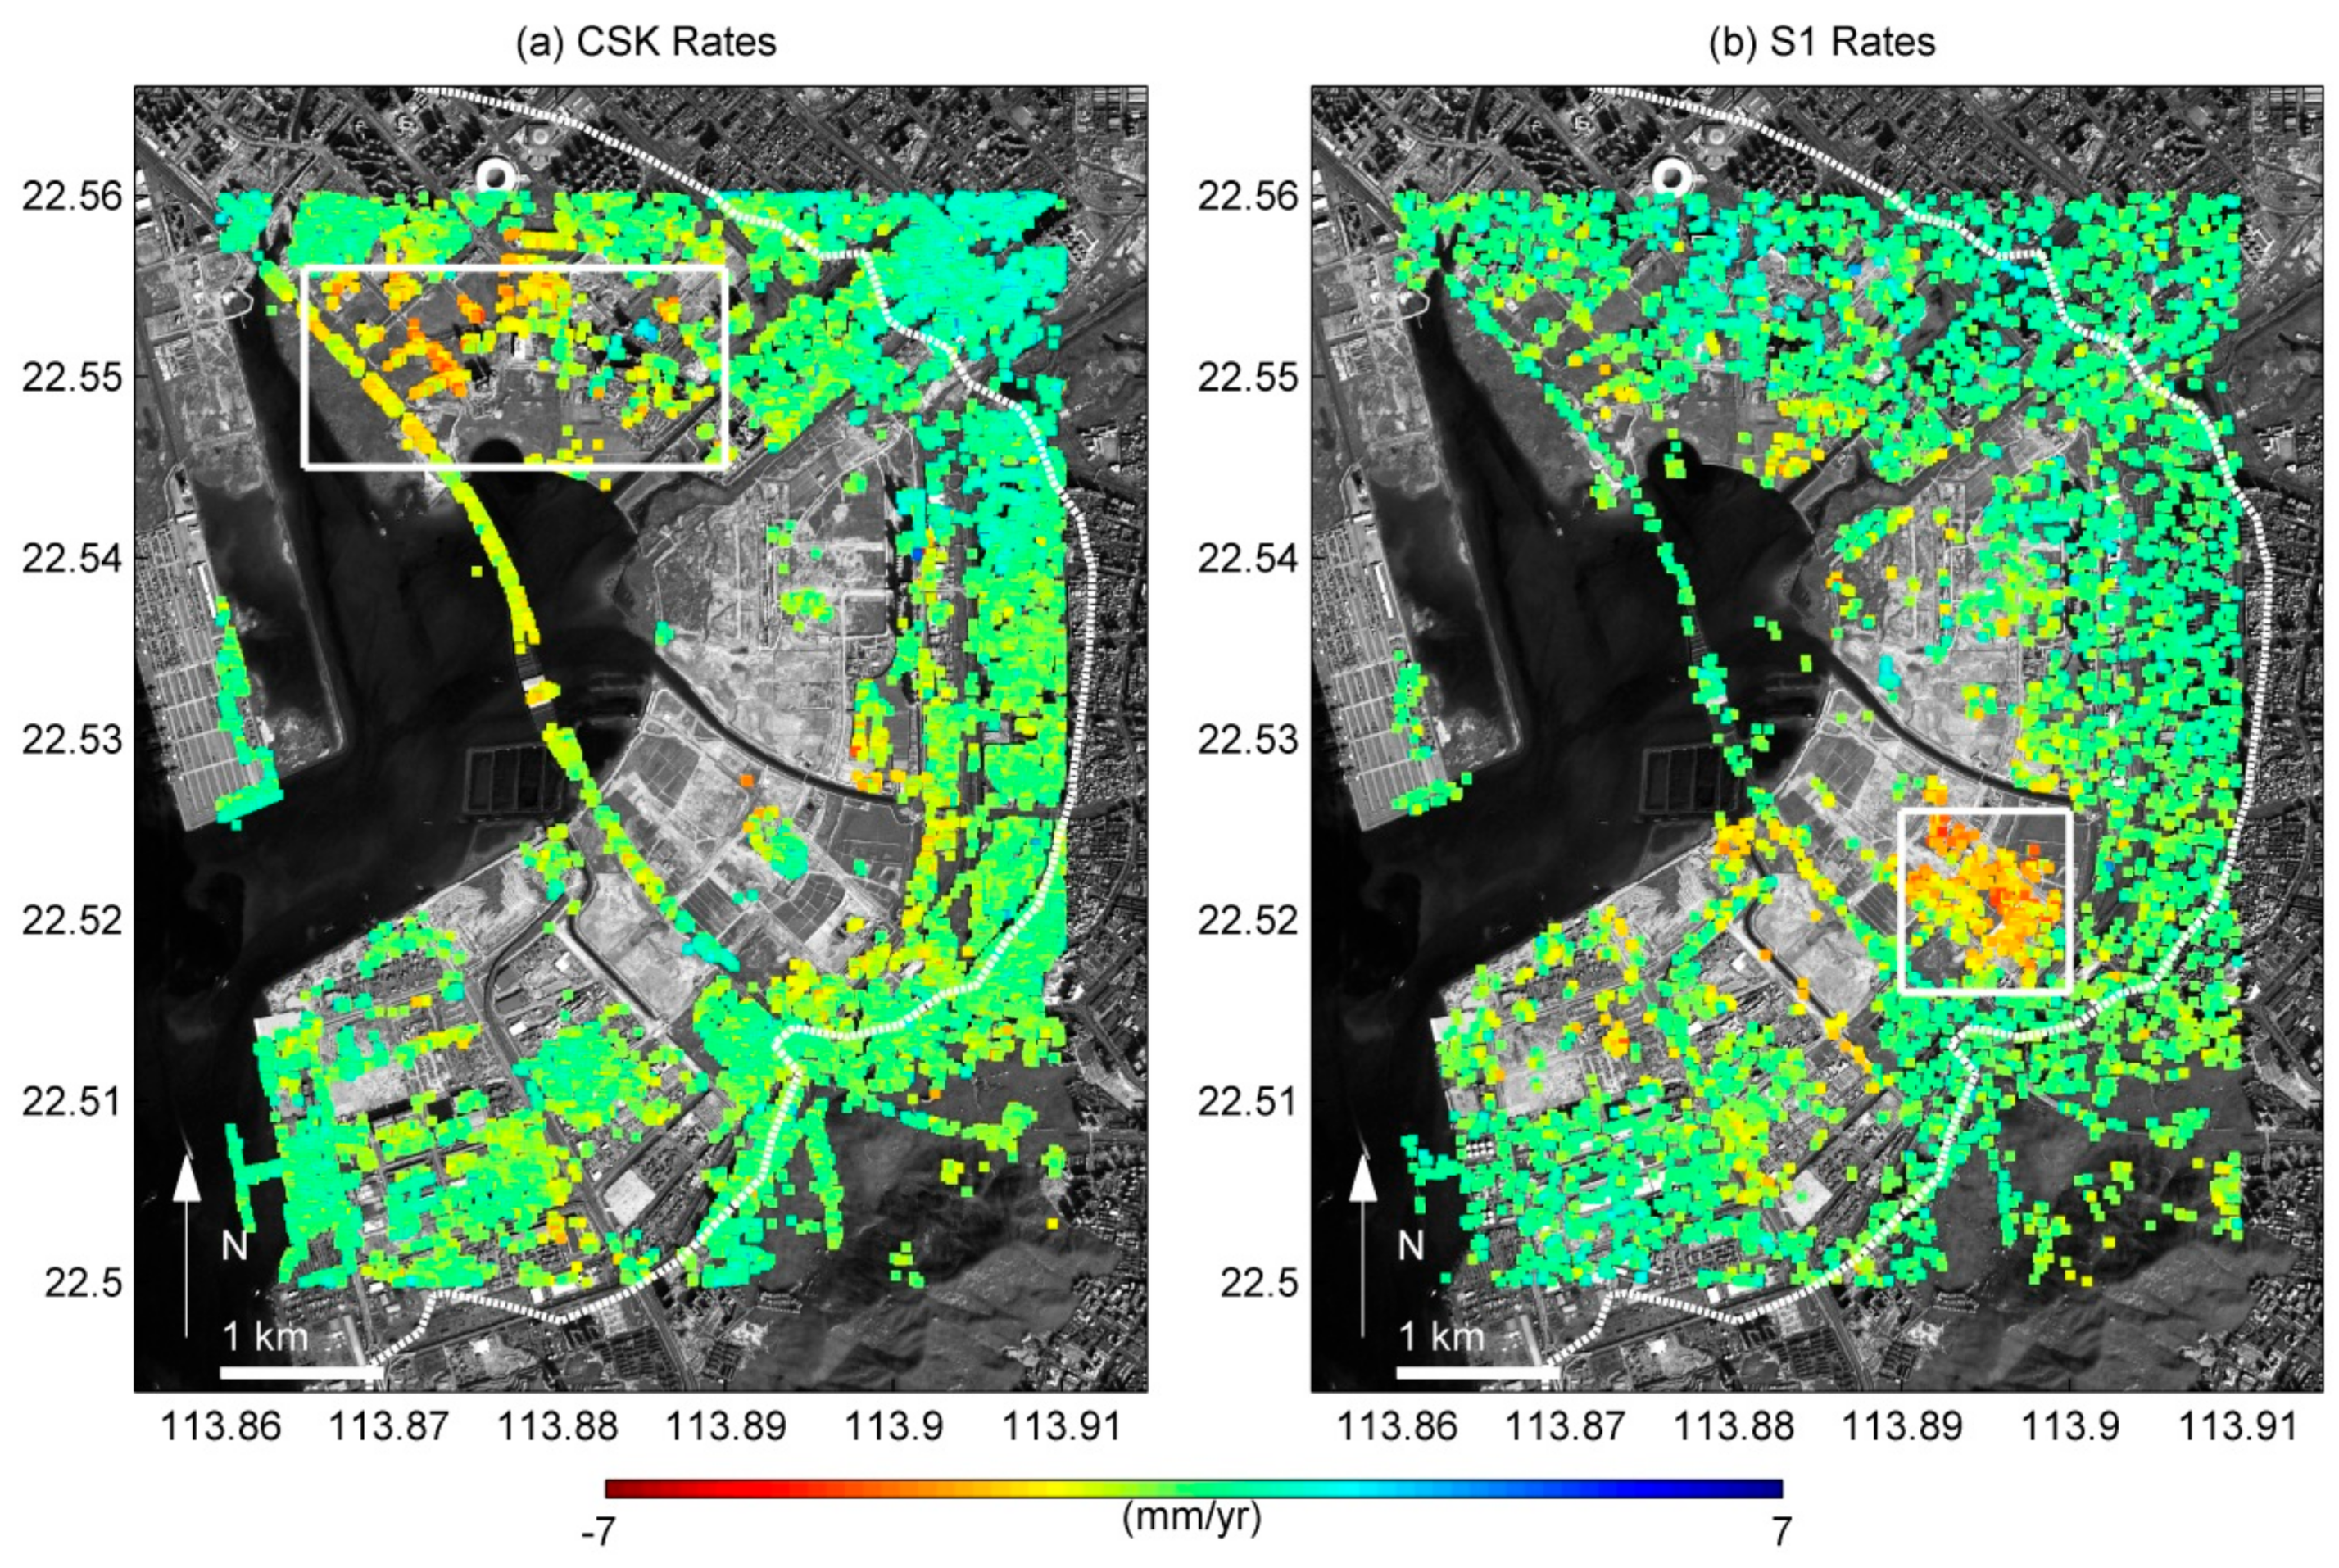
Surrounding the Qianhai Bay, the reclaimed Qianhai area is also called Qianhai Free Trade Zone, which is approved by the State Council in 2012 as a functional area for modern service industries such as finance, modern logistics, and information technology (IT) services. The reclamation in Qianhai area mainly occurred between 1991 and 2005, and the coastline has not changed much since 2005. Occurrence of land subsidence is consistent between ASAR T175 and T025 in Qianhai area (Figure 5). For CSK (7 December 2013–14 January 2016) and S1A (15 June 2015–28 February 2017) results that occupying different periods, their mean rates are expected to be different. For instance, subsidence seen in CSK results in Baohua and Xin’an (rectangle area in Figure 7a) is substantially reduced in S1 result. While a new subsiding area can be identified from S1 result in Zhenhai (rectangle area in Figure 7b). CSK also shows subsidence on Qianhai Bridge, which is a section of the S3 Expressway that crosses over Qianhai Bay. The construction of Qianhai Bridge began in 2010 with its main body completed in 2012, and open to traffic in 2013. The settlement of the Qianhai Bridge on the S3 Expressway is not obvious in the S1 results. It is likely that the displacement of Qianhai Bridge may have stabilized in the period of S1 results. Alternatively, longer wavelength and coarser spatial resolution of S1 images may reduce the sensitivity of S1 images to the displacements of Qianhai Bridge compared with CSK images.
4.2. Subsidence in Houhai
The majority of Houhai is reclaimed from Shenzhen Bay. The reclamation of the Houhai area mainly occurred between 1991 and 2005, and the coastline has not changed much after 2005 akin to the Qianhai area. Subsidence is found in Houhai from CSK results. For instance, the west part of Shenzhen Bay Sports Center (SBSC) exhibited greater settlement rates than its east part (rectangle area in Figure 8a). The foundations of SBSC were laid in February 2009, and the building was completed in middle 2011 as one of the main venues for the 26th World University Summer Games. The SBSC places the three arenas (a multi-use stadium, an indoor arena, and an indoor swimming pool) under a giant perforated external steel skin. Greater subsidence is with the indoor swimming pool. It is unclear whether the observed deformation is related to the subsoil consolidation beneath SBSC or to the internal deformation of its steel skin. The deformation on SBSC is not seen in S1 results. It is likely that the subsidence rates have reduced in the period of S1 results for SBSC. However, it is also probable that S1 results may have missed the subsidence because less pixels are found for SBSC in S1 image than in CSK.
4.3. Subsidence to the South of Bao’an International Airport
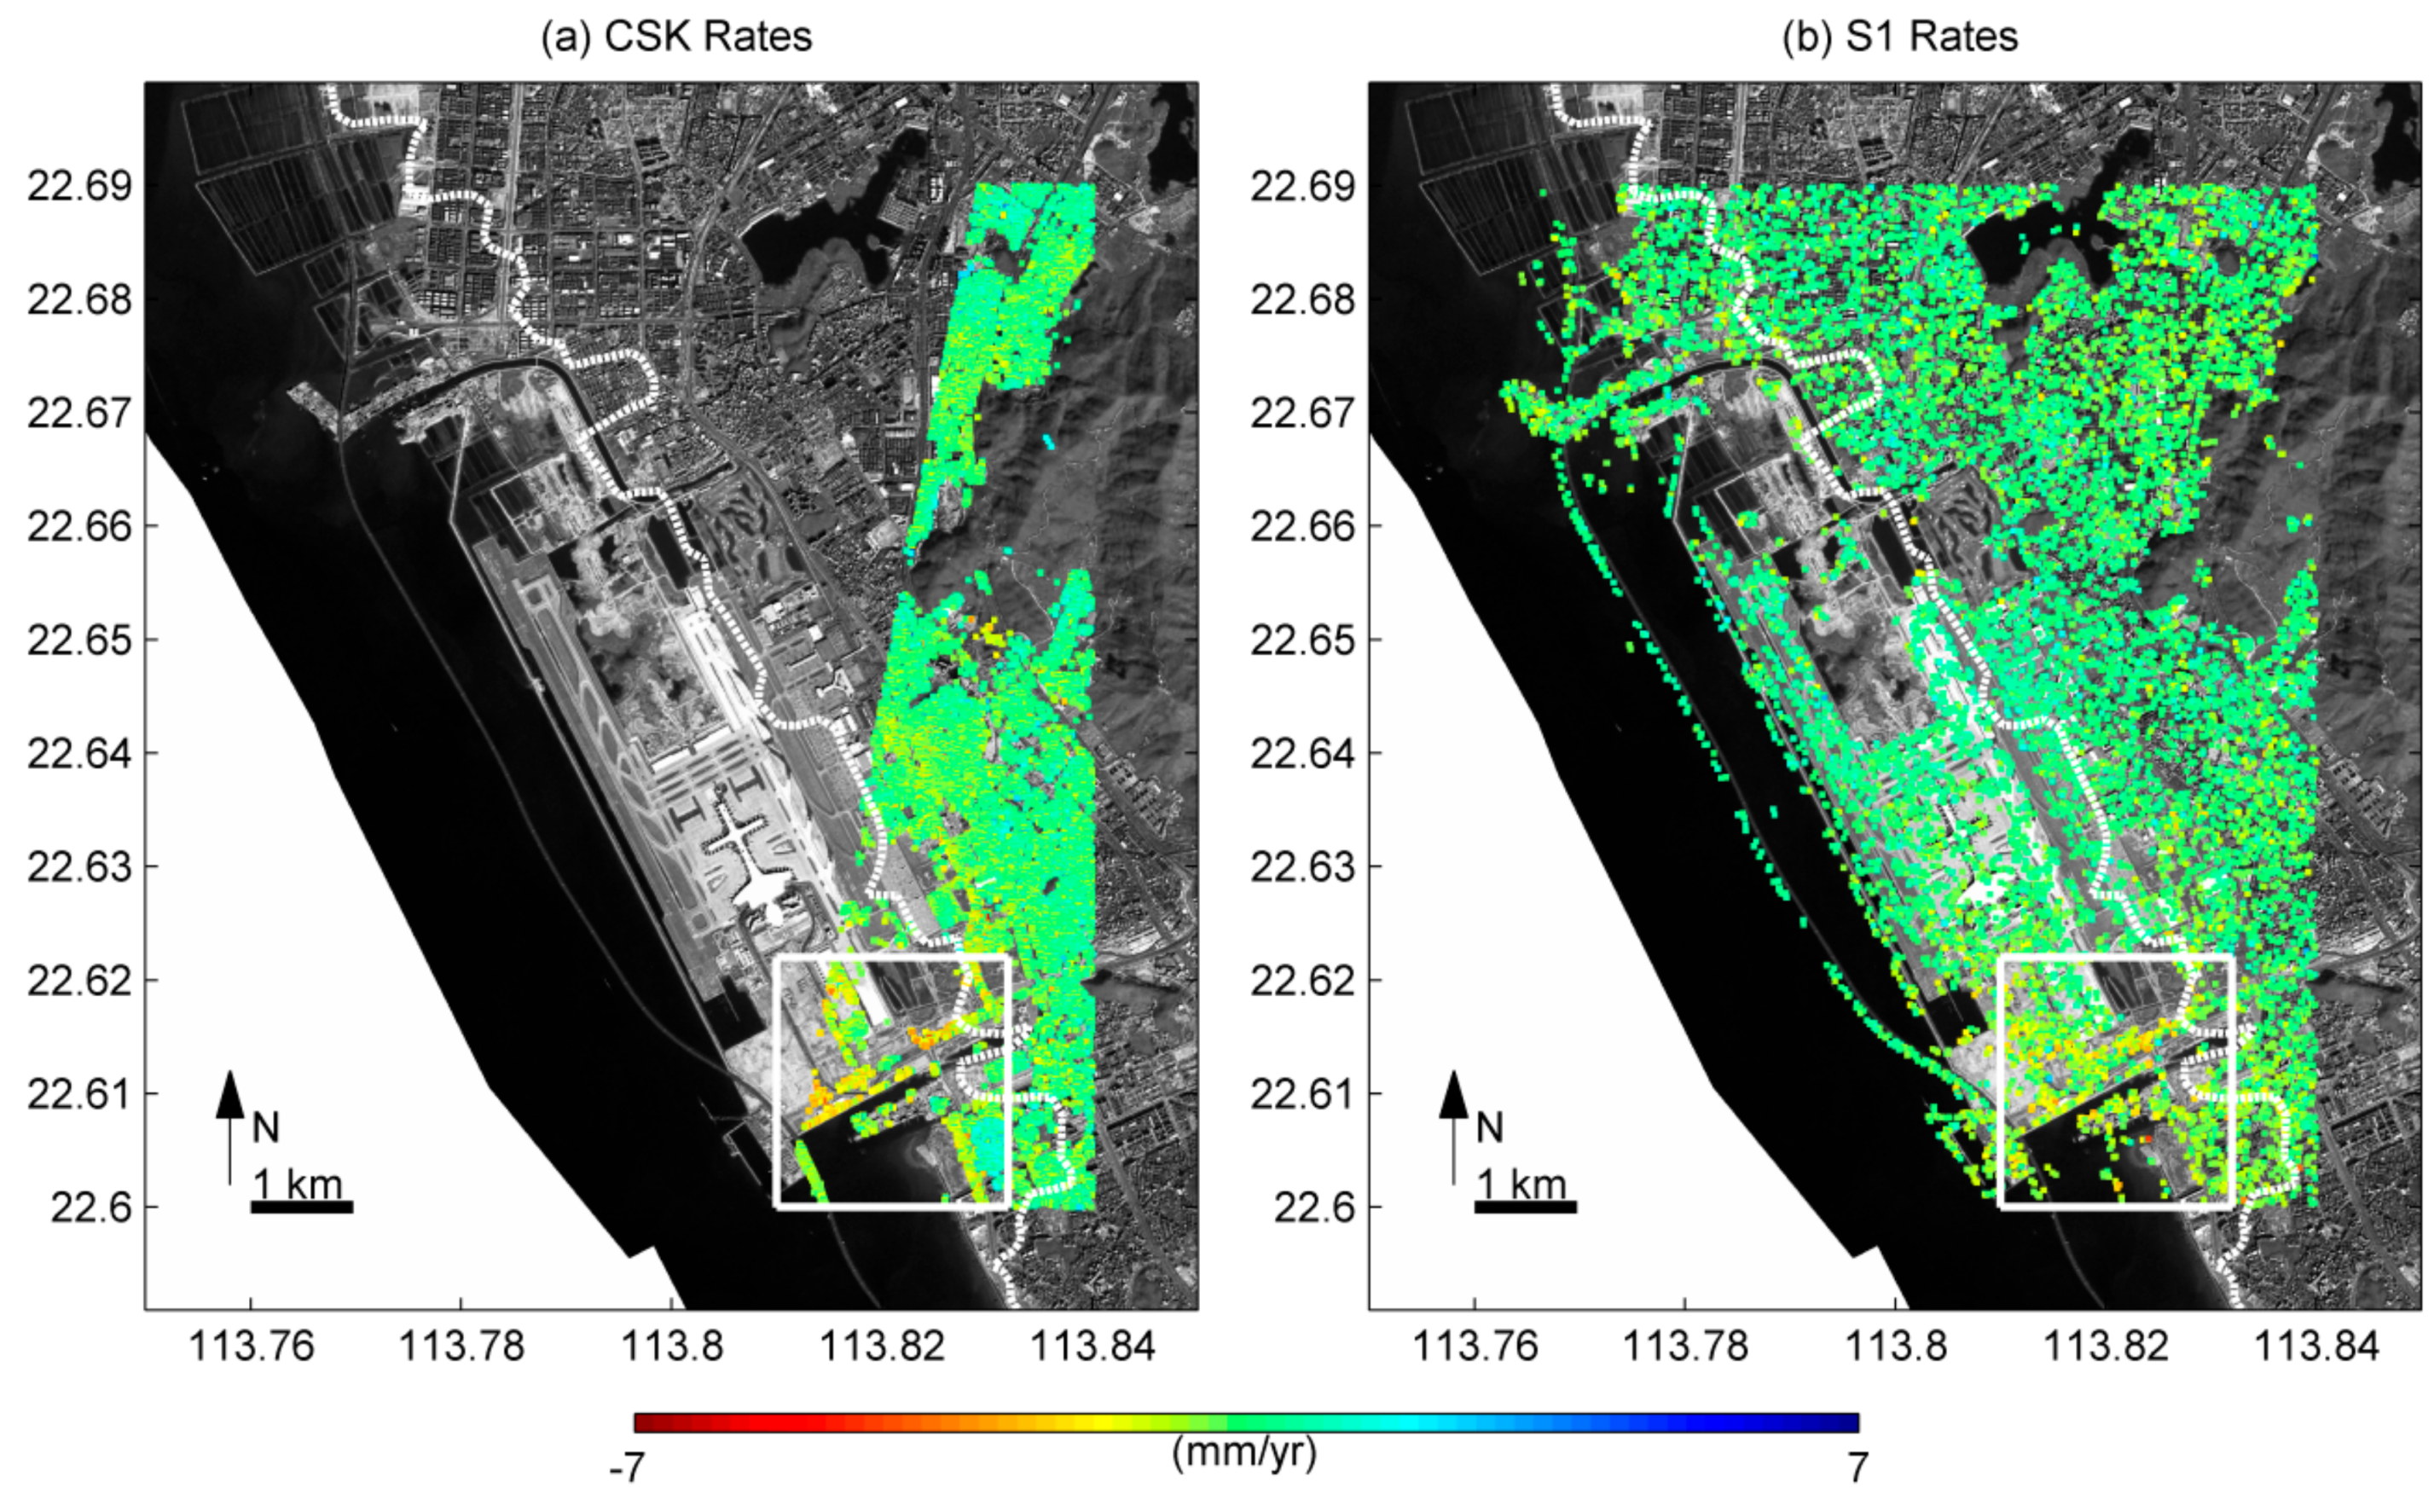
Bao’an International Airport (hereafter referred as SZX) was the 5th busiest airport in China in terms of passengers and 4th in terms of cargo traffic in 2017 [47]. Terminal 1 of SZX was completed and opened in 1991 and renamed as Terminal B in 2004 after refurbishment and expansion. Terminal 2 of SZX was completed in 1998 and renamed as Terminal A in 2004. Both Terminal 1 and Terminal 2 are built on the land that already exists before 1979. Terminal 3 commenced being built in 2008 on land claimed before 2005 and it was opened in 2013. The original runway was built on the land claimed between 1979 and 1991. A second runway was built on land claimed between 2006 and 2008 and it was completed and opened in 2011. CSK image merely covers the southeastern part of SZX. Some subsidence can be found to the south of Terminal 3 from both CSK and S1 results (rectangle area in Figure 9). The subsiding area was mainly claimed after 1991.
4.4. Uplift Signals
Some uplift signals are found in Shajing area from both T025 and T175 results (Figure 10), though they are not seen in CSK or S1 results. The uplift areas are associated with small industrial parks and factories. Massive groundwater use initiated in 1980s and peaked in early 1990s to bridge the gap between water demand and tap water supply in Shenzhen. Despite sufficient supply of tap water in the middle and late 1990s, some factories still use groundwater for lower cost. After 2002, groundwater exploitation is restricted or prohibited in Shenzhen to curb seawater intrusion [48]. It remains unclear whether the uplift signals are related to the changes of groundwater due to the lack of hydrological data.
5. Discussion
5.1. Subsidnce in Land Reclamation Area
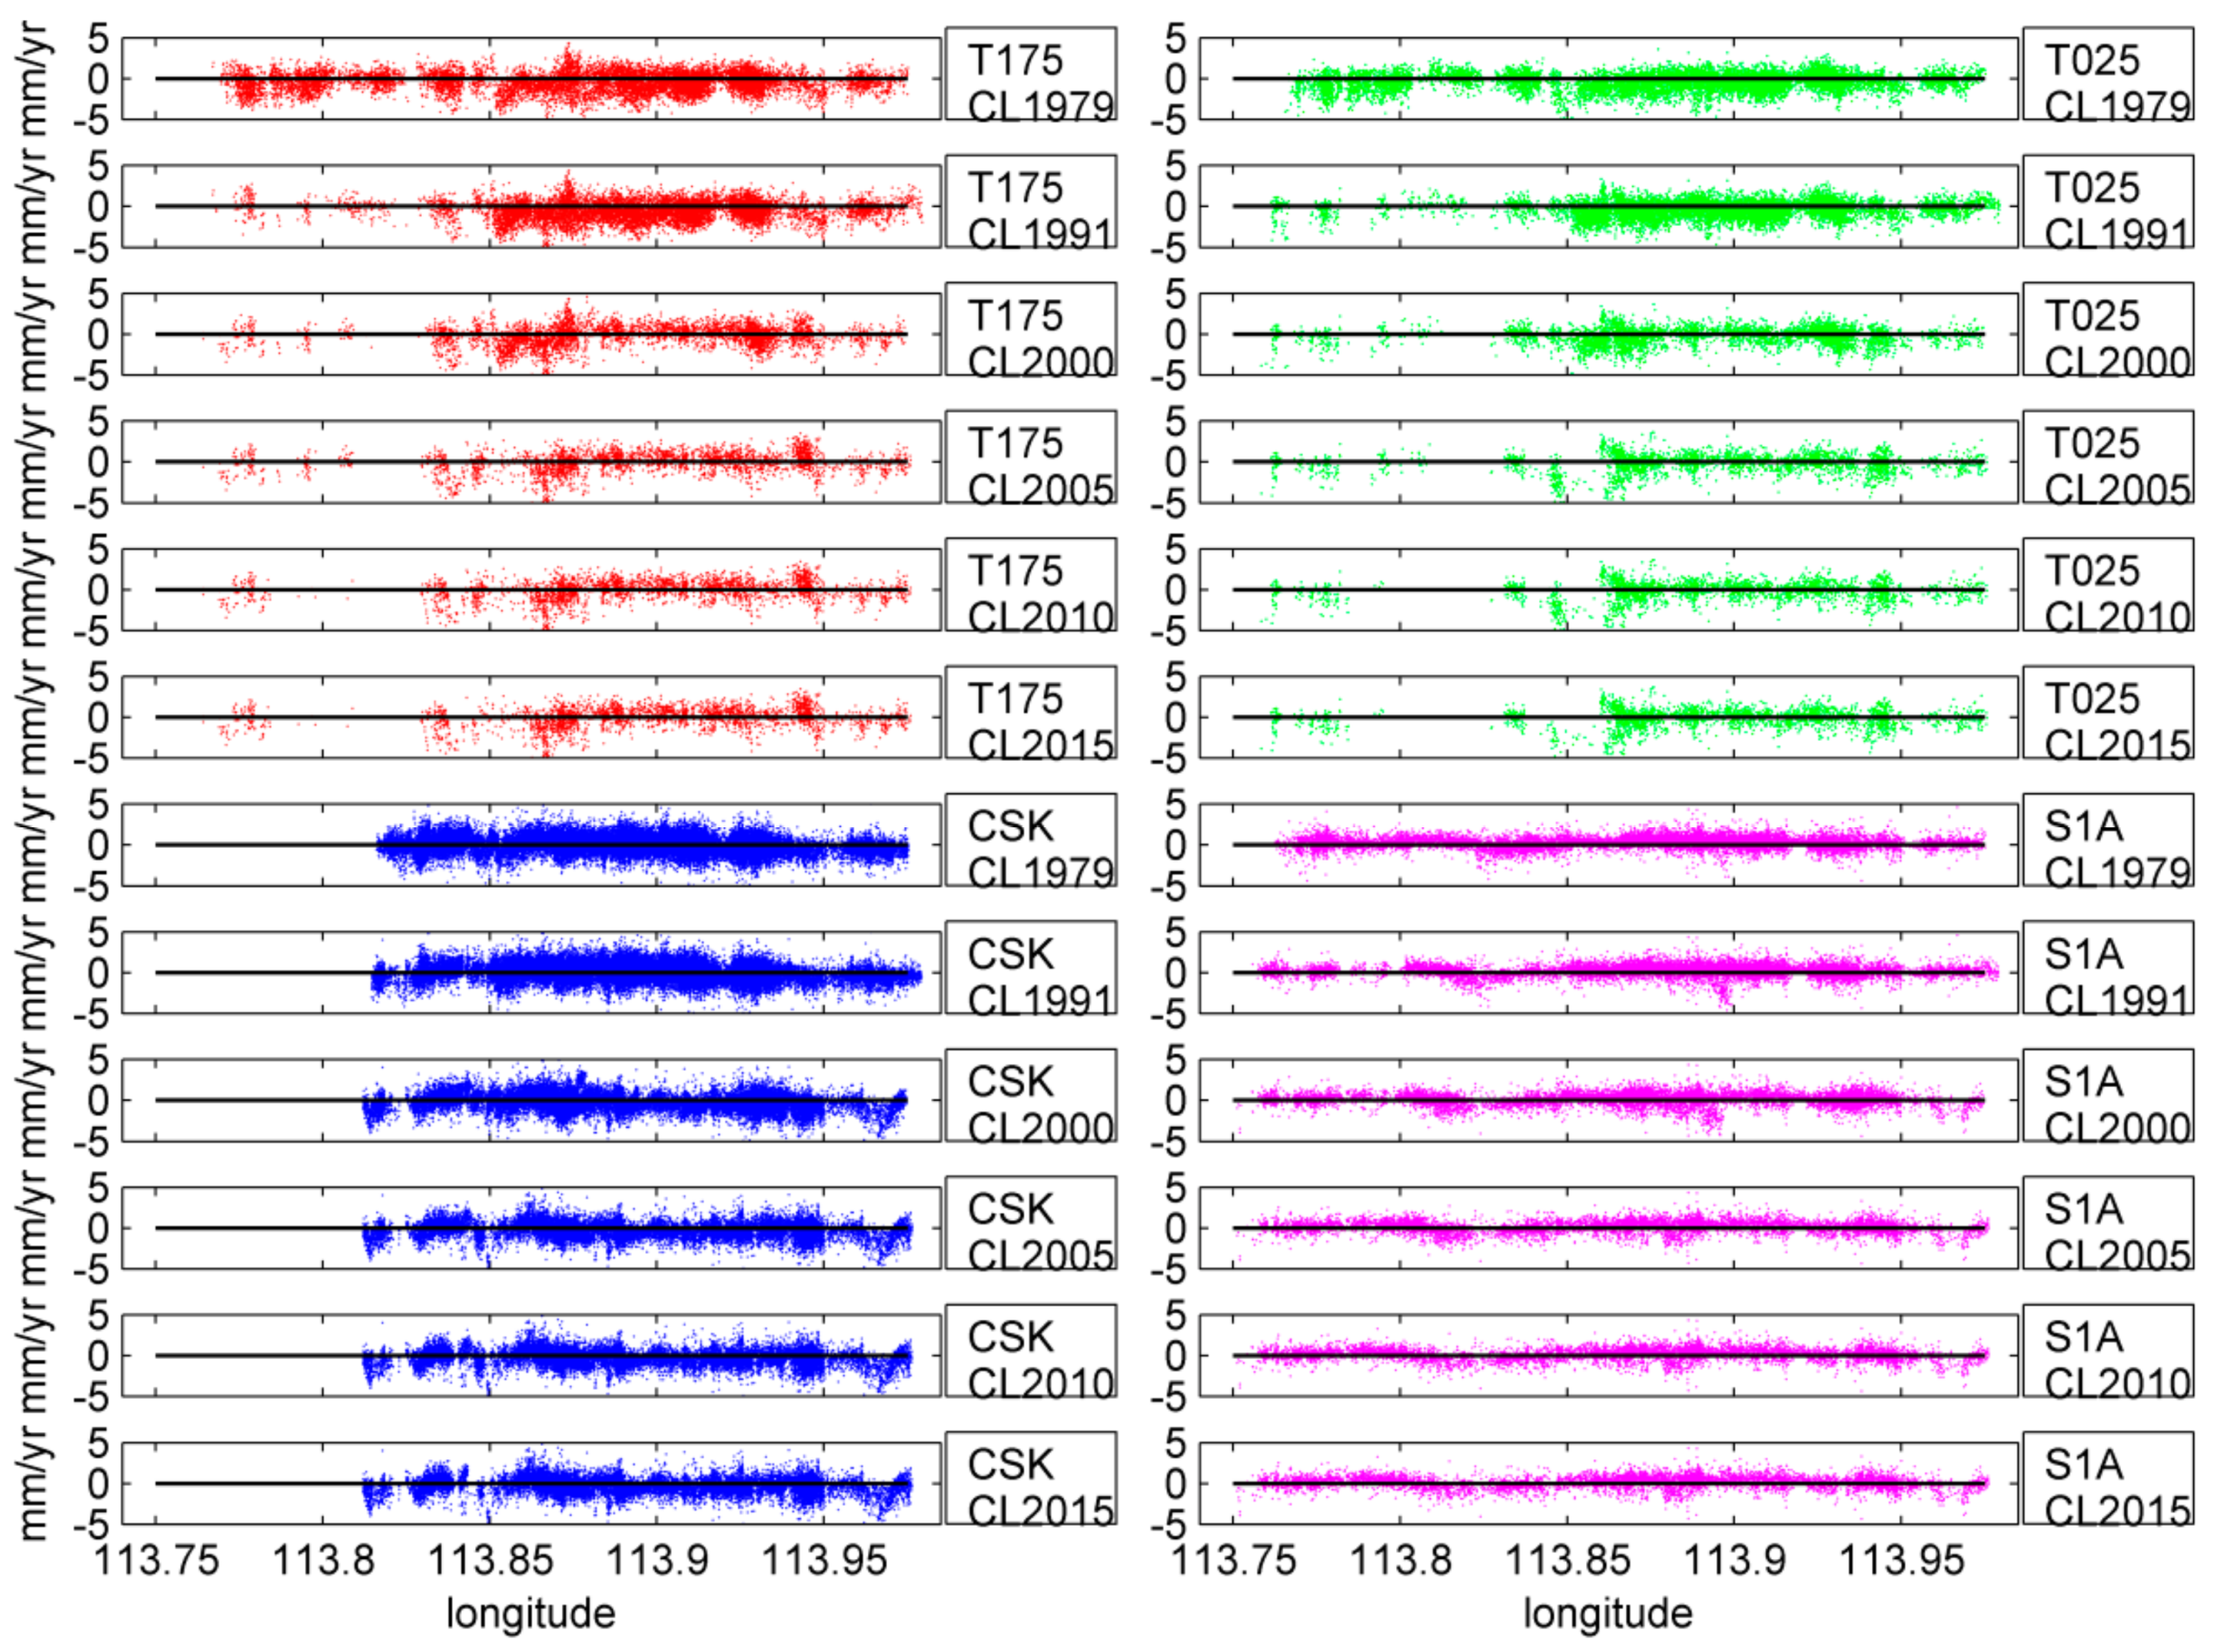
There are fewer PS pixels found in recent coastlines than in previous ones (Figure 11). This can be expected because infrastructure construction in land reclamation area will change the radar backscattering characteristics and therefore reduce the coherence between radar acquisitions. It should be note that coastlines of 1979, 1991, 2000 and 2005 are substantially changed. Compared with the coastline in 2005, the coastline of 2010 is mainly changed in the section of Bao’an International Airport for the runway of its Terminal 3. Coastlines of 2015 and 2010 are quite similar.
Subsidence up to 7 mm/year can be identified along the coastlines from different satellites (Figure 11). Subsidence pattern are consistent between ASAR T175 and T025. Subsidence are detected along the coastlines in Shafu, Fuyong, Gushu, Bihai, Baoti, Fanshen, Qianhai, Houhai, and Huaqiaocheng (Figure 1) from ASAR T175 and T025. Subsidence are seen along the coastlines in Gushu, Bihai, Baohua, Xin’an, Qianhaiwan, Houhai, and Huaqiaocheng from CSK. Subsidence are observed along the coastlines in Gushu, Bihai, Baohua, Linhai, Qianhaiwan, Zhenhai, and Mawan from S1.
5.2. Subsidence along Subways
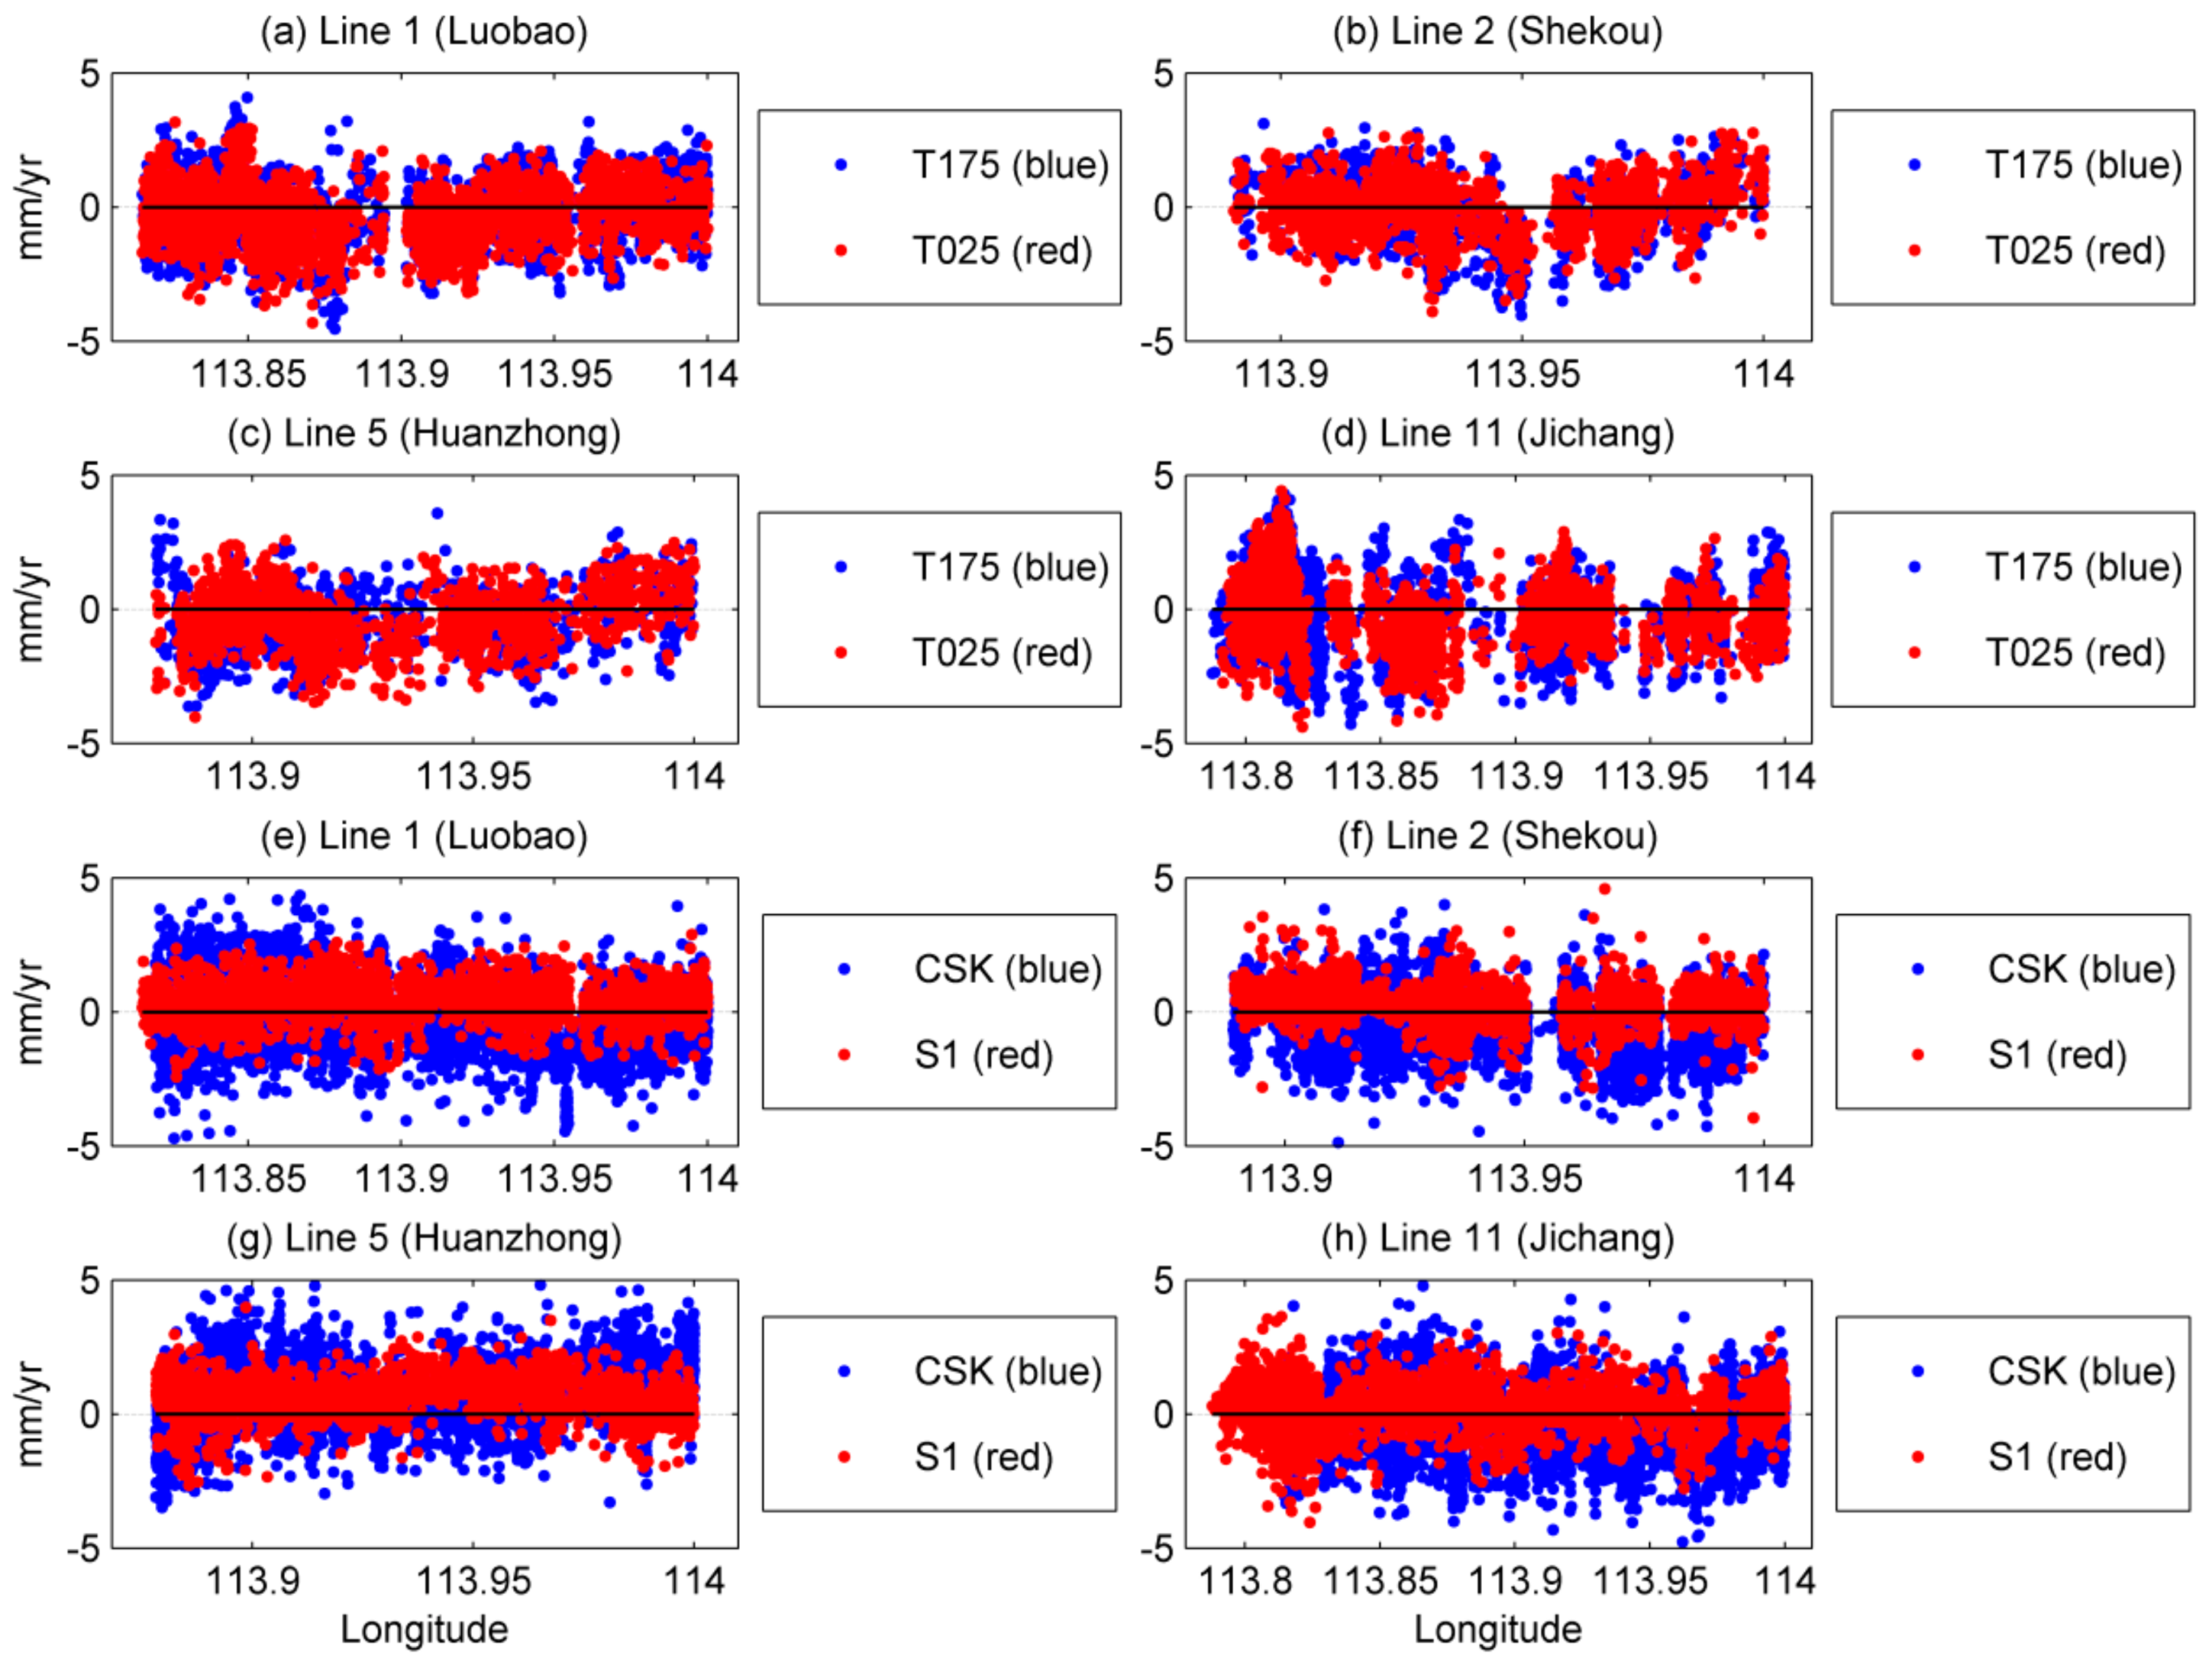
The operating subways in our study area are Line 1 (also known as Luobao Line), Line 2 (also known as Shekou Line), Line 5 (also known as Huanzhong Line), and Line 11 (also known as Jichang Line). Subsidence along Lines 1, 2, 5 and 11 of Shenzhen Metro is typically less than 5 mm/year. Subsidence rates are consistent between T175 and T025. Subsidence rate discrepancies are seen between CSK and S1 with a wider mean rates range for CSK though they still share similar trends. This difference may be caused by a limited overlap between CSK and S1.
Line 1 (Luobao) is the first and also the busiest metro line in Shenzhen with an average daily ridership around 960,000. Construction of Line 1 began on 28 December 1998, with its first segment from Luohu to Window of the World open on 28 December 2004. Section 2 of Line 1 from Window of the World to Shenzhen University was built from late 2004 and open on 28 September 2009. Further extension of Line 1 from Shenzhen University to Airport East began in 30 March 2007 and was completed on 15 June 2011. Along Line 1, there is a subtle increase of subsidence in Qianhai area from T175 and T025 (Figure 12a,b and Figure 13a), though this trend is not seen from CSK or S1 result (Figure 12c,d and Figure 13e). Although the subsidence in Qianhai can result from land reclamation, along Line 1 to the north of its junction with Line 5, there are several pixels with higher rates that can be caused by subway tunneling.
The first segment of Line 2 (Shekou) from Chiwan to Window of the World was built from July 2007 to 28 December 2010. The second segment of Line 2 from Window of the World to Xinxiu was built from December 2007 to 28 June 2011. Along line 2, there is an obvious increase of subsidence approaching Houhai area from T175 and T025 (Figure 12a,b and Figure 13b). This tendency can also be observed from CSK and S1 although with lower rates and gradients (Figure 12c,d and Figure 13f). The observed subsidence along Line 2 in Houhai can be caused by land reclamation or subway tunneling or by both of them.
Section 1 of Line 5 (Huanzhong) from Qianhaiwan to Huangbeiling was built from 21 December 2007 to 22 June 2011. Along Line 5, there is an increase of subsidence in Liuxian area from T175 and T025 (Figure 12a,b and Figure 13c), though this tendency is not seen from CSK or S1 result (Figure 12c,d and Figure 13g). The subsidence along Line 5 in Liuxian can be caused by subway tunneling.
As the first express line of Shenzhen Metro, Line 11 (Jichang) runs about 50% faster than other lines with the speed of 120 km/h. Line 11 from Futian to Bitou was built from April 2012 to 28 June 2016, which is not captured by ASAR T175 or T025. So the displacement seen from ASAR T175 and T025 in Qianhai along Line 11 can be caused by land reclamation and should not be related with subway construction. Along Line 11, S1 result shows subsidence in Songgang area (Figure 12d and Figure 13h). It is unclear if this subsidence is related with subway tunneling as subsidence is also found along Line 11 from T175 (Figure 12a and Figure 13d) in the period before subway construction.
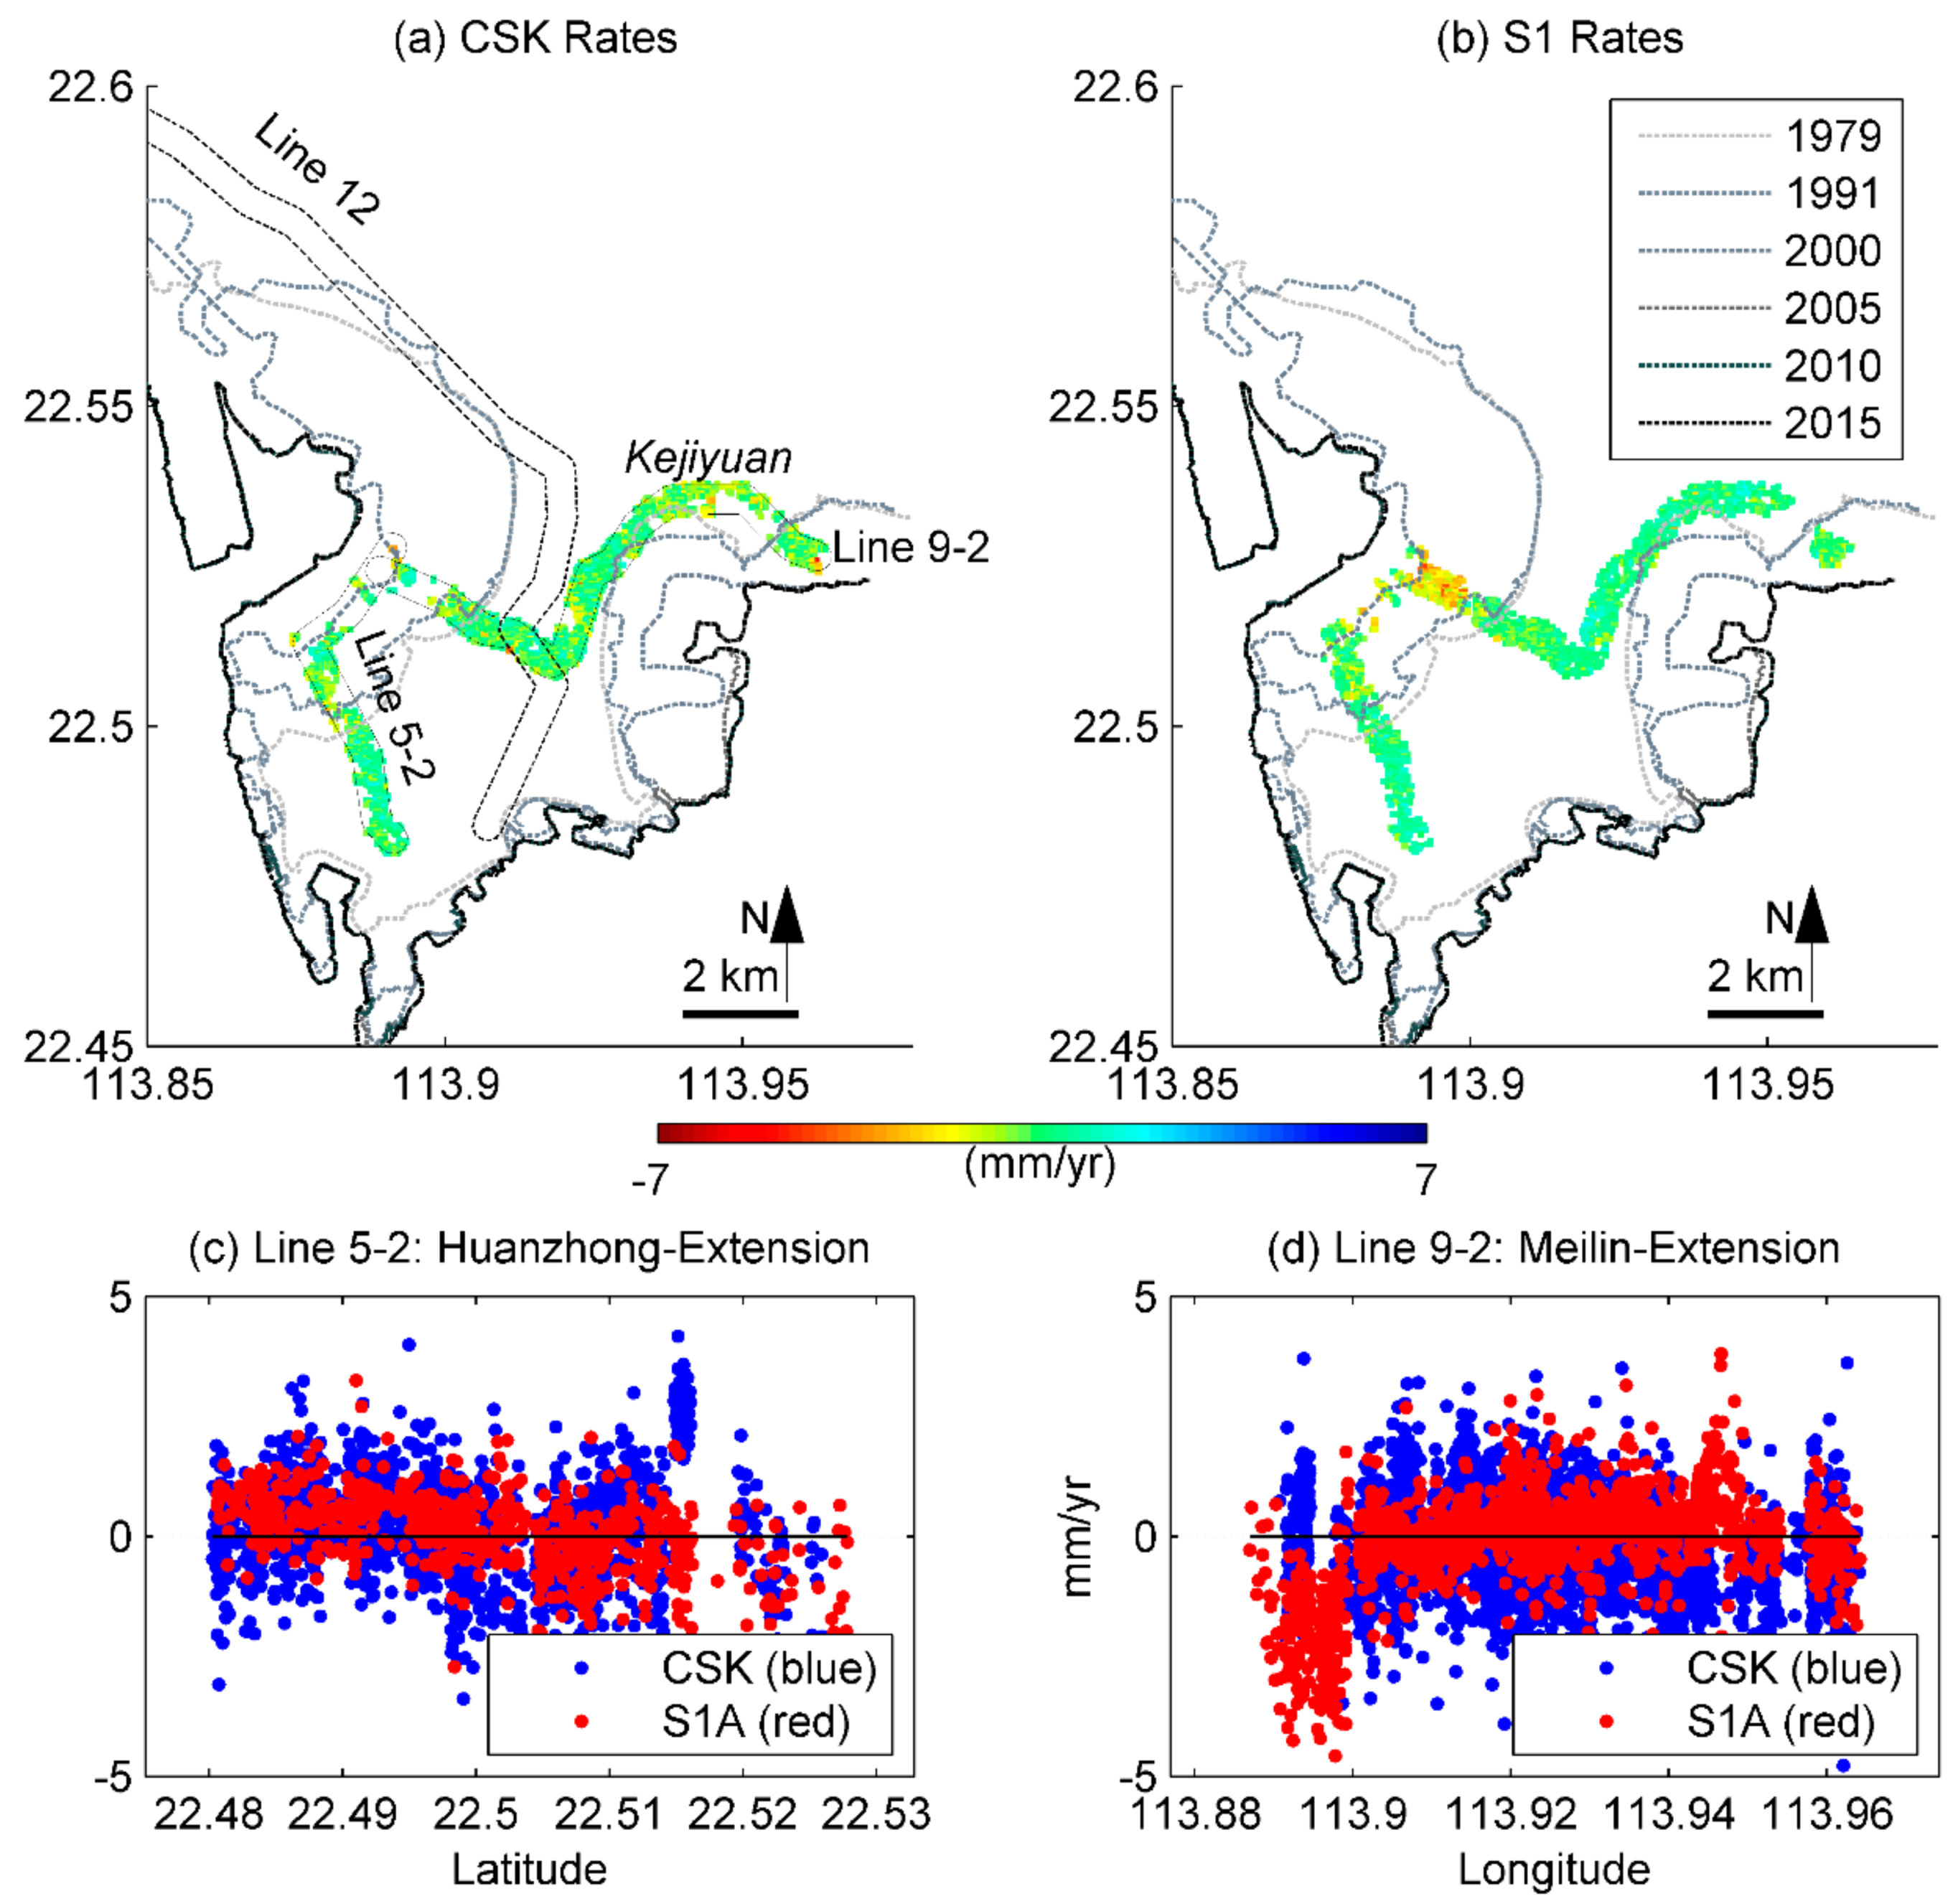
Besides the operating Lines 1, 2, 5, and 11 of Shenzhen Metro, there are still three subway lines, Section 2 of Line 5, Section 2 of Line 9, and Line 12, being built in our study area. Only CSK and S1 images cover their construction periods. Section 2 of Line 5 (hereafter referred as Line 5-2) from Qianhaiwan to Chiwan was built from 6 April 2015 till now. Subsidence can be seen in Qianhai area from CSK and S1 along Line 5-2 (Figure 14a). Because the subsidence along Line 5-2 in Qianhai area is also a land reclamation area, it remains unclear if it is related with subway tunneling.
Section 2 of Line 9 (hereafter referred as Line 9-2) from Hongshuwan to Hanghailu was built from December 2015 till now. One subsidence is seen from CSK when Line 9-2 crosses Kejiyuan area (Figure 14a) beneath Baishi Road. This subsidence is not seen in S1. The subsidence observed along Line 9-2 in Kejiyuan can be related with subway tunneling. Another subsidence can be seen along Line 9-2 in Qianhai area from S1 (Figure 14b). The S1 rates are higher than the CSK rates along Line 9-2 in Qianhai area. Since there is a trend of increasing subsidence from CSK to S1 result (Figure 14d), this subsidence can be related with tunneling.
A section of Line 12 (Figure 14a) from Nanyou to Haishangshijie was built from November 2017 till now. The route of Line 12 is shown without showing displacement rates because the construction of Line 12 began about 9 months after the last S1 image used in our study. New images should be used to obtain the displacement along Line 12.
Generally, subsidence along subway lines of Shenzhen Metro is observed. Some subsidence along subways coincides with land reclamation area and such subsidence can be driven by subsoil consolidation or subway tunneling or by both of them.
5.3. Seasonal Displacements and Precipitation
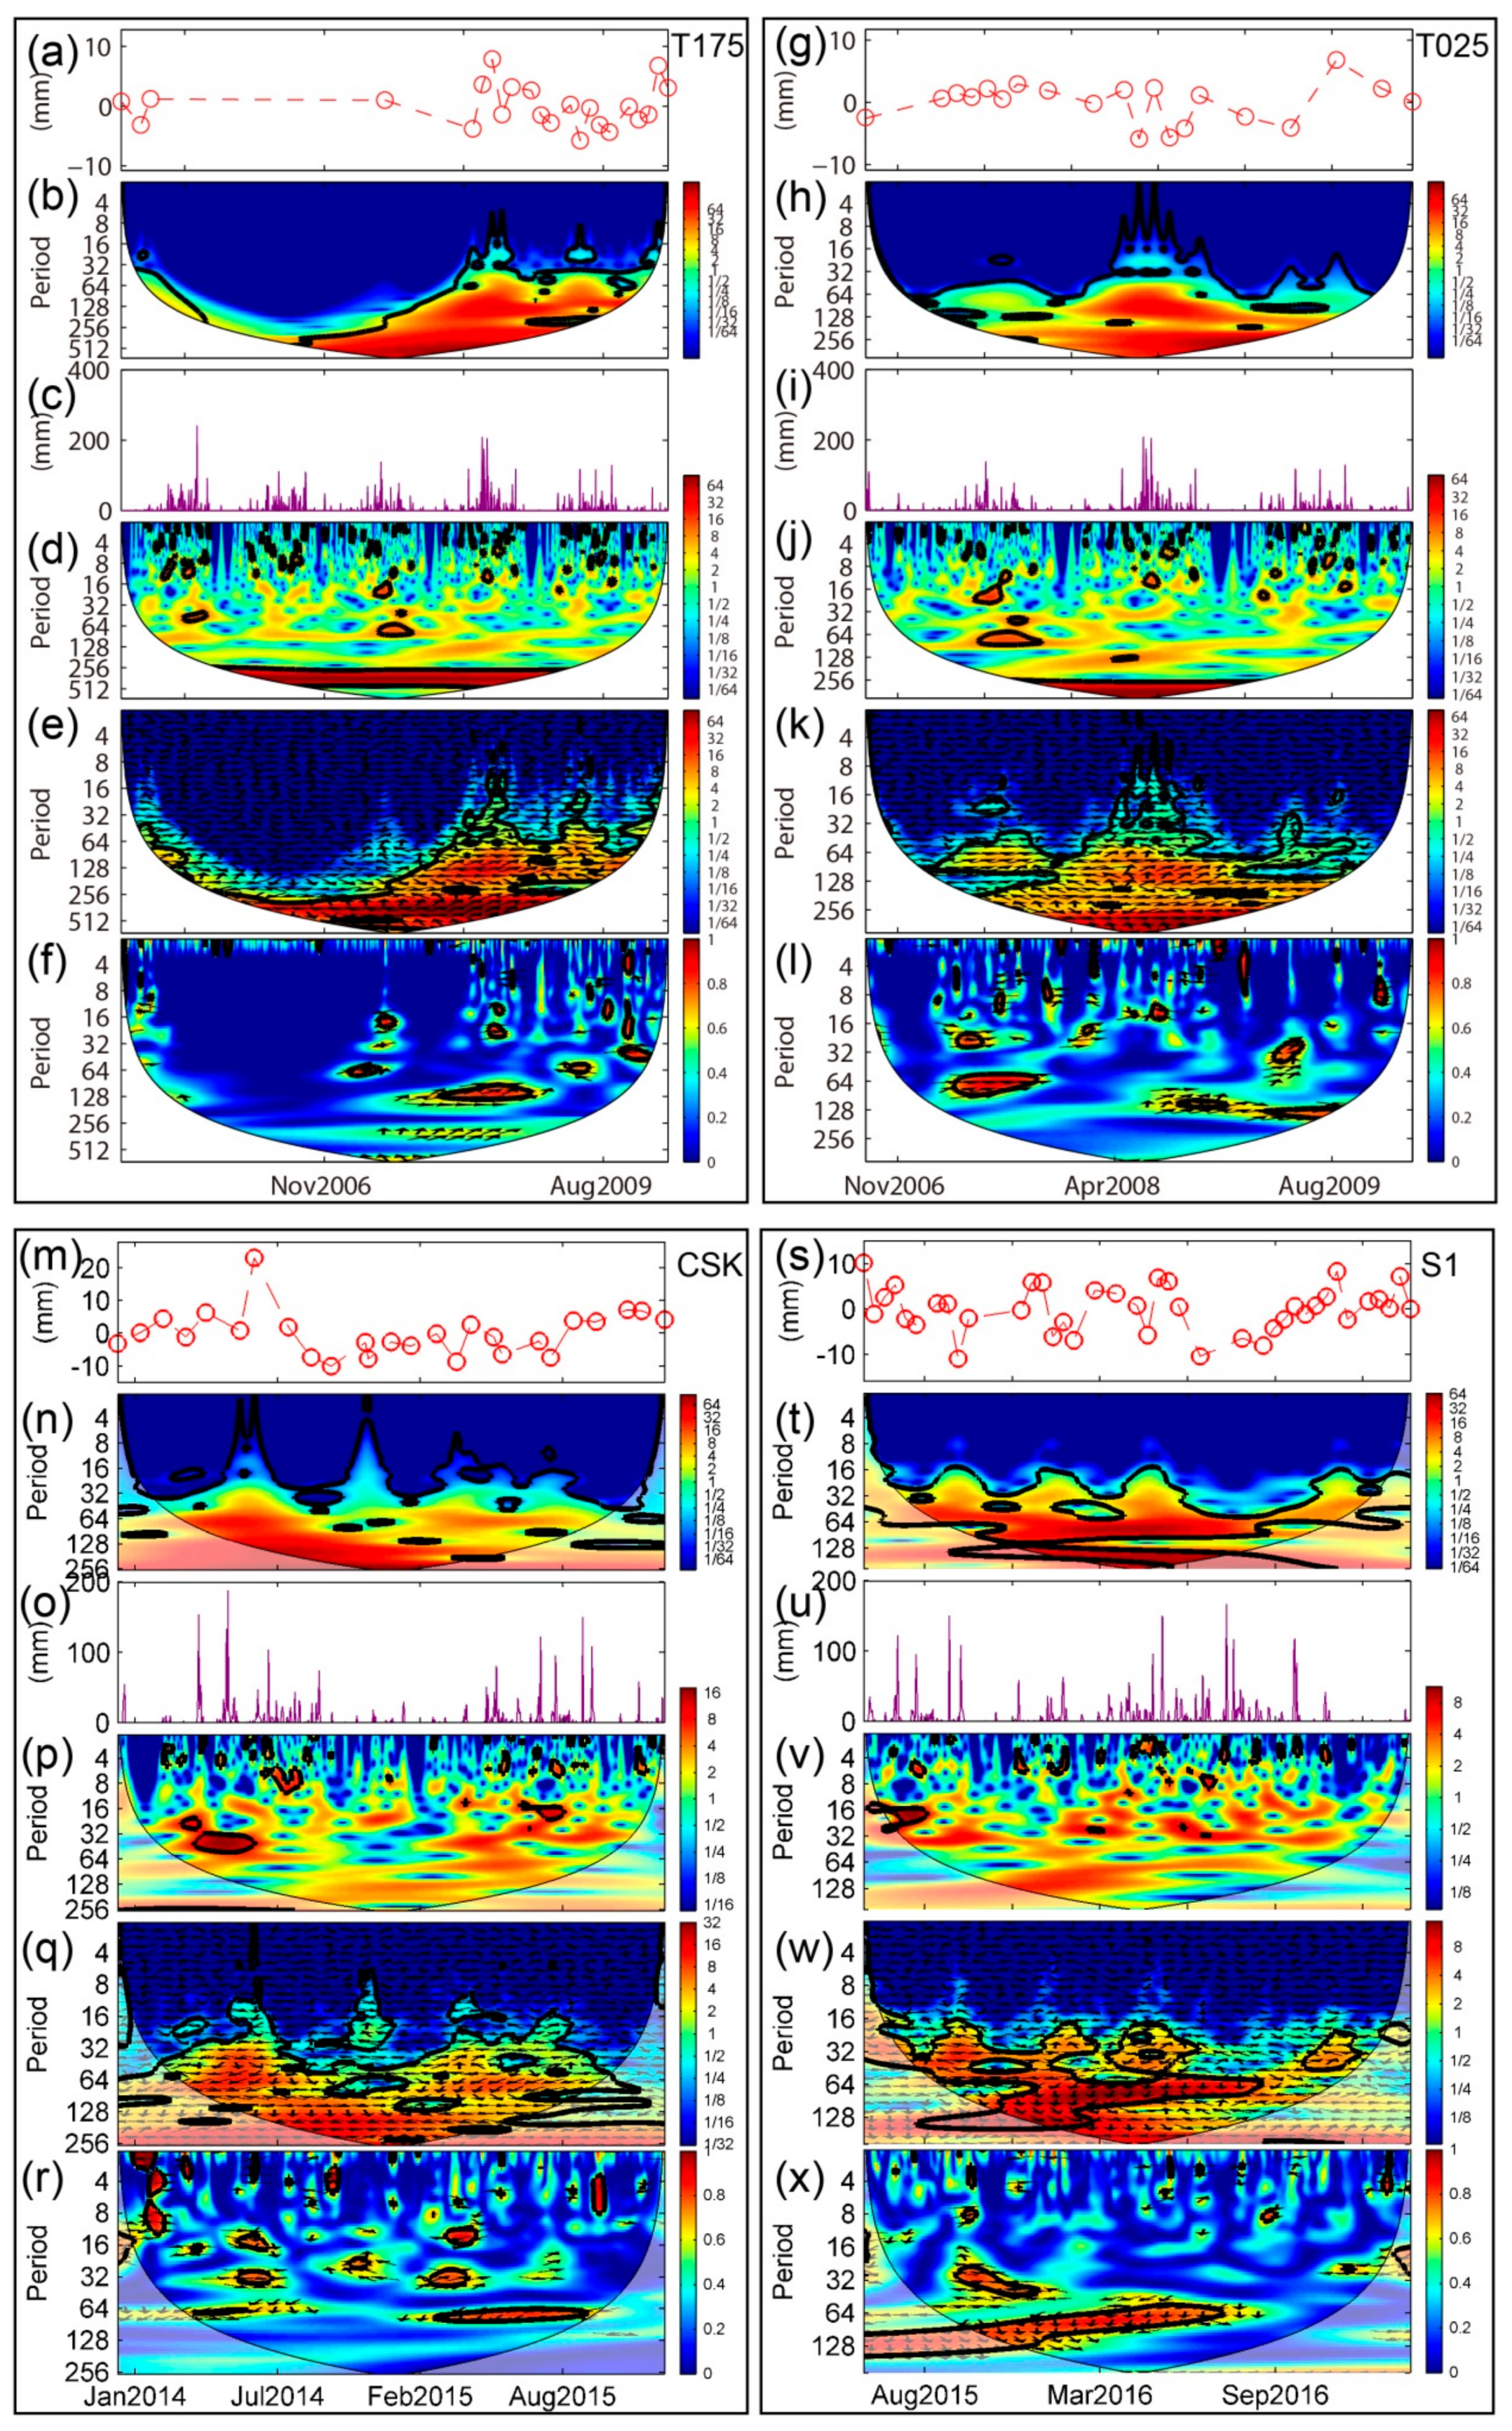
Wavelet tools are used to analyze the seasonal displacements observed from ASAR T025, ASAR T175, CKS and S1, and the associations between displacements and precipitation time series at Point P1 (Figure 5b). Continuous wavelet transform (CWT), cross wavelet transform (XWT), and wavelet coherence (WTC) are used in this study. One dimensional InSAR time series is decomposed into two dimensional time frequency space by CWT to determine the local periodicities of seasonal variations [49]. The common power and relative phase between the two time series are indicated by the cross wavelet transform (XWT) and wavelet coherence (WTC) tools [32,50].
Linear component of InSAR displacements is estimated by least square method and subtracted from the time series. The satellite image number is limited, and down sampling of water level time series at image acquisition time results in very coarse power spectrum. Oppositely, the non-linear component of Envisat displacement is over sampled by linear interpolation at water level time. However, the interpolation also reduces the accuracy of displacements. Precipitation time series is given daily spanning the period 2004–2017.
For ASAR T175 time series, no effective cycle can be observed from CWT analysis (Figure 15b). Precipitation time series show periodicities in the 256–512 day band through 2006–2008 from CWT analysis (Figure 15d). XWT analysis shows a phase rotation from about 45° in phase in the 64–128 day band to about 135° in phase in the 128–256 day band between 24 June 2007 (4th image) and 21 September 2008 (9th image) (Figure 15e). Abrupt phase changes occur around the 128 day band. This implies strong seasonal variations occur between the 4th and 9th images. Actually, the period between the 5th image (4 May 2008) and the 9th image (21 September 2008) corresponds to the rainy season in Shenzhen. The pattern of seasonal displacements (Figure 15a) between the 5th and 9th image generally resembles the daily precipitation time series (Figure 15c). WTC analysis shows about 45° in phase in the 64–128 day band between the 5th and 9th image (Figure 15f). It means the precipitation leads seasonal displacements by 8–16 days (1–2 weeks) in that period.
For ASAR T025 time series, no effective cycle can be observed from CWT analysis either (Figure 15g). Precipitation time series show periodicities in cycles above 256 day band (Figure 15j). XWT analysis shows a phase rotation from about 45° in phase below the 128 day band to about 135° in phase above the 128 day band between 28 May 2008 (11th image) and 15 October 2008 (15th image) (Figure 15k). This implies strong seasonality between the 11th and 15th images. The displacements pattern (Figure 15g) between the 11th image and 15th image generally follows the daily precipitation time series (Figure 15i). WTC analysis shows about 45° in phase in the 128 day band between the 6 August 2008 (13th image) and 28 January 2009 (16th image) (Figure 15l). It means the precipitation leads seasonal displacements by about 16 days (2 weeks) in that period. The lead from T025 is consistent with the lead seen from T175 in 2008. WTC analysis also shows about 90° in phase in the 64 day band in an earlier period between 28 February 2007 (2nd image) and 22 August 2007 (7th image). It also means the precipitation leads seasonal displacements by about 16 days too.
For CSK and precipitation time series, no effective cycle can be observed from CWT analysis (Figure 15n,p). A relatively short period of time for CSK (7 December 2013 to 14 January 2016) may have caused this. XWT and CWT analyses show 120° out of phase near the 64 day band, in periods between 13 March 2014 (4th image) and 17 June 2014 (7th image), and between 17 April 2015 (17th image) and 22 July 2015 (20th image) (Figure 15q,r). This means the displacements leads precipitation by more than 21 days. The unrealistic lead by displacements over precipitation may be caused by adjacent local precipitation peaks (Figure 15o). Oppositely, the CWT analysis also shows 90° in phase in the 32 day band, in periods between 28 May 2014 (6th image) and 4 August 2014 (8th image) and between 28 February 2015 (15th image) and 17 April 2015 (17th image) (Figure 15r). It means the precipitation leads the displacements by about 8 days (1 week) for the two periods. A rise from (28 May 2014) 6th image to (17 June 2014) 7th image is observed from CSK seasonal displacements (Figure 15m). The cumulative rainfall in May 2014 in Shenzhen is 545 mm, of which the one on 11 May 2014 with 188 mm rainfall in a single day is the highest daily record since 2008. The dense precipitation in May could have triggered the land rise.
For S1 and precipitation time series, no effective cycle is exhibited from CWT analysis (Figure 15t,v). XWT and CWT analyses show both 180° in phase and out of phase signals in the 64–128 day band between 13 October 2015 (10th image) and 20 August 2016 (25th image) (Figure 15w,x). Hence it is difficult to draw a conclusion on which time series of the two lead the other one. However, the associations between seasonal displacement pattern and precipitation pattern can be identified (Figure 15s,u). For instance, the land rise between 4 May 2016 (20th image) and 16 May 2016 (21st image) are likely to be caused by contemporary precipitation. A consistent rise from the 13 September 2016 (26th image) to 6 December 2016 (33rd image) can be seen (Figure 15s) when the precipitation decreases gradually from 26th image to 28th image (Figure 15u) before the high precipitation around 29th image. It remains unclear which factors account for this land rise. Further analysis is in need of water level records to see the net effects of precipitation and evaporation changes.
5.4. Seasonal Displacements and Tidal Levels
Ocean tidal loading (OTL) is significant in many coastal regions as the elastic response of the Earth to the redistribution of water mass from the ocean tides [52]. OTL displacements are already observed by GPS [53]. The variation of ocean tides in seafloor pressure will cause Earth surface displacements up to several centimeters. A predicted differential InSAR study has shown that OTL displacement is comparable to both InSAR accuracy and displacement rates for targets near coastlines with a predicted OTL displacement gradient of 3 cm per 100 km till 200 km away from the coast [54]. Another study eliminates OTL effect in Differential InSAR interferogram using FES2004 tide model after the estimation of orbit errors using GPS precise point positioning (PPP) [55]. However, GPS stations are not usually available and the global ocean models are not always accurate in offshore areas due to complicated coastline and seafloor relief [56].
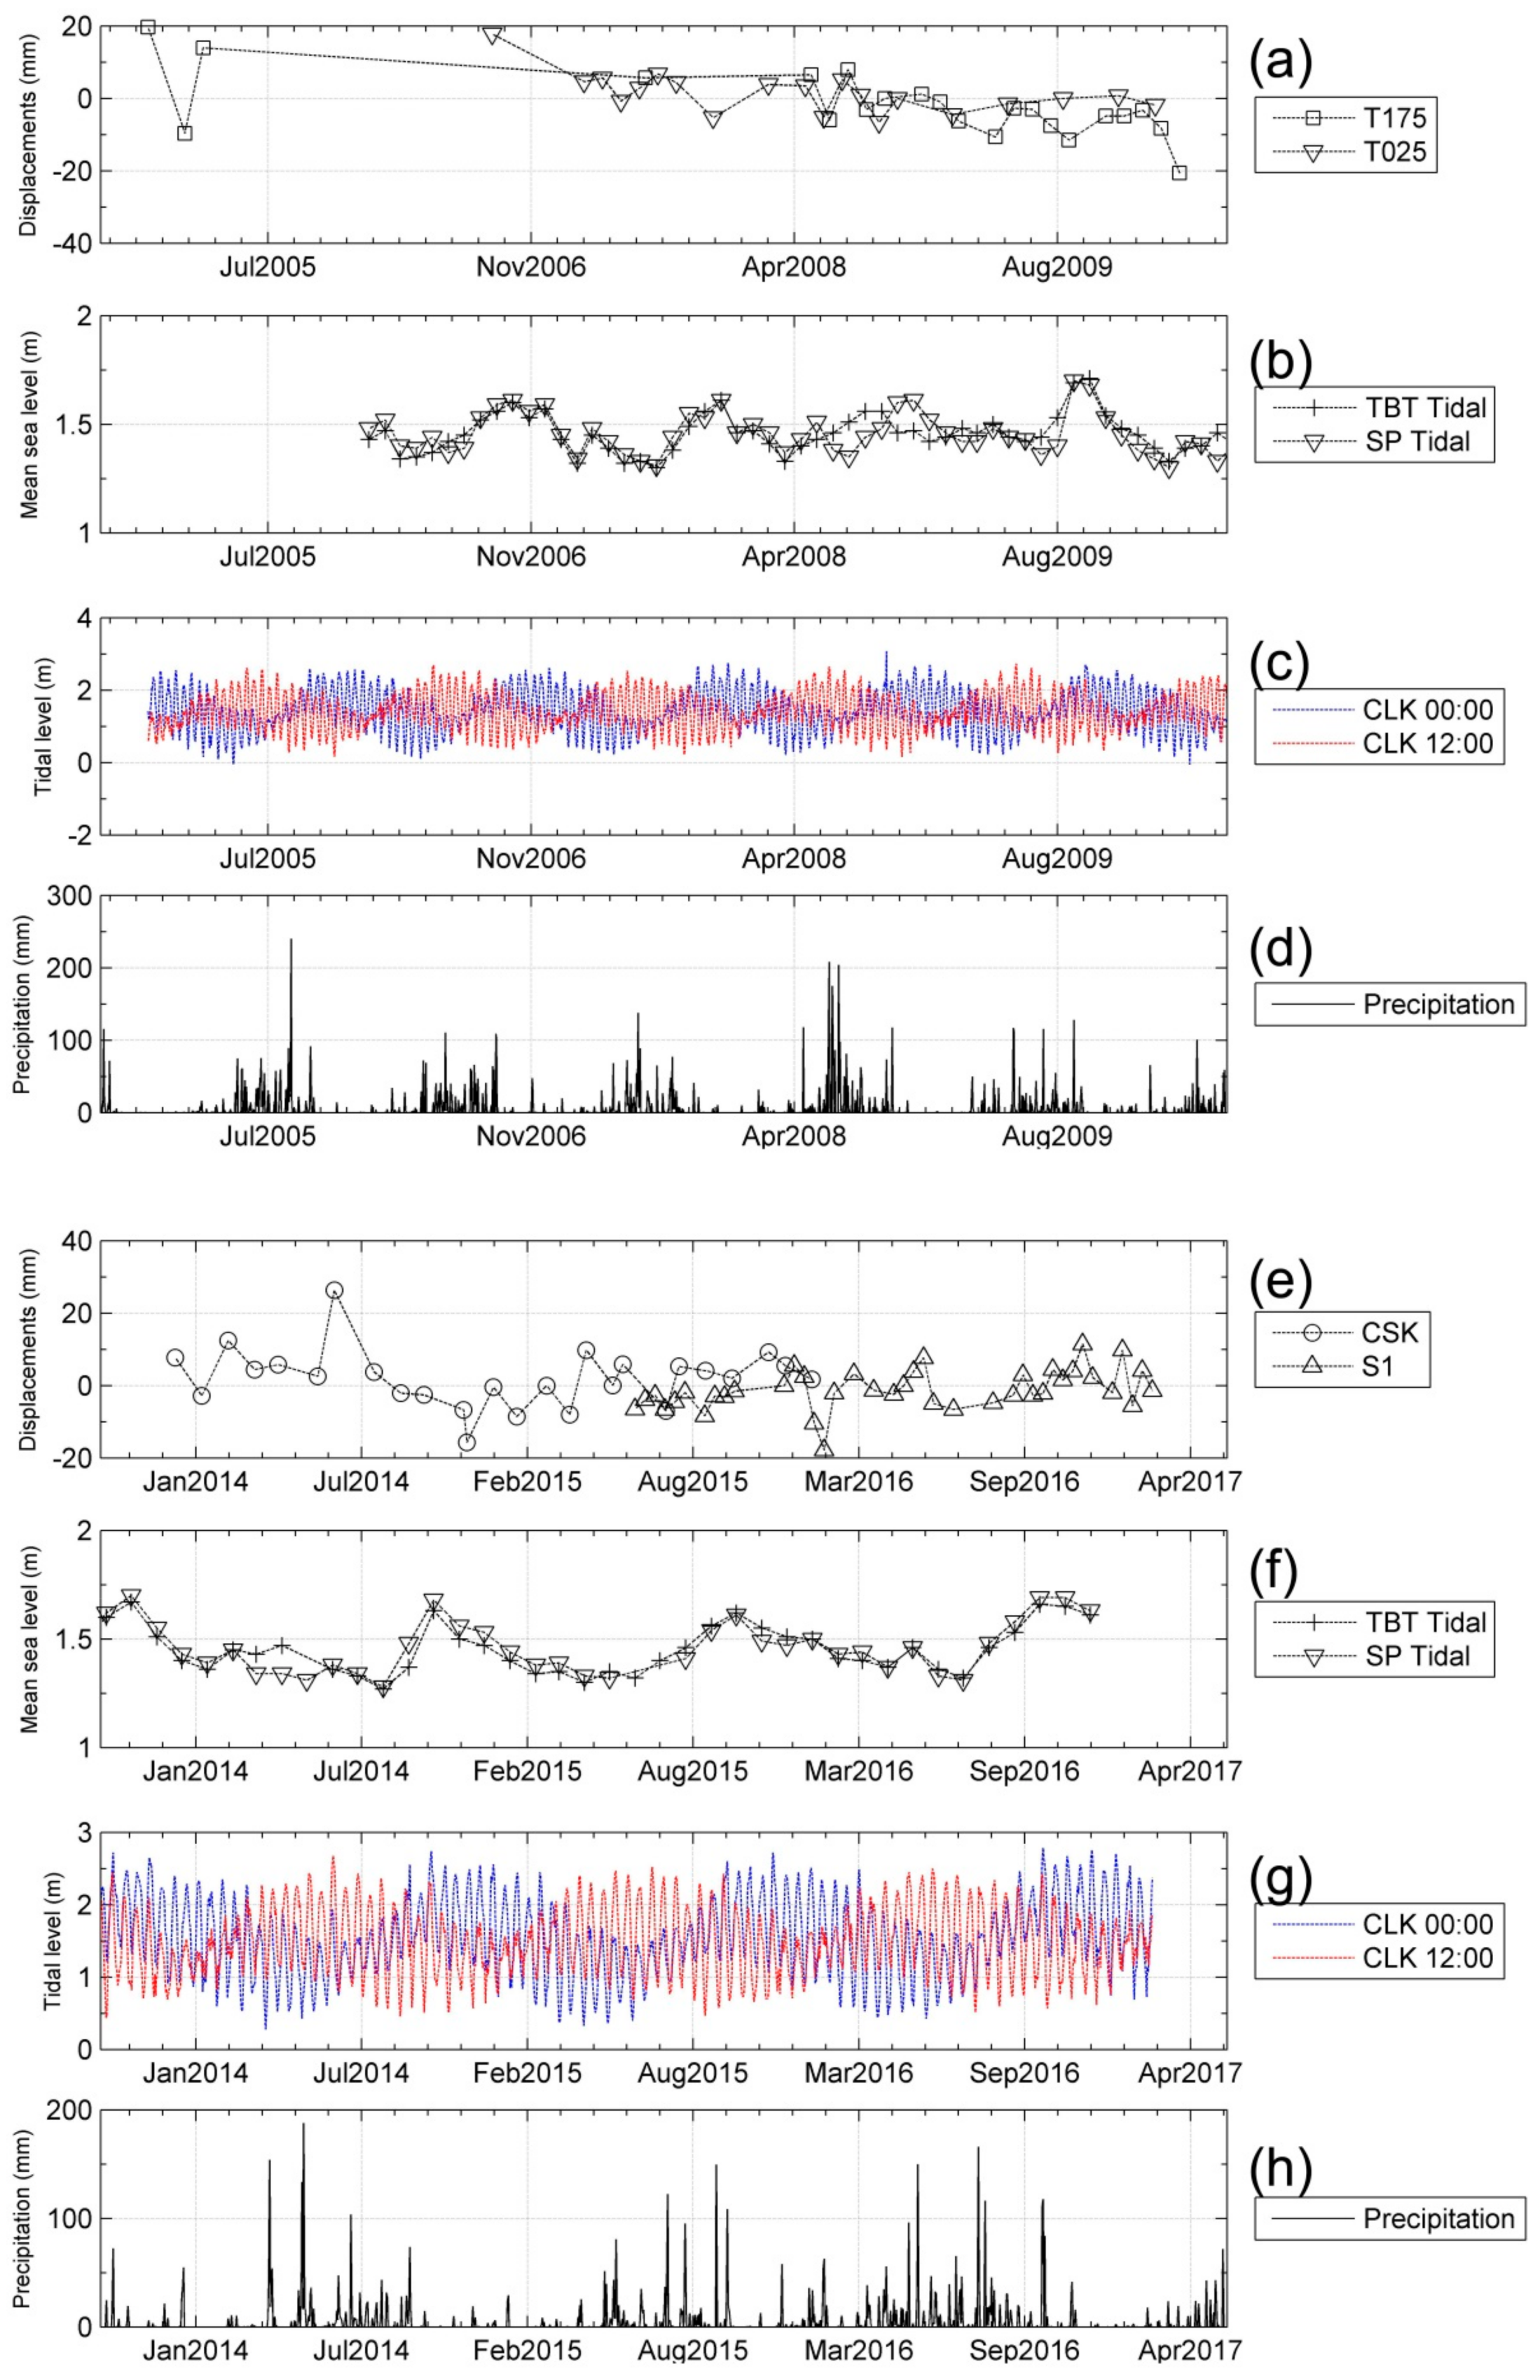
OTL can be a source of deformation in time series InSAR, especially in coastal area. Hence it is necessary to assess if OTL contributions are observable in coastal area of Shenzhen through time series InSAR. Point P2 (Figure 5b) is used to analyze the associations between displacements and Tidal levels. There are about 11 Tide gauges in the city of neighboring Hong Kong, of which the monthly mean sea levels of 10 Tide gauges are available online through Hong Kong observatory (HKO) [57]. The hourly tidal levels of Chek Lap Kok (CLK) tidal gauge are available upon request through Hong Kong International Airport. The monthly mean sea levels (MSL) of Tsim Bei Tsui (TBT) gauge station in Shenzhen Bay and Shek Pik (SP) gauge station facing the South China Sea are selected (Figure 16b,f). For the hourly Chek Lap Kok (CLK) tidal levels, only the tidal levels at 0:00 and 12:00 (local time in Hong Kong) of each day are shown. On one hand, the tidal levels vary on the order of 1–3 m every day, and 24 consecutive dots each day results in tidal level trends hardly recognizable. On the other hand, the satellite datasets are retrieved at the same time of every cycle; it is, therefore, reasonable to study the association between displacements and tidal levels on a daily basis. For instance, satellite images for T175, T025, CSK and S1 are collected around 22:19, 10:27, 18:13 and 18:33 (local time in both Shenzhen and Hong Kong) respectively when available.
The monthly mean sea levels at Tsim Bei Tsui (TBT) and Shek Pik (SP) tidal stations are accurate to month [57], and the 15th day of each month is assumed as the tidal date for the monthly mean sea level when they are presented. For T175 and T025, the local valleys of displacement are found to meet the local peaks of monthly mean sea level (Figure 16a,b). For instance: (a) The displacement valley formed by the 3rd, 4th, and 5th T025 images matches the monthly mean sea level peak formed by records of Feb, Mar, and Apr 2007; (b) The displacements valley formed by the 7th, 8th and 9th T025 images matches the monthly mean sea level peak formed by records of October, November and December 2007; (c) The displacement valley formed by the 10th, 11th, and 12th T025 images (or 5th, 6th, and 7th T175 images) matches the monthly mean sea level peak formed by records of April, May, and June 2008; (d) The displacement valley formed by the 16th, 17th and 18th T175 images matches the monthly mean sea level peak formed by records of August, September, October and November 2009. The local displacement valleys can be explained as coastal subsidence due to increasing ocean tidal loading on sea floor.
However, besides the mean sea level changes, the association between displacements and precipitation is seen for ASAR T175 and T025 as well (Figure 16d). So it is difficult to exclude the impact of precipitation on displacements. Moreover, for CSK and S1, the displacement variability exceeds the frequency of monthly mean sea level (Figure 16e,f), though below the frequency of daily tidal records (Figure 16g). Hence it is still not clear whether the seasonality of coastal displacements are related to OTL though some signals might indicate this. In this case, seasonal signals that are non-tidal should be estimated and dealt with before investigating OTL signals in time series InSAR result. It is also worth noting that InSAR only measures relative displacements, so theoretically the OTL signals are observable when the reference area is less affected by OTL. Our reference area is on a small hill near the coast. It remains unclear to what extent the reference area is affected by OTL.
5.5. Subsidence in Shenzhen Compared with Other Coastal Zones of East China
There is a diversity of causes for subsidence along the coastline of East China. Around the Bohai Bay, subsidence in Liaohe plain [59] and the Yellow River delta [21,60,61] are related with oil and gas exploration, aquaculture, salt production and sediment compaction. Bowl shape subsidence reaches up to tens of centimeters per year (e.g., 230 mm/year) over the oilfields around Bohai Bay.
Along the coastline of East China Sea, subsidence in the Yangtze River delta (e.g., Shanghai) is mainly caused by groundwater withdrawal, nevertheless reclamation settlement, artificial loading, subway and highway construction are also adding to the subsidence [14,62,63,64,65,66,67]. Subsidence is widely distributed with maximum rates around tens of millimeters per year (e.g., 35 mm/year).
Subsidence in Guangzhou, another megacity in the Pearl River delta, is caused by groundwater extraction and subway construction, with maximum subsidence rates around 15 mm/year [68,69].
While for Shenzhen, subsidence is mainly distributed in land reclamation area, subway tunneling area, and built up area in northwest Shenzhen. The detectable maximum subsidence rates are at several millimeters per year (e.g., 7–10 mm/year) seen from our results and another study [28].
6. Conclusions
Time Series InSAR analysis of land motion in the city of Shenzhen has been undertaken using Envisat C-band, COSMO-SkyMed X-band, and Sentinel-1 C-band datasets covering the period between November 2004 and April 2010 and between December 2013 and February 2017. This work is twofold; first to relate subsidence areas to other sources of information such as coastal reclamation and subway construction, and second to discuss the seasonality of displacements using precipitation and tidal levels.
Most of the subsidence in Shenzhen was found to have occurred in the coastal area of Shenzhen, where land reclamation was implemented to meet land demand. Subsidence is found in Qianhai, Houhai, and the area to the south of Bao’an International Airport. The reason for subsidence in built up area of northwest Shenzhen requires further investigation.
Subsidence can also be caused by subway tunneling. Subsidence is found along Lines 1, 2, 5, 11, 5-2 and 9-2. Greater subsidence rates are seen when subways cross land reclamation area. Non-uniform subsidence signals are also observed along subways outside land reclamation area.
The seasonality of displacements can be related with precipitation. Periodicities of seasonal displacements and precipitation, and their associations are analyzed by wavelet tools. The seasonal displacements are likely driven by precipitation. There is a 1–2 weeks lead by precipitation over seasonal displacements. The relationship between seasonal displacements and ocean tidal loading is not clear although displacement valleys meet tidal peaks in some situations.
This study shows that the land motion in an urban environment like Shenzhen can be complex with widespread distribution and anisotropic behavior. The displacements are usually a combination of secular trends and seasonal fluctuations. Time series displacements are subjecting to diverse causes and should be analyzed accordingly. This study demonstrates the capability of time series InSAR to map subsidence and seasonal displacements in Shenzhen. InSAR can be an effective tool to investigate urban displacements in Shenzhen and the Pearl River delta.
Author Contributions
P.L. performed experiments and drafted the manuscripts. X.C., Z.L., Z.Z. and J.X. provided useful suggestions and improved the manuscript. W.F. and C.W. contributed to InSAR data analysis. Z.H. and W.T. contributed to seasonality analysis. H.L. contributed to coastline analysis.
Funding
This work is supported by a NSFC (National Natural Science Foundation of China) Program to Peng Liu (No. 41504003), a NSFC Program to Xiaofei Chen (No. 41790465), a NSFC Program to Jiankuan Xu (No. 41704043), a SZSTI (Shenzhen Science, Technology and Innovation Commission) Program to Peng Liu (No. JCYJ20170817104236221), a SZSTI Program to Chisheng Wang (No. JCYJ20170302144002028). The Envisat images were supplied through the ESA-MOST Dragon 2 Cooperation Program (ID: 5343).
Acknowledgments
We thank JPL/Caltech for the use of ROI_PAC, TU-Delft for DORIS and Andy Hooper for StaMPS in our data processing and analysis. Part of the figures were prepared using the public domain Generic Mapping Tools.
Conflicts of Interest
The authors declare no conflict of interest.
Abbreviations
| InSAR | Interferometric Synthetic Aperture Radar |
| LOS | Line of sight |
| ASAR | Advanced Synthetic Aperture Radar |
| CSK | COSMO-SkyMed |
| S1 | Sentinel-1 |
| ROI_PAC | Repeat Orbit Interferometry PACkage |
| DORIS | The Delft Object-oriented Radar Interferometric software |
| StaMPS | Stanford Method for Persistent Scatterers |
| SRTM | Shuttle Radar Topography Mission |
| PS | Persistent Scatterers |
| MAI | Multi-Aperture Interferometry |
| NEU | North east and up |
| SBSC | Shenzhen Bay Sports Center |
| SZX | Bao’an International Airport |
| CWT | Continuous wavelet transform |
| XWT | Cross wavelet transform |
| WTC | Wavelet coherence |
| OTL | Ocean tidal loading |
| HKO | Hong Kong observatory |
| CLK | Chek Lap Kok |
| TBT | Tsim Bei Tsui |
| SP | Shek Pik |
Appendix A
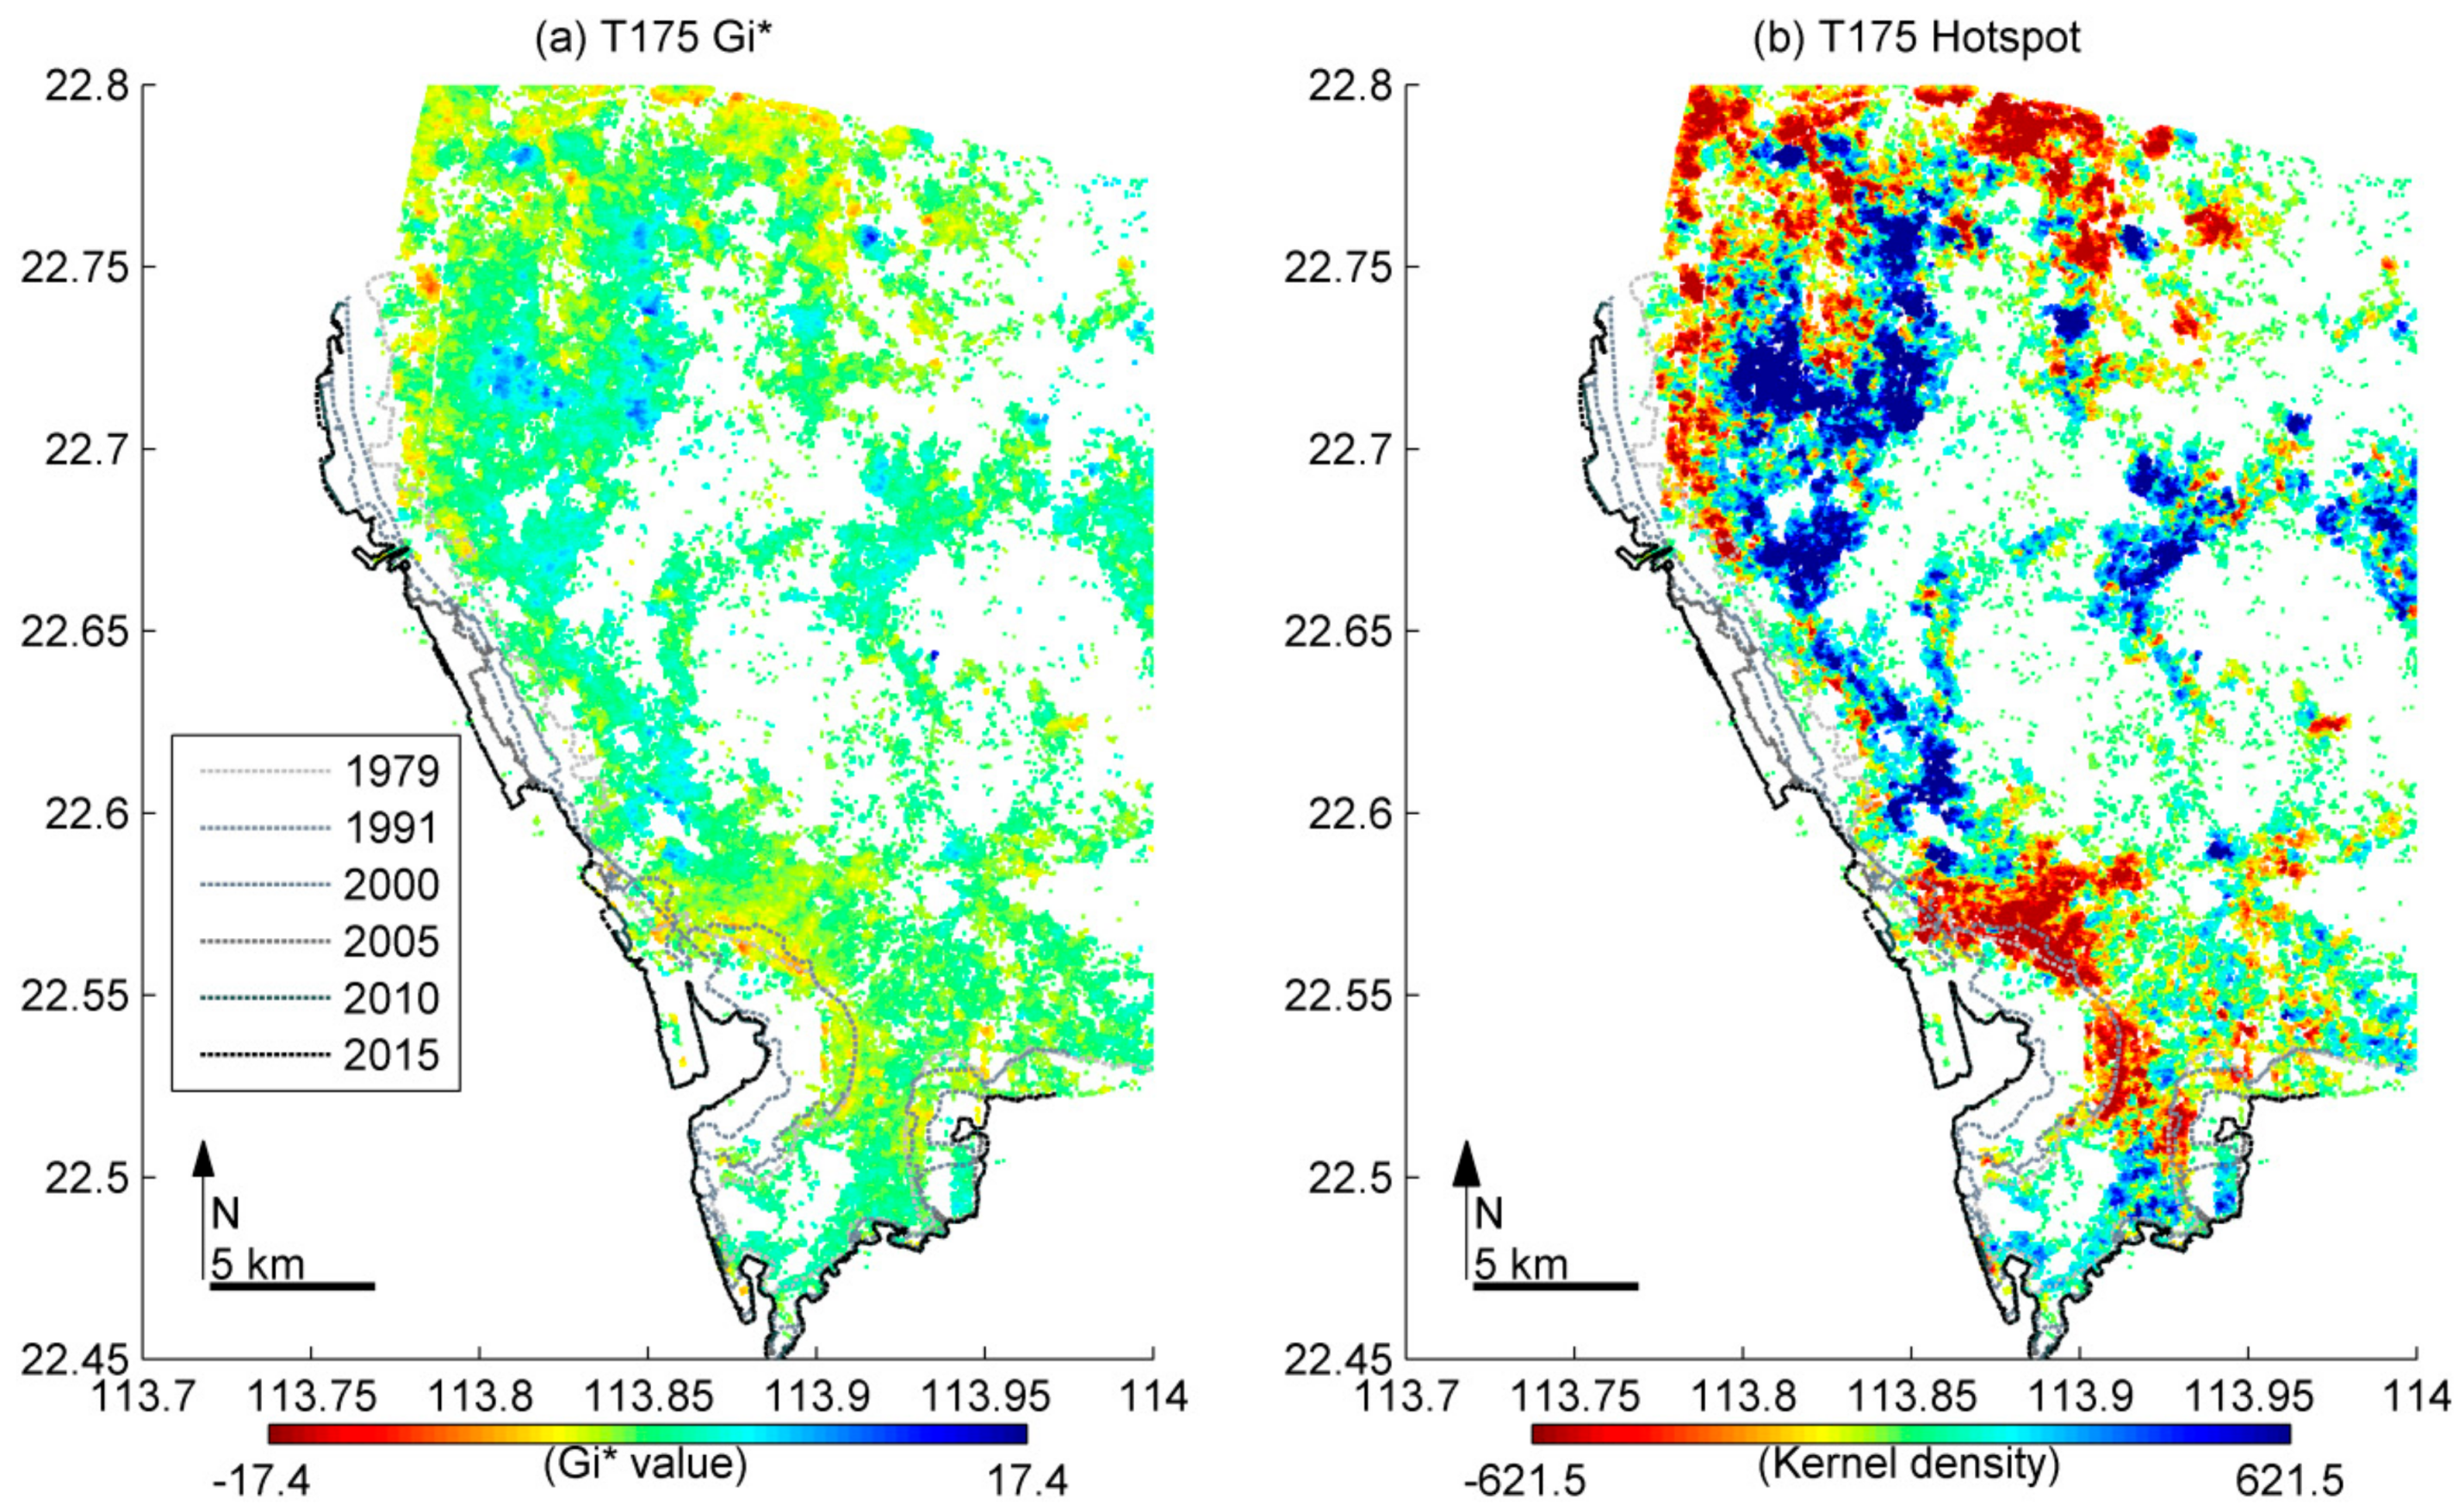
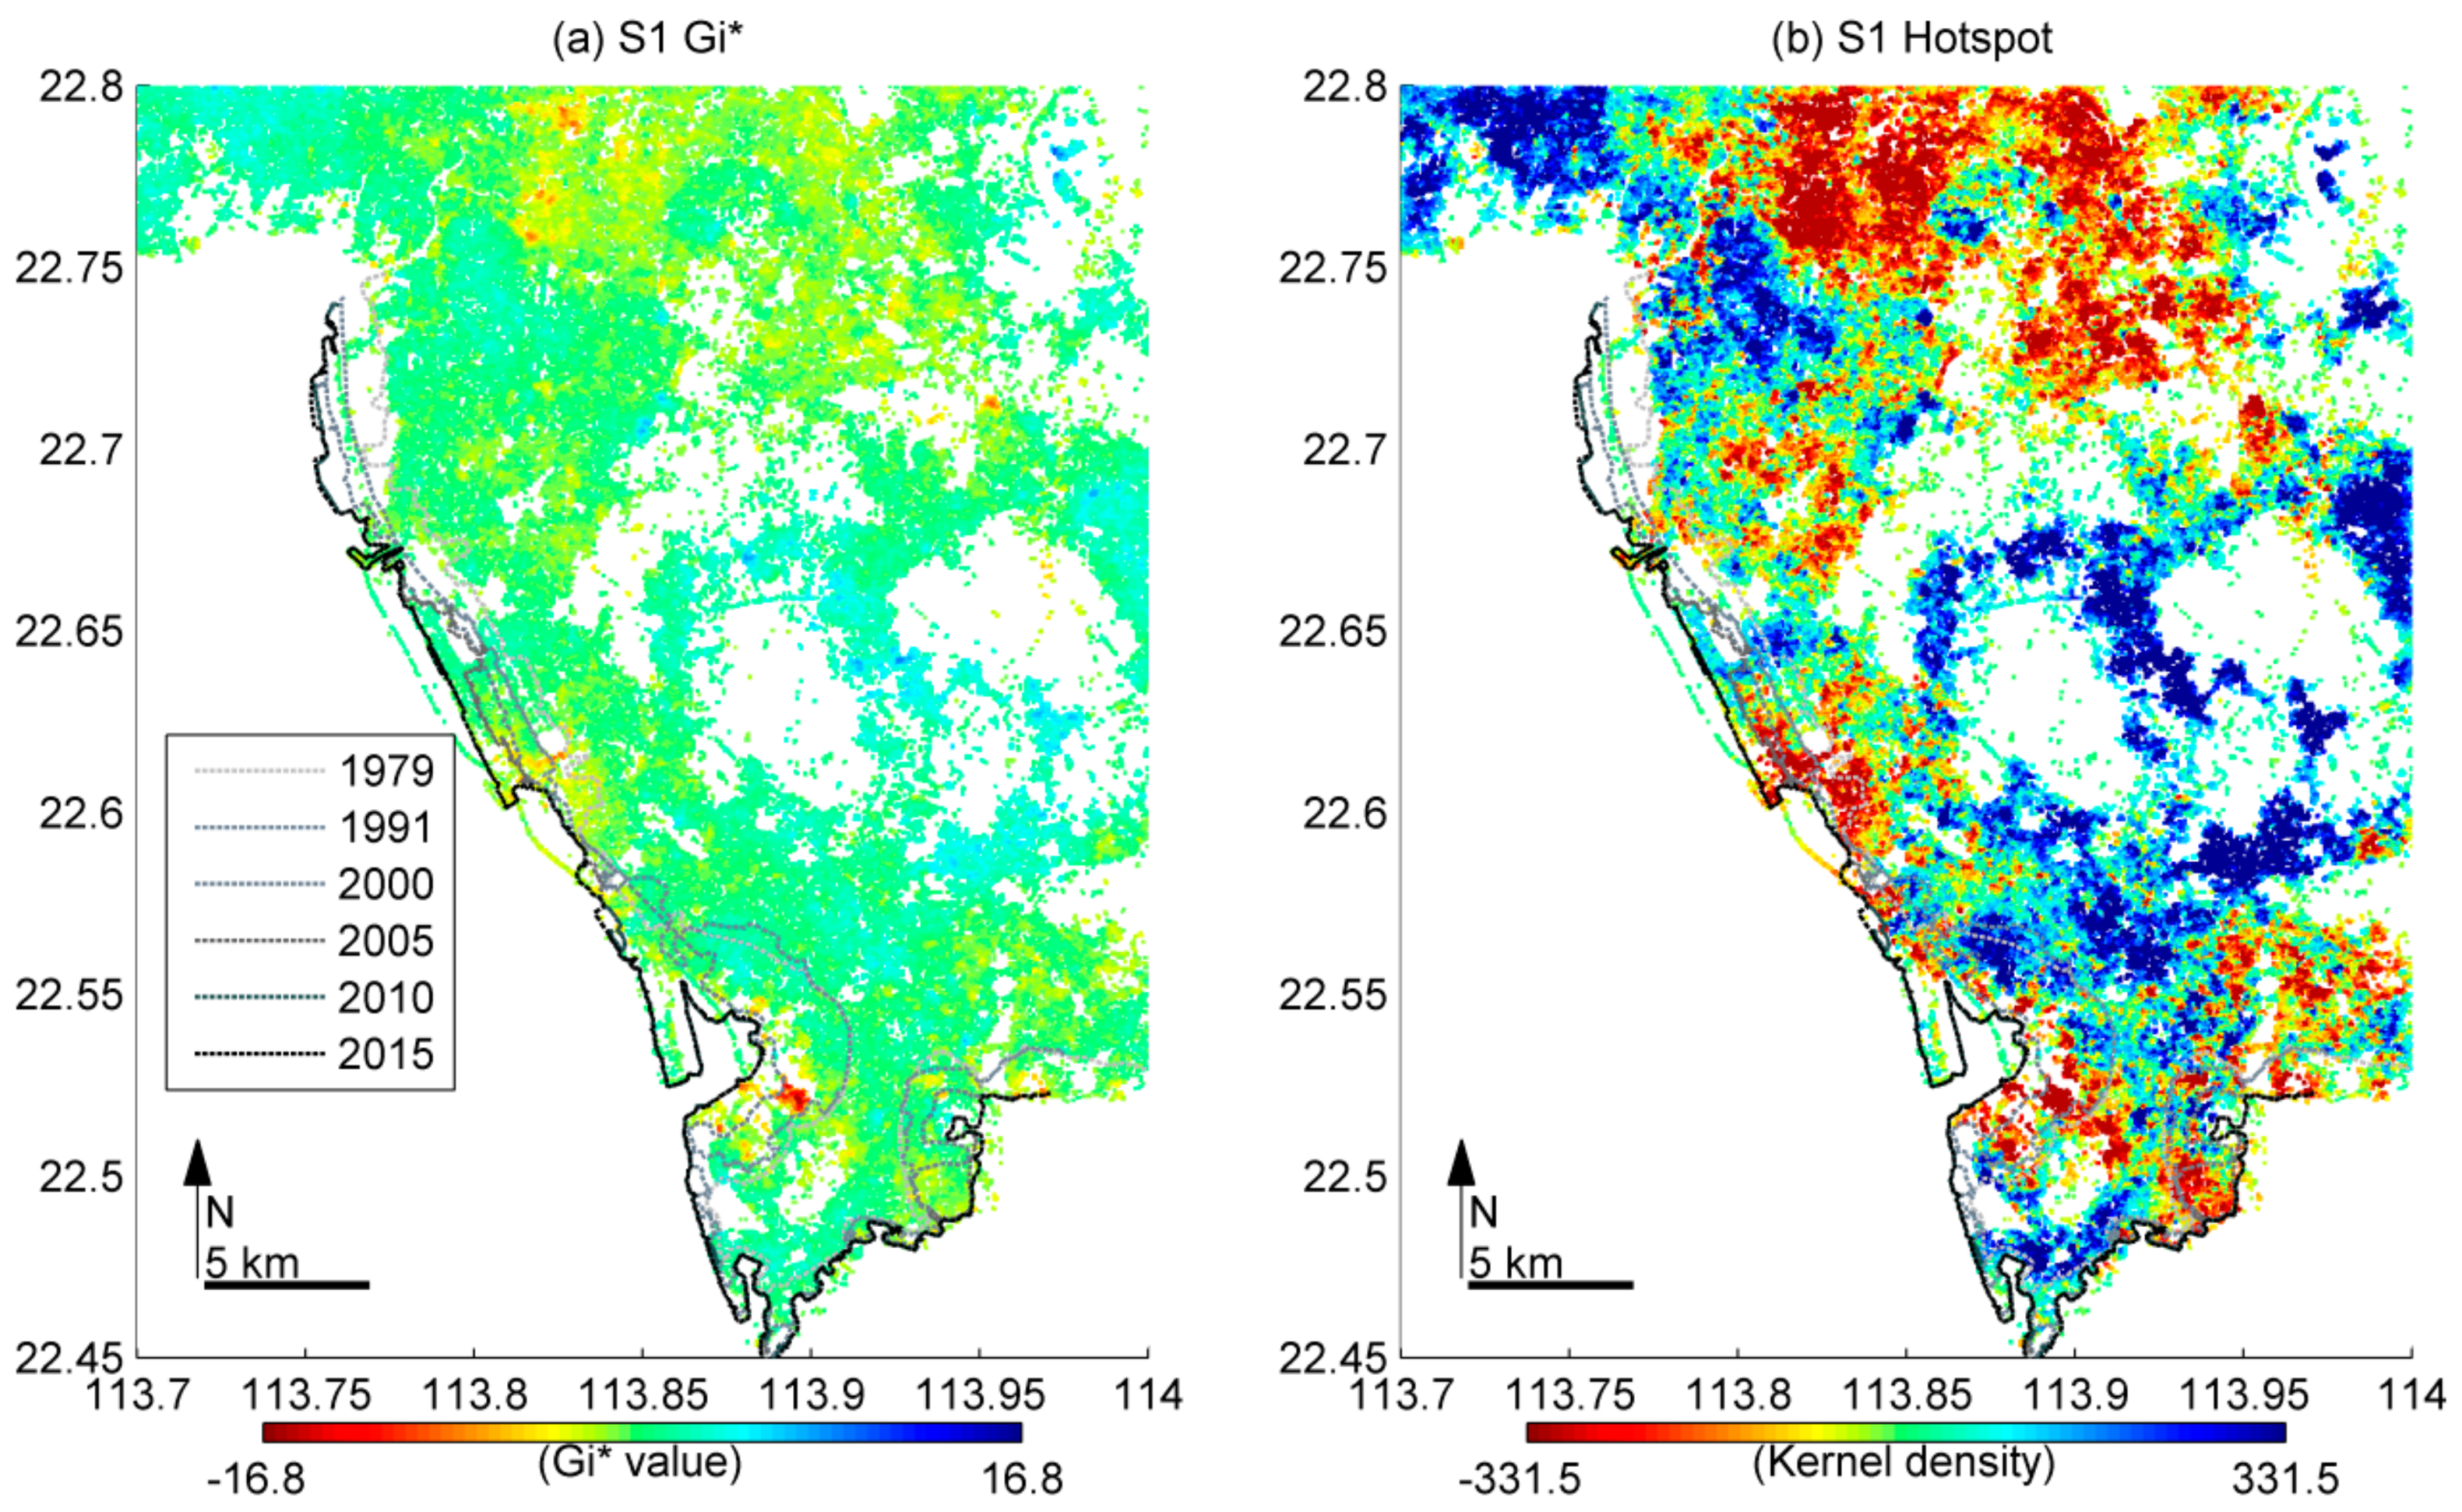
Hotspot analysis is performed to highlight the displacements [70,71,72]. Using Gi* index as the weighting factor, the output kernel density map is the hotspot map. Hotspot analysis help augment the boundary between subsidence and stable areas in Shenzhen (Figure A1, Figure A2, Figure A3 and Figure A4). Subsidence can be found in coastal area and in northwest Shenzhen. It should be noted that part of the subsidence in coastal area is outside the reclamation area (e.g., in Bao’an).
Figure A1.
The clustering of mean rates using Getis–Ord Gi* statistic for ASAR T175. (a) Gi* values; (b) Hotspot map derived from a kernel density estimation.
Figure A1.
The clustering of mean rates using Getis–Ord Gi* statistic for ASAR T175. (a) Gi* values; (b) Hotspot map derived from a kernel density estimation.

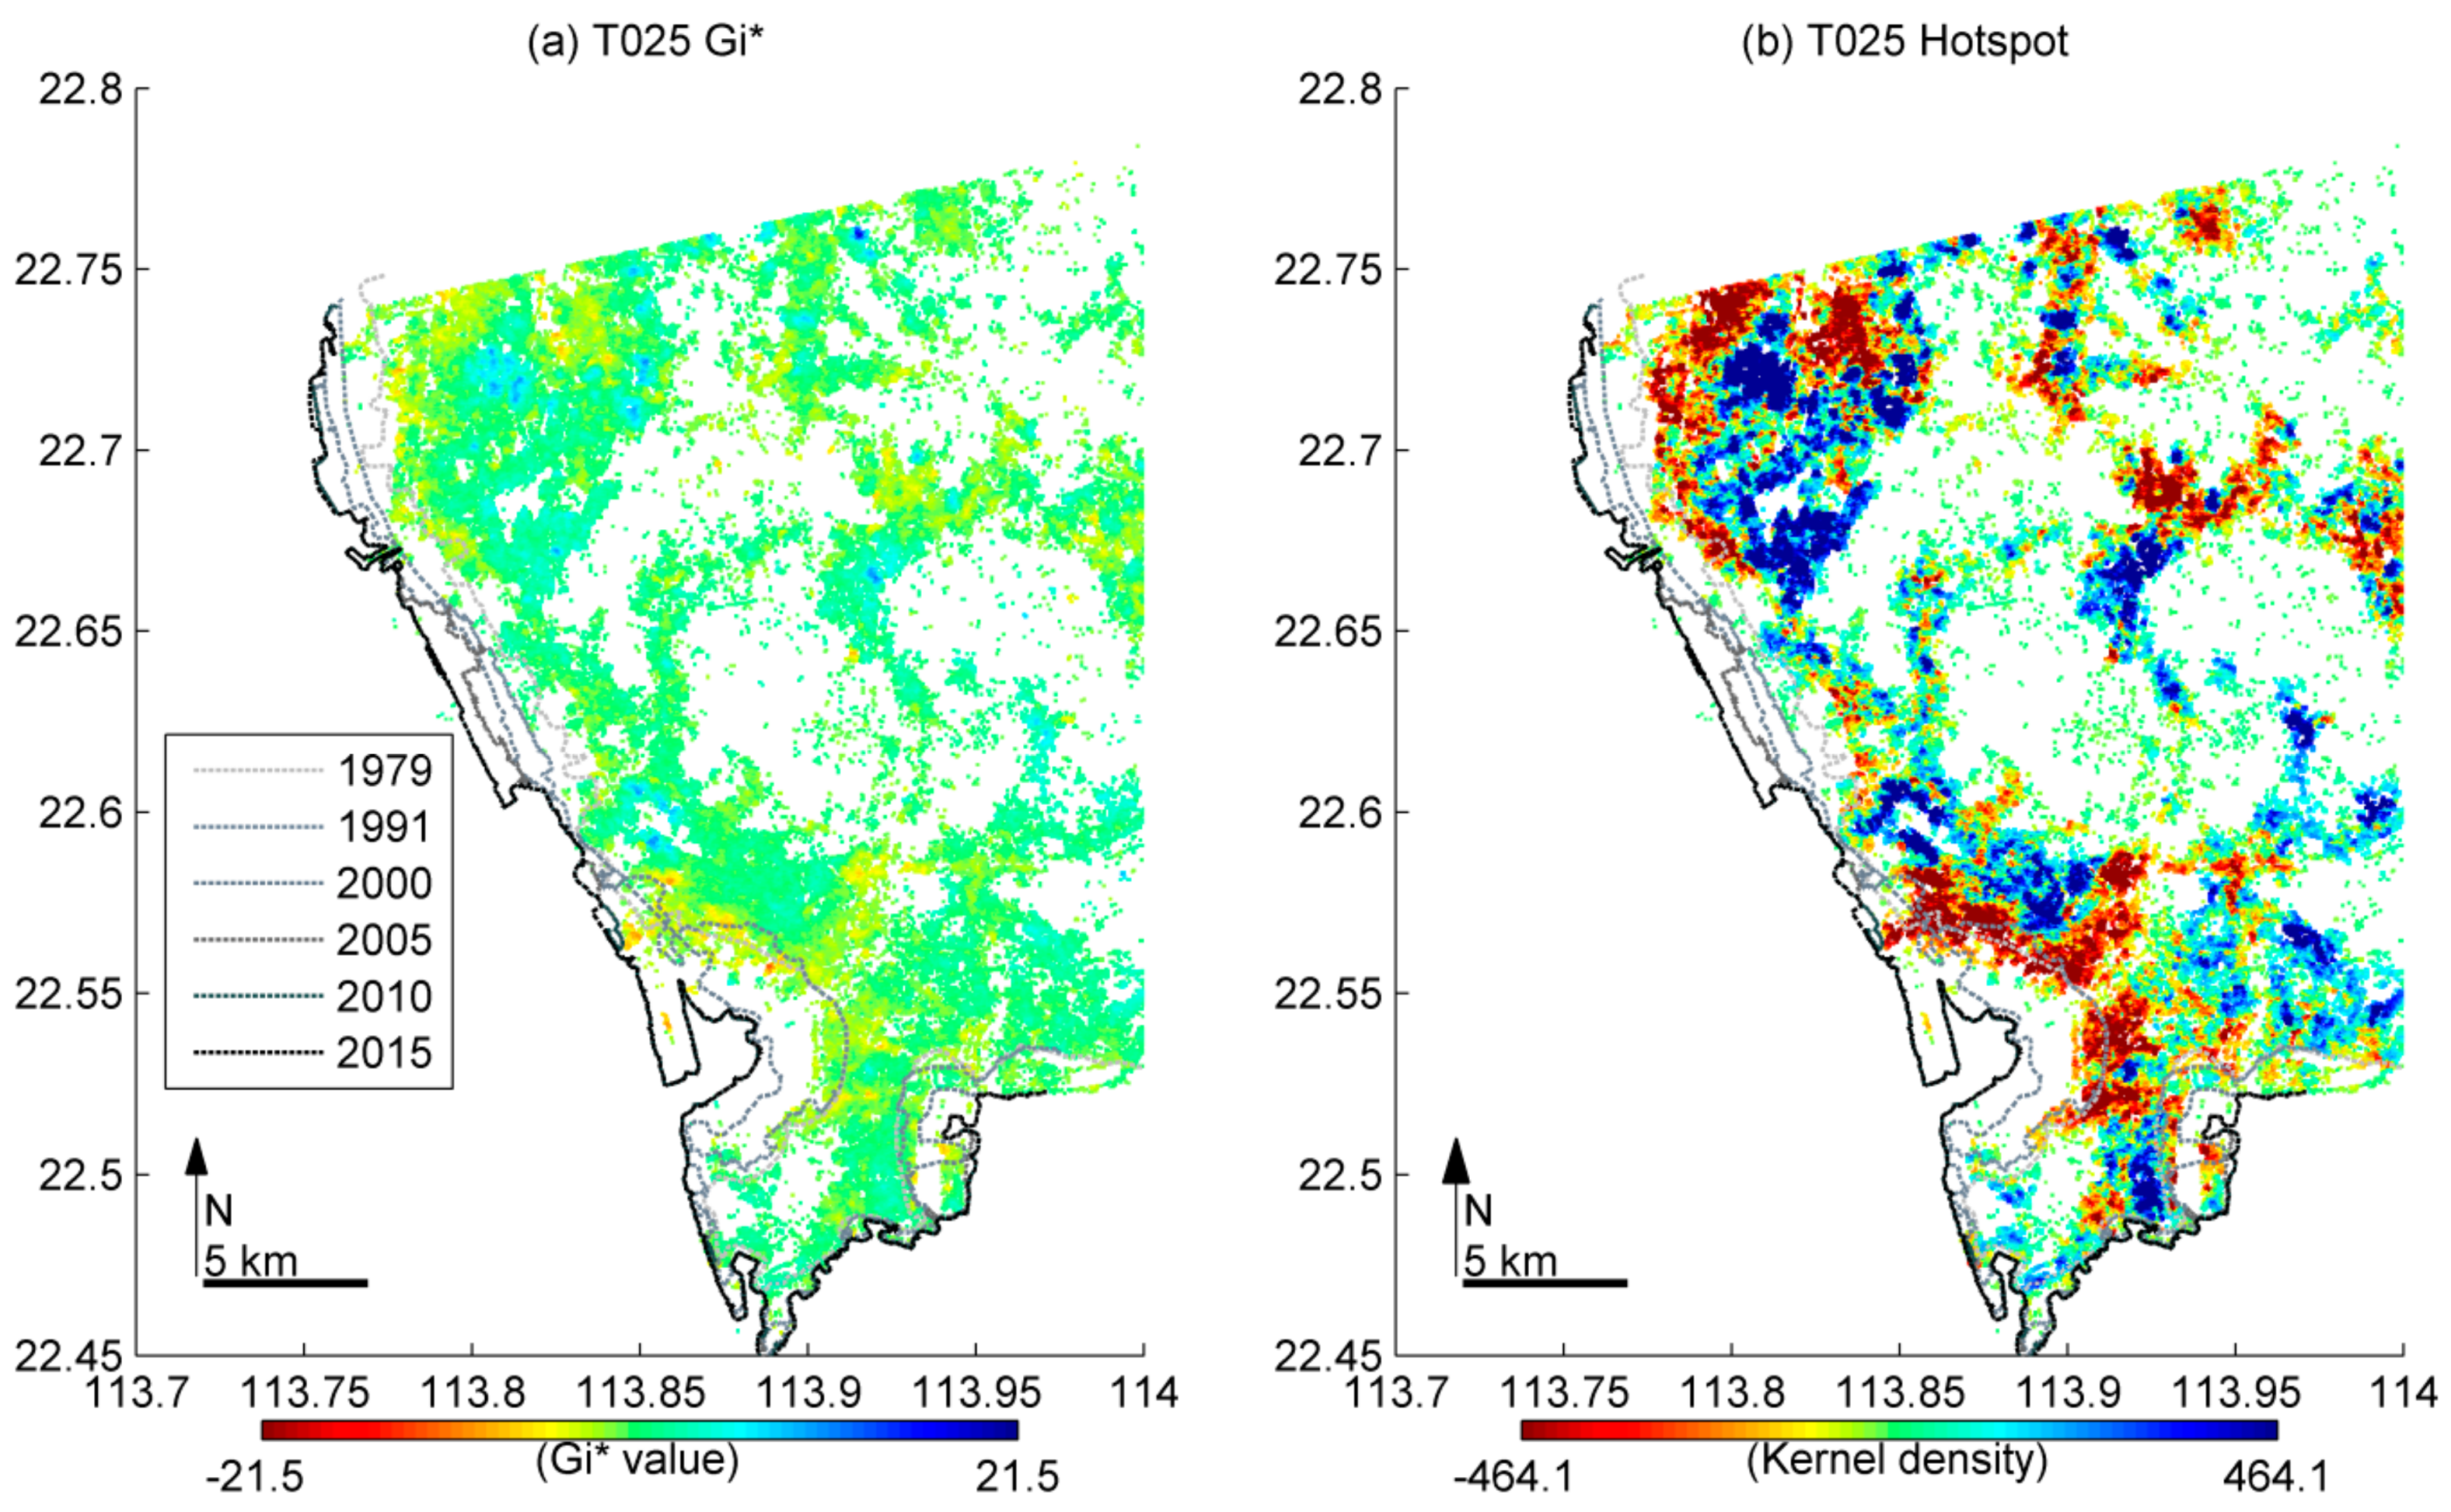
Figure A2.
The clustering of mean rates using Getis–Ord Gi* statistic for ASAR T025. (a) Gi* values; (b) Hotspot map derived from a kernel density estimation.
Figure A2.
The clustering of mean rates using Getis–Ord Gi* statistic for ASAR T025. (a) Gi* values; (b) Hotspot map derived from a kernel density estimation.

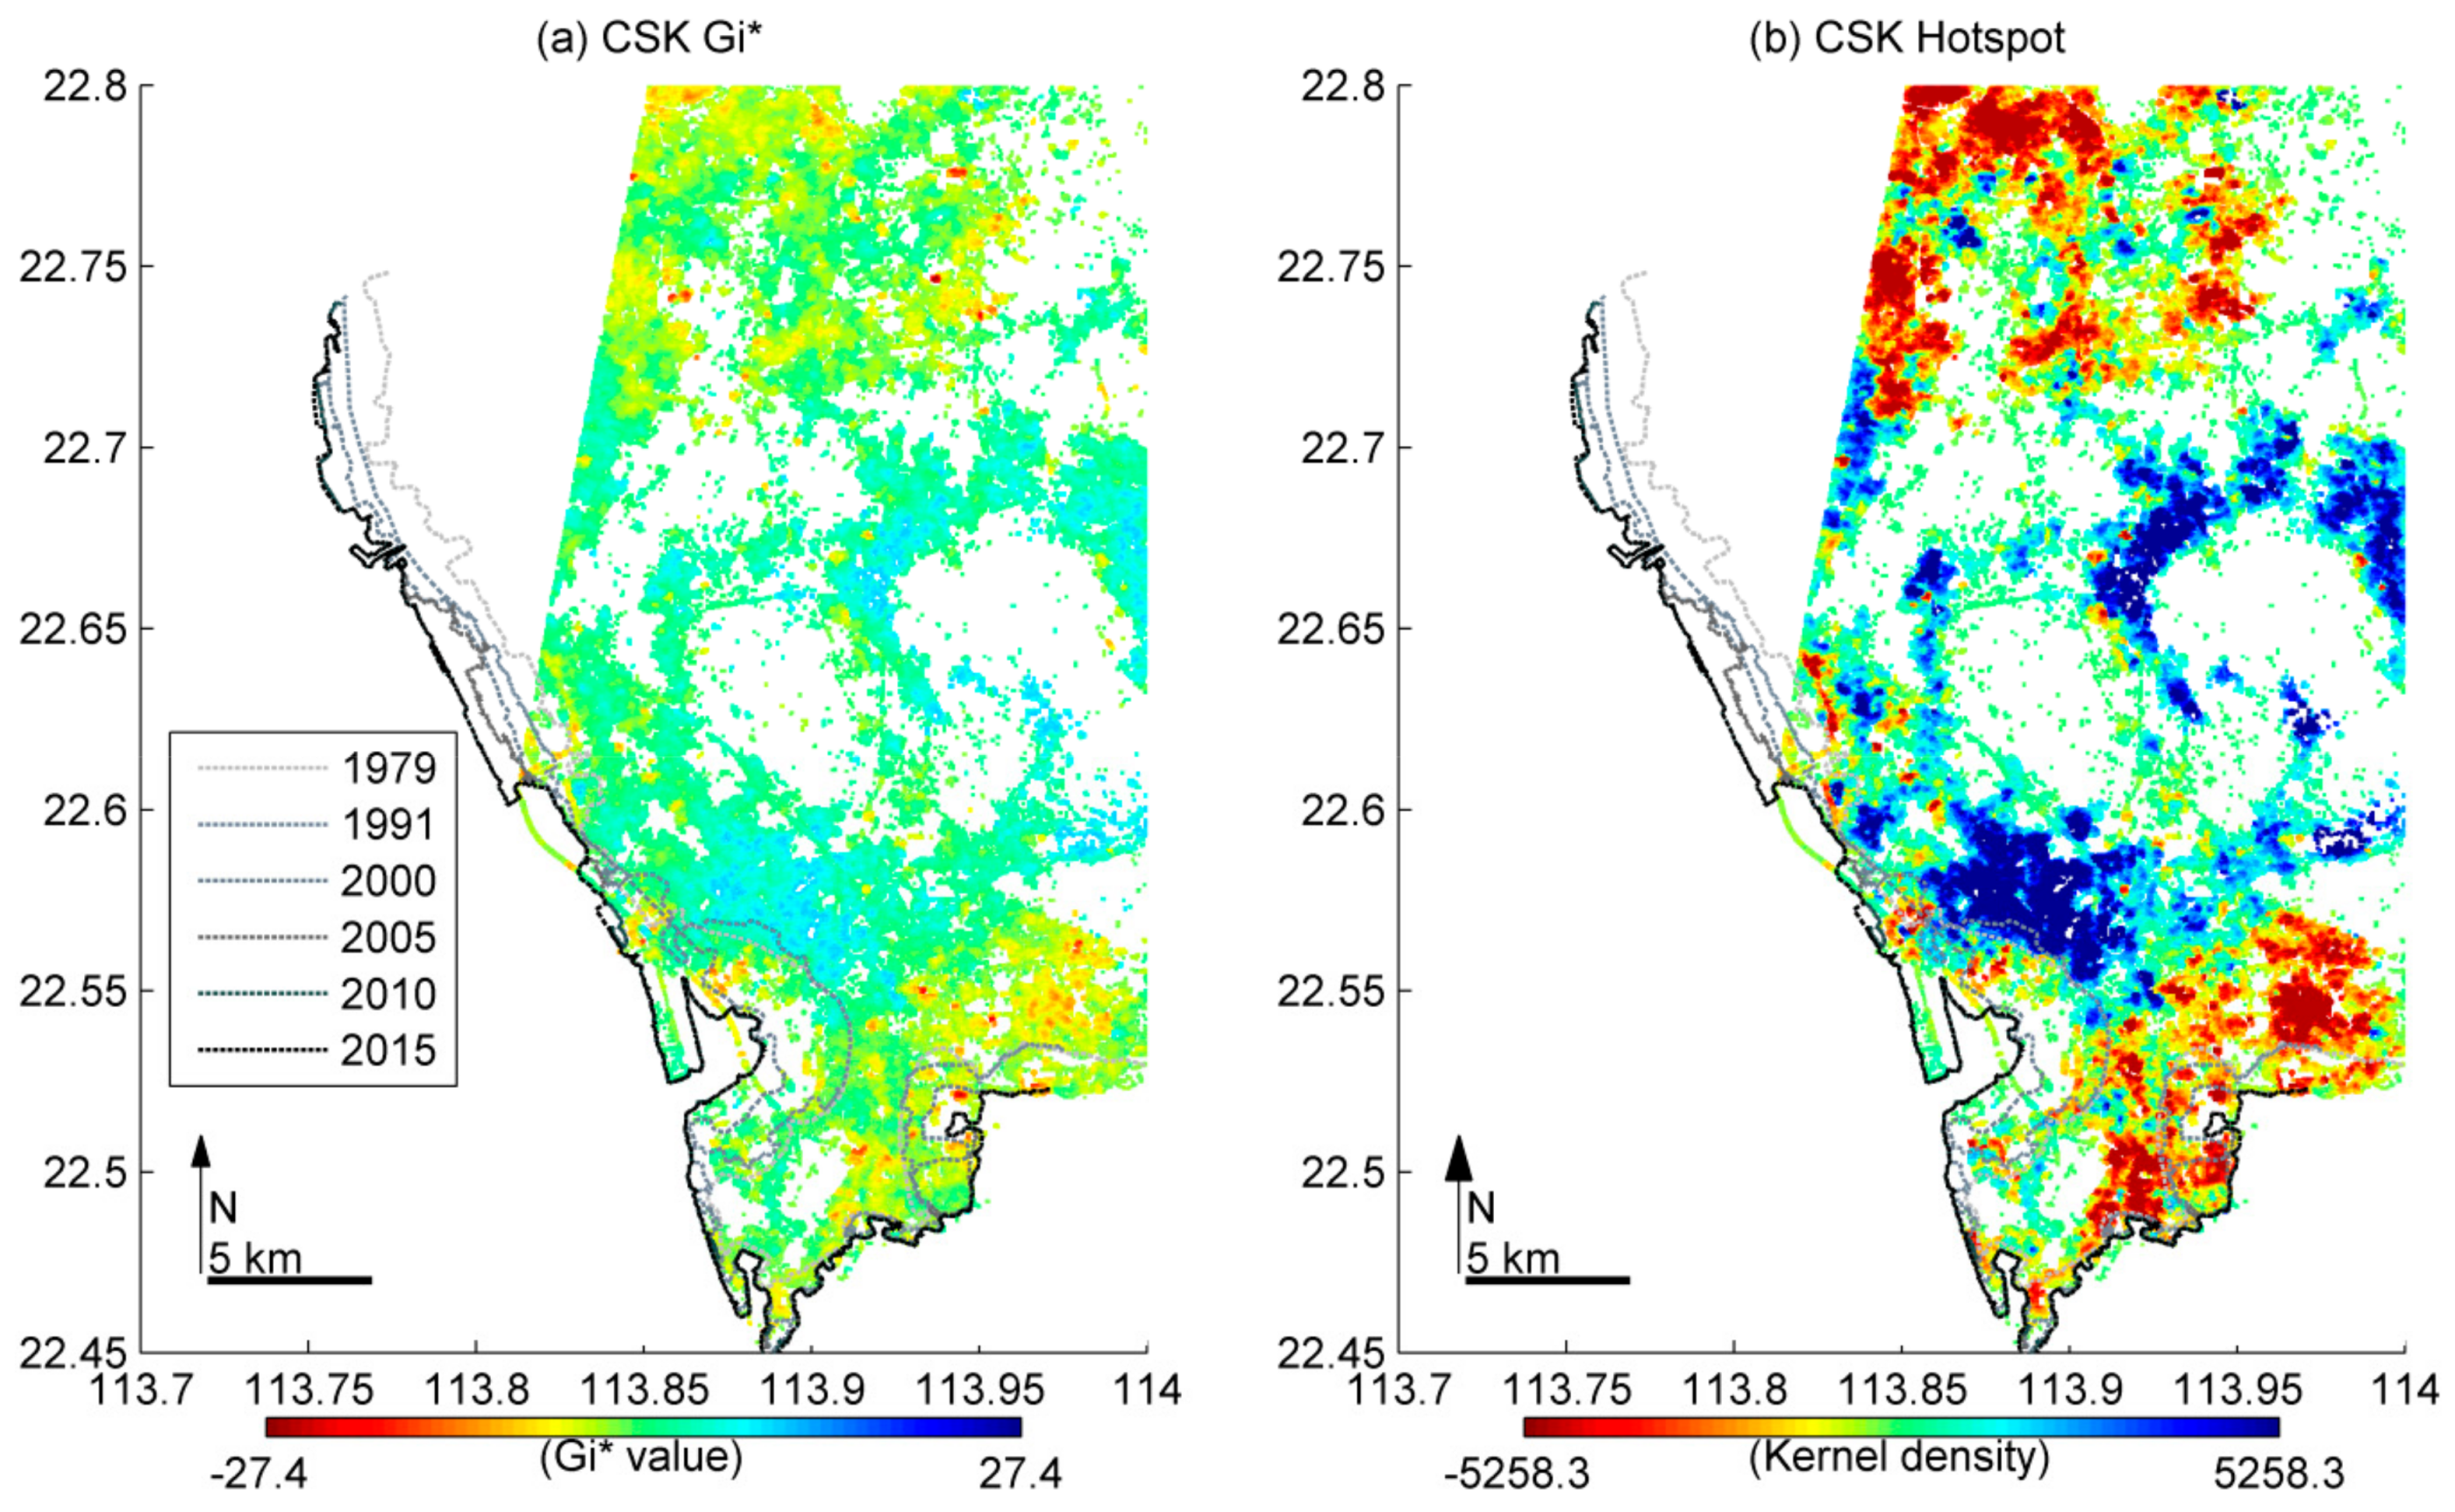
Figure A3.
The clustering of mean rates using Getis–Ord Gi* statistic for CSK. (a) Gi* values; (b) Hotspot map derived from a kernel density estimation.
Figure A3.
The clustering of mean rates using Getis–Ord Gi* statistic for CSK. (a) Gi* values; (b) Hotspot map derived from a kernel density estimation.

Figure A4.
The clustering of mean rates using Getis–Ord Gi* statistic for S1. (a) Gi* values; (b) Hotspot map derived from a kernel density estimation.
Figure A4.
The clustering of mean rates using Getis–Ord Gi* statistic for S1. (a) Gi* values; (b) Hotspot map derived from a kernel density estimation.

References
- Rosen, P.A.; Hensley, S.; Joughin, I.R.; Li, F.K.; Madsen, S.N.; Rodriguez, E.; Goldstein, R.M. Synthetic aperture radar interferometry. Proc. IEEE 2000, 88, 333–382. [Google Scholar] [CrossRef] [Green Version]
- Massonnet, D.; Feigl, K.L. Radar interferometry and its application to changes in the Earth’s surface. Rev. Geophys. 1998, 36, 441–500. [Google Scholar] [CrossRef]
- Feng, W.; Samsonov, S.; Tian, Y.; Qiu, Q.; Li, P.; Zhang, Y.; Deng, Z.; Omari, K. Surface deformation associated with the 2015 Mw 8.3 Illapel earthquake revealed by satellite-based geodetic observations and its implications for the seismic cycle. Earth Planet. Sci. Lett. 2017, 460, 222–233. [Google Scholar] [CrossRef]
- Biggs, J.; Pritchard, M.E. Global Volcano Monitoring: What Does It Mean When Volcanoes Deform? Elements 2017, 13, 17–22. [Google Scholar] [CrossRef] [Green Version]
- Sun, Q.; Zhang, L.; Ding, X.L.; Hu, J.; Li, Z.W.; Zhu, J.J. Slope deformation prior to Zhouqu, China landslide from InSAR time series analysis. Remote Sens. Environ. 2015, 156, 45–57. [Google Scholar] [CrossRef]
- Li, Y.; Zhang, J.; Li, Z.; Luo, Y.; Jiang, W.; Tian, Y. Measurement of subsidence in the Yangbajing geothermal fields, Tibet, from TerraSAR-X InSAR time series analysis. Int. J. Digit. Earth 2015, 9, 1–13. [Google Scholar] [CrossRef]
- Daout, S.; Doin, M.-P.; Peltzer, G.; Socquet, A.; Lasserre, C. Large-scale InSAR monitoring of permafrost freeze-thaw cycles on the Tibetan Plateau. Geophys. Res. Lett. 2017, 44, 901–909. [Google Scholar] [CrossRef]
- Hooper, A.; Segall, P.; Zebker, H.A. Persistent scatterer interferometric synthetic aperture radar for crustal deformation analysis. J. Geophys. Res. 2007, 112, 1–21. [Google Scholar] [CrossRef]
- Berardino, P.; Fornaro, G.; Lanari, R.; Sansosti, E. A New Algorithm for Surface Deformation Monitoring Based on Small Baseline Differential SAR Interferograms. IEEE Trans. Geosci. Remote Sens. 2002, 40, 2375–2383. [Google Scholar] [CrossRef]
- Ferretti, A.; Fumagalli, A.; Novali, F.; Prati, C.; Rocca, F.; Rucci, A. A New Algorithm for Processing Interferometric Data-Stacks: SqueeSAR. IEEE Trans. Geosci. Remote Sens. 2011, 49, 3460–3470. [Google Scholar] [CrossRef]
- Ferretti, A.; Prati, C.; Rocca, F. Permanent Scatterers in SAR interferometry. IEEE Trans. Geosci. Remote Sens. 2001, 39, 8–20. [Google Scholar] [CrossRef]
- Hooper, A.; Bekaert, D.; Spaans, K.; Arıkan, M. Recent advances in SAR interferometry time series analysis for measuring crustal deformation. Tectonophysics 2012, 514–517, 1–13. [Google Scholar] [CrossRef]
- Hu, B.; Wang, H.-S.; Sun, Y.-L.; Hou, J.-G.; Liang, J. Long-Term Land Subsidence Monitoring of Beijing (China) Using the Small Baseline Subset (SBAS) Technique. Remote Sens. 2014, 6, 3648–3661. [Google Scholar] [CrossRef] [Green Version]
- Pepe, A.; Bonano, M.; Zhao, Q.; Yang, T.; Wang, H. The Use of C-/X-Band Time-Gapped SAR Data and Geotechnical Models for the Study of Shanghai’s Ocean-Reclaimed Lands through the SBAS-DInSAR Technique. Remote Sens. 2016, 8, 911. [Google Scholar] [CrossRef]
- Chaussard, E.; Amelung, F.; Abidin, H.; Hong, S.-H. Sinking cities in Indonesia: ALOS PALSAR detects rapid subsidence due to groundwater and gas extraction. Remote Sens. Environ. 2013, 128, 150–161. [Google Scholar] [CrossRef]
- Aobpaet, A.; Cuenca, M.C.; Hooper, A.; Trisirisatayawong, I. InSAR time-series analysis of land subsidence in Bangkok, Thailand. Int. J. Remote Sens. 2013, 34, 2969–2982. [Google Scholar] [CrossRef]
- Miller, M.M.; Shirzaei, M. Spatiotemporal characterization of land subsidence and uplift in Phoenix using InSAR time series and wavelet transforms. J. Geophys. Res. Solid Earth 2015, 120, 5822–5842. [Google Scholar] [CrossRef]
- Castellazzi, P.; Martel, R.; Rivera, A.; Huang, J.; Pavlic, G.; Calderhead, A.I.; Chaussard, E.; Garfias, J.; Salas, J. Groundwater depletion in Central Mexico: Use of GRACE and InSAR to support water resources management. Water Resour. Res. 2016, 52, 5985–6003. [Google Scholar] [CrossRef]
- Tornqvist, T.E.; Wallace, D.J.; Storms, J.E.A.; Wallinga, J.; van Dam, R.L.; Blaauw, M.; Derksen, M.S.; Klerks, C.J.W.; Meijneken, C.; Snijders, E.M.A. Mississippi Delta subsidence primarily caused by compaction of Holocene strata. Nat. Geosci. 2008, 1, 173–176. [Google Scholar] [CrossRef]
- Motagh, M.; Shamshiri, R.; Haghshenas Haghighi, M.; Wetzel, H.-U.; Akbari, B.; Nahavandchi, H.; Roessner, S.; Arabi, S. Quantifying groundwater exploitation induced subsidence in the Rafsanjan plain, southeastern Iran, using InSAR time-series and in situ measurements. Eng. Geol. 2017, 218, 134–151. [Google Scholar] [CrossRef]
- Liu, Y.; Huang, H.; Liu, Y.; Bi, H. Linking land subsidence over the Yellow River delta, China, to hydrocarbon exploitation using multi-temporal InSAR. Nat. Hazards 2016, 84, 271–291. [Google Scholar] [CrossRef]
- Samsonov, S.; d’Oreye, N.; Smets, B. Ground deformation associated with post-mining activity at the French-German border revealed by novel InSAR time series method. Int. J. Appl. Earth Obs. Geoinf. 2013, 23, 142–154. [Google Scholar] [CrossRef]
- Lai, L.W.C.; Lu, W.W.S.; Lorne, F.T. A catallactic framework of government land reclamation: The case of Hong Kong and Shenzhen. Habitat Int. 2014, 44, 62–71. [Google Scholar] [CrossRef]
- China Daily. Shenzhen Eyes Land Reclamation to Curb Rising Housing Price. China Daily. 2016. Available online: http://www.chinadaily.com.cn/china/2016-03/04/content_23738729.htm (accessed on 25 September 2017).
- South China Morning Post. Reclamation Threatens Last of Shenzhen’s Coastline. South China Morning Post. 2010. Available online: http://www.scmp.com/article/719552/reclamation-threatens-last-shenzhens-coastline (accessed on 25 September 2017).
- IFENG. Subsidence of Buildings in Land Reclamation Area of Shenzhen, with Cracks Found on Pavements. IFENG NEWS. 2010. Available online: http://finance.ifeng.com/city/sz/20100402/2003288.shtml (accessed on 25 September 2017).
- IFENG. Subsidence Due to Metro Construction in Shenzhen, with Cracks Opening up over Buildings. IFENG NEWS. 2010. Available online: http://news.ifeng.com/mainland/detail_2010_05/21/1539325_0.shtml (accessed on 25 September 2017).
- Wang, H.; Wright, T.J.; Yu, Y.; Lin, H.; Jiang, L.; Li, C.; Qiu, G. InSAR reveals coastal subsidence in the Pearl River Delta, China. Geophys. J. Int. 2012, 191, 1119–1128. [Google Scholar] [CrossRef]
- Xu, B.; Feng, G.; Li, Z.; Wang, Q.; Wang, C.; Xie, R. Coastal Subsidence Monitoring Associated with Land Reclamation Using the Point Target Based SBAS-InSAR Method: A Case Study of Shenzhen, China. Remote Sens. 2016, 8, 652. [Google Scholar] [CrossRef]
- Chen, F.; Lin, H.; Zhang, Y.; Lu, Z. Ground subsidence geo-hazards induced by rapid urbanization: Implications from InSAR observation and geological analysis. Nat. Hazards Earth Syst. Sci. 2012, 12, 935–942. [Google Scholar] [CrossRef] [Green Version]
- Du, Y.; Feng, G.; Li, Z.; Peng, X.; Zhu, J.; Ren, Z. Effects of External Digital Elevation Model Inaccuracy on StaMPS-PS Processing: A Case Study in Shenzhen, China. Remote Sens. 2017, 9, 1115. [Google Scholar] [CrossRef]
- Grinsted, A.; Moore, J.C.; Jevrejeva, S. Application of the cross wavelet transform and wavelet coherence to geophysical time series. Nonlinear Process. Geophys. 2004, 11, 561–566. [Google Scholar] [CrossRef] [Green Version]
- Xu, Y.; Shen, X.; Hong, S.; Jing, F.; Liu, J.; Chen, P. Identification of Major Active faults in Shenzhen Using Multi-style Remote Sensing Data. Earthquake 2009, 29, 154–163. (In Chinese) [Google Scholar]
- Cui, Q.-L.; Wu, H.-N.; Shen, S.-L.; Xu, Y.-S. Geological difficulties and countermeasures for socket diaphragm walls in weathered granite in Shenzhen, China. Bull. Eng. Geol. Environ. 2016, 75, 263–273. [Google Scholar] [CrossRef]
- Hu, L.; Jiao, J.J. Modeling the influences of land reclamation on groundwater systems: A case study in Shekou peninsula, Shenzhen, China. Eng. Geol. 2010, 114, 144–153. [Google Scholar] [CrossRef]
- Kampes, B.M. Radar Interferometry, Persistent Scatterer Technique; Springer: Dordrecht, The Netherlands, 2006; Volume 12. [Google Scholar]
- Wegnüller, U.; Werner, C.; Strozzi, T.; Wiesmann, A.; Frey, O.; Santoro, M. Sentinel-1 Support in the GAMMA Software. Procedia Comput. Sci. 2016, 100, 1305–1312. [Google Scholar] [CrossRef]
- Farr, T.G. The Shuttle Radar Topography Mission. Rev. Geophys. 2007, 45, 361. [Google Scholar] [CrossRef]
- Hooper, A.; Zebker, H.; Segall, P.; Kampes, B. A new method for measuring deformation on volcanoes and other natural terrains using InSAR persistent scatterers. Geophys. Res. Lett. 2004, 31. [Google Scholar] [CrossRef] [Green Version]
- Colesanti, C.; Wasowski, J. Investigating landslides with space-borne Synthetic Aperture Radar (SAR) interferometry. Eng. Geol. 2006, 88, 173–199. [Google Scholar] [CrossRef]
- Liu, P.; Li, Z.; Hoey, T.; Kincal, C.; Zhang, J.; Zeng, Q.; Muller, J.-P. Using advanced InSAR time series techniques to monitor landslide movements in Badong of the Three Gorges region, China. Int. J. Appl. Earth Obs. Geoinf. 2013, 21, 253–264. [Google Scholar] [CrossRef]
- Chen, C.W.; Zebker, H.A. Two-dimensional phase unwrapping with use of statistical models for cost functions in nonlinear optimization. J. Opt. Soc. Am. A 2001, 18, 338–351. [Google Scholar] [CrossRef]
- Wang, C.; Ding, X.; Li, Q.; Shan, X.; Zhu, W.; Guo, B.; Liu, P. Coseismic and postseismic slip models of the 2011 Van earthquake, Turkey, from InSAR, offset-tracking, MAI, and GPS observations. J. Geodyn. 2015, 91, 39–50. [Google Scholar] [CrossRef]
- Sun, L.; Muller, J.-P. Evaluation of the Use of Sub-Pixel Offset Tracking Techniques to Monitor Landslides in Densely Vegetated Steeply Sloped Areas. Remote Sens. 2016, 8, 659. [Google Scholar] [CrossRef]
- Schaefer, L.N.; Wang, T.; Escobar-Wolf, R.; Oommen, T.; Lu, Z.; Kim, J.; Lundgren, P.R.; Waite, G.P. Three-dimensional displacements of a large volcano flank movement during the May 2010 eruptions at Pacaya Volcano, Guatemala. Geophys. Res. Lett. 2017, 44, 135–142. [Google Scholar] [CrossRef] [Green Version]
- Darvishi, M.; Schlögel, R.; Bruzzone, L.; Cuozzo, G. Integration of PSI, MAI, and Intensity-Based Sub-Pixel Offset Tracking Results for Landslide Monitoring with X-Band Corner Reflectors—Italian Alps (Corvara). Remote Sens. 2018, 10, 409. [Google Scholar] [CrossRef]
- CAAC. Civil Aviation Airport Production Statistics Bulletin in 2017. Available online: http://www.caac.gov.cn/XXGK/XXGK/TJSJ/201803/t20180307_55600.html (accessed on 9 May 2018).
- SZWRB. Division of Restricted and Prohibited Area of Groundwater Mining in Shenzhen. Available online: www.szwrb.gov.cn/gzhd/myzj/201712/P020171206598893306079.pdf (accessed on 9 May 2018).
- Torrence, C.; Compo, G.P. A practical guide to wavelet analysis. Bull. Am. Meteorol. Soc. 1998, 79, 61–78. [Google Scholar] [CrossRef]
- Tomás, R.; Li, Z.; Lopez-Sanchez, J.M.; Liu, P.; Singleton, A. Using wavelet tools to analyse seasonal variations from InSAR time-series data: A case study of the Huangtupo landslide. Landslides 2015, 13, 437–450. [Google Scholar] [CrossRef]
- CIMA. Available online: http://data.cma.cn/data/cdcdetail/dataCode/SURF_CLI_CHN_MUL_DAY_V3.0.html (accessed on 27 May 2018).
- Agnew, D.C. SPOTL: Some Programs for Ocean-Tide Loading; Scripps Institution of Oceanography: San Diego, CA, USA, 2012. [Google Scholar]
- Allinson, C.; Clarke, P.; Edwards, S.; King, M.; Baker, T.; Cruddace, P. Stability of direct GPS estimates of ocean tide loading. Geophys. Res. Lett. 2004, 31, L15603. [Google Scholar] [CrossRef]
- DiCaprio, C.J.; Simons, M. Importance of ocean tidal load corrections for differential InSAR. Geophys. Res. Lett. 2008, 35, 113–130. [Google Scholar] [CrossRef]
- Peng, W.; Wang, Q.; Cao, Y. Analysis of Ocean Tide Loading in Differential InSAR Measurements. Remote Sens. 2017, 9, 101. [Google Scholar] [CrossRef]
- Lambert, A.; Pagiatakis, S.; Billyard, A.; Dragert, H. Improved ocean tide loading corrections for gravity and displacement: Canada and northern United States. J. Geophys. Res. Solid Earth 1998, 103, 30231–30244. [Google Scholar] [CrossRef] [Green Version]
- HKO. Summary of Meteorological and Tidal Observations in Hong Kong. Available online: http://www.hko.gov.hk/publica/pubsmo.htm (accessed on 27 May 2018).
- SMO. Explanatory Notes on Geodetic Datums in Hong Kong; Hong Kong Government, Survey & Mapping Office: Hong Kong, China, 1995.
- Sun, H.; Zhang, Q.; Zhao, C.; Yang, C.; Sun, Q.; Chen, W. Monitoring land subsidence in the southern part of the lower Liaohe plain, China with a multi-track PS-InSAR technique. Remote Sens. Environ. 2017, 188, 73–84. [Google Scholar] [CrossRef]
- Liu, P.; Li, Q.; Li, Z.; Hoey, T.; Liu, Y.; Wang, C. Land Subsidence over Oilfields in the Yellow River Delta. Remote Sens. 2015, 7, 1540–1564. [Google Scholar] [CrossRef] [Green Version]
- Higgins, S.; Overeem, I.; Tanaka, A.; Syvitski, J.P.M. Land subsidence at aquaculture facilities in the Yellow River delta, China. Geophys. Res. Lett. 2013, 40, 3898–3902. [Google Scholar] [CrossRef] [Green Version]
- Yang, M.; Yang, T.; Zhang, L.; Lin, J.; Qin, X.; Liao, M. Spatio-Temporal Characterization of a Reclamation Settlement in the Shanghai Coastal Area with Time Series Analyses of X-, C-, and L-Band SAR Datasets. Remote Sens. 2018, 10, 329. [Google Scholar] [CrossRef]
- Qin, X.; Liao, M.; Zhang, L.; Yang, M. Structural Health and Stability Assessment of High-Speed Railways via Thermal Dilation Mapping with Time-Series InSAR Analysis. IEEE J. Sel. Top. Appl. Earth Obs. Remote Sens. 2017, 10, 2999–3010. [Google Scholar] [CrossRef]
- Wu, J.; Hu, F. Monitoring Ground Subsidence Along the Shanghai Maglev Zone Using TerraSAR-X Images. IEEE Geosci. Remote Sens. Lett. 2017, 14, 117–121. [Google Scholar] [CrossRef]
- Dai, K.; Liu, G.; Li, Z.; Li, T.; Yu, B.; Wang, X.; Singleton, A. Extracting Vertical Displacement Rates in Shanghai (China) with Multi-Platform SAR Images. Remote Sens. 2015, 7, 9542–9562. [Google Scholar] [CrossRef] [Green Version]
- Dong, S.; Samsonov, S.; Yin, H.; Ye, S.; Cao, Y. Time-series analysis of subsidence associated with rapid urbanization in Shanghai, China measured with SBAS InSAR method. Environ. Earth Sci. 2014, 72, 677–691. [Google Scholar] [CrossRef]
- Chen, J.; Wu, J.; Zhang, L.; Zou, J.; Liu, G.; Zhang, R.; Yu, B. Deformation Trend Extraction Based on Multi-Temporal InSAR in Shanghai. Remote Sens. 2013, 5, 1774–1786. [Google Scholar] [CrossRef] [Green Version]
- Ng, A.; Wang, H.; Dai, Y.; Pagli, C.; Chen, W.; Ge, L.; Du, Z.; Zhang, K. InSAR Reveals Land Deformation at Guangzhou and Foshan, China between 2011 and 2017 with COSMO-SkyMed Data. Remote Sens. 2018, 10, 813. [Google Scholar] [CrossRef]
- Wang, H.; Feng, G.; Xu, B.; Yu, Y.; Li, Z.; Du, Y.; Zhu, J. Deriving Spatio-Temporal Development of Ground Subsidence Due to Subway Construction and Operation in Delta Regions with PS-InSAR Data: A Case Study in Guangzhou, China. Remote Sens. 2017, 9, 1004. [Google Scholar] [CrossRef]
- Lu, P.; Casagli, N.; Catani, F.; Tofani, V. Persistent Scatterers Interferometry Hotspot and Cluster Analysis (PSI-HCA) for detection of extremely slow-moving landslides. Int. J. Remote Sens. 2012, 33, 466–489. [Google Scholar] [CrossRef]
- Barra, A.; Solari, L.; Béjar-Pizarro, M.; Monserrat, O.; Bianchini, S.; Herrera, G.; Crosetto, M.; Sarro, R.; González-Alonso, E.; Mateos, R.; et al. A Methodology to Detect and Update Active Deformation Areas Based on Sentinel-1 SAR Images. Remote Sens. 2017, 9, 1002. [Google Scholar] [CrossRef]
- Bonì, R.; Pilla, G.; Meisina, C. Methodology for Detection and Interpretation of Ground Motion Areas with the A-DInSAR Time Series Analysis. Remote Sens. 2016, 8, 686. [Google Scholar] [CrossRef]
Figure 1.
Shenzhen and its coastlines extracted from Landsat images in 1979, 1991, 2000, 2005, 2010 and 2015. Places shown on the map are Shafu (SF), Fuyong (FY), Gushu (GS), Bihai (BiH), Baoti (BT), Fanshen (FS), Baohua (BaH), Xin’an (XA), Linhai (LH), Qianhaiwan (QHW), Zhenhai (ZH), Mawan (MW), Qianhai (QH), Houhai (HH), and Huaqiaocheng (HQC).

Figure 2.
Study area and major faults. Footprints of ASAR T175, ASAR T025, CSK and S1 images are outlined in dashed lines. The NE trending faults in our study area are Jiuweiling fault (JWF), Henggang-Luohu fault (HGF), Liantang fault (LTF), and Yantian fault (YTF). The NW trending faults in our study area are Tongluojing fault (TLF), Zhengkeng fault (ZKF), Niuweiling fault (NWF), Wentang-guanlan fault (WTF), Jigongshan fault (JGF), Yangtaishan fault (YSF), and Taoyuan fault (TYF) [33].

Figure 3.
(a) ASAR T175, (b) ASAR T025, (c) CSK and (d) S1 archive with acquisition time and length of perpendicular baseline relative to the reference image.
Figure 3.
(a) ASAR T175, (b) ASAR T025, (c) CSK and (d) S1 archive with acquisition time and length of perpendicular baseline relative to the reference image.

Figure 4.
(a) Mean rates derived from InSAR time series of ASAR T175 between 21 November 2004 and 4 April 2010; (b) Mean rates from ASAR T025 between 6 September 2006 and 17 February 2010. Coastlines extracted from Landsat images in 1979, 1991, 2000, 2005, 2010 and 2015 are displayed in grey, light slate grey, slate grey, dim grey, dark slate grey, and black dashed lines respectively. Two points P1 and P2 are marked here for time series analysis. Reference points for ASAR T175 and T025 datasets are shown in black triangles.

Figure 5.
(a) Mean rates derived from CSK between 7 December 2013 and 14 January 2016; (b) Mean rates from S1 between 15 June 2015 and 28 February 2017. Coastlines are the same as Figure 4. Reference points for CSK and S1A datasets are shown in black triangles.
Figure 5.
(a) Mean rates derived from CSK between 7 December 2013 and 14 January 2016; (b) Mean rates from S1 between 15 June 2015 and 28 February 2017. Coastlines are the same as Figure 4. Reference points for CSK and S1A datasets are shown in black triangles.

Figure 6.
Vertical rates estimated from time series of ASAR T175 and T025. Scatter plot shows all pixels common to both tracks. Best-fit line is shown (solid line) along with the 1:1 line (dashed).
Figure 6.
Vertical rates estimated from time series of ASAR T175 and T025. Scatter plot shows all pixels common to both tracks. Best-fit line is shown (solid line) along with the 1:1 line (dashed).
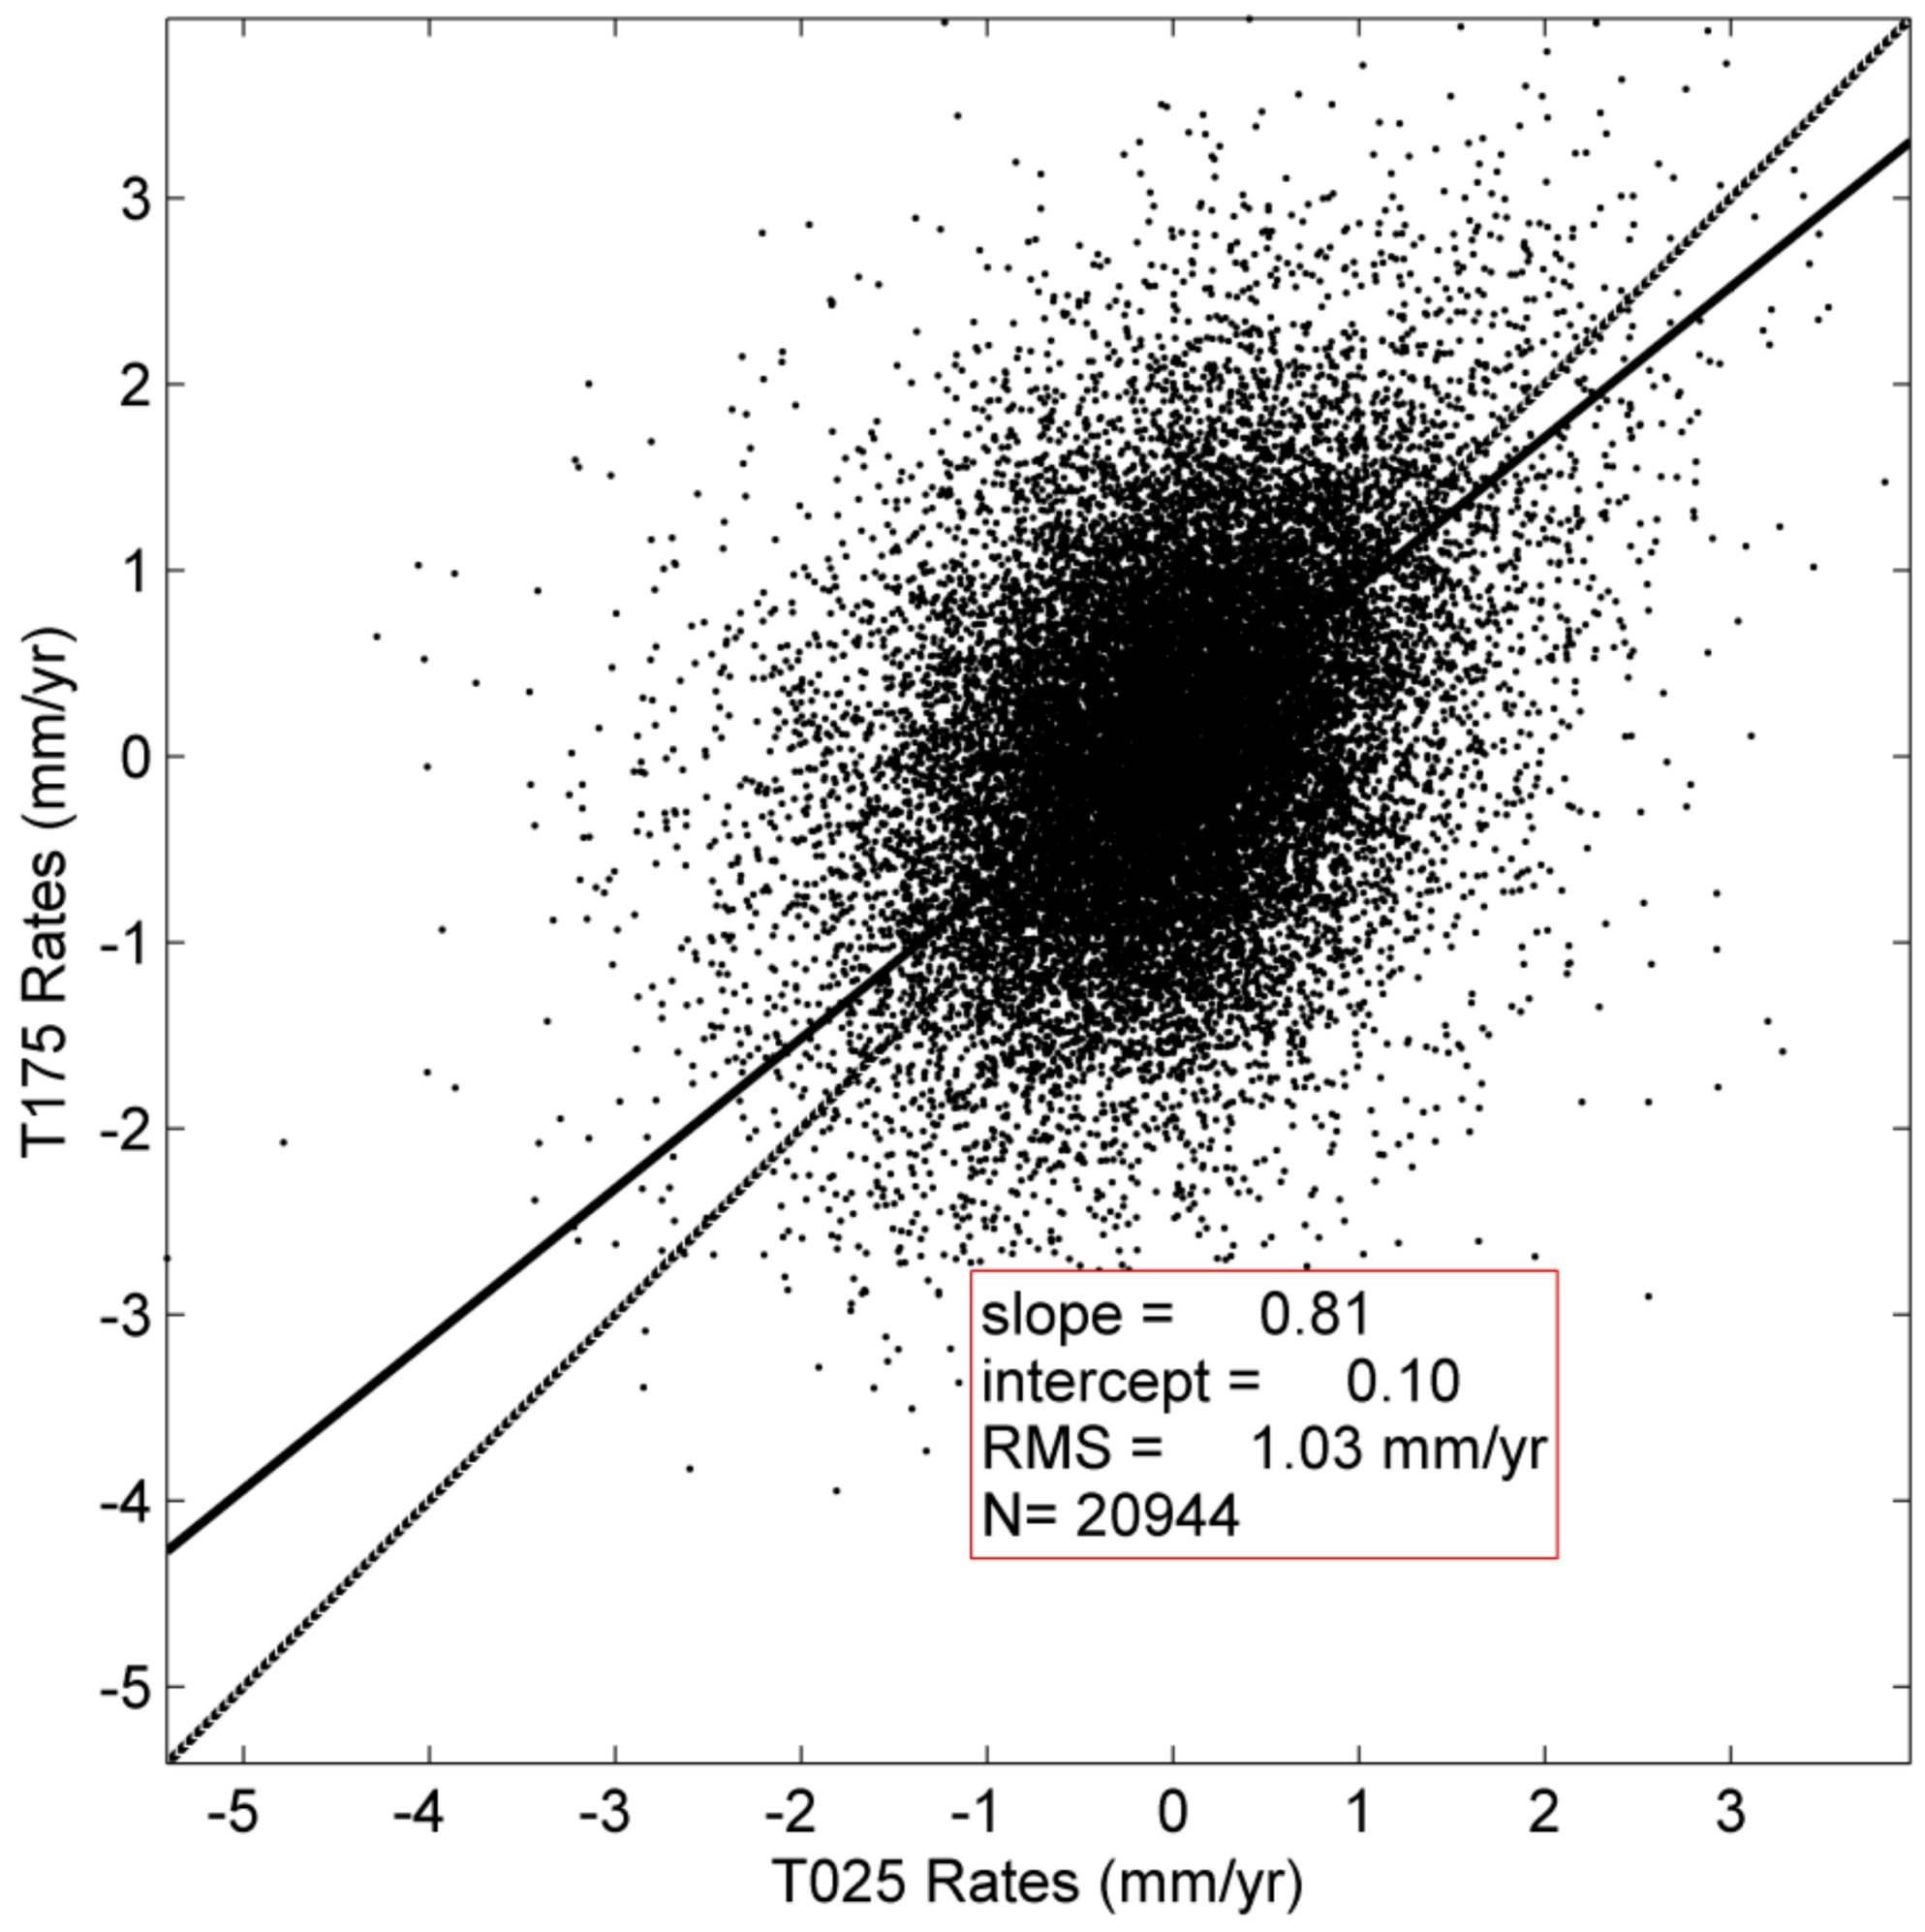
Figure 7.
(a) CSK and (b) S1 mean rates in Qianhai area. The white dashed line is the coastline in 1979. Background is a SPOT-5 image collected on 30 November 2013. Subsidence is outlined by white rectangle.
Figure 7.
(a) CSK and (b) S1 mean rates in Qianhai area. The white dashed line is the coastline in 1979. Background is a SPOT-5 image collected on 30 November 2013. Subsidence is outlined by white rectangle.

Figure 8.
(a) CSK and (b) S1 mean rates in Houhai area. The white dashed line is the coastline in 1979. The white solid rectangle outlines the Shenzhen Bay Sports Center (also known as Spring Cocoon).
Figure 8.
(a) CSK and (b) S1 mean rates in Houhai area. The white dashed line is the coastline in 1979. The white solid rectangle outlines the Shenzhen Bay Sports Center (also known as Spring Cocoon).
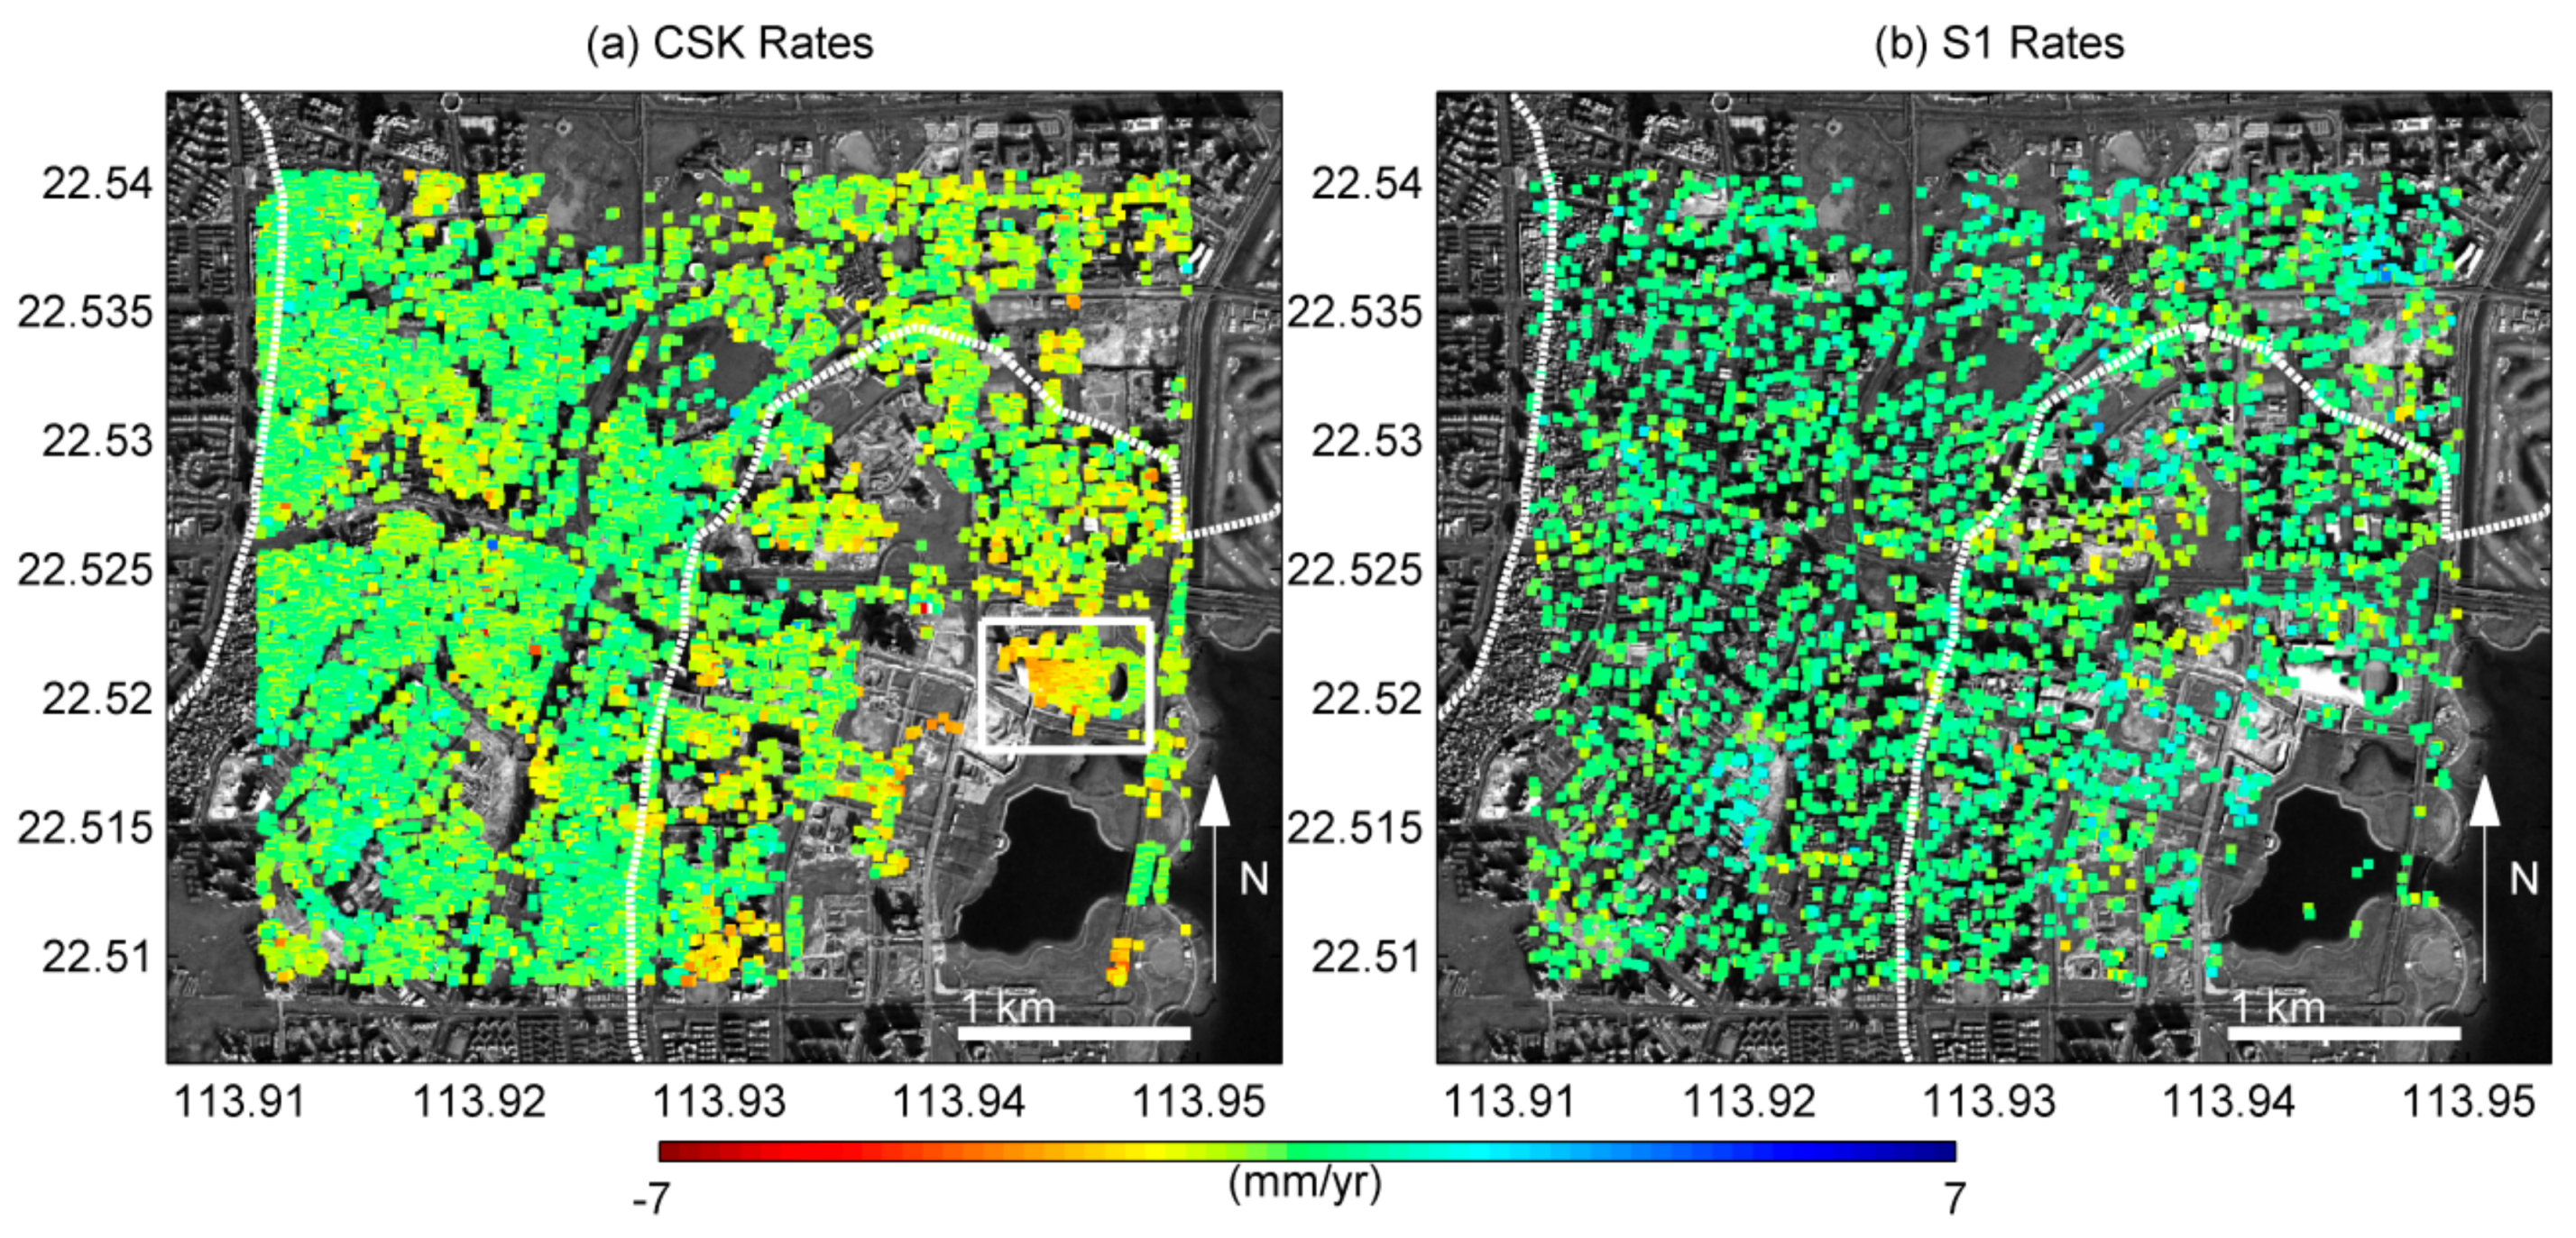
Figure 9.
(a) CSK and (b) S1 mean rates to the south of Shenzhen Bao’an International Airport. The white dashed line is the coastline in 1979. Subsidence is outlined by white rectangle.
Figure 9.
(a) CSK and (b) S1 mean rates to the south of Shenzhen Bao’an International Airport. The white dashed line is the coastline in 1979. Subsidence is outlined by white rectangle.

Figure 10.
(a) CSK and (b) S1 mean rates in Shajing area.

Figure 11.
Mean rates of ASAR T175 (21 November 2004–4 April 2010), ASAR T025 (6 September 2006–17 February 2010), CSK (7 December 2013–14 January 2016), and S1 (15 June 2015–28 February 2017) along the 1979, 1991, 2000, 2005, and 2015 coastlines. “CLYYYY” is short for coastline in year YYYY.
Figure 11.
Mean rates of ASAR T175 (21 November 2004–4 April 2010), ASAR T025 (6 September 2006–17 February 2010), CSK (7 December 2013–14 January 2016), and S1 (15 June 2015–28 February 2017) along the 1979, 1991, 2000, 2005, and 2015 coastlines. “CLYYYY” is short for coastline in year YYYY.

Figure 12.
(a) Mean rates along subways in Shenzhen from ASAR T175 (21 November 2004–4 April 2010) with buffer distance of 250 m to both sides of subway Line 1, Line 2, Line 5 and Line 11; (b–d) are the same for T025 (6 September 2006–17 February 2010), CSK (7 December 2013–14 January 2016) and S1 (15 June 2015–28 February 2017) respectively.

Figure 13.
(a) Mean rates along Line 1 from T175 and T025 with buffer distance of 250 m to both sides of the subway; (b–d) Are the same for Line 2, Line 5, and Line 11 respectively; (e) Mean rates along Line 1 from CSK and S1 with buffer distance of 250 m to both sides of the subway; (f–h) Are the same for Line 2, Line 5, and Line 11 respectively.

Figure 14.
(a) Mean rates along subways in Shenzhen from CSK with buffer distance of 250 m to both sides of Section 2 of Line 5 and Section 2 of Line 9; (b) Is the same for S1; (c) Mean rates along Section 2 of Line 5 from CSK and S1 with buffer distance of 250 m to both sides of the subway; (d) Is the same for Section 2 of Line 9.

Figure 15.
(a) Detrend of Envisat T175 time series at Point P1 (Figure 5b); (b) Continuous wavelet power of the Envisat T175 time series; (c) Daily precipitation recorded by China Meteorological Administration, specifically meteorology station No. 59493 in Shenzhen [51]; (d) Continuous wavelet power of precipitation time series; (e) Cross wavelet transform of Envisat T175 and precipitation time series at P1; (f) Wavelet coherence of Envisat T175 and precipitation time series at P1; (g–l) Are the same for Envisat T025 and precipitation time series at P1; (m–r) Are the same for CSK and precipitation time series at P1; (s–x) Are the same for S1 and precipitation time series at P1. The thick contour is the 95% confidence level. The cone of influence (COI) is shown in light shadow.

Figure 16.
(a) Envisat T175 and T025 time series at Point P2 (Figure 5b); (b) Monthly mean sea levels (MSL) at Tsim Bei Tsui (TBT) and Shek Pik (SP) tidal stations managed by Hong Kong Observatory [57]; (c) Daily tidal level at 00:00 and 12:00 (local time in Hong Kong) at Chek Lap Kok (CLK) tidal station managed by Hong Kong International Airport. The water levels refer to the Hong Kong Principle Datum (HKPD), which is approximately 1.23 m below mean sea level between 1965 and 1983 [58]; (d) Daily precipitation recorded by Shenzhen National Metrological Station [51]; (e–h) Are the same for CSK and S1 time series at P2.
© 2018 by the authors. Licensee MDPI, Basel, Switzerland. This article is an open access article distributed under the terms and conditions of the Creative Commons Attribution (CC BY) license (http://creativecommons.org/licenses/by/4.0/).
Share and Cite
MDPI and ACS Style
Liu, P.; Chen, X.; Li, Z.; Zhang, Z.; Xu, J.; Feng, W.; Wang, C.; Hu, Z.; Tu, W.; Li, H. Resolving Surface Displacements in Shenzhen of China from Time Series InSAR. Remote Sens. 2018, 10, 1162. https://doi.org/10.3390/rs10071162
AMA Style
Liu P, Chen X, Li Z, Zhang Z, Xu J, Feng W, Wang C, Hu Z, Tu W, Li H. Resolving Surface Displacements in Shenzhen of China from Time Series InSAR. Remote Sensing. 2018; 10(7):1162. https://doi.org/10.3390/rs10071162
Chicago/Turabian StyleLiu, Peng, Xiaofei Chen, Zhenhong Li, Zhenguo Zhang, Jiankuan Xu, Wanpeng Feng, Chisheng Wang, Zhongwen Hu, Wei Tu, and Hongzhong Li. 2018. "Resolving Surface Displacements in Shenzhen of China from Time Series InSAR" Remote Sensing 10, no. 7: 1162. https://doi.org/10.3390/rs10071162
Note that from the first issue of 2016, this journal uses article numbers instead of page numbers. See further details here.