Assessment of the SMAP-Derived Soil Water Deficit Index (SWDI-SMAP) as an Agricultural Drought Index in China
by
Jueying Bai
1, 
Qian Cui
2,
Deqing Chen
2,
Haiwei Yu
1,
Xudong Mao
1,
Lingkui Meng
1,* and
Yang Cai
2,* 1
School of Remote Sensing and Information Engineering, Wuhan University, Wuhan 430079, China
2
Information Center (Hydrology Monitor and Forecast Center), Ministry of Water Resources, Beijing 100053, China
*
Authors to whom correspondence should be addressed.
Remote Sens. 2018, 10(8), 1302; https://doi.org/10.3390/rs10081302
Submission received: 5 July 2018
/
Revised: 2 August 2018
/
Accepted: 16 August 2018
/
Published: 18 August 2018
Abstract
:China is frequently subjected to local and regional drought disasters, and thus, drought monitoring is vital. Drought assessments based on available surface soil moisture (SM) can account for soil water deficit directly. Microwave remote sensing techniques enable the estimation of global SM with a high temporal resolution. At present, the evaluation of Soil Moisture Active Passive (SMAP) SM products is inadequate, and L-band microwave data have not been applied to agricultural drought monitoring throughout China. In this study, first, we provide a pivotal evaluation of the SMAP L3 radiometer-derived SM product using in situ observation data throughout China, to assist in subsequent drought assessment, and then the SMAP-Derived Soil Water Deficit Index (SWDI-SMAP) is compared with the atmospheric water deficit (AWD) and vegetation health index (VHI). It is found that the SMAP can obtain SM with relatively high accuracy and the SWDI-SMAP has a good overall performance on drought monitoring. Relatively good performance of SWDI-SMAP is shown, except in some mountain regions; the SWDI-SMAP generally performs better in the north than in the south for less dry bias, although better performance of SMAP SM based on the R is shown in the south than in the north; differences between the SWDI-SMAP and VHI are mainly shown in areas without vegetation or those containing drought-resistant plants. In summary, the SWDI-SMAP shows great application potential in drought monitoring.
1. Introduction
China exhibits a complex and diverse climate because it is located within the monsoon region of southeast Asia [1]. Since the approach and strength of the monsoon induce substantial interannual climate variabilities, drought often occurs throughout northern China. South China also suffers from almost annual seasonal droughts due to blocked, low-level monsoons or weakened water vapors. China is a largely agricultural nation with vast territory and a large population, and thus, unhealthy agricultural development can place an enormous strain on the national economy and significantly impact the life of the people throughout the country [2].
Traditional station-based monitoring methods are unable to meet the drought monitoring demands in China; moreover, the distribution of monitoring stations throughout the country is scarce, and drought monitoring via spatial interpolation inevitably leads to indeterminate deviations. In contrast, remote sensing-based drought monitoring offers an efficient alternative with a high spatiotemporal resolution for which there are numerous drought indices based on the vegetation index, soil moisture, precipitation, evapotranspiration (ET), area of surface water bodies, thermal inertia or mixing index [3,4,5]. As is well known, an agricultural drought, the first manifestation of which is a lack of soil moisture (SM) due to reduced precipitation, represents conditions in which the SM cannot satisfy the needs of crops [6]. Therefore, the SM is a more direct and timely hydrographical factor than many indices. Microwave remote sensing cannot only observe under all weather conditions and all times of day but can also penetrate the surface of the soil to derive the surface SM content, and thus, it has many obvious advantages over optical and thermal infrared remote sensing. Additionally, compared with active microwave, passive microwave has the advantages of wide covering area, simple data processing, and brightness temperature is more sensitive to SM variations. Therefore, passive microwave remote sensing has become one of the most promising tools for mapping global or regional soil moisture. Several satellites with a radiometer, such as the Soil Moisture and Ocean Salinity (SMOS), Soil Moisture Active Passive (SMAP), Meteorological operational (MetOp) satellite, FengYun, and TEARR/QUAR are especially used to continuously monitor global SM [7,8,9,10,11]. Both the SMOS and SMAP satellites utilize L-band microwave for SM inversions. The L-band has been recognized as the most promising band, as it can penetrate the Earth’s surface to obtain the SM at a depth of 5 cm [8,9]. In addition, L-band passive remote sensing can obtain SM with higher accuracy [12,13,14] and can reveal temporal SM changes more effectively for SM applications [13,15]. Nevertheless, SM products may be characterized by signal losses and relatively low precision because China is strongly contaminated by radio frequency interference (RFI), to which the L-band is relatively vulnerable [16,17]. However, since massive approaches have been adopted to mitigate RFI, SMAP products are influenced less by RFI than SMOS products [9,14,18]. Therefore, the SMAP SM is more suitable for applications in China. Some preliminary research has been conducted on the validation of the SMAP SM product, mainly concentrated in northwest China [19,20,21,22,23]. The surface SM at a depth of 5 cm can be captured relatively well by the SMAP radiometer, and its accuracy varies among different regions and land cover types [15]; however, the abovementioned study may have underestimated the accuracy of the SMAP L3 SM product due to the maldistribution of the station distribution, especially since the differences in SM across different regions are substantial. Consequently, drought monitoring approaches still crucially require SM evaluation in this regard.
Various methods based on microwave satellite SM have been used in drought assessments, some of which were based on relative variations in the SM, including SM anomalies [24] and absolute SM comparison [25,26]. The SM has been combined with the temperature and vegetation in some methods, such as the high-resolution soil moisture deficit index (HSMDI) [27] and the soil moisture agricultural drought index (SMADI) [28,29]. Others, such as the soil moisture index (SMI) [5,30], modified SMI (SMIm) [30] and the soil water deficit index (SWDI) [31,32,33,34], use soil characteristics. The SWDI has been considered a promising approach for utilizing the soil physical characteristics to measure the available SM in the root zone for crop absorption since it has a greater bio-physical meaning than other vegetation indices, climatic variables and even some methods based on SM [32]. More importantly, the SWDI can be applied to short-term drought monitoring. Several researchers have combined the SWDI derived from L-band microwave satellite data with SMOS or SMAP SM products to improve drought warnings [32,33,34]. Paredes-Trejo et al. [33] evaluated the performance of SMOS-derived SWDI data and analyzed the influencing factors on the SWDIS-atmospheric water deficit (AWD) coupling. Martínez-Fernández et al. [32] focused on three methods, namely, the SM series, laboratory, and pedo-transfer function (PTF) methods, to obtain the soil water parameters of satellite indices, and the three methods showed similar results. Mishra et al. [34] described the potential of the SMAP-derived SWDI by comparing it with the AWD, standardized precipitation evapotranspiration index (SPEI), self-calibrated Palmer drought severity index (sc-PDSI) and Palmer Z-index over the Continental United States (CONUS), upon which the SWDI derived from microwave satellite SM data showed good agreement with the AWD. However, few relevant investigations have been performed in China. Accordingly, in this study the SWDI is employed for an assessment of agricultural drought throughout China.
The main purposes of the present study are threefold. (1) Provide a pivotal evaluation of whether appropriate SMAP L3 SM data are available in China to prepare for the SWDI-SMAP calculations; (2) Calculate the SWDI-SMAP over China and compare the SWDI-SMAP results with the well-known agricultural drought index AWD; (3) Compare the mapping of the SWDI-SMAP and an agro-ecology drought index, namely, the vegetation health index (VHI), which is based on vegetation indices and temperature data derived from optical remote sensing satellite observations.
2. Materials and Methods
2.1. Datasets
2.1.1. Study Area
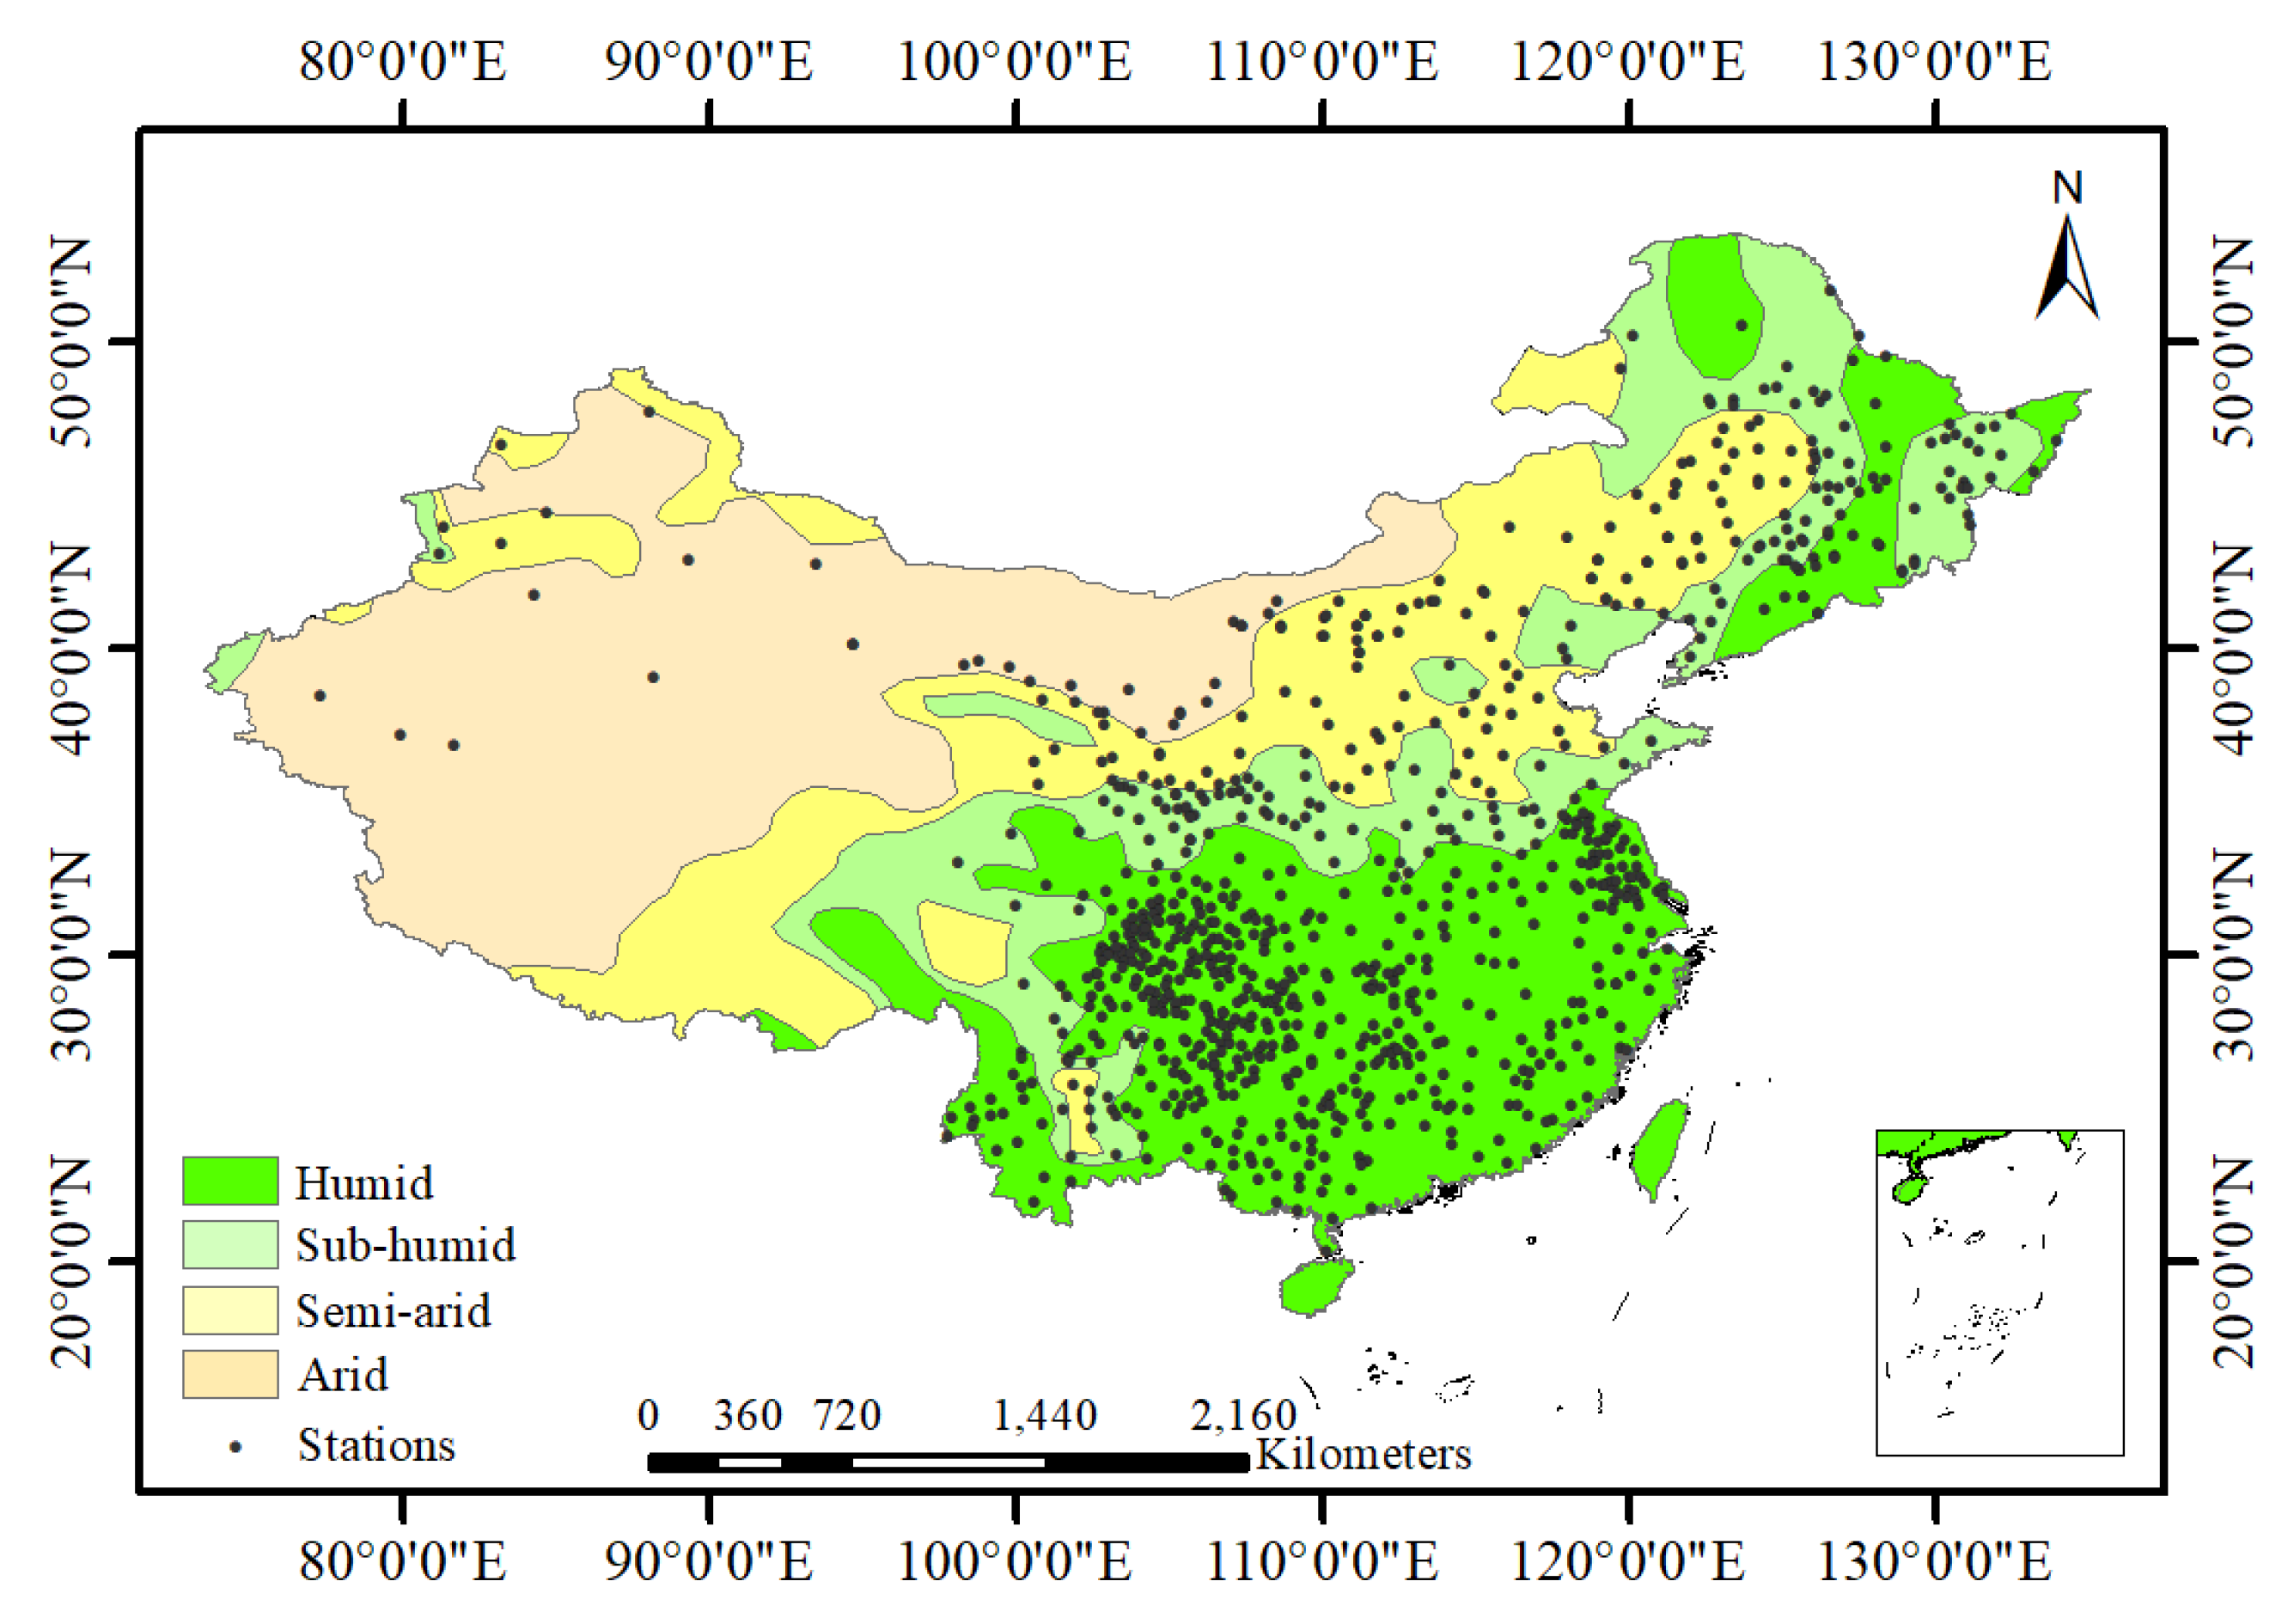
China is situated in eastern Asia (3°51′ N–53°33′ N, 73°33′ E–135°05′ E) by the western Pacific Ocean [35]. China has a vast territory occupying an area of approximately 9.6 million square kilometers. The overall topography is characterized by three ladder-like distribution with higher elevations in the west and lower elevations in the east [15]. China’s climate is significantly affected by both the continent and ocean and the vast expanse of China is across degrees of latitude. Therefore, China’s climate is complex and diverse, including temperate monsoon climate, temperate continental climate, subtropical monsoon climate, tropical monsoon climate and plateau mountain climate. The unevenly distributed annual total precipitation and temperature decrease from the southeast coastal areas (the annual total precipitation is more than 2000 mm) to the northwest interior areas (the annual total precipitation is less than 25 mm) [36]. According to aridity index (a ratio of potential evapotranspiration to precipitation) of 1.0, 1.5 and 4.0, China is generally divided into four arid and humid regions, including an arid region, semi-arid region, sub-humid region and humid region [37,38,39]. In this study, the arid and humid regions refer to Ref. [37], as shown in Figure 1.
2.1.2. SMAP SM Product
The SMAP satellite was launched by NASA in January 2015 on a 685 km, sun-synchronous, near-polar orbit to acquire global measurements of the SM at a depth of 5 cm [9]. It carries an active L-band radar (1.26 GHz) and a passive L-band radiometer (1.41 GHz) to provide 3-km, 9-km and 36-km SM estimates. However, the active radar failed on 7 July 2015. The 36-km radiometer SM measurements beginning in January 2015 can still be obtained. Different levels of SMAP products are defined as Level 2 for half orbit-based data, Level 3 for daily composites and Level 4 for model assimilation [40], and the Level 3 daily composites are composited from the Level 2 half orbit-based data. The SMAP L3 radiometer SM product (SPL3SMP) at 6:00 am (descending) can be freely downloaded from the National Snow and Ice Data Center (NSIDC) (https://nsidc.org/data/smap/smap-data.html) and is used in this work [41]. The data between 1 April 2016 and 30 September 2016 were selected to avoid the lack of data attributable to frozen soil.
2.1.3. Ground Observation Databases
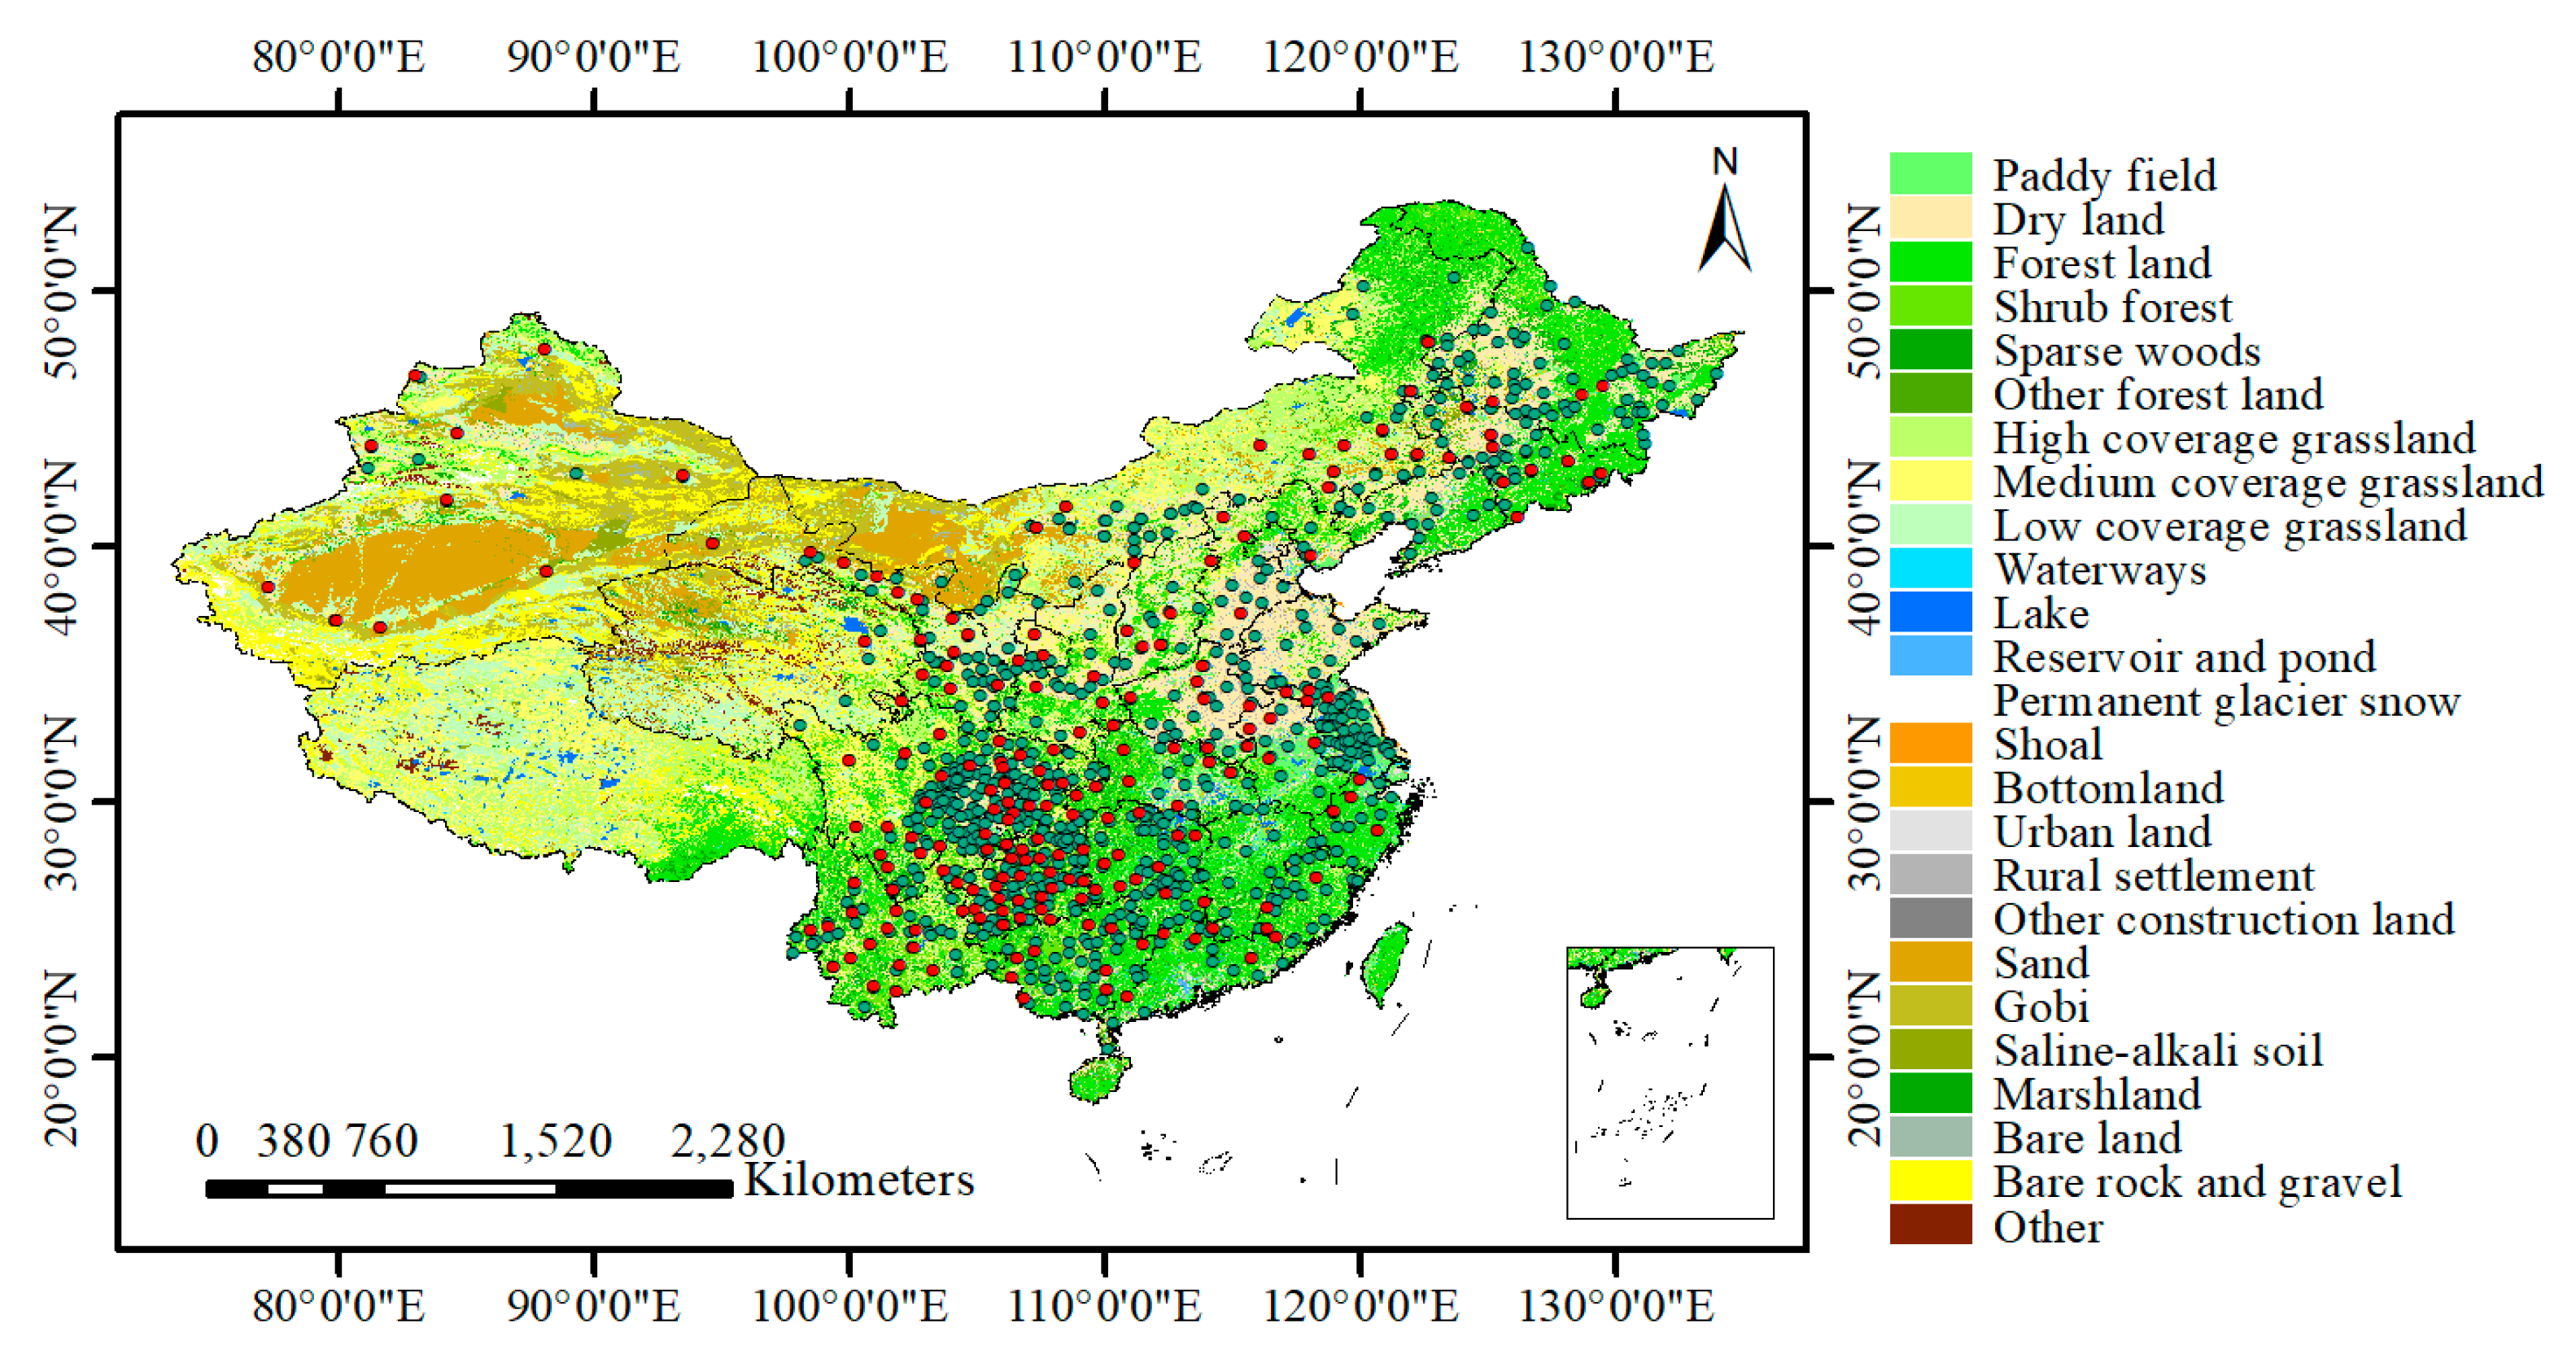
The in situ SM data are provided by the China Meteorological Administration (CMA). The 893 SM stations gather SM at 08:00 Singapore Time (SGT) on the 1st, 6th, 11th, 16th, 21st, and 26th of each month at three standard depths (10 cm, 20 cm and 40 cm). There is a lack of widely distributed SM data at 5 cm in China, and thus, we choose the SM at 10 cm instead of 5 cm to evaluate the SMAP SM product. The use of in situ SM data at 10 cm may add some uncertainty in the evaluation, as SMAP L3 SM represents the soil water condition of 0–5 cm depth. For higher correlation coefficients on SM in two contiguous layers [13], the mismatched vertical depth has more impact on the indices about deviation of SMAP L3 SM. Theoretically, SM at 10 cm depth is a little higher than SMAP L3 SM due to infiltration of SM and evaporation. In particular, the errors could be increased for limited rainfall events and in contexts of high evaporation level [42]. The dataset of daily climate data from Chinese surface stations in China (http://data.cma.cn) operated by the CMA provides climate data, including daily precipitation, pressure, sunshine duration, wind speed, wind direction, air temperature, ground temperature, relative humidity, and evaporation, at weather stations beginning in January 1951. However, among the 893 SM stations, only 204 stations monitor both SM and climate data. The locations of the monitoring stations in this study are shown in Figure 2. These 893 stations are mainly distributed in paddy fields, dry land, forest land, shrub forest, sparse woods, high-coverage grassland, medium-coverage grassland, low-coverage grassland, urban land and rural settlements.
In this study, all 893 SM stations were used for more thorough evaluation of the SMAP L3 radiometer SM product (Section 3.1), and 204 stations were applied in the evaluation of the 7-day averaged SMAP SM (Section 3.1) and in the comparison between the SWDI-SMAP and AWD (Section 3.2).
2.1.4. Soil Water Parameters
The China Soil Map-Based Harmonized World Soil database (v1.1), which is available from the Environmental and Ecological Science Data Center for West China (WESTDC, http://westdc.westgis.ac.cn) [43], is derived from the Harmonized World Soil Database (v1.1) constructed by the United Nations Food and Agriculture Organization (FAO) and the International Institute for Applied Systems Analysis (IIASA) in Austria. The 1:100 million soil data, which use the FAO-90 soil classification system and the WGS-84 reference coordinate system, are provided by the Nanjing Soil Institute in China through the Second National Land Survey [44].
In this study, the edaphic parameters of various types of soils, including sand, silt, clay, and organic carbon, within the topsoil (0–30 cm) are needed for the calculation of soil water parameters (i.e., SM at field capacity and at wilting point) using pedo-transfer function (PTF). More details are provided in Section 2.2.1. The calculation was first performed at a spatial resolution of 1:100 million, after which the soil water parameters were extracted based on in situ SM station points and aggregated at the SMAP L3 spatial resolution.
2.1.5. Auxiliary Data
The land cover data for China (WESTDC_Land_Cover_Products1.0) are provided by the Environmental and Ecological Science Data Center for West China, National Natural Science Foundation of China (http://westdc.westgis.ac.cn) [45,46]. According to the Chinese Academy of Sciences State Key Laboratory of Resources and Environmental Information System, the dataset is classified into 25 types of land cover (e.g., paddy field, dry land, forestland, and shrub wood) and has a 1-km spatial resolution. This relatively elaborate classification is favorable to the analysis conducted in this paper. The differences in the land cover structure among different regions are substantial, in relation to a certain spatial framework.
2.2. Methodology
2.2.1. Soil Water Deficit Index (SWDI)
The SWDI, which is based on the surface SM, the SM at field capacity and the available water, can be used to capture agricultural drought conditions through bio-physical principles [33,47]. The SWDI is calculated as follows:
where is the SM at a depth of 5 cm, is the SM at field capacity, and is the SM at the available water content and is calculated by subtracting the SM at wilting point () from the SM at field capacity () [34]. In addition, the range of values is transformed from a fractional magnitude to a range with agricultural meaning by multiplied by 10.
The p factor of the readily available soil water definition is the fraction of the total available soil water that can be depleted from the root zone prior to the onset of moisture stress [47,48]. Considering that the p factor, which varies for the main crop from 0.2 (SWDI of −2) to 0.8 [47], and is below 0.5 for 50% of the crops considered by Allen et al. [48], Martínez-Fernández et al. [47] developed a severity scale of drought for the SWDI, as shown in Ref. [47]. A value of zero represents a critical threshold in the SWDI distinguishing between drought and non-drought conditions. Positive values (i.e., SWDI > 0) indicate no drought because excess water is available for plant absorption, while negative values (i.e., SWDI < 0) imply agricultural drought due to inadequate water for plant growth. However, the impact of agricultural drought depends on the type of crops and p factor [32,33,48]. When the SWDI ≤ −10, the water deficit is absolute, which means the soil water content is below the lower limit of available water for crops [47,49].
It is apparent that both and are critical for calculating the SWDI. Several methods, namely, the three methods based on the SM series, laboratory approaches, and the pedo-transfer function (PTF), can be applied to estimate and [32,50]. In the first method, the 5th percentile and 95th percentile or the long-term minimum and maximum based on SMAP SM time series, are estimators of and . This needs be validated and corrected using long-term SM measurements. The use of the second method is complex and time-consuming. In terms of PTF, it has been proven useful in transforming the soil physical characteristics into soil water parameters in many areas [51]. The PTF from Saxton and Rawls [52] can estimate and using only commonly available variables of soil texture and organic matter (OM) and include a greater application range. In addition, all three methods utilized to obtain and have been proven to show similar results, and their correlations between the SWDI-SMAP and the SWDI based on in situ SM are all strong [32]. Considering the above factors, the PTF from Saxton and Rawls [52] was applied in this study, as in Refs. [34,52].
2.2.2. Atmospheric Water Deficit (AWD)
The AWD agricultural drought index reflects the soil water storage conditions and is closely associated with the upper SM [53]. Consequently, the AWD has been compared with the SWDI derived from satellite SM products; and the correlation between the SWDI and AWD was demonstrated to be stronger than that between the SWDI and other common indices, such as the crop moisture index (CMI), Palmer Z-index, and sc-PDSI [32,33,53]. Therefore, the AWD was used to evaluate the SWDI-SMAP in the present study. The daily AWD was calculated through the daily reference evapotranspiration (ET0), which was estimated using the Penman-Monteith formula, minus the daily precipitation and then aggregated into the 7-day AWD [34,53].
2.2.3. Vegetation Health Index (VHI)
The VHI [54], which describes the vegetative health from a combination of temperature condition index (TCI) [55] and vegetation condition index (VCI) [55], is proposed by Kogan et al. [56]. The TCI and VCI with different weights are summed, and the weight is decided by the contributions of TCI and VCI. At present, it is widely used as a remote sensing drought index [57]. In this study, the VHI mapping comes from the FAO of the United Nations (http://www.fao.org/giews/en/), where the VHI is computed in three modalities (i.e., decadal, monthly and annual), and the VCI and TCI are given equal weights.
3. Results
3.1. Evaluation of SMAP L3 Radiometer SM
In this evaluation, two spatial scales were adopted to fully verify the performance of the SMAP SM product and to prove its availability: the point scale, at which SM derived from every SM station was compared with the SMAP SM of the corresponding pixel, and the regional scale, at which the average of SMAP SM was compared with the in situ SM derived by averaging all stations within the region. Additionally, the 7-day averaged SMAP SM and in situ SM were calculated for evaluation and 30 pairs of SM were obtained from 1 April to 30 September 2016. At the point scale, the daily and 7-day averaged SMAP SM and in situ SM were used. At the regional scale, only the 7-day averaged SMAP SM and corresponding averaged in situ SM were calculated.
The Pearson correlation coefficient (R), bias, root mean square error (RMSE) and unbiased RMSE (ubRMSE) were used for evaluation in this study. R accurately describes the relative accuracy between the SMAP L3 SM and in situ SM. The ubRMSE, which removes mean bias from the RMSE, was adopted for the evaluation at the point scale, as one point is poorly representative for one SMAP pixel. Additionally, the bias is calculated by:
where is the linear averaging operator, and and are the SMAP and the in situ observed SM values, respectively. In addition, the point-wise measurements represent poorly the average SM observed by SMAP for complex environmental characteristics (e.g., land cover, soil texture and topography). In this study, only R and ubRMSE were selected in the evaluation at the point scale.
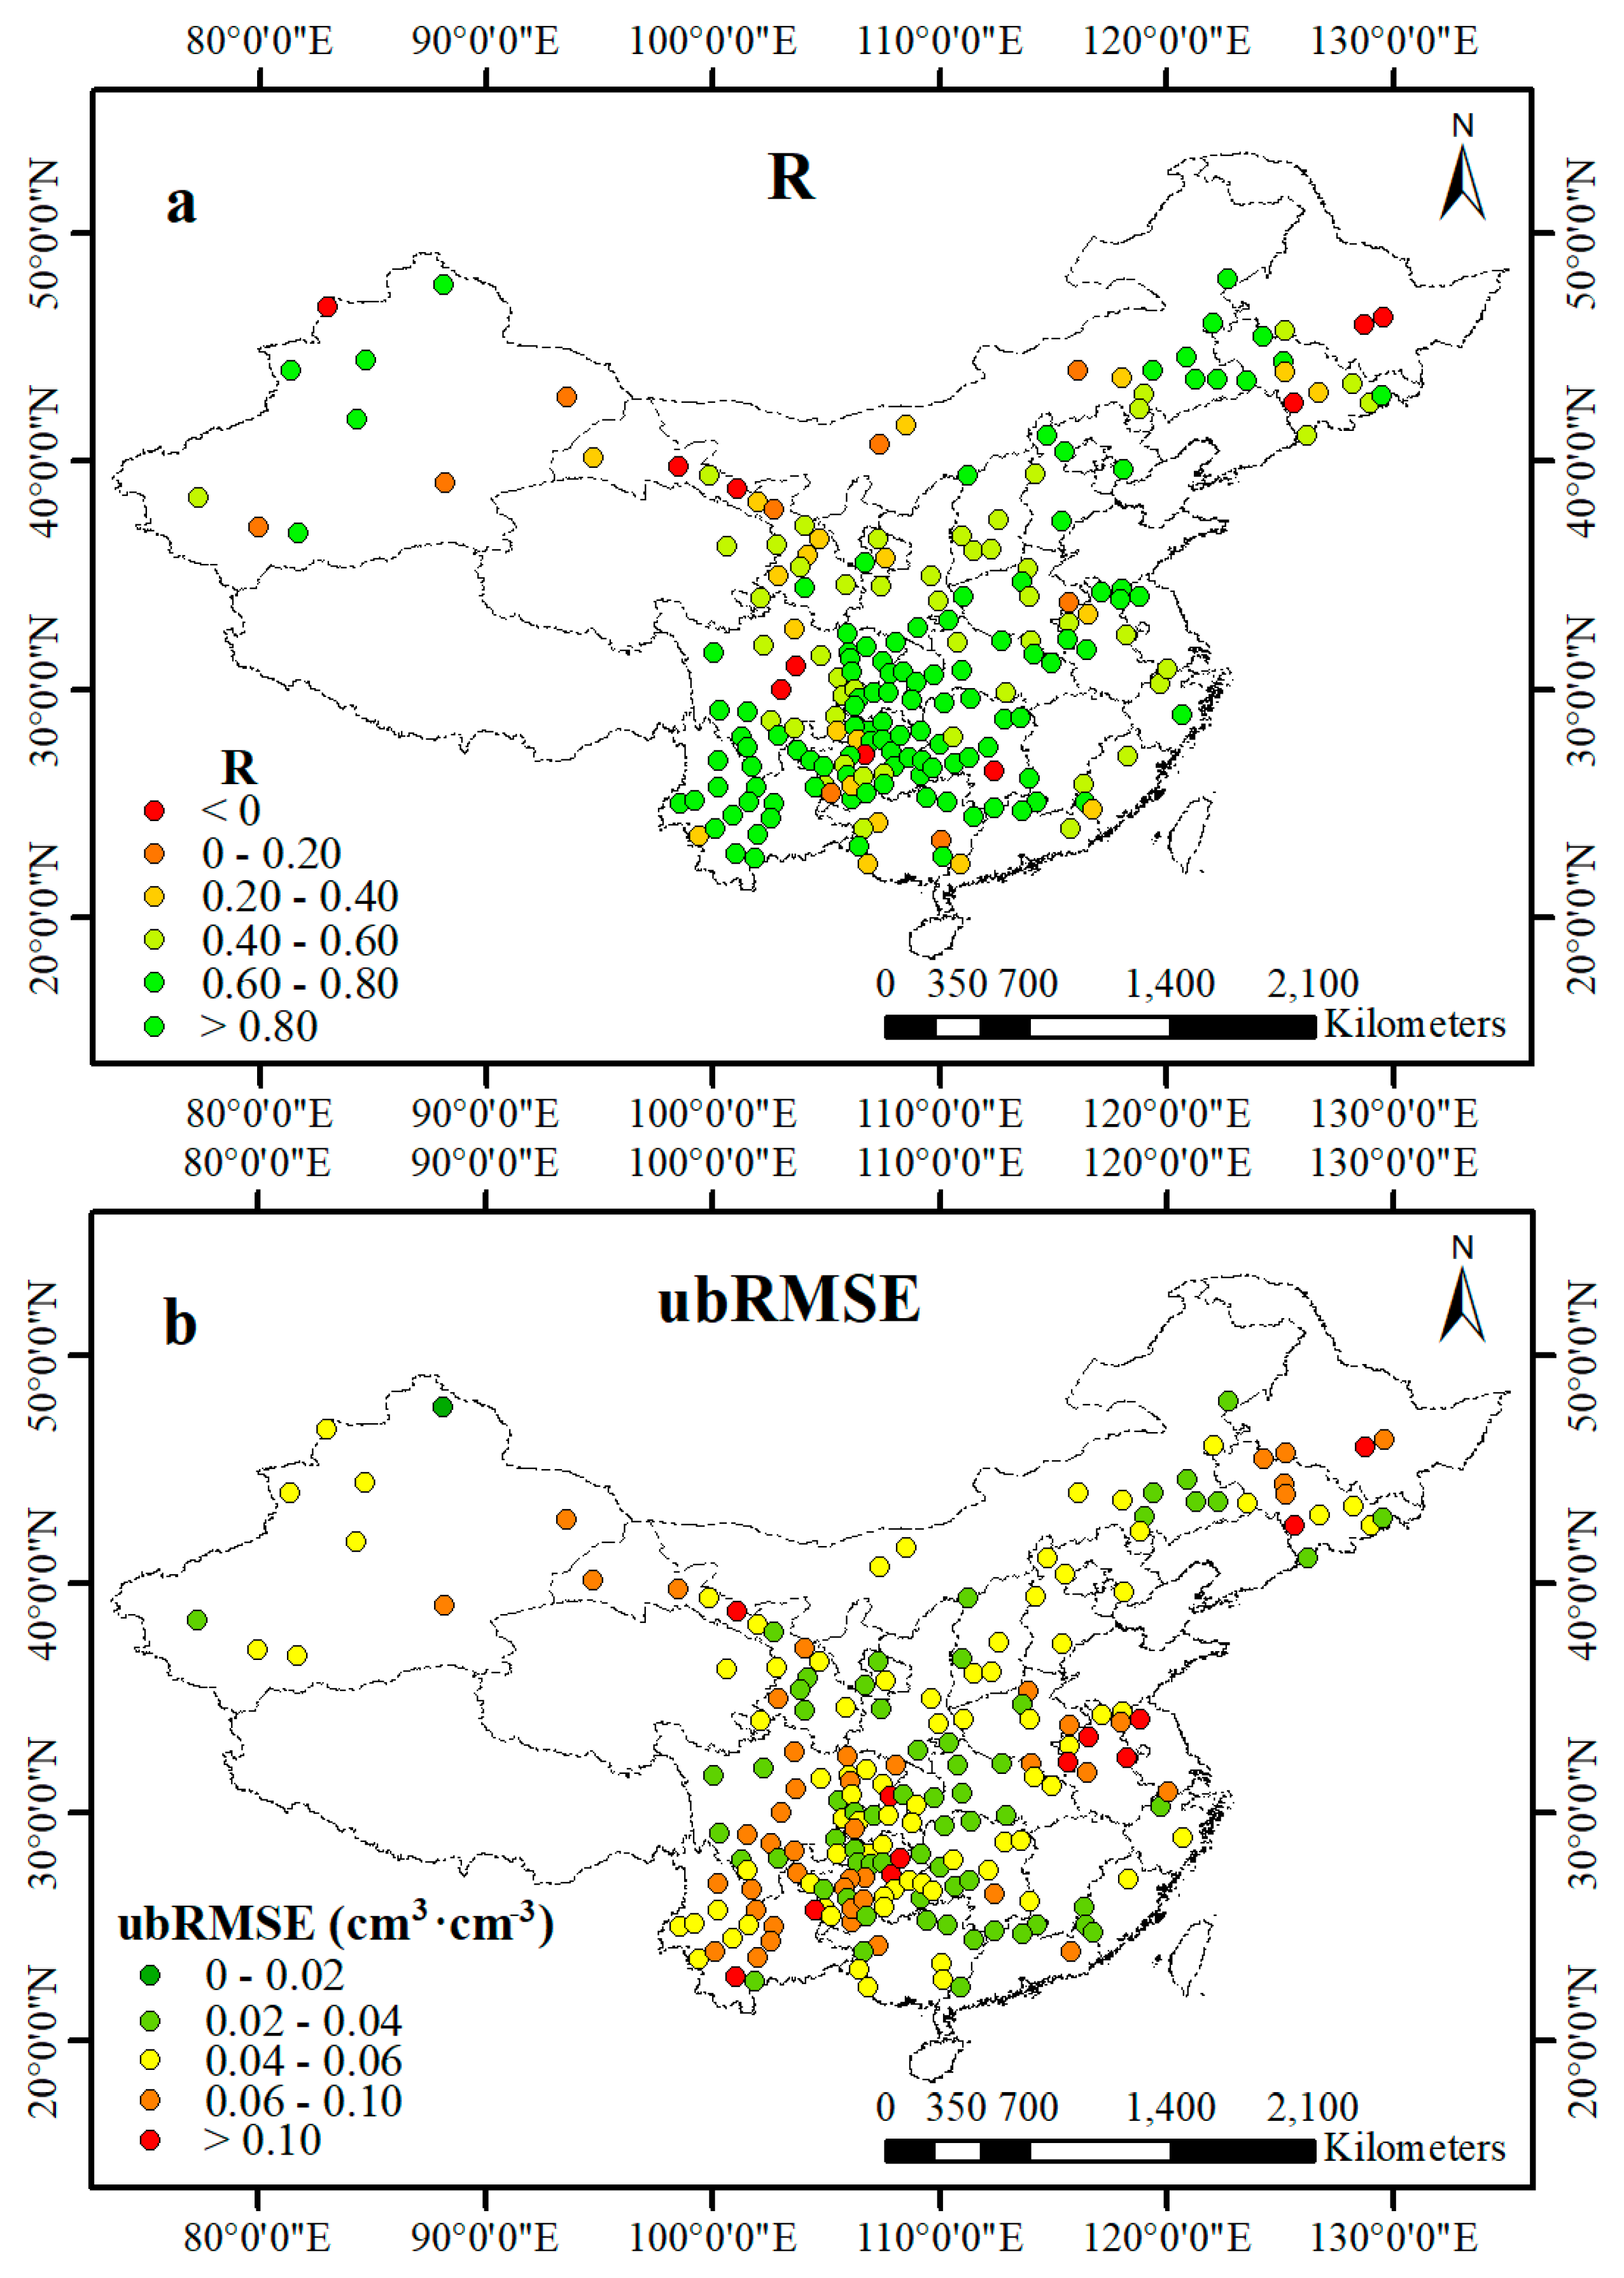
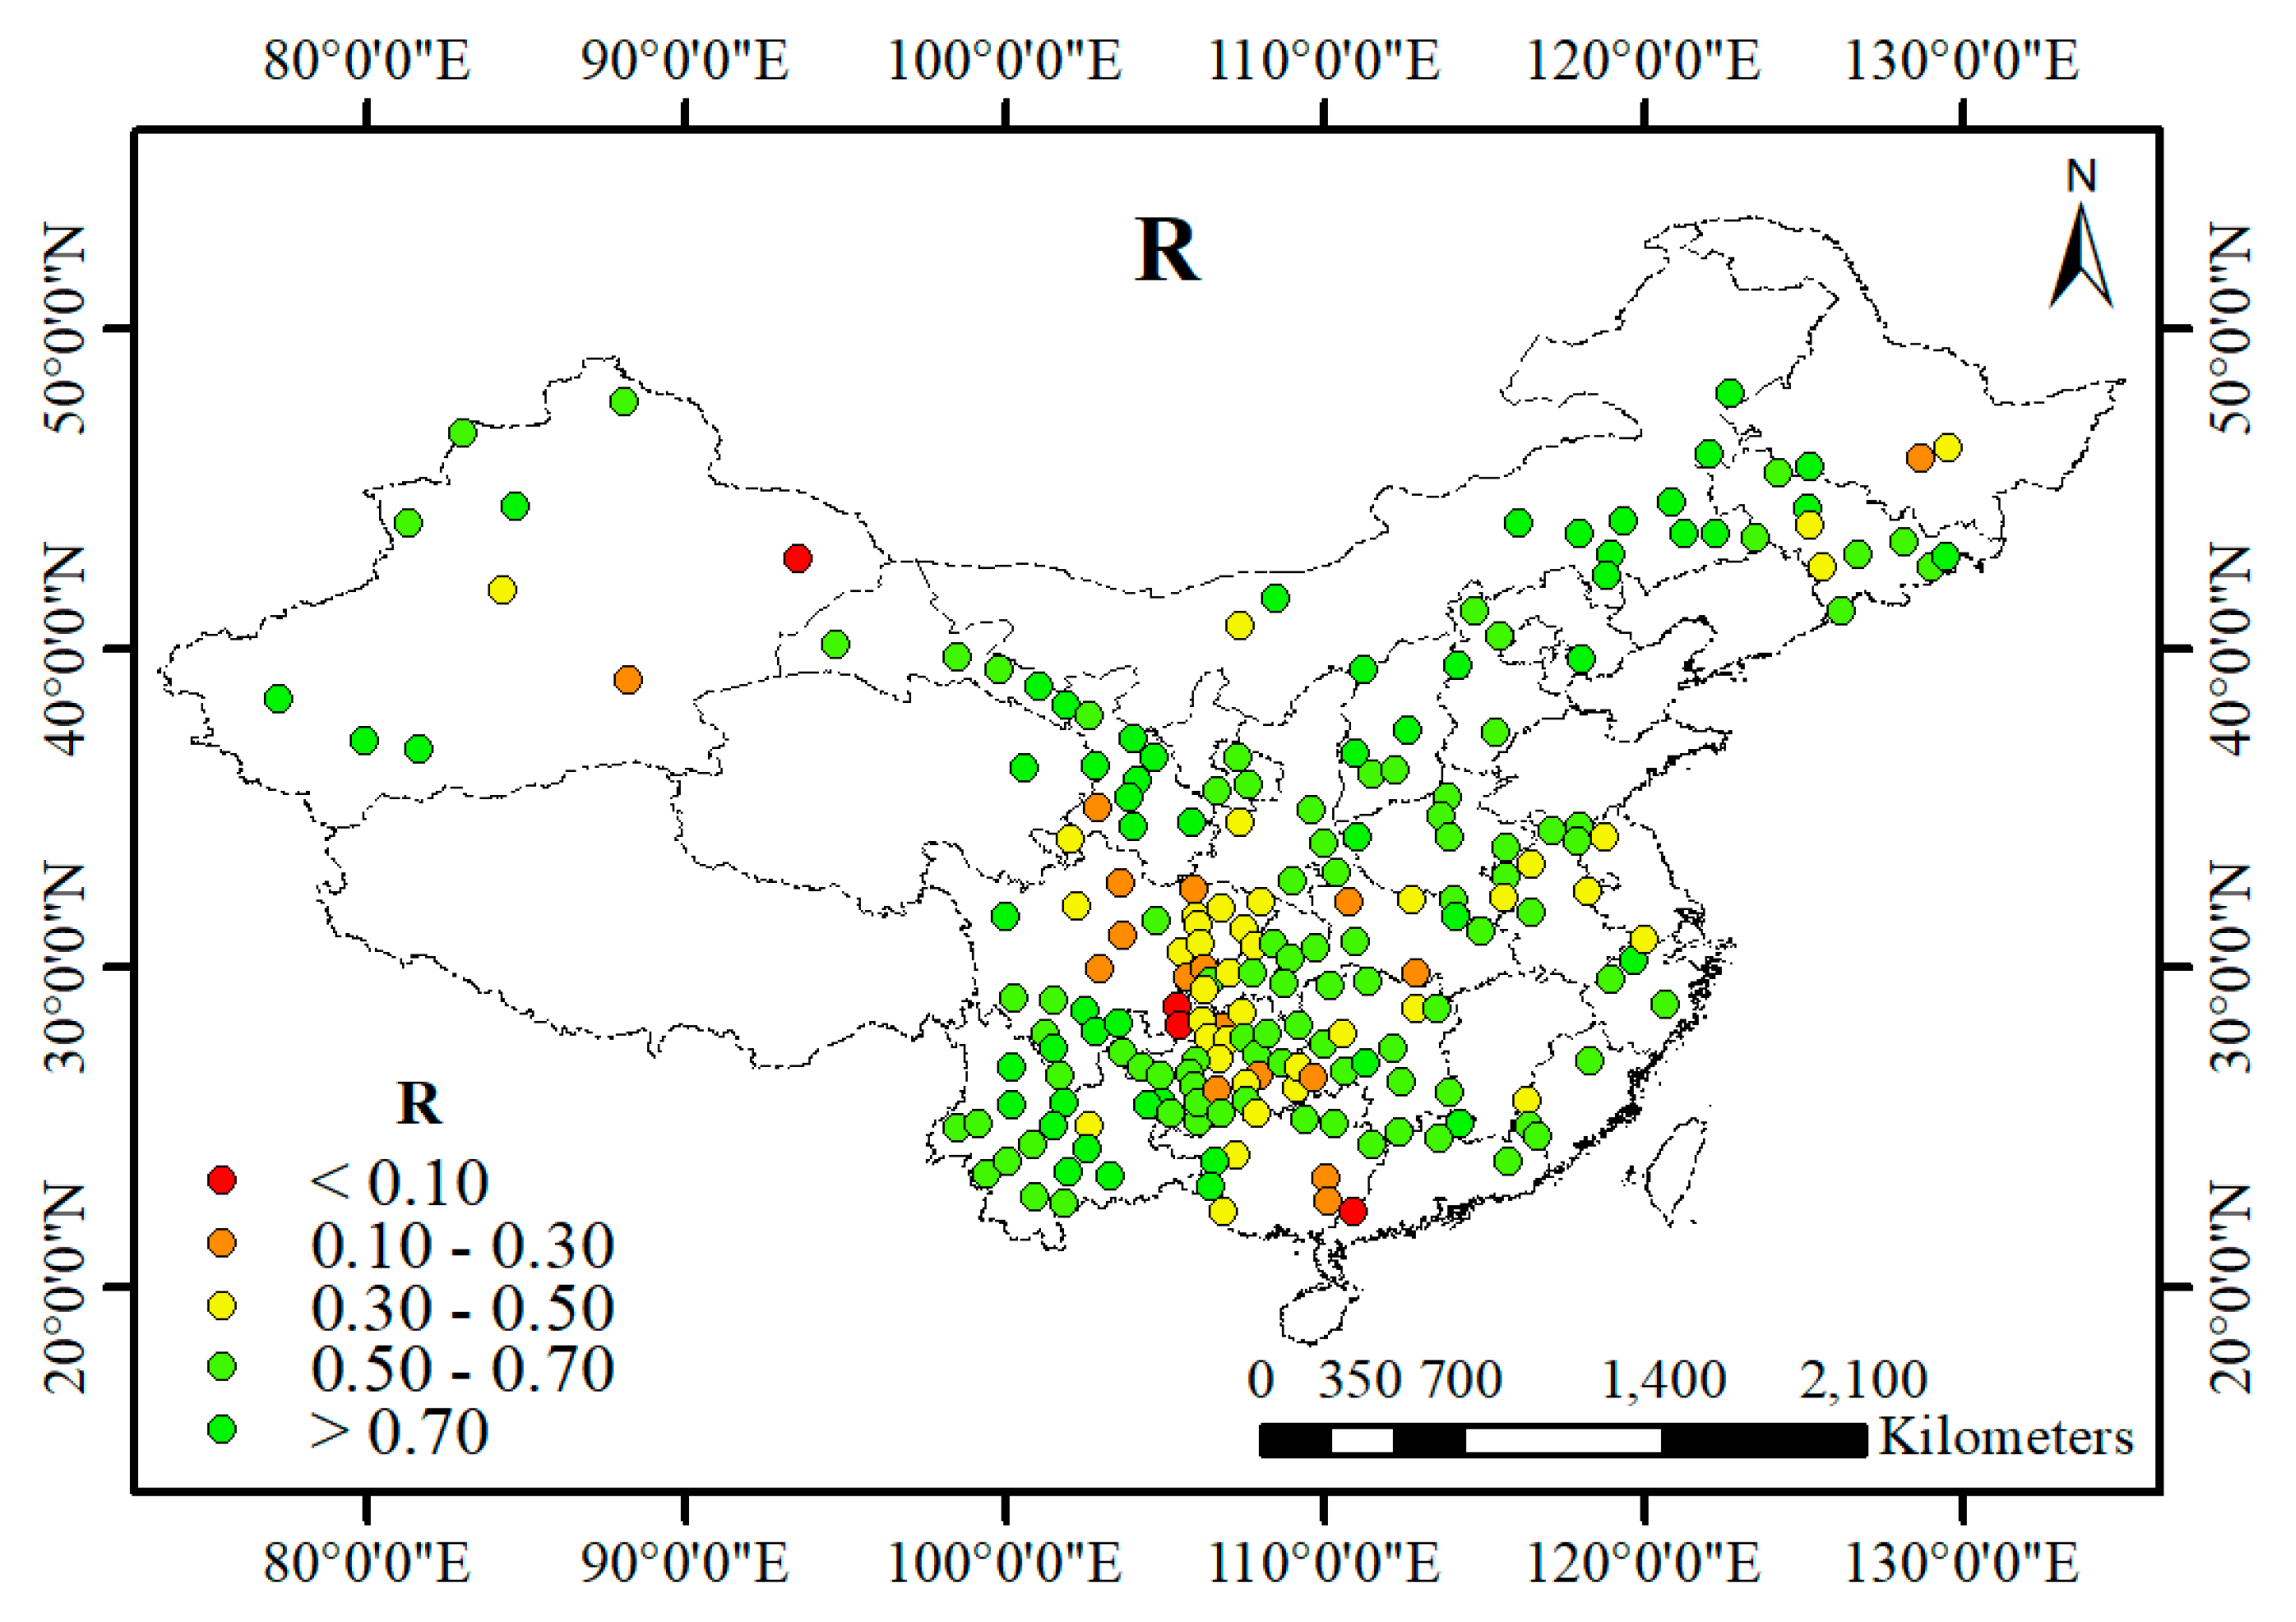
At the point scale, as a first step, we compared daily SMAP SM and in situ SM on the same day for 893 soil moisture stations using R and ubRMSE (Figure 3). In terms of R, 36 percent perform well (R > 0.6), 23 percent perform fairly (0.4 < R < 0.6) and 41 percent perform poorly (R < 0.4). Furthermore, 13 percent of stations have an extremely poor performance (R < 0), and most of these are located in undulating mountain regions with high slope gradients, such as the Hengduan Mountains on the western side of the Sichuan Basin, Qilian Mountains, Yin Mountains, and others are in Jiangsu Province. In addition, relatively poor performance (0.4 > R > 0) is found along China’s southeastern coastline and in northeast China (Figure 3a). The target accuracy of the SMAP mission is 0.04 cm3·cm−3, which was defined as the primary threshold of the ubRMSE. Among the 893 stations, 17 percent satisfy the goal of 0.04 cm3·cm−3, while 74 percent show a fair performance (ubRMSE > 0.04 cm3·cm−3 and ubRMSE < 0.10 cm3·cm−3). Overall, stations in southeast China exhibits the best ubRMSE performance (Figure 3b). At a second step, for synchronous analysis with the latter drought monitoring, 30 pairs of 7-day averaged SMAP SM and in situ SM from 1 April 2016 to 30 September 2016 were compared for 204 stations with both SM and climate data (Figure 4). In terms of R, 56 percent of the 204 stations perform well (R > 0.6), 24 percent perform fairly (0.4 < R < 0.6) and 20 percent perform poorly (R < 0.4). Among the 204 stations, 32 percent meet the target accuracy of 0.04 cm3·cm−3, and 62 percent perform fairly (ubRMSE > 0.04 cm3·cm−3 and ubRMSE < 0.10 cm3·cm−3).
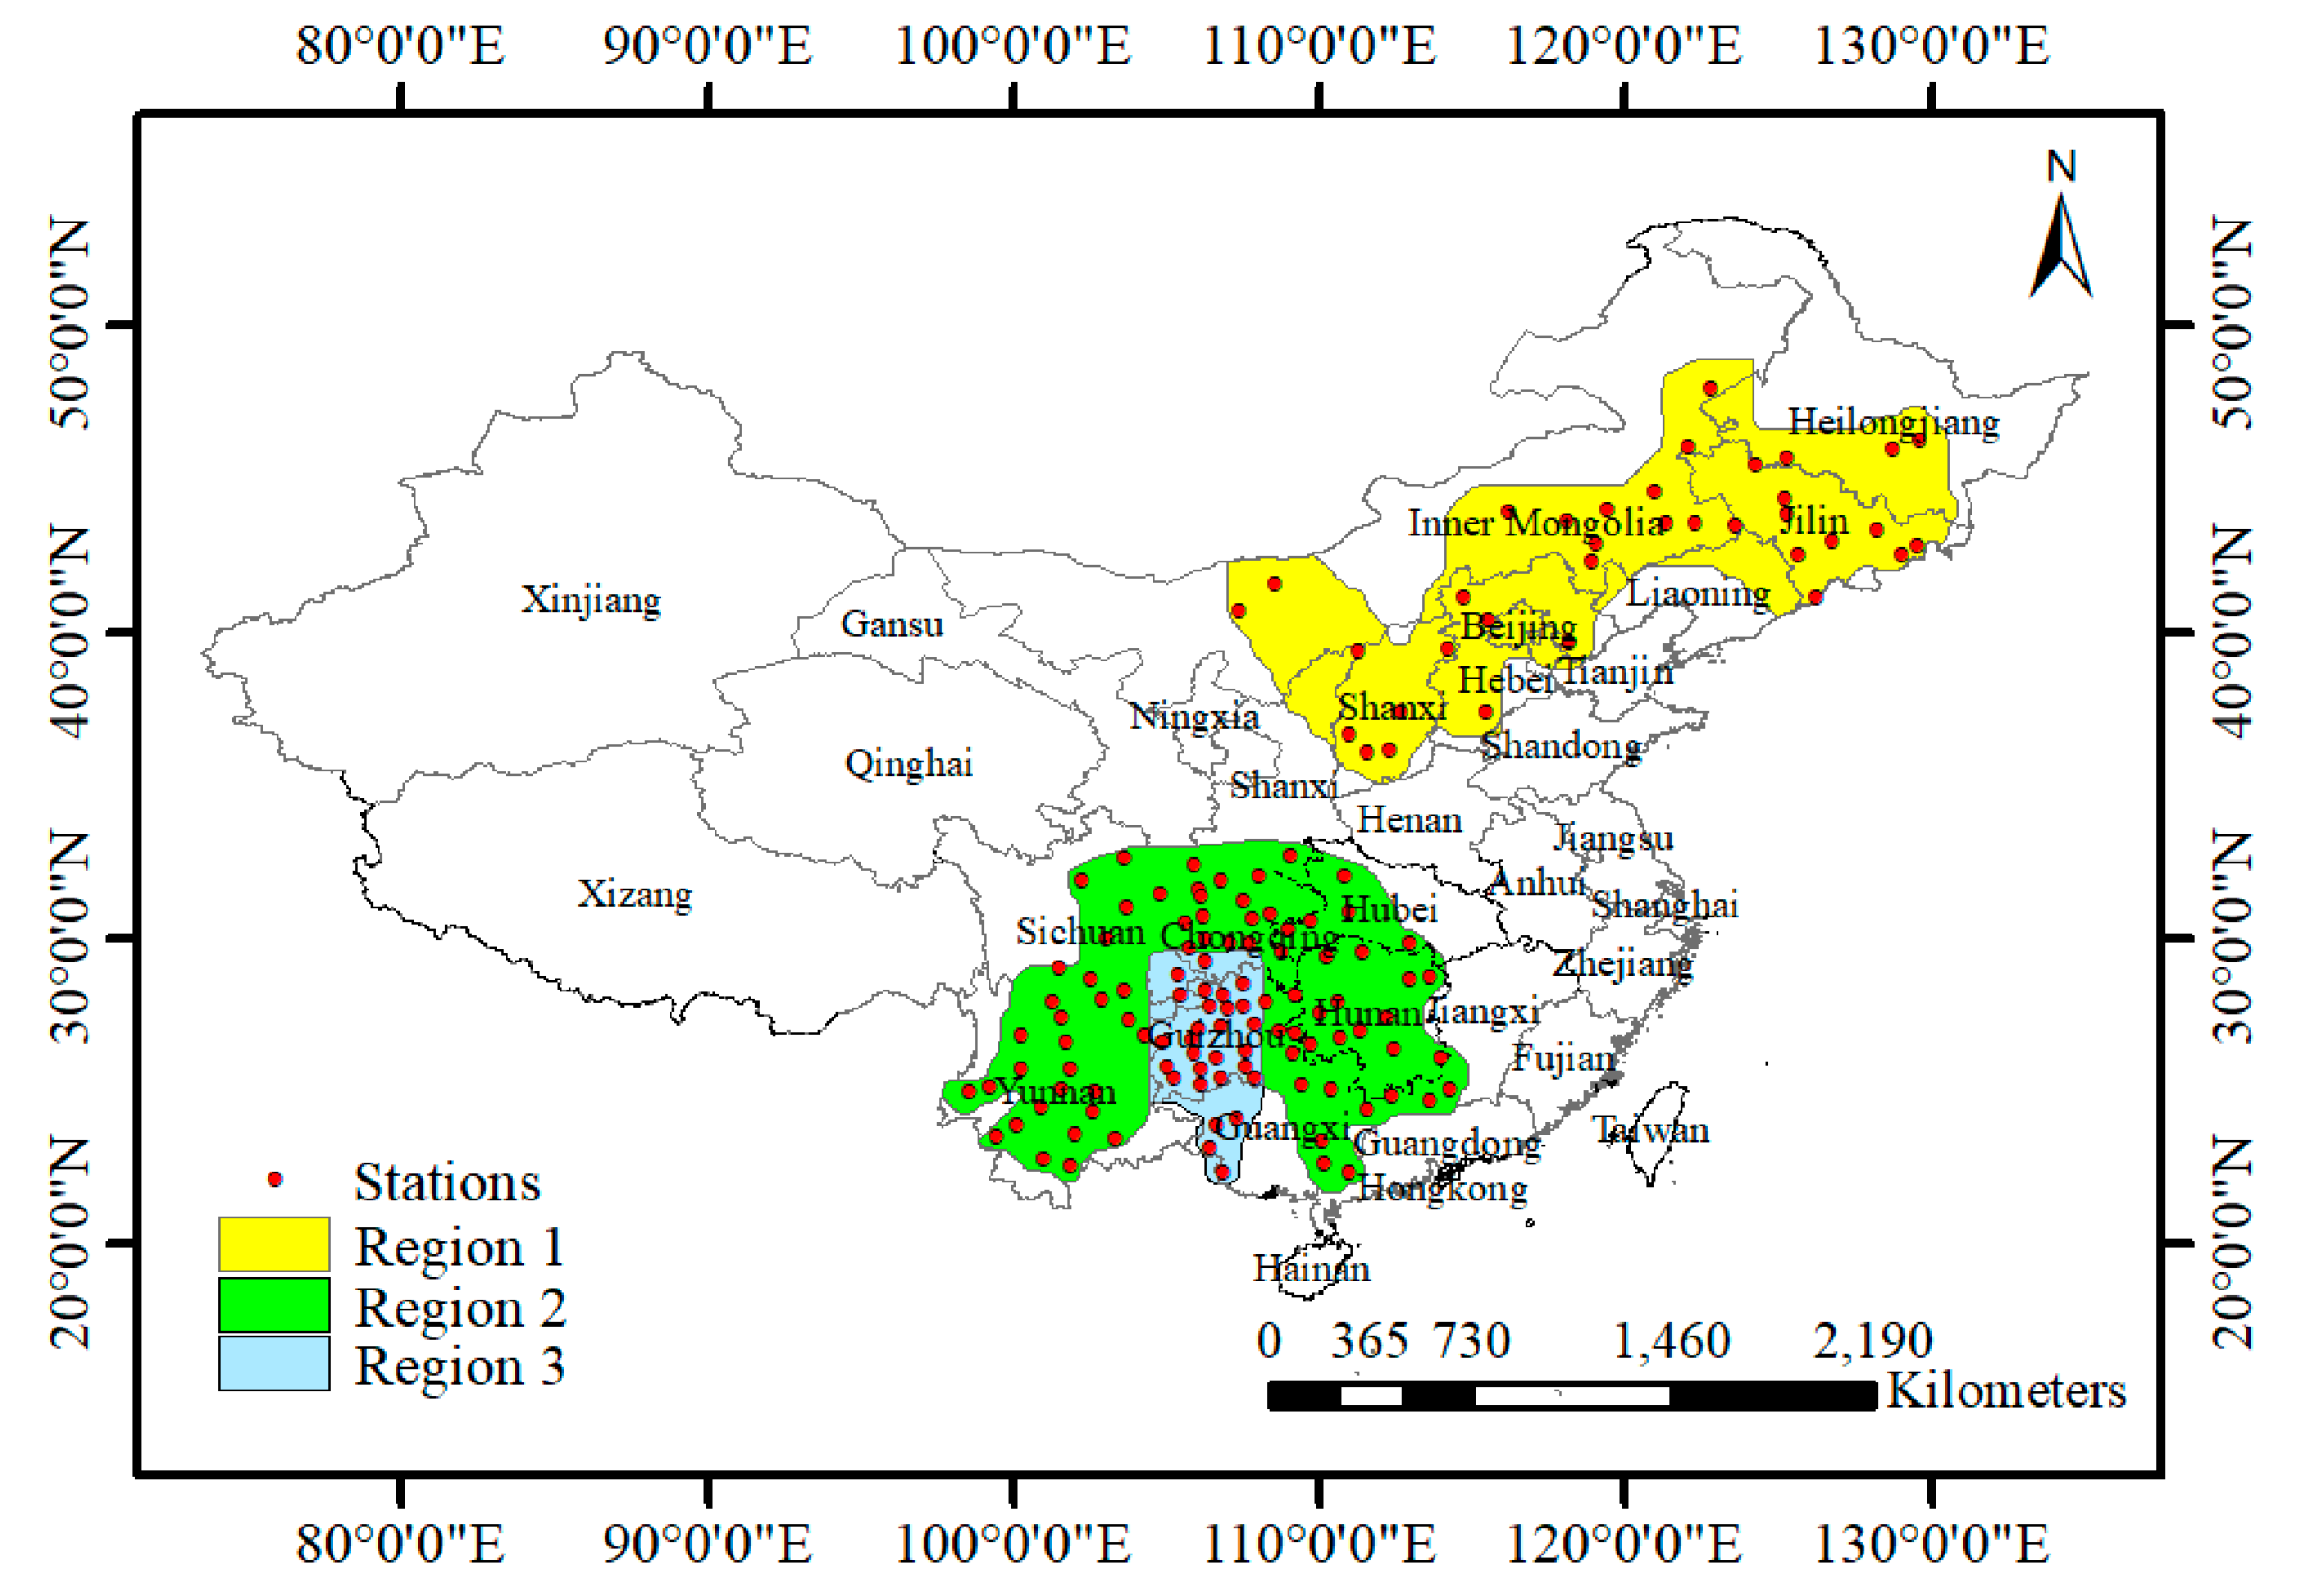
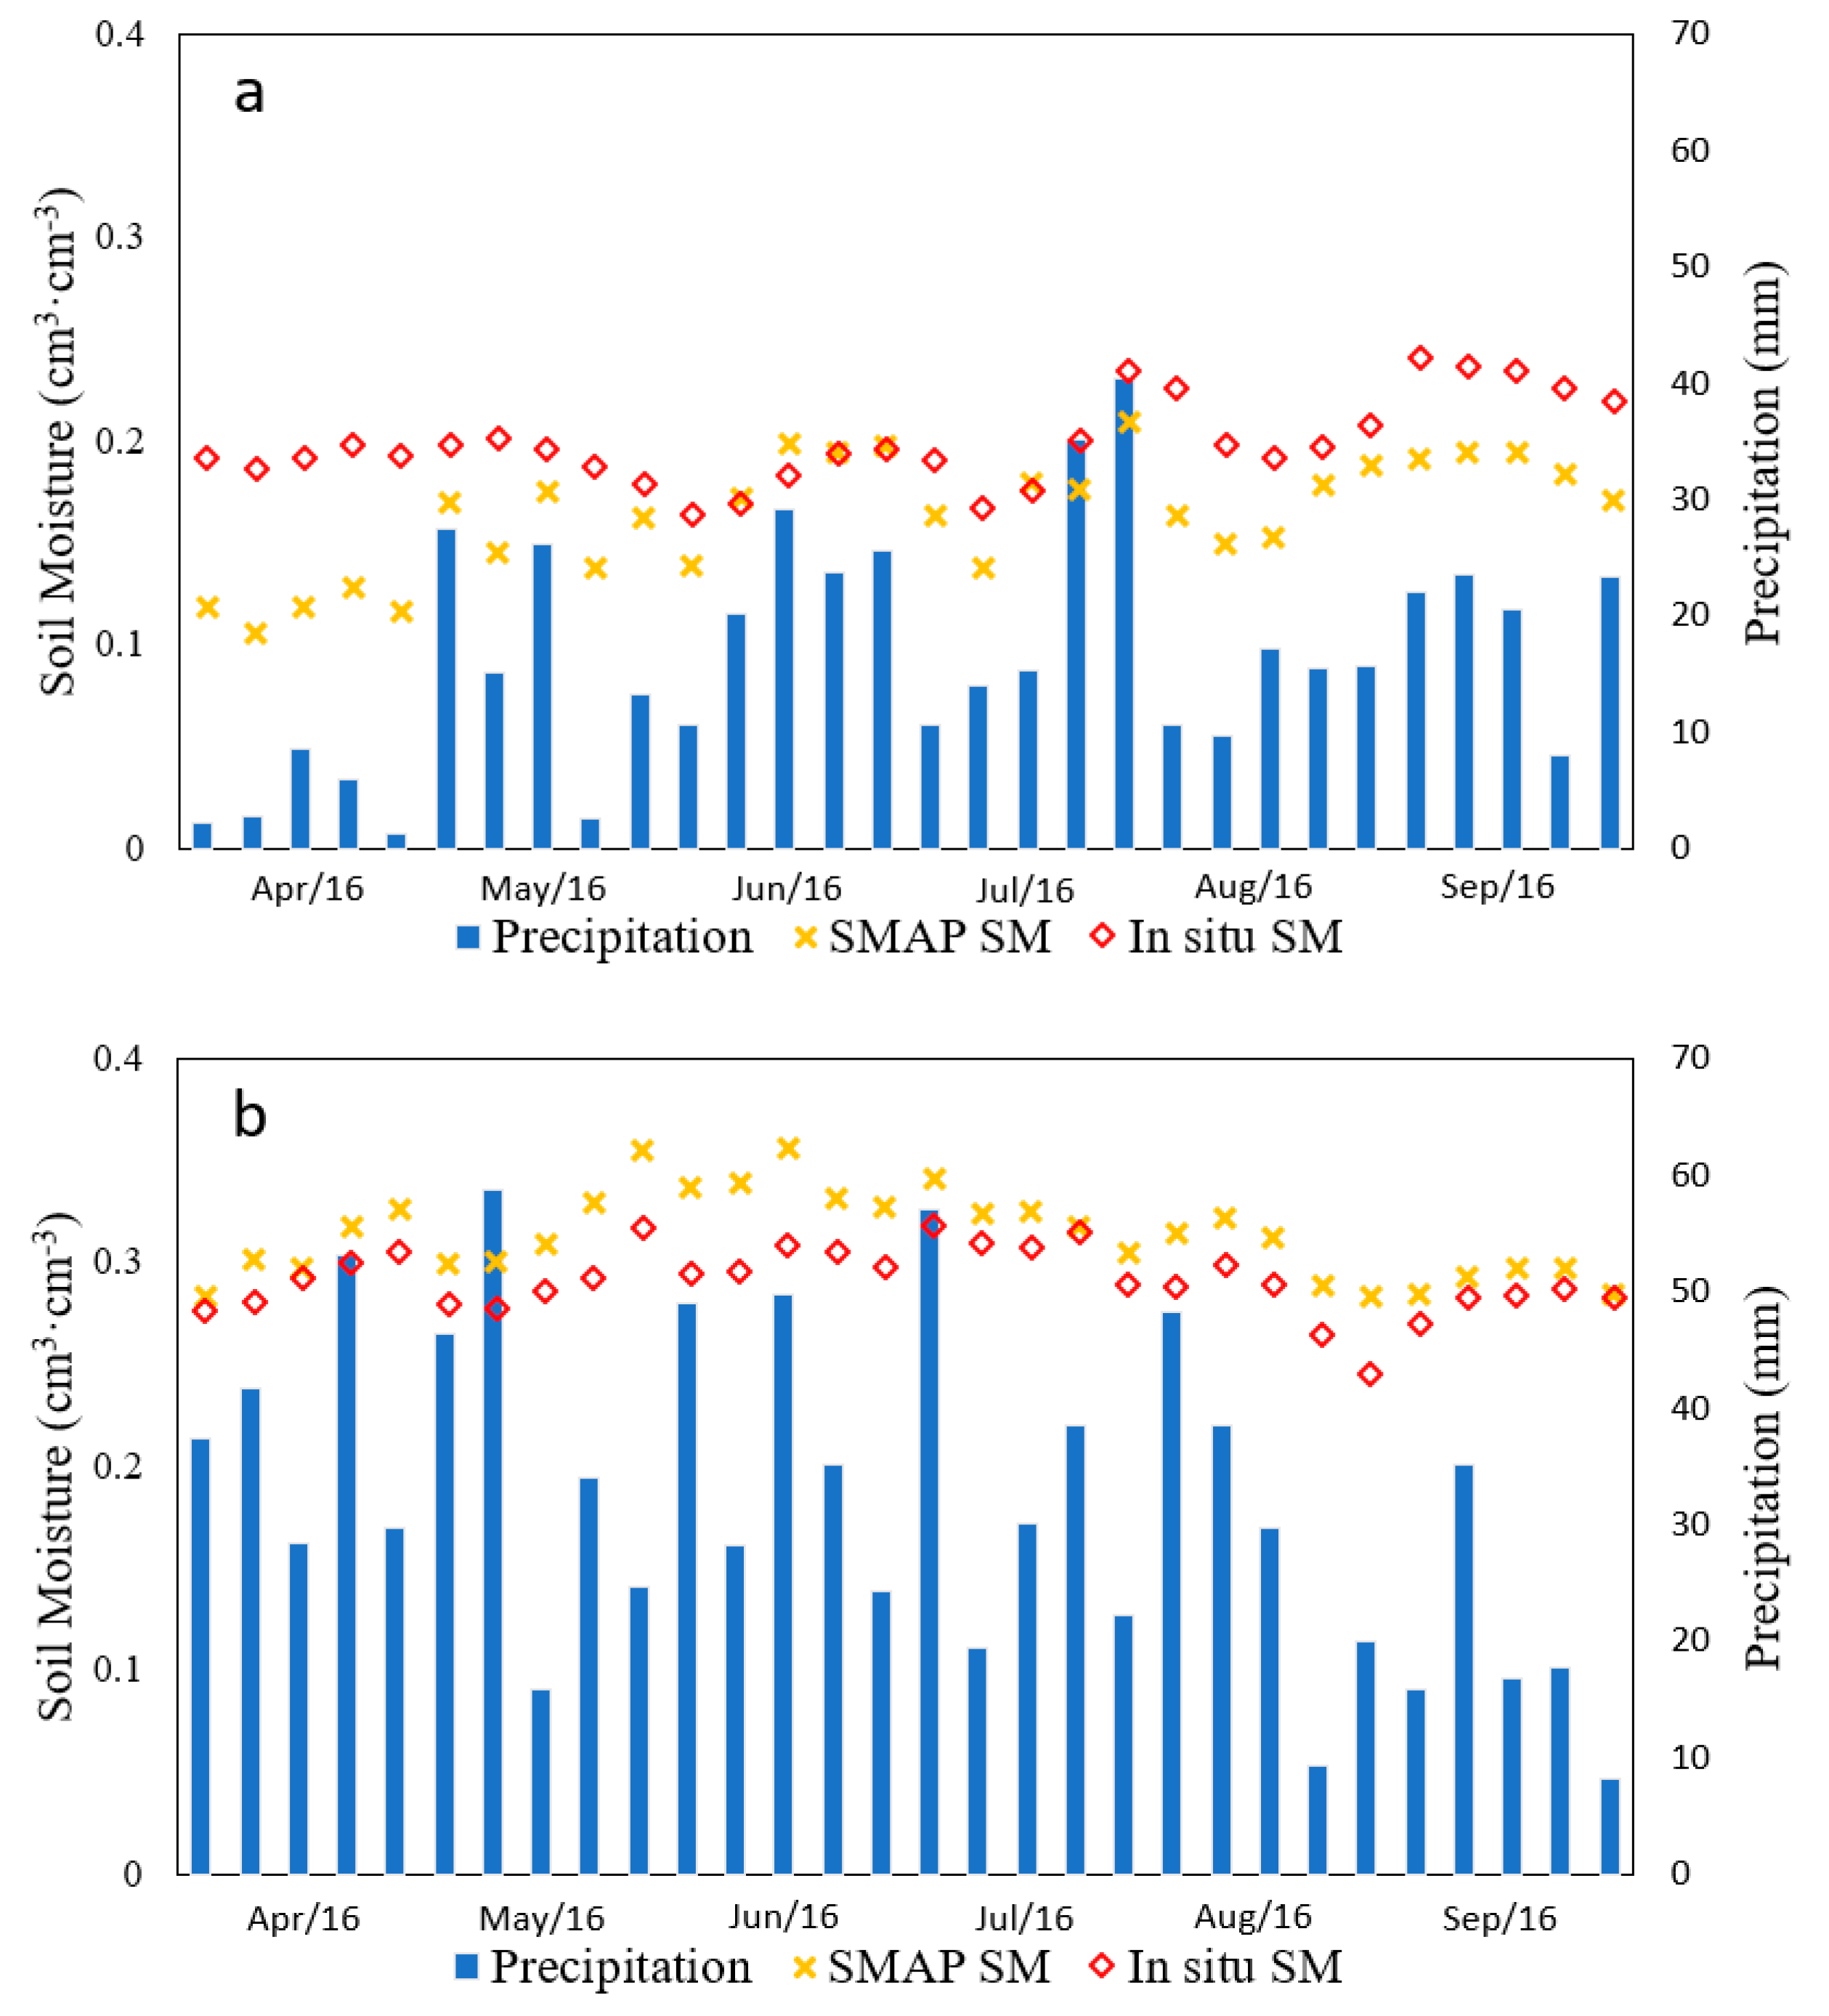
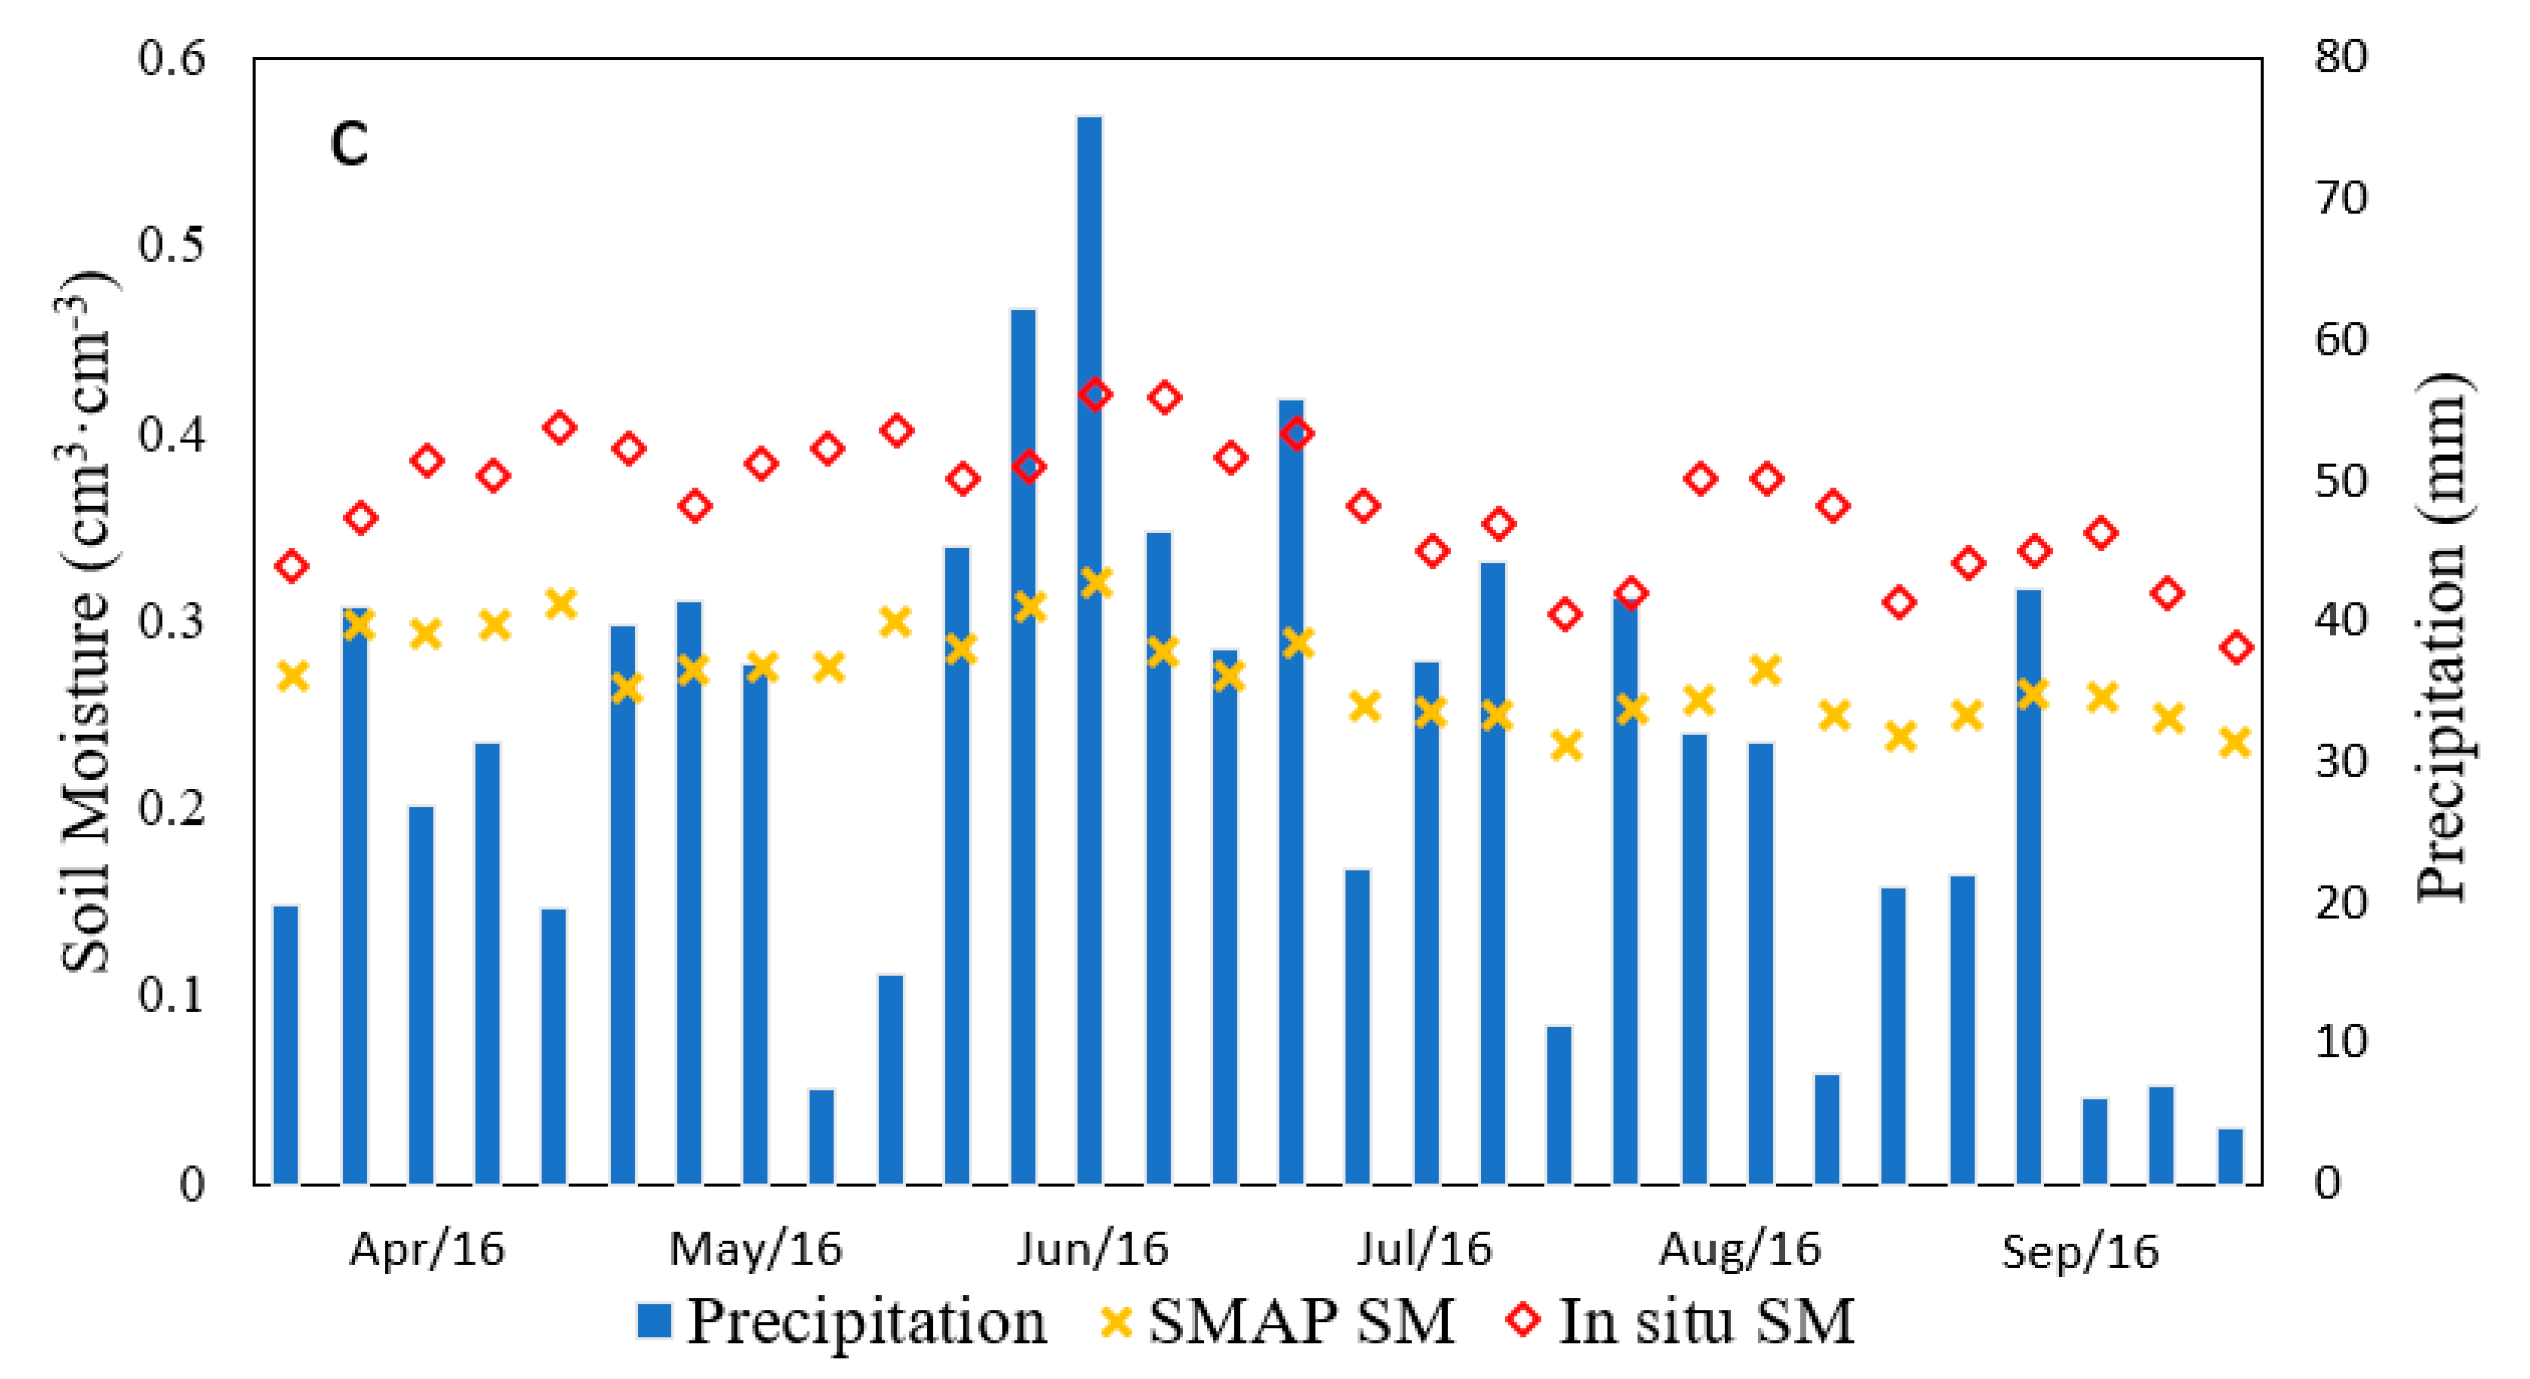
Three regions were chosen to evaluate the SMAP SM product at regional scale using 7-day averaged in situ and SMAP SM data from 1 April 2016 to 30 September 2016 (Figure 5). The regions with the most even and relatively dense distribution of monitoring stations were chosen. Because of the complicated topography, climate and land cover types in China, huge north-south differences in surface SM exist. Therefore, we chose region 1 and region 2 to represent the north and south of China respectively and to analyze the north-south differences at the regional scale. Generally, the SM stations in region 1 are mainly in arid and semi-arid regions, and the SM stations in region 2 and 3 are generally in humid and sub-humid regions. Moreover, the eastern Yun-Gui Plateau, with ample precipitation, exhibits a lack of surface water [58], which is different from other parts of the south; therefore, we chose region 3 to conduct further analysis. Time series of SMAP SM, along with in situ SM and precipitation data, are shown in Figure 6. The rating of SM at some time with more precipitation is not obviously higher than that at the end of the month of April, with less precipitation, with more evapotranspiration and more plant absorption potentially being main factors (Figure 6). The R values for region 2 and 3 indicate relatively good performance compared with those for region 1 (Table 1 and Figure 7). Furthermore, the R values for the three regions are all statistically significant at the 0.01 level. Thus, a statistically significant positive correlation exists between SMAP L3 SM and in situ SM. Region 1, which represents the north, shows a dry bias (−0.038 cm3·cm−3); region 2, located in the southwest, exhibits a wet bias (0.020 cm3·cm−3); region 3 in the eastern Yun-Gui Plateau shows a higher dry bias (−0.091 cm3·cm−3). The ubRMSE values over region 1, 2 and 3 are 0.026 cm3·cm−3, 0.012 cm3·cm−3 and 0.022 cm3·cm−3, respectively, which all indicate much better performance than the target of 0.04 cm3·cm−3. The RMSE over region 2 is less than 0.04 cm3·cm−3. In addition, the target accuracy of the AMSR2 mission (RMSE = 0.1 cm3·cm−3) is regarded as another required reference accuracy in this work, for lack of a specified RMSE target for the SMAP mission. Although the RMSE of region 3 (RMSE = 0.094 cm3·cm−3) is relatively high, it is still considered to meet the target accuracy. It should be noted that the mismatched vertical depth between SMAP SM and the in situ data may result in a slightly higher dry bias in region 1 and region 3 and a slightly lower wet bias in region 2.
From the above analysis, the SMAP radiometer-derived SM product exhibits a relatively good performance in most of China and, thus, can be considered an important data source for drought assessment.
3.2. Comparison of the SWDI-SMAP with AWD
3.2.1. Correlation between the SWDI-SMAP and AWD
The SWDI-SMAP was calculated using SMAP SM according to Equation (1). The AWD index was calculated using in situ climate data. Thus, only the stations with both in situ SM and climate data were used in this section. Daily AWD values were then processed into 7-day averaged data. R was used to quantify the relationships between the weekly SWDI-SMAP and AWD at both the point and regional scales.
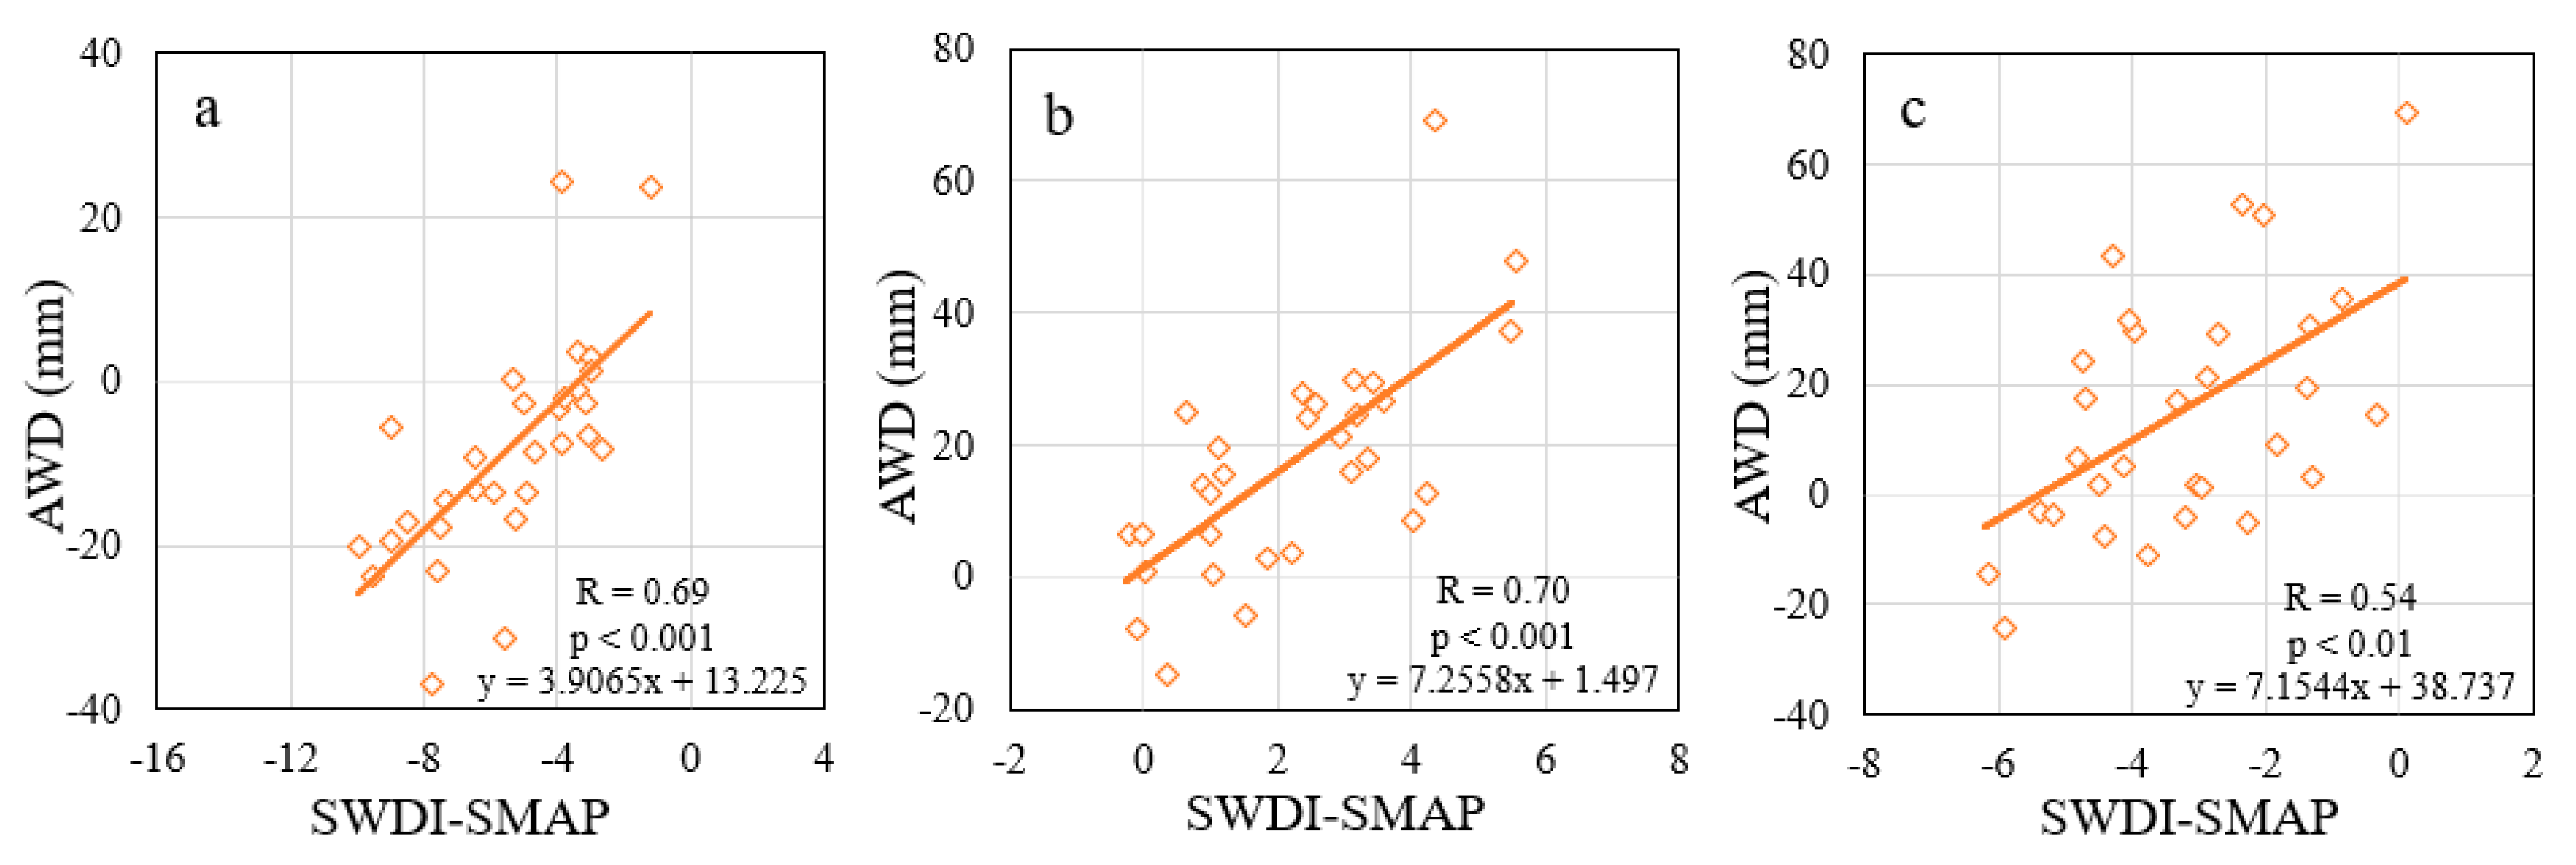
Figure 8 shows the correlations between weekly SWDI-SMAP and AWD at point scale. Among the 204 stations, 30 percent perform well (R > 0.7), 41 percent perform fairly (0.5 < R < 0.7) and 29 percent perform poorly (R < 0.5). The relationship between the SWDI-SMAP and AWD is strong at most of the locations, and there is relatively better performance in the north than in the south. More locations perform well (R > 0.7) in the north, although for most locations in the north, SMAP L3 SM performs fairly on R (Figure 4a). In addition, the performance of SWDI-SMAP is slightly weaker in the Sichuan Basin and its west, the eastern Yun-Gui Plateau and the Huaihe River Basin (Figure 8). These regions are similar to those where the SMAP L3 SM product exhibits slightly poor performance (Figure 4). From a regional perspective, the weekly SWDI-SMAP generally agrees well with the weekly AWD over region 1 and region 2, with R values of 0.69 and 0.70, respectively, and the R value over region 3 is 0.54. Furthermore, the R values for the three regions are all statistically significant at the 0.01 level. Thus, a statistically significant positive correlation exists between SWDI-SMAP and AWD in China. Although the performance of SMAP L3 SM on R for region 1 is poorer than that for regions 2 and 3, the SWDI-SMAP performs well based on R over region 1, likely because of the lower dry bias. Simultaneously, deviations of different degrees on SWDI-SMAP are observed (Figure 9). Relatively small deviations of drought conditions occur for region 1 and 2 (Figure 9a,b), which are in agreement with the smaller bias (Table 1). By comparison, the SWDI-SMAP performs differently with AWD in region 3, with a slightly higher dry bias. In particular, at most of the monitoring stations in region 3, the SWDI-SMAP shows negative values, while the AWD exhibits positive values, indicating that the SWDI-SMAP and AWD reveal opposite drought indicators. The dry bias for the SMAP SM product in region 3 may be one of the reasons for this.
3.2.2. Drought Events
In this section, two criteria for judging drought events were used to assess the performance of the SWDI-SMAP: all drought, and severe and extreme drought. For these two criteria, two grades were defined, namely, drought and no drought. In the criteria for all drought events, drought occurs when SWDI-SMAP < 0 or AWD < 0 mm. In the criteria for extreme drought events, drought occurs when SWDI < −5 or AWD < −50 mm. These thresholds refer to Refs. [33,34]. Two indices are defined to analyze drought: Probability of detection (POD) [59] and D. The POD and D describe the fraction of correctly forecasted drought events [59] and the difference in the number of drought events between the SWDI-SMAP and AWD, respectively. POD and D are calculated as follows:
where C and I represent the numbers of consistent and inconsistent drought grade (i.e., drought and no drought) between the SWDI-SMAP and AWD, respectively. In this study, the sum of C and I is 30. and represent the sums of the numbers of drought events for the SWDI-SMAP and AWD, respectively. High values for POD and low values for D indicate that the SWDI-SMAP and AWD estimate similar drought grades.
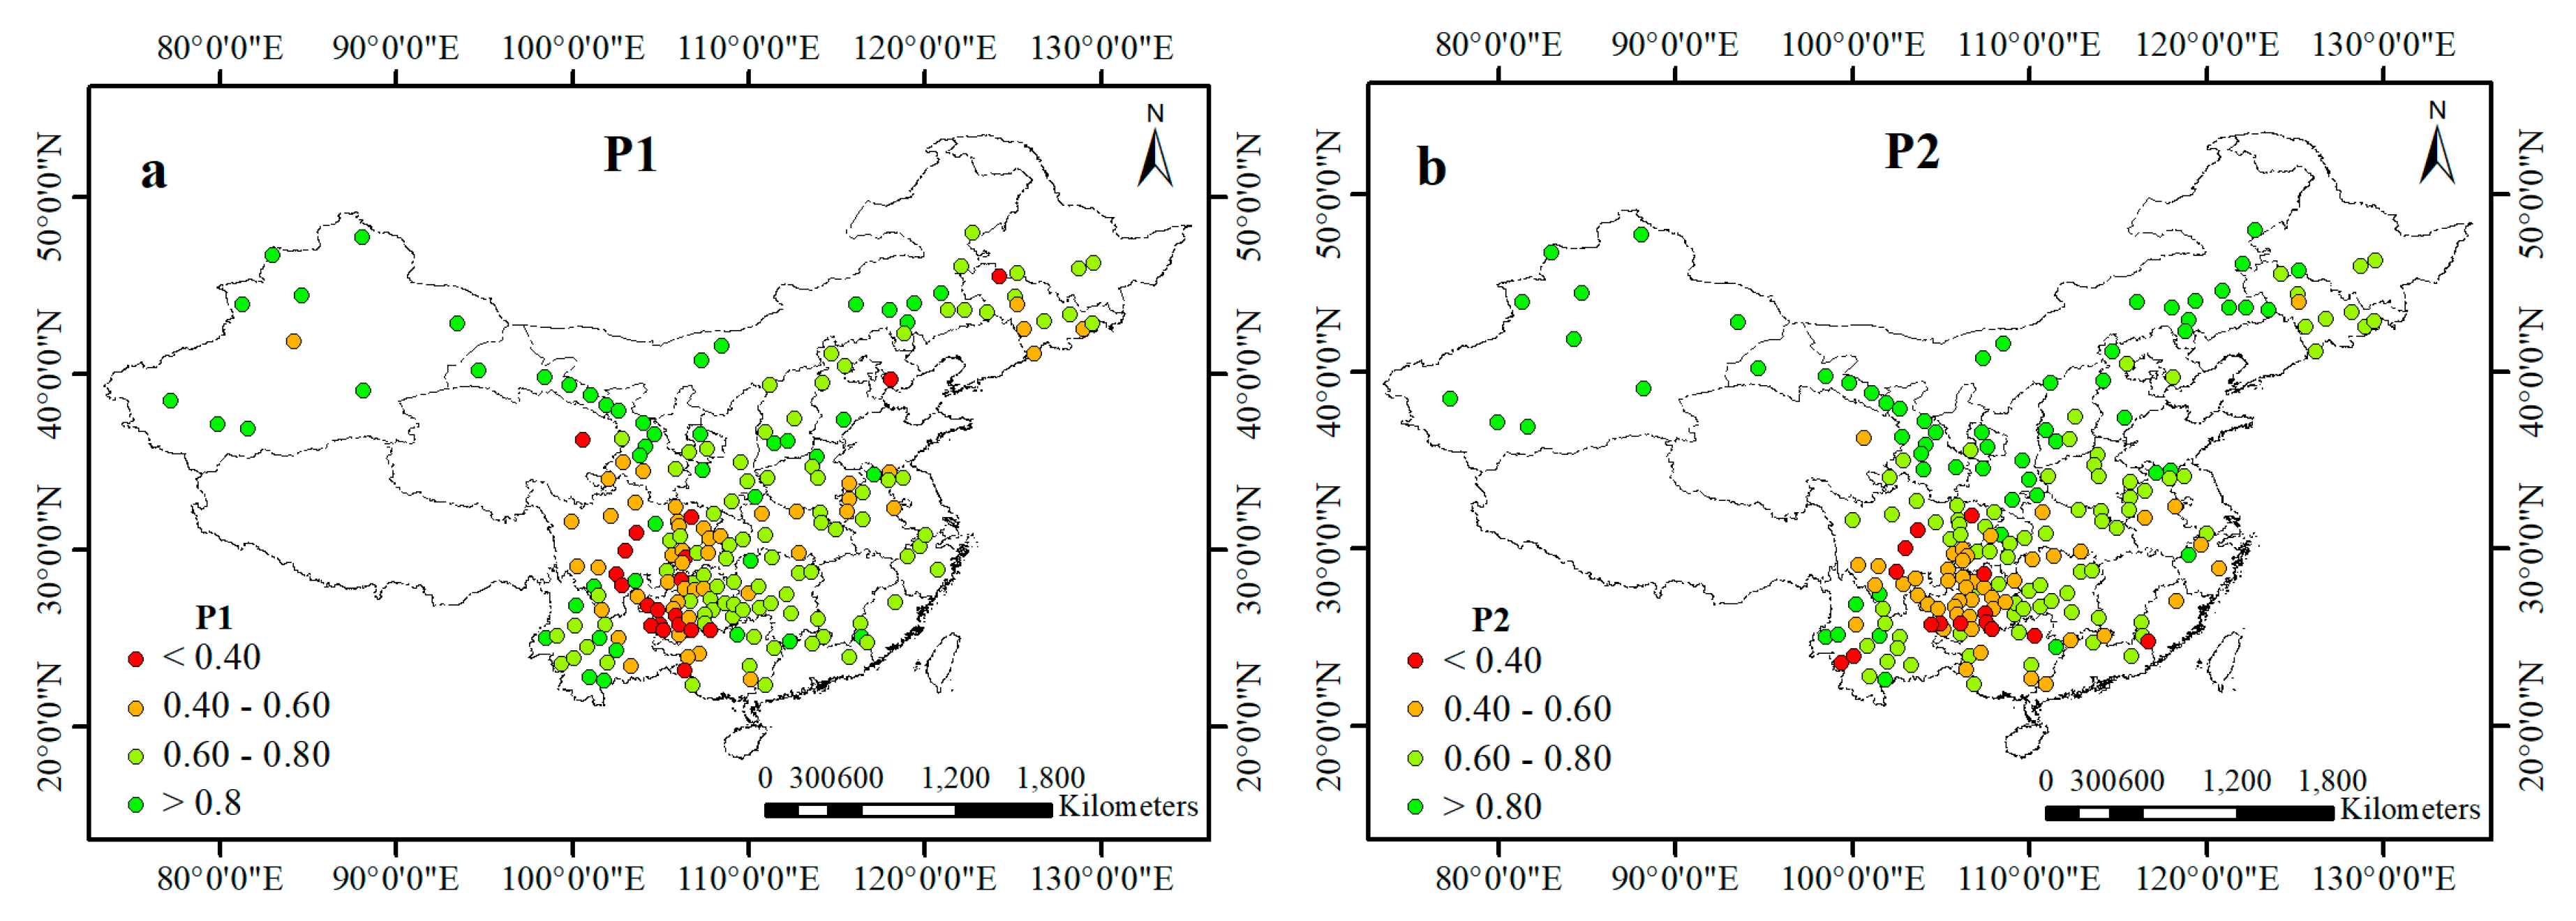
The first index, POD, includes the percentage of consistent all drought events (P1) and the percentage of consistent severe and extreme drought events (P2), as shown in Figure 10. Here, we classified POD into 4 groups: 0.8–1, 0.6–0.8, 0.4–0.6, and 0–0.4. As shown in Figure 10, similar results are observed for P1 and P2, and the performance of POD displays significant geographical differences. Most locations perform well on POD, except for the eastern region of southwest China.
The second index, D, includes the differences in all drought events (D1) and the differences in severe and extreme drought events between the SWDI-SMAP and AWD (D2), as shown in Figure 11. Thresholds of −14, −7, 7, and 14 were defined for this method. At first glance, the spatial distribution (where |D| is large) is similar to that in the first index (Figure 10). As D is the difference between drought events between the SWDI-SMAP and AWD, relatively useful information can be extracted. A greater number of drought events is detected by the SWDI-SMAP than by the AWD in some locations on the Yun-Gui Plateau (Figure 11a). The dry bias of the SMAP L3 SM in region 3 (Table 1), or other reasons, may contribute to the difference of drought events between the SWDI-SMAP and AWD. Severe and extreme drought events in the SWDI-SMAP are much fewer than in AWD in the south (Figure 11b), in accordance with the finding that the SMAP product is liable to overestimate SM in the south.
Only the dataset consisting of all drought events is further analyzed for the magnitude of the deficit in the drought difference between the SWDI-SMAP and AWD. Among the stations examined, 54 locations perform poorly (i.e., P1 < 0.6) across China during the study period. One pivotal reason for these low P1 values at these 54 locations may be associated with the SMAP L3 SM product. In the evaluation of the SMAP L3 SM product in Section 3.1, most of the low P1 values are distributed across eastern southwest China, which is primarily composed of the Yun-Gui Plateau and Sichuan Basin. In summary, whether all drought events or only severe and extreme drought events are used to evaluate the applicability of the SWDI-SMAP, the index performs better in the north than in the south. The wet bias in region 2 and dry bias in region 3 may contribute to different drought performance between SWDI-SMAP and AWD in the south.
3.3. Comparison of the SWDI-SMAP with VHI
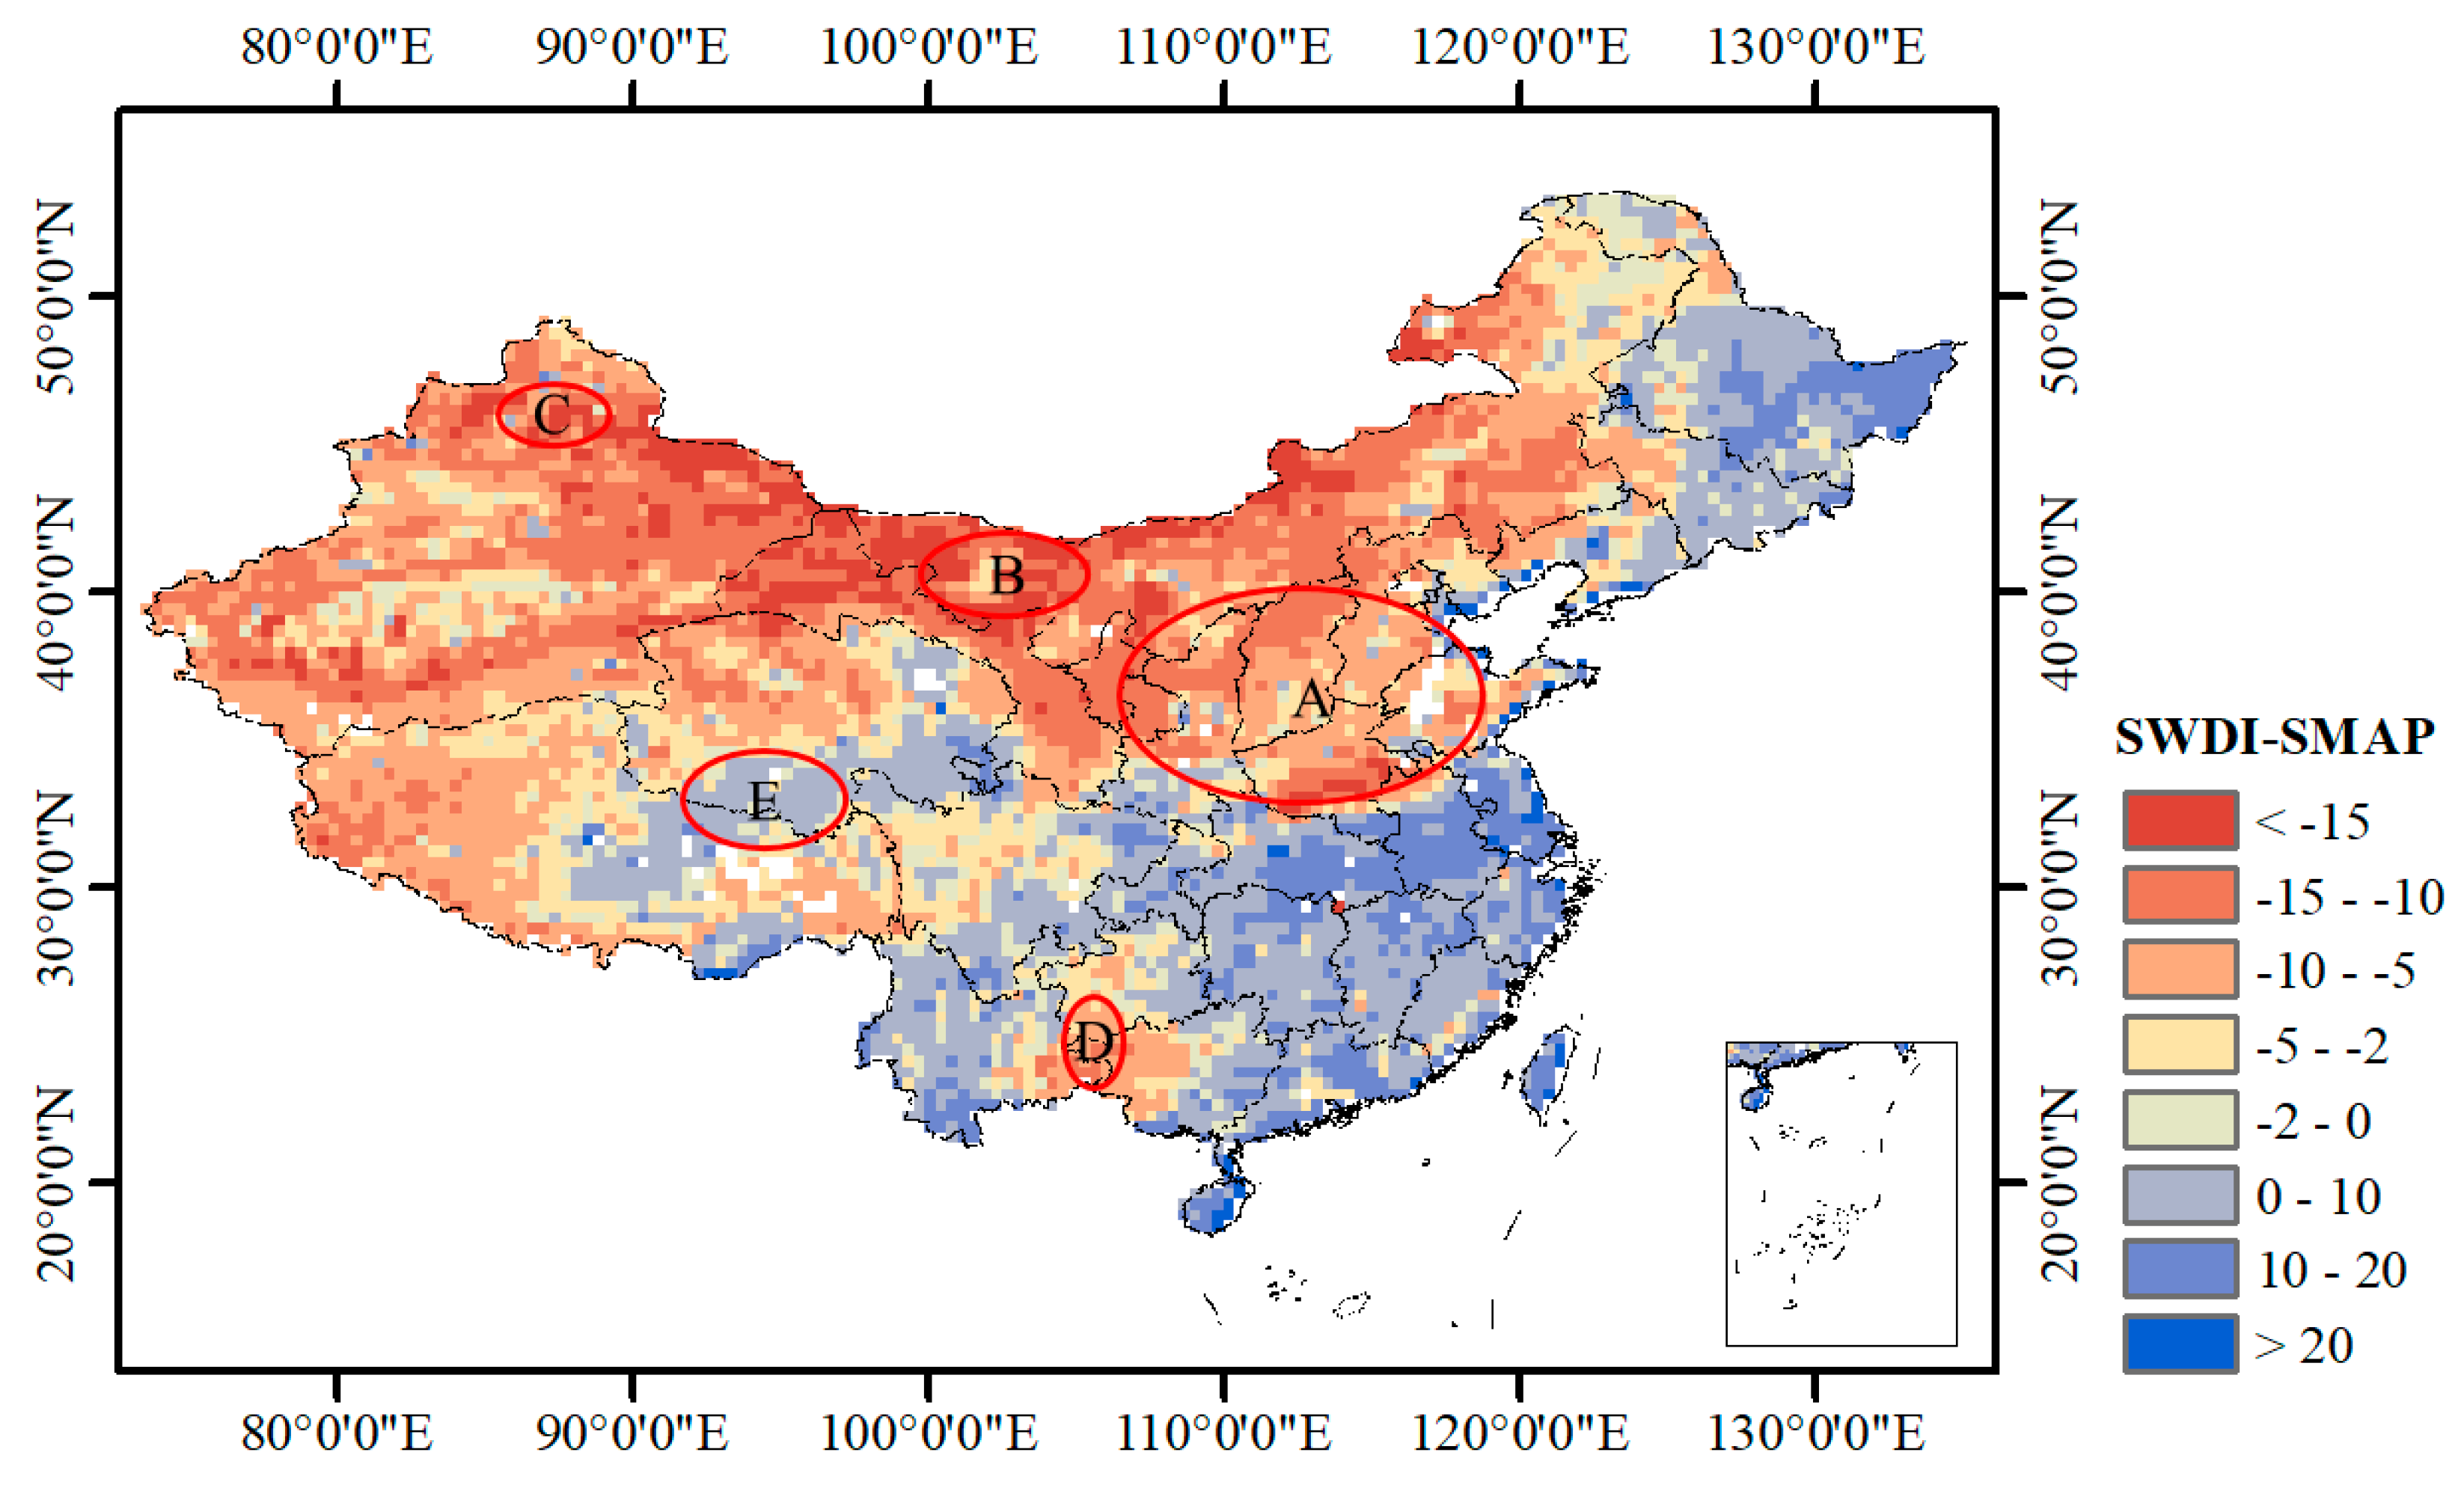
The distribution of the SWDI-SMAP over China for the month of June 2016 is shown in Figure 12. The magnitude of the drought refers to another study [34], where drought is classified as no drought (SWDI ≥ 0), mild (0 > SWDI ≥ −2), moderate (−2 > SWDI ≥ −5), severe (−5 > SWDI ≥ −10) and extreme (SWDI < −10). As shown in Figure 12, more serious drought occurs in the north, especially in central and western Inner Mongolia and eastern Xinjiang. By comparison, drought is less severe for the high rainfall areas in the south. Additionally, moderate and severe drought occurs in the eastern Yun-Gui Plateau. Here, a comparison is performed between the mapping of the SWDI-SMAP and the VHI, because optical remote sensing drought indices have been applied to agricultural drought assessments [54,55,57]. Although the two systems (soil and plant) can be uncoupled [60,61], the comparison between SM and vegetation indices is still meaningful. The monthly VHI for the month of June 2016 (http://www.fao.org/giews/earthobservation/country/index.jsp?type=23&code=CHN) is compared to Figure 12.
Based on a comparative analysis between the SWDI-SMAP and VHI, five main differences are observed, which are described as follows. First, the magnitude of the drought in the SWDI-SMAP is smaller than in the VHI throughout the wet areas, where the SMAP SM product exhibits a wet bias as discussed in Section 3.1. Second, substantial differences are observed in Shanxi, Hebei, Shandong, Henan, northern Shanxi, and southern Qinghai Provinces in addition to portions of north and northeast China, as shown in region A (Figure 12), where the SWDI-SMAP exhibits moderate to severe drought while the VHI indicates drought in a few scattered areas. The land cover in these regions is mainly dry land and medium-coverage grassland (Figure 2). One possible reason for these differences is that the dry land is usually planted with drought-resistant crops. The type of crop is known to be a highly important impact factor [32,50]. Therefore, although the SWDI-SMAP implies the presence of drought, no drought or lighter drought is indicated by the VHI. Third, great differences are observed in western Inner Mongolia and a portion of Xinjiang, as shown in regions B and C, where the land cover is mainly sand and the Gobi Desert (Figure 2). In this area, the SWDI-SMAP shows severe to extreme drought but the VHI exhibits no drought. Fourth, a slightly more serious drought is observed in region D by the SWDI-SMAP, which is consistent with the dry bias of the SMAP L3 SM. Fifth, there is no drought in the SWDI-SMAP in region E, where low- and medium-coverage grassland is planted, but more serious drought conditions exist in the VHI. It should be noted that the differences discussed above may be due to the time lag between soil moisture and vegetation variations [60], or other inconsistent variations [61]. In addition, the VHI is based on long time series, which can also induce the difference between SWDI-SMAP and VHI.
4. Discussion
4.1. Analysis on Preformance of SMAP L3 SM Product
The accuracy of the SMAP L3 SM product is affected by many complex factors, including vegetation, surface roughness, soil texture, the underestimated surface temperature, climate, topography and RFI. By comparing the results with in situ SM throughout China, overall, the SMAP radiometer-derived SM product, which shows relatively good performance in China, can be used for assessment of agricultural drought.
The SMAP SM product shows relatively good performance based on R, except within rolling mountains and areas strongly contaminated by RFI. The locations exhibiting negative R values are mainly distributed in undulating mountain regions (e.g., the Qilian Mountains, Yin Mountains and Hengduan Mountains) with high slope gradients (Figure 3a), which is similar to the previous finding that poor performance exists over areas with complex topography [34]. Other locations with negative R values occur in Jiangsu Province, which is economically developed and thus easily disturbed by RFI [62]. Different biases are observed in different regions. First, the SMAP radiometer-based SM data exhibit slight underestimations in the north. The inconsistent vertical depth of SM is one important reason. SMAP L3 SM represents the soil water conditions of 0–5 cm depth, while the in situ SM is at a depth of 10 cm in this study. Additionally, the underestimated surface temperature is considered another crucial factor causing the dry bias. Surface temperatures are derived from the NASA Goddard Earth Observing System Version 5 (GEOS-5) model and can seriously affect the accuracy of the SMAP SM product [12]. The underestimated surface temperatures clearly result in overestimated soil emissivity, which then may lead to dry bias in the north. According to the comparison between the SMAP surface temperature and the in situ surface temperature in the Naqu and Pali network of the Tibetan Plateau [63], the surface temperature used in the SMAP SM retrieval algorithm may be underestimated in China. Second, the SMAP L3 SM data exhibit slight overestimations in the wet areas of southern China. The high temperatures and heavy rains seem be crucial factors resulting in these overestimations. Sun et al. [15] suggest that this is because of the neglected corrections of SM in the effective soil roughness parameterization and soil temperatures in the mixed dielectric models used in the SMAP SM retrieval approach. Third, a dry bias may exist in the eastern Yun-Gui Plateau. There must be some other key variables, based on the difference in the biases between region 2 and 3, as both regions are situated in the humid climate of southern China. The karst landform throughout the eastern Yun-Gui Plateau [64,65] may be one important factor. The plateaus and mountains and especially bare limestone are widely distributed, and surface water is limited due to the high potential for infiltration. Therefore, the uneven distribution of SM may result in the relatively slightly poor representativeness. Additionally, limitation of inversions over karstic areas for which inversion model is not trained is also a main factor. In addition, the inconsistent vertical depth of SM may also increase the dry bias. Thus, the dry bias in region 3 may be less in fact. Finally, there are different biases with the literature [15], where wet biases may exist over seven geographical zones in continental China. It is, therefore, likely that the combination of the time span of the SM data, the uneven distribution of the sites between these two studies, and the effects of RFI may cause the observed differences.
In addition to the factors discussed above, other factors influence the evaluation of the SMAP SM product. First, the in situ SM is measured at 10 cm and at 08:00 (SGT), in contrast with the SMAP product measurement conditions. Second, the inadequate and uneven 5-day temporal resolution of the in situ SM measurements affected the accuracy. Third, the soil water characteristics were derived from the China Soil Map-Based Harmonized World Soil database (v1.1) due to the lack of site measurements. In addition, RFI still contributes to overestimation in some regions, although many approaches have been developed to mitigate the impacts of RFI. These factors may cause lower precision of the SMAP radiometer-derived SM product in China than in other countries.
4.2. Analysis on Preformance of SWDI-SMAP
In comparison with the AWD, the SWDI-SMAP performs differently in the north and south of China. First, the SWDI-SMAP exhibits a good performance in the north, but the drought events are generally overestimated slightly, mainly due to the dry bias in the SMAP L3 SM product. In addition, the drought monitoring based on the SWDI-SMAP in the north become less accurate when the precipitation is very low (Figure 6a). It should be noted that severe and extreme drought often occurs in the north, so although drought events in the north perform relatively well in this study, some differences between the SWDI-SMAP and AWD may occur due to the greater disconnection between atmospheric and soil systems during the driest episodes [33,47]. Second, some factors have an impact on the coupling of SWDI-SMAP and AWD in the wet areas of the south. The wet bias of the SMAP SM product would lead to an overestimation of SWDI-SMAP. The soil water retention of clay soils may cause less drought events than AWD. As is well known, water gravity drainage can result in soil water retention within clay soils [48,66], and clay content is high in the south. Consequently, clay soils in the south could result in smaller drought events being observed in the SWDI-SMAP than in the AWD. Although the hypothesis was not untenable in [33], the sample was not sufficient. At the same time, there is a large amount of swelling clays in the south, so increasing soil bulk density for decreasing SM leads to an overestimation of in this study [67], and then more and more overestimation of SWDI-SMAP is offset as the SM decreases. Finally, the overestimation in the different degrees of drought condition in the comparison of the SWDI-SMAP with the AWD and VHI in region 3 (region 3 contains region D) is shown, which also implies the presence of a dry bias (Figure 10 and Figure 11). However, the relationship between the SWDI-SMAP and AWD does not fully agree with that between the SWDI-SMAP and VHI. The SWDI-SMAP indicates only a slightly more serious drought than does the VHI in region D (Figure 12). It should be noted that the serious surface water infiltration in the eastern Yun-Gui Plateau may increase the difference between the SWDI-SMAP and AWD. Because the geomorphology is karstic, with wide distribution of limestone, and the limestone is easily dissolved to form the fissures due to high precipitation, temperatures and carbon dioxide content of water. Thus, most surface water becomes groundwater by infiltrating along the fissure [65], reducing the correlation between surface SM and accumulated precipitation. In addition, the large amount of swelling clays is also an important factor in region 3. In summary, drought monitoring based on the SWDI-SMAP may be influenced by the accuracy of the SMAP SM product, soil water retention within swelling clays, infiltration, although mismatched thresholds occur between the SWDI-SMAP and AWD. In addition, the accuracy of the SMAP L3 SM product is affected by many complex factors, including vegetation, surface roughness, soil texture, surface temperature, climate, topography and RFI.
From the comparison between the SWDI-SMAP and VHI, substantial differences occur in areas without vegetation or those containing drought-resistant plants. However, this is not contradictory, as no drought or lighter drought may occur in the above areas (i.e., region A, B and C in Figure 12). First, high VHI values occur in areas without vegetation, such as sand and the Gobi Desert. However, the actual surface SM therein is very low. Second, the differences in the areas with drought-resistant plants are observed because the vegetation, while healthy, may be lacking in SM. Finally, a temporary shortage of soil water in the root zone prior to the onset of moisture stress [32,48] may lead to a difference between the SWDI-SMAP and VHI.
In summary, the comparison with the AWD and VHI implies that the SWDI-SMAP has enormous potential for accurate drought assessments. However, the evaluation of the SWDI-SMAP is inadequate in Xinjiang, Xizang and Qinghai Provinces due to the lack of stations. It is worth noting that evaporative stress index (ESI), similar to the SWDI-SMAP, also has a faster response to drought. It is the ratio of actual evapotranspiration (ET) from the Atmospheric Land Exchange Inverse (ALEXI) model and potential ET [68,69,70], indicating whether SM is ample for plants or not. The temporal resolution of ESI is high because it is computed using geostationary and polar orbiting satellite imagery [71]. The research on the difference between SWDI-SMAP and ESI is worth looking forward to.
5. Conclusions
Agricultural drought monitoring is crucial for China. In this study, a method with a more bio-physical principle (i.e., SWDI) in combination with the SMAP SM product was applied to agricultural drought monitoring across China. For a more effective assessment, the SMAP L3 SM product was first evaluated, and then the SWDI-SMAP was compared with the AWD and VHI. We find that SWDI-SMAP could be a promising tool for monitoring drought.
By comparing it with in situ SM throughout China, the SMAP L3 SM product, which boasts relatively good precision, can be applied to drought assessment. In general, better performances on R are observed in the south than in the north, and relatively poor performances are observed in mountainous regions due to limitation of inversion caused by topographic factors. The performance of the bias is different in different regions. The slight dry bias in the north may result from the underestimated surface temperatures (the dry bias value over region 1 is about 0.038 cm3·cm−3); the slight wet bias in the wet areas of the south with high temperature and heavy rains may be due to the neglected corrections of SM in the effective soil roughness parameterization and soil temperatures in the mixed dielectric models (the wet bias value over region 2 is about 0.020 cm3·cm−3); the dry bias in the eastern Yun-Gui Plateau with karst landforms may be mainly ascribed to limitation of inversion and poor representativeness of in situ SM (the dry bias value over region 3 may be less than 0.091 cm3·cm−3). Most of China exhibits fair to excellent accuracy based on ubRMSE, with values less than 0.10 cm3·cm−3. At present, the comprehensive validation of the SMAP L3 SM product is inadequate for all of China. An SM station network at a depth of 5 cm must be widely established to conduct a better validation and a more elaborate analysis that can be used to optimize the application of the SMAP SM product.
Compared with AWD and VHI, SWDI-SMAP shows good potential for assessing drought conditions and different situations in the north and south. First, the drought assessment using SWDI-SMAP performs relatively well in the north, although the dry bias therein has a slight impact on the drought assessment. In addition, the accuracy of SWDI-SMAP may be relatively low in the north, where precipitation is rare. Second, the number of drought events in the wet areas of the south is relatively underestimated maybe due to the slight wet bias in the SMAP L3 SM product and clay content. Consequently, greater potential was shown in the south. Third, SWDI-SMAP performs differently than AWD in the eastern Yun-Gui Plateau, likely due to the infiltration of surface water and dry bias of the SMAP L3 SM. In short, by comparing SWDI-SMAP with AWD and VHI, the reasonable similarity suggests the availability of SWDI-SMAP as an agricultural drought index in China.
These promising results portend that SWDI-SMAP will be a promising tool for monitoring drought with a high temporal resolution across China in the future. However, a vast amount of work remains to be completed before reaching this goal. First, the SWDI-SMAP performs differently in the Sichuan Basin, Yun-Gui Plateau, and Huaihe River Basin compared to the AWD. Thus, these regions should be investigated further. Second, the SWDI-SMAP needs to be further evaluated and compared with other parameters, such as the ESI. Third, a downscaling approach is needed for the SMAP L3 SM product to conduct drought assessment at a higher spatial resolution, especially in regions where drought assessments are known to perform better.
Author Contributions
J.B. designed the research and analyzed the results with the assistance of Q.C. and D.C.; J.B. performed the experiment with the help of H.Y. and X.M.; and L.M., Q.C. and Y.C. provided comments and modified the manuscript.
Funding
This research was funded by the National Key Research and Development Program of China (No. 2017YFC0405806), National Natural Science Foundation of China (41601401) and Land Water Resource Satellite System.
Acknowledgments
The authors wish to express their sincere thanks to all data providers. The SMAP data were provided by the National Snow and Ice Data Center (NSIDC). The China Soil Map Based Harmonized World Soil database (v1.1) was provided by the Cold and Arid Regions Science Data Center at Lanzhou. The dataset consisting of ground climate and SM data were provided by the China Meteorological Administration (CMA) and the Information Center of the Ministry of Water Resources of the People’s Republic of China. The land cover products for China was provided by the Environmental and Ecological Science Data Center for West China, National Natural Science Foundation of China. The vegetation health index (VHI) was derived from the Global Information and Early Warning System operated by the Food and Agriculture Organization (FAO) of the United Nations.
Conflicts of Interest
The authors declare no conflict of interest.
References
- Liu, M.; Chen, L.G.; Xie, D.H.; Sun, J.R.; He, Q.S.; Cai, L.M. Monsoon-driven transport of atmospheric mercury to the South China Sea from the Chinese mainland and Southeast Asia-Observation of gaseous elemental mercury at a background station in South China. Environ. Sci. Pollut. Res. Int. 2016, 23, 21631–21640. [Google Scholar] [CrossRef] [PubMed]
- Piao, S.; Ciais, P.; Huang, Y.; Shen, Z.; Peng, S.; Li, J.; Zhou, L.; Liu, H.; Ma, Y.; Ding, Y.; et al. The impacts of climate change on water resources and agriculture in China. Nature 2010, 467, 43–51. [Google Scholar] [CrossRef] [PubMed]
- Anderson, M.C.; Hain, C.; Wardlow, B.D.; Pimstein, A.; Mecikalski, J.R.; Kustas, W.P. Evaluation of Drought Indices Based on Thermal Remote Sensing of Evapotranspiration over the Continental United States. J. Clim. 2011, 24, 2025–2044. [Google Scholar] [CrossRef] [Green Version]
- Maes, W.H.; Steppe, K. Estimating evapotranspiration and drought stress with ground-based thermal remote sensing in agriculture: A review. J. Exp. Bot. 2012, 63, 4671–4712. [Google Scholar] [CrossRef] [PubMed]
- Chakraborty, A.; Sai, M.S.; Murthy, C.S.; Roy, P.S.; Behera, G. Assessment of area favourable for crop sowing using AMSR-E derived Soil Moisture Index (AMSR-E SMI). Int. J. Appl. Earth Obs. Geoinf. 2012, 18, 537–547. [Google Scholar] [CrossRef]
- Liu, X.; Zhu, X.; Pan, Y.; Li, S.; Liu, Y. Agricultural drought monitor: Progress, challenges and prospect. Acta Geogr. Sin. 2015, 70, 1835–1848. [Google Scholar]
- Parinussa, R.M.; Wang, G.; Holmes, T.R.; Liu, Y.Y.; Dolman, A.J.; De Jeu, R.A.; Jiang, T.; Zhang, P.; Shi, J. Global surface soil moisture from the Microwave Radiation Imager onboard the Fengyun-3B satellite. Int. J. Remote Sens. 2014, 35, 7007–7029. [Google Scholar] [CrossRef]
- Kerr, Y.H.; Waldteufel, P.; Wigneron, J.P.; Martinuzzi, J.A.; Font, J.; Berger, M. Soil moisture retrieval from space: The Soil Moisture and Ocean Salinity (SMOS) mission. IEEE Trans. Geosci. Remote Sens. 2002, 39, 1729–1735. [Google Scholar] [CrossRef]
- Entekhabi, D.; Njoku, E.G.; O’Neill, P.E.; Kellogg, K.H.; Crow, W.T.; Edelstein, W.N.; Entin, J.K.; Goodman, S.D.; Jackson, T.J.; Johnson, J.; et al. The Soil Moisture Active Passive (SMAP) Mission. Proc. IEEE 2010, 98, 704–716. [Google Scholar] [CrossRef]
- Wagner, W.; Hahn, S.; Kidd, R.; Melzer, T.; Bartalis, Z.; Hasenauer, S.; Figa-Saldaña, J.; de Rosnay, P.; Jann, A.; Schneider, S.; et al. The ASCAT Soil Moisture Product: A Review of its Specifications, Validation Results, and Emerging Applications. Meteorol. Z. 2013, 22, 5–33. [Google Scholar] [CrossRef]
- Draper, C.S.; Walker, J.P.; Steinle, P.J.; De Jeu, R.A.; Holmes, T.R. An evaluation of AMSR–E derived soil moisture over Australia. Remote Sens. Environ. 2009, 113, 703–710. [Google Scholar] [CrossRef]
- Cui, C.; Xu, J.; Zeng, J.; Chen, K.S.; Bai, X.; Lu, H.; Chen, Q.; Zhao, T. Soil Moisture Mapping from Satellites: An Intercomparison of SMAP, SMOS, FY3B, AMSR2, and ESA CCI over Two Dense Network Regions at Different Spatial Scales. Remote Sens. 2017, 10, 33. [Google Scholar] [CrossRef]
- Kędzior, M.; Zawadzki, J. Comparative study of soil moisture estimations from SMOS satellite mission, GLDAS database, and cosmic-ray neutrons measurements at COSMOS station in Eastern Poland. Geoderma 2016, 283, 21–31. [Google Scholar] [CrossRef]
- El Hajj, M.; Baghdadi, N.; Zribi, M.; Rodríguez-Fernández, N.; Wigneron, J.P.; Al-Yaari, A.; Al Bitar, A.; Albergel, C.; Calvet, J.C. Evaluation of SMOS, SMAP, ASCAT and Sentinel-1 Soil Moisture Products at Sites in Southwestern France. Remote Sens. 2018, 10, 569. [Google Scholar] [CrossRef]
- Sun, Y.; Huang, S.; Ma, J.; Li, J.; Li, X.; Wang, H.; Chen, S.; Zang, W. Preliminary Evaluation of the SMAP Radiometer Soil Moisture Product over China Using In Situ Data. Remote Sens. 2017, 9, 292. [Google Scholar] [CrossRef]
- Zawadzki, J.; Kędzior, M. Soil moisture variability over Odra watershed: Comparison between SMOS and GLDAS data. Int. J. Appl. Earth Obs. Geoinf. 2016, 45, 110–124. [Google Scholar] [CrossRef]
- Yan, S.; Khazaal, A.; Cabot, F.; Kerr, Y.H. An RFI Index to Quantify the Contamination of SMOS Data by Radio-Frequency Interference. IEEE J. Sel. Top. Appl. Earth Obs. Remote Sens. 2016, 9, 1577–1589. [Google Scholar]
- Oliva, R.; Daganzo, E.; Kerr, Y.H.; Mecklenburg, S.; Nieto, S.; Richaume, P.; Gruhier, C. SMOS radio frequency interference scenario: Status and actions taken to improve the RFI environment in the 1400–1427-MHz passive band. IEEE Trans. Geosci. Remote Sens. 2012, 50, 1427–1439. [Google Scholar] [CrossRef] [Green Version]
- Jin, M.; Zheng, X.; Jiang, T.; Li, X.; Li, X.J.; Zhao, K. Evaluation and Improvement of SMOS and SMAP Soil Moisture Products for Soils with High Organic Matter over a Forested Area in Northeast China. Remote Sens. 2017, 9, 387. [Google Scholar] [CrossRef]
- Ma, C.; Li, X.; Wei, L.; Wang, W. Multi-Scale Validation of SMAP Soil Moisture Products over Cold and Arid Regions in Northwestern China Using Distributed Ground Observation Data. Remote Sens. 2017, 9, 327. [Google Scholar] [CrossRef]
- Zhang, L.; He, C.; Zhang, M. Multi-Scale Evaluation of the SMAP Product Using Sparse In-Situ Network over a High Mountainous Watershed, Northwest China. Remote Sens. 2017, 9, 1111. [Google Scholar] [CrossRef]
- Cui, H.; Jiang, L.; Du, J.; Zhao, S.; Wang, G.; Lu, Z.; Wang, J. Evaluation and analysis of AMSR-2, SMOS, and SMAP soil moisture products in the Genhe area of China. J. Geophys. Res. Atmos. 2017, 122, 8650–8666. [Google Scholar] [CrossRef]
- Colliander, A.; Jackson, T.J.; Bindlish, R.; Chan, S.; Das, N.; Kim, S.B.; Cosh, M.H.; Dunbar, R.S.; Dang, L.; Pashaian, L.; et al. Validation of SMAP surface soil moisture products with core validation sites. Remote Sens. Environ. 2017, 191, 215–231. [Google Scholar] [CrossRef]
- Scaini, A.; Sánchez, N.; Vicente-Serrano, S.M. SMOS-derived soil moisture anomalies and drought indices: A comparative analysis using in situ measurements. Hydrol. Process. 2015, 29, 373–383. [Google Scholar] [CrossRef]
- Velpuri, N.M.; Senay, G.B.; Morisette, J.T. Evaluating new SMAP soil moisture for drought monitoring in the rangelands of the US high plains. Rangelands 2016, 38, 183–190. [Google Scholar] [CrossRef]
- Champagne, C.; Davidson, A.; Cherneski, P.; L’Heureux, J.; Hadwen, T. Monitoring agricultural risk in Canada using L-band passive microwave soil moisture from SMOS. J. Hydrometeorol. 2015, 16, 5–18. [Google Scholar] [CrossRef]
- Park, S.; Im, J.; Park, S.; Rhee, J. Drought monitoring using high resolution soil moisture through multi-sensor satellite data fusion over the Korean peninsula. Agric. For. Meteorol. 2017, 237, 257–269. [Google Scholar] [CrossRef]
- Sanchez, N.; Gonzalez-Zamora, A.; Piles, M.; Martínez-Fernández, J. A New Soil Moisture Agricultural Drought Index (SMADI) Integrating MODIS and SMOS Products: A Case of Study over the Iberian Peninsula. Remote Sens. 2016, 8, 287. [Google Scholar] [CrossRef]
- Sánchez, N.; González-Zamora, Á.; Martínez-Fernández, J.; Piles, M.; Pablos, M. Integrated remote sensing approach to global agricultural drought monitoring. Agric. For. Meteorol. 2018, 259, 141–153. [Google Scholar] [CrossRef]
- Kędzior, M.A.; Zawadzki, J. SMOS data as a source of the agricultural drought information: Case study of the Vistula catchment, Poland. Geoderma 2017, 306, 167–182. [Google Scholar] [CrossRef]
- Liu, D.; Mishra, A.K.; Yu, Z.; Yang, C.; Konapala, G.; Vu, T. Performance of SMAP, AMSR-E and LAI for weekly agricultural drought forecasting over continental United States. J. Hydrol. 2017, 553, 88–104. [Google Scholar] [CrossRef]
- Martínez-Fernández, J.; González-Zamora, A.; Sánchez, N.; Gumuzzio, A.; Herrero-Jiménez, C.M. Satellite soil moisture for agricultural drought monitoring: Assessment of the SMOS derived Soil Water Deficit Index. Remote Sens. Environ. 2016, 177, 277–286. [Google Scholar] [CrossRef]
- Paredes-Trejo, F.; Barbosa, H. Evaluation of the SMOS-Derived Soil Water Deficit Index as Agricultural Drought Index in Northeast of Brazil. Water 2017, 9, 377. [Google Scholar] [CrossRef]
- Mishra, A.; Vu, T.; Veettil, A.V.; Entekhabi, D. Drought monitoring with soil moisture active passive (SMAP) measurements. J. Hydrol. 2017, 552, 620–632. [Google Scholar] [CrossRef]
- An, R.; Zhang, L.; Wang, Z.; Quaye-Ballard, J.A.; You, J.; Shen, X.; Ke, Z. Validation of the ESA CCI soil moisture product in China. Int. J. Appl. Earth Obs. Geoinf. 2016, 48, 28–36. [Google Scholar] [CrossRef]
- Zhai, P.; Zhang, X.; Wan, H.; Pan, X. Trends in total precipitation and frequency of daily precipitation extremes over China. J. Clim. 2005, 18, 1096–1108. [Google Scholar] [CrossRef]
- Wu, S.; Yin, Y.; Zheng, D.; Yang, Q. Moisture conditions and climate trends in China during the period 1971–2000. Int. J. Climatol. 2006, 26, 193–206. [Google Scholar] [CrossRef] [Green Version]
- Wu, S.H.; Yang, Q.Y.; Zheng, D. An index system for boundaries of eco-geographical regions of China. Prog. Geogr. 2002, 21, 302–309. [Google Scholar]
- Bingwei, H. Draft of the complex physical geographical division of China. Chin. Sci. Bull. 1959, 18, 594–602. [Google Scholar]
- Brown, M.E.; Escobar, V.; Moran, S.; Entekhabi, D.; O’Neill, P.E.; Njoku, E.G.; Doorn, B.; Entin, J.K. NASA’s Soil Moisture Active Passive (SMAP) Mission and Opportunities for Applications Users. Bull. Am. Meteorol. Soc. 2013, 94, 1125–1128. [Google Scholar] [CrossRef]
- O’Neill, P.; Chan, S.; Njoku, E.; Jackson, T.; Bindlish, R. SMAP L3 Radiometer Global Daily 36 km EASE-Grid Soil Moisture, Version 4; NASA National Snow and Ice Data Center Distributed Active Archive Center: Boulder, CO, USA, 2016. [Google Scholar] [CrossRef]
- Zribi, M.; Gorrab, A.; Baghdadi, N.; Lili-Chabaane, Z.; Mougenot, B. Influence of radar frequency on the relationship between bare surface soil moisture vertical profile and radar backscatter. IEEE Geosci. Remote Sens. Lett. 2014, 11, 848–852. [Google Scholar] [CrossRef] [Green Version]
- Fischer, G.; Nachtergaele, F.; Prieler, S.; van Velthuizen, H.; Verelst, L.; Wiberg, D. Global Agro-Ecological Zones Assessment for Agriculture (GAEZ 2008); IIASA: Laxenburg, Austria; FAO: Rome, Italy, 2008. [Google Scholar]
- Zhang, Q.; Zhang, X.S. Impacts of predictor variables and species models on simulating Tamarix ramosissima distribution in Tarim Basin, northwestern China. J. Plant Ecol. 2012, 5, 337–345. [Google Scholar] [CrossRef] [Green Version]
- Ran, Y.; Li, X.; Lu, L. Evaluation of four remote sensing based land cover products over China. J. Glaciol. Geocryol. 2009, 31, 391–401. [Google Scholar] [CrossRef]
- Ran, Y.; Li, X.; Lu, L. Land Cover Products of China; Cold and Arid Regions Science Data Center: Lanzhou, China, 2010. [Google Scholar] [CrossRef]
- Martínez-Fernández, J.; González-Zamora, A.; Sánchez, N.; Gumuzzio, A. A soil water based index as a suitable agricultural drought indicator. J. Hydrol. 2015, 522, 265–273. [Google Scholar] [CrossRef]
- Allen, R.G. Crop Evapotranspiration-Guideline for Computing Crop Water Requirements; FAO: Rome, Italy, 1998; Volume 56, p. 300. [Google Scholar]
- Savage, M.J.; Ritchie, J.T.; Bland, W.L.; Dugas, W.A. Lower limit of soil water availability. Agron. J. 1996, 88, 644–651. [Google Scholar] [CrossRef]
- Hunt, E.D.; Hubbard, K.G.; Wilhite, D.A.; Arkebauer, T.J.; Dutcher, A.L. The development and evaluation of a soil moisture index. Int. J. Climatol. 2009, 29, 747–759. [Google Scholar] [CrossRef] [Green Version]
- Wösten, J.H.M.; Pachepsky, Y.A.; Rawls, W.J. Pedotransfer functions: Bridging the gap between available basic soil data and missing soil hydraulic characteristics. J. Hydrol. 2001, 251, 123–150. [Google Scholar] [CrossRef]
- Saxton, K.E.; Rawls, W.J. Soil water characteristic estimates by texture and organic matter for hydrologic solutions. Soil Sci. Soc. Am. J. 2006, 70, 1569–1578. [Google Scholar] [CrossRef]
- Torres, G.M.; Lollato, R.P.; Ochsner, T.E. Comparison of drought probability assessments based on atmospheric water deficit and soil water deficit. Agron. J. 2013, 105, 428–436. [Google Scholar] [CrossRef]
- Rojas, O.; Vrieling, A.; Rembold, F. Assessing drought probability for agricultural areas in Africa with coarse resolution remote sensing imagery. Remote Sens. Environ. 2011, 115, 343–352. [Google Scholar] [CrossRef]
- Singh, R.P.; Roy, S.; Kogan, F. Vegetation and temperature condition indices from NOAA AVHRR data for drought monitoring over India. Int. J. Remote Sens. 2003, 24, 4393–4402. [Google Scholar] [CrossRef]
- Kogan, F. Early drought detection, monitoring, and assessment of crop losses from space: Global approach. Disaster Forewarning Diagnostic Methods and Management. Int. Soc. Opt. Photonics 2006, 6412. [Google Scholar] [CrossRef]
- Choi, M.; Jacobs, J.M.; Anderson, M.C.; Bosch, D.D. Evaluation of drought indices via remotely sensed data with hydrological variables. J. Hydrol. 2013, 476, 265–273. [Google Scholar] [CrossRef]
- Long, D.; Shen, Y.; Sun, A.; Hong, Y.; Longuevergne, L.; Yang, Y.; Li, B.; Chen, L. Drought and flood monitoring for a large karst plateau in Southwest China using extended GRACE data. Remote Sens. Environ. 2014, 155, 145–160. [Google Scholar] [CrossRef]
- Paredes, F.; Barbosa, H.; Peñaloza-Murillo, M.; Moreno, M.A.; Farias, A. Intercomparison of improved satellite rainfall estimation with CHIRPS gridded product and rain gauge data over Venezuela. Atmósfera 2016, 29, 323–342. [Google Scholar] [CrossRef] [Green Version]
- Bolten, J.D.; Crow, W.T. Improved prediction of quasi-global vegetation conditions using remotely-sensed surface soil moisture. Geophys. Res. Lett. 2012, 39. [Google Scholar] [CrossRef] [Green Version]
- Jackson, T.J.; Bindlish, R.; Cosh, M.H.; Zhao, T.; Starks, P.J.; Bosch, D.D.; Seyfried, M.; Moran, M.S.; Goodrich, D.C.; Kerr, Y.H.; et al. Validation of Soil Moisture and Ocean Salinity (SMOS) soil moisture over watershed networks in the US. IEEE Trans. Geosci. Remote Sens. 2012, 50, 1530–1543. [Google Scholar] [CrossRef] [Green Version]
- Wang, X.X.; Wang, X.; Han, Z.; Yang, J.H. Radio frequency interference detection and characteristic analysis based on the L band stokes parameters remote sensing data. Chemosphere 2015, 70, 1699–1706. [Google Scholar]
- Chen, Y.; Yang, K.; Qin, J.; Cui, Q.; Lu, H.; La, Z.; Han, M.; Tang, W. Evaluation of SMAP, SMOS and AMSR2 soil moisture retrievals against observations from two networks on the Tibetan Plateau. J. Geophys. Res. Atmos. 2017, 122, 5780–5792. [Google Scholar] [CrossRef]
- Liu, W.J.; Liu, C.Q.; Zhao, Z.Q.; Xu, Z.F.; Liang, C.S.; Li, L.B.; Feng, J.Y. Elemental and strontium isotopic geochemistry of the soil profiles developed on limestone and sandstone in karstic terrain on Yunnan-Guizhou Plateau, China: Implications for chemical weathering and parent materials. J. Asian Earth Sci. 2013, 67, 138–152. [Google Scholar] [CrossRef]
- Wang, J.; Zou, B.; Liu, Y.; Tang, Y.; Zhang, X.; Yang, P. Erosion-creep-collapse mechanism of underground soil loss for the karst rocky desertification in Chenqi village, Puding county, Guizhou, China. Environ. Earth Sci. 2014, 72, 2751–2764. [Google Scholar] [CrossRef]
- Williams, J.; Prebble, R.E.; Williams, W.T.; Hignett, C.T. The influence of texture, structure and clay mineralogy on the soil moisture characteristic. Soil Res. 1983, 21, 15–32. [Google Scholar] [CrossRef]
- Provenzano, G.; Giordano, G.; Rallo, G. Discussion of “Soil Water Retention Characteristics of Vertisols and Pedotransfer Functions Based on Nearest Neighbor and Neural Networks Approaches to Estimate AWC” by NG Patil, DK Pal, C. Mandal, and DK Mandal. J. Irrig. Drain. Eng. 2013, 139, 512–515. [Google Scholar] [CrossRef]
- Otkin, J.A.; Anderson, M.C.; Hain, C.; Mladenova, I.E.; Basara, J.B.; Svoboda, M. Examining rapid onset drought development using the thermal infrared–based evaporative stress index. J. Hydrometeorol. 2013, 14, 1057–1074. [Google Scholar] [CrossRef]
- Anderson, M.C.; Zolin, C.A.; Sentelhas, P.C.; Hain, C.R.; Semmens, K.; Yilmaz, M.T.; Tetrault, R. The Evaporative Stress Index as an indicator of agricultural drought in Brazil: An assessment based on crop yield impacts. Remote Sens. Environ. 2016, 174, 82–99. [Google Scholar] [CrossRef] [Green Version]
- Anderson, M.C.; Zolin, C.A.; Hain, C.R.; Semmens, K.; Yilmaz, M.T.; Gao, F. Comparison of satellite-derived LAI and precipitation anomalies over Brazil with a thermal infrared-based Evaporative Stress Index for 2003–2013. J. Hydrol. 2015, 526, 287–302. [Google Scholar] [CrossRef] [Green Version]
- Anderson, M.C.; Kustas, W.P.; Norman, J.M.; Hain, C.R.; Mecikalski, J.R.; Schultz, L.; Gao, F. Mapping daily evapotranspiration at field to continental scales using geostationary and polar orbiting satellite imagery. Hydrol. Earth Syst. Sci. 2011, 15, 223–239. [Google Scholar] [CrossRef] [Green Version]
Figure 1.
The spatial distribution of arid and humid regions and 893 monitoring stations in China.

Figure 2.
Locations of the 893 monitoring stations projected onto the land cover map of China. The green points represent soil moisture stations, and the red points represent stations with both SM and climate data. The classification standards for land cover are described in Section 2.1.5.
Figure 2.
Locations of the 893 monitoring stations projected onto the land cover map of China. The green points represent soil moisture stations, and the red points represent stations with both SM and climate data. The classification standards for land cover are described in Section 2.1.5.

Figure 3.
Spatial distribution of the (a) Pearson correlation coefficient (R), (b) unbiased root mean square error (ubRMSE) between the SMAP and in situ SM at 893 SM stations in China (1 April 2016–30 September 2016). Locations of the 893 monitoring stations are projected onto slope gradient map of China.

Figure 4.
Spatial distribution of the (a) Pearson correlation coefficient (R), (b) unbiased root mean square error (ubRMSE) between 7-day averaged SMAP and in situ SM at 204 stations with both SM data and climate data in China (1 April 2016–30 September 2016).
Figure 4.
Spatial distribution of the (a) Pearson correlation coefficient (R), (b) unbiased root mean square error (ubRMSE) between 7-day averaged SMAP and in situ SM at 204 stations with both SM data and climate data in China (1 April 2016–30 September 2016).

Figure 5.
Custom regions in China for the evaluation of the SMAP L3 radiometer SM at the regional scale, including region 1–3.
Figure 5.
Custom regions in China for the evaluation of the SMAP L3 radiometer SM at the regional scale, including region 1–3.

Figure 6.
Time series plots of the SMAP L3 SM data and the in situ SM over (a) region 1, (b) region 2 and (c) region 3. Variable Soil Moisture and Precipitation represent the 7-day averaged SM and 7-day accumulated precipitation, respectively. 30 groups of data (i.e., SMAP SM, in situ SM and precipitation) were used from 1 April 2016 to 30 September 2016. It shows that the rainfall results in increases in SM, and SMAP SM can generally reflect these dynamics.


Figure 7.
Comparison between the SMAP L3 SM product and the in situ SM observations over (a) region 1, (b) region 2, (c) region 3. 30 pairs of 7-day averaged data were used from 1 April 2016 to 30 September 2016.
Figure 7.
Comparison between the SMAP L3 SM product and the in situ SM observations over (a) region 1, (b) region 2, (c) region 3. 30 pairs of 7-day averaged data were used from 1 April 2016 to 30 September 2016.
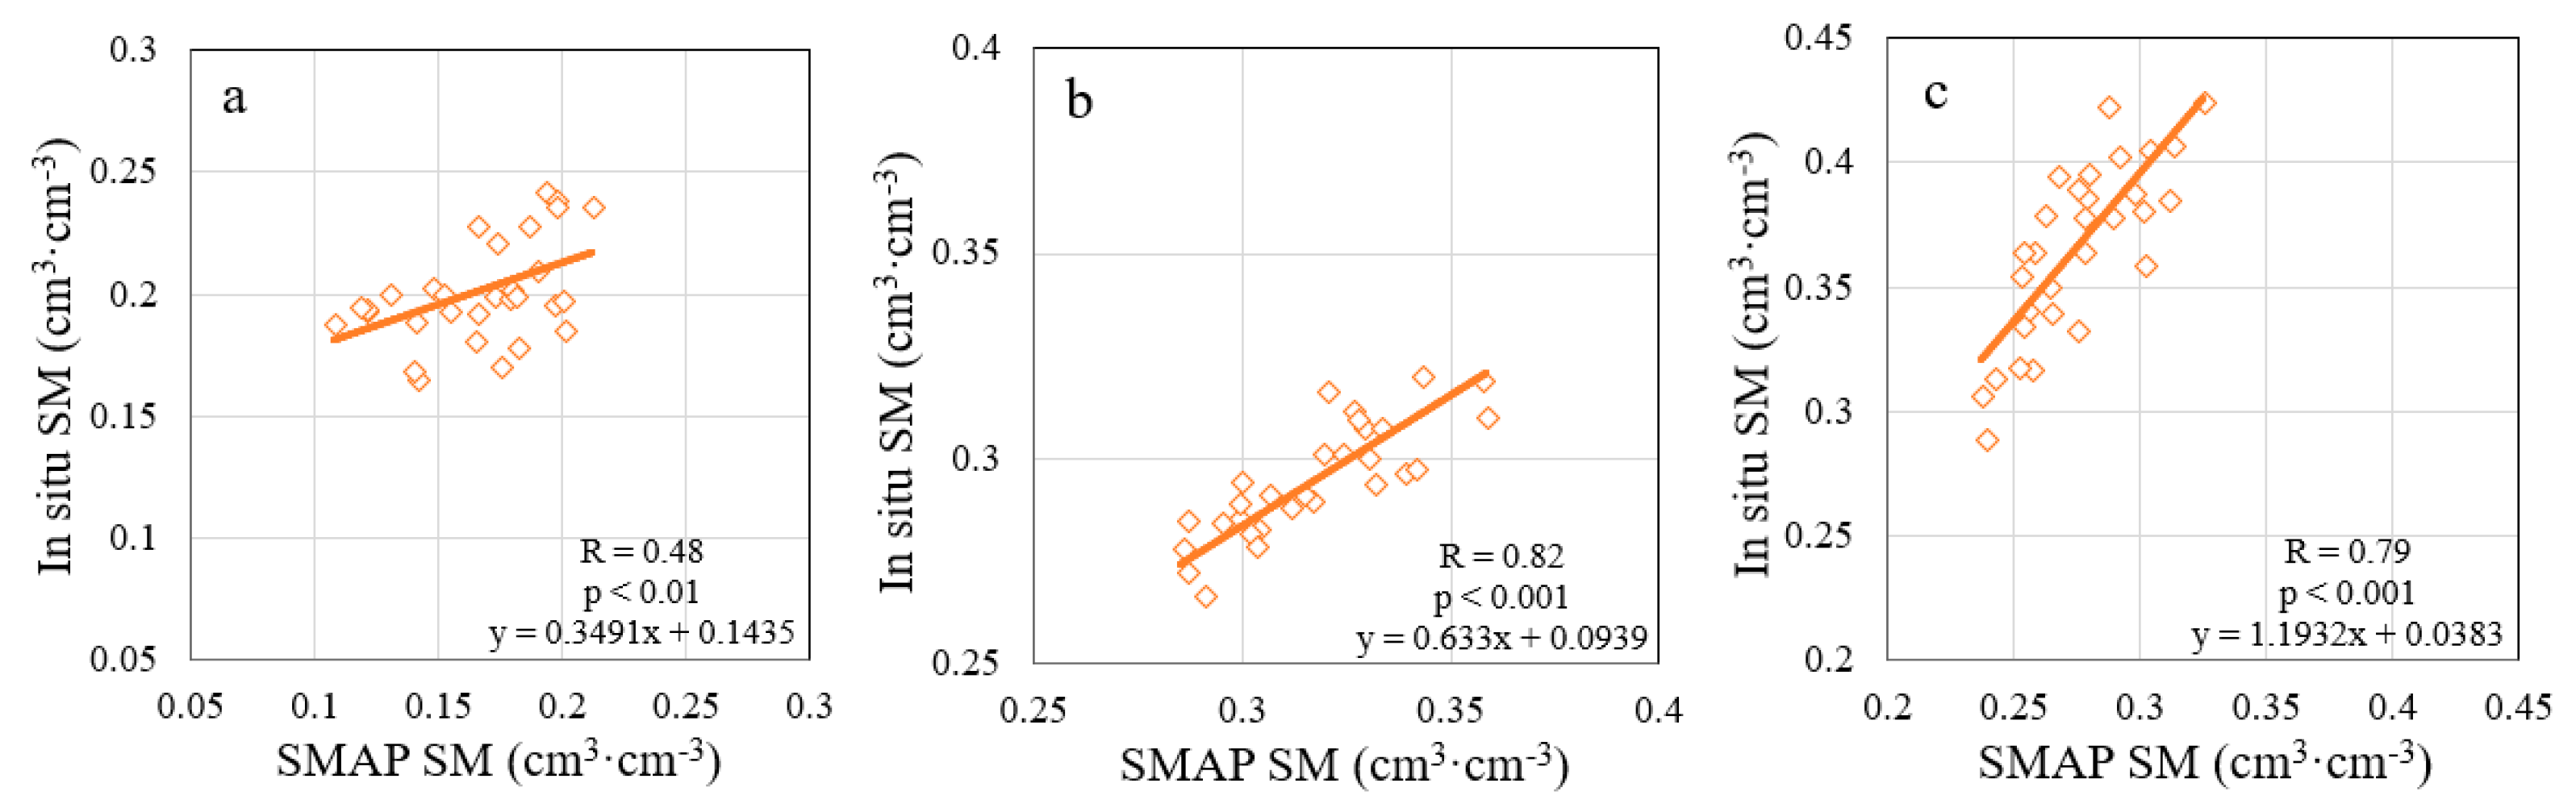
Figure 8.
Pearson correlation coefficient (R) between the weekly SWDI-SMAP and AWD at 204 monitoring stations with both SM and climate data. 30 pairs of 7-day averaged data were used from 1 April 2016 to 30 September 2016.
Figure 8.
Pearson correlation coefficient (R) between the weekly SWDI-SMAP and AWD at 204 monitoring stations with both SM and climate data. 30 pairs of 7-day averaged data were used from 1 April 2016 to 30 September 2016.

Figure 9.
Comparison between the SWDI-SMAP and AWD over (a) region 1, (b) region 2, (c) region 3. 30 pairs of 7-day averaged data were used from 1 April 2016 to 30 September 2016.
Figure 9.
Comparison between the SWDI-SMAP and AWD over (a) region 1, (b) region 2, (c) region 3. 30 pairs of 7-day averaged data were used from 1 April 2016 to 30 September 2016.

Figure 10.
Percentage of consistent (a) all drought events and (b) severe and extreme drought events between the SWDI-SMAP and AWD at 204 monitoring stations with both SM and climate data. 30 pairs of 7-day averaged data were used from 1 April 2016 to 30 September 2016.
Figure 10.
Percentage of consistent (a) all drought events and (b) severe and extreme drought events between the SWDI-SMAP and AWD at 204 monitoring stations with both SM and climate data. 30 pairs of 7-day averaged data were used from 1 April 2016 to 30 September 2016.

Figure 11.
Difference between (a) all drought events and (b) severe and extreme drought events between the SWDI-SMAP and AWD at 204 monitoring stations with both SM and climate data. 30 pairs of 7-day averaged data were used from 1 April 2016 to 30 September 2016.
Figure 11.
Difference between (a) all drought events and (b) severe and extreme drought events between the SWDI-SMAP and AWD at 204 monitoring stations with both SM and climate data. 30 pairs of 7-day averaged data were used from 1 April 2016 to 30 September 2016.

Figure 12.
Spatial distribution of the SWDI-SMAP across China for the month of June 2016 (regions A–E denote representative areas with drought differences between the SWDI-SMAP and VHI. There are severe and extreme drought in region A-C and moderate drought in region D on the SWDI-SMAP; however, the drought conditions are much lighter, or there is no drought, on the VHI. There is no drought in region E on SWDI-SMAP, but the drought condition is much more serious on the VHI).


Table 1.
Statistics of comparison between the SMAP L3 SM product and the in situ SM observations in each of the 3 regions (1 April 2016–30 September 2016).
Table 1.
Statistics of comparison between the SMAP L3 SM product and the in situ SM observations in each of the 3 regions (1 April 2016–30 September 2016).
| No. of Sites | R | Bias (cm3·cm−3) | RMSE (cm3·cm−3) | ubRMSE (cm3·cm−3) | |
|---|---|---|---|---|---|
| Region 1 | 35 | 0.48 | −0.038 | 0.046 | 0.026 |
| Region 2 | 76 | 0.82 | 0.020 | 0.025 | 0.012 |
| Region 3 | 28 | 0.79 | −0.091 | 0.094 | 0.022 |
© 2018 by the authors. Licensee MDPI, Basel, Switzerland. This article is an open access article distributed under the terms and conditions of the Creative Commons Attribution (CC BY) license (http://creativecommons.org/licenses/by/4.0/).
Share and Cite
MDPI and ACS Style
Bai, J.; Cui, Q.; Chen, D.; Yu, H.; Mao, X.; Meng, L.; Cai, Y. Assessment of the SMAP-Derived Soil Water Deficit Index (SWDI-SMAP) as an Agricultural Drought Index in China. Remote Sens. 2018, 10, 1302. https://doi.org/10.3390/rs10081302
AMA Style
Bai J, Cui Q, Chen D, Yu H, Mao X, Meng L, Cai Y. Assessment of the SMAP-Derived Soil Water Deficit Index (SWDI-SMAP) as an Agricultural Drought Index in China. Remote Sensing. 2018; 10(8):1302. https://doi.org/10.3390/rs10081302
Chicago/Turabian StyleBai, Jueying, Qian Cui, Deqing Chen, Haiwei Yu, Xudong Mao, Lingkui Meng, and Yang Cai. 2018. "Assessment of the SMAP-Derived Soil Water Deficit Index (SWDI-SMAP) as an Agricultural Drought Index in China" Remote Sensing 10, no. 8: 1302. https://doi.org/10.3390/rs10081302
Note that from the first issue of 2016, this journal uses article numbers instead of page numbers. See further details here.