Article

Use of SMOS L3 Soil Moisture Data: Validation and Drought Assessment for Pernambuco State, Northeast Brazil

by
Alzira G. S. S. Souza
,
Alfredo Ribeiro Neto
*,
Luciana Rossato
,
Regina C. S. Alvalá
and
Laio L. Souza
Department of Civil and Environmental Engineering, Universidade Federal de Pernambuco, 50670-901 Recife, Brazil
*
Author to whom correspondence should be addressed.
Remote Sens. 2018, 10(8), 1314; https://doi.org/10.3390/rs10081314
Submission received: 2 July 2018 / Revised: 13 August 2018 / Accepted: 17 August 2018 / Published: 20 August 2018
(This article belongs to the Special Issue Soil Moisture Remote Sensing Across Scales)

Abstract

:
The goal of this study was to validate soil moisture data from Soil Moisture Ocean Salinity (SMOS) using two in situ databases for Pernambuco State, located in Northeast Brazil. The validation process involved two approaches, pixel-station comparison and areal average, for three regions in Pernambuco with different climatic characteristics. After validation, the SMOS data were used for drought assessment by calculating soil moisture anomalies for the available period of data. Four statistical criteria were used to verify the quality of the satellite data: Pearson correlation coefficient, Willmott index of agreement, BIAS, and root mean squared difference (RMSD). The average RMSD calculated from the daily time series in the pixel and the areal assessment were 0.071 m3·m−3 and 0.04 m3·m−3, respectively. Those values are near to the expected 0.04 m3·m−3 accuracy of the SMOS mission. The analysis of soil moisture anomalies enabled the assessment of the dry period between 2012 and 2017 and the identification of regions most impacted by the drought. The driest year for all regions was 2012, when the anomaly values achieved −50% in some regions. The use of SMOS data provided additional information that was used in conjunction with the precipitation data to assess drought periods. This may be particularly relevant for planning in agriculture and supporting decision makers and farmers.

Graphical Abstract

1. Introduction

Soil moisture is an important parameter of the hydrologic cycle, which has hydrological, ecological, environmental, and agricultural impacts. This occurs because soil moisture is directly or indirectly related to processes, such as surface runoff and groundwater recharge, as well as ecosystem behavior [1,2,3]. Soil moisture monitoring supplies fundamental information about interactions between soil, vegetation, and atmosphere to improve the accuracy of meteorological forecasting [3,4]. These data also help improve agricultural productivity and flood and drought risk management, contributing to supporting actions that mitigate the effects of water scarcity [1,5,6]. Soil moisture has been considered an important variable for establishing drought severity. Soil moisture has been applied for drought monitoring by the United States Drought Monitor, which uses data from the U.S. National Weather Service’s Climate Prediction Center soil moisture model. Soil moisture has been particularly useful for agricultural drought monitoring using the water balance model [1,7] and remotely sensed soil moisture [8]. Soil moisture can be obtained by in situ measurements, which is expensive for large areas [4,9], or by sensors on board satellites for global monitoring. Given the limitations of in situ measurements, remote sensing has become an efficient alternative for collecting data on a large scale for studies where time and space are relevant aspects [2,5,6].
Soil moisture studies using remote sensing gained momentum during the 1990s with the launching of three satellites missions that transported Synthetic Aperture Radar (SAR) Radar Satellite (RADARSAT), European Remote Sensing (ERS), and Japanese Earth Resources Satellite (JERS). SAR data have potential for estimating soil moisture due to the ability of electromagnetic pulses to penetrate the soil and modify its properties when interacting with water [10,11].
Brightness temperature (TB) is another method used to estimate soil moisture using remote sensing. TB is acquired with passive sensors that operate in the range of microwaves. The estimation is possible due to the direct relation between soil moisture and soil emissivity [10,11,12,13]. The Soil Moisture Ocean Salinity (SMOS) and Soil Moisture Active and Passive (SMAP) missions are examples of sensors with these characteristics. Both sensors use the L-band to collect soil moisture. These missions have conducted campaigns to assess the remotely-obtained products compared with in situ data in different climates in order to study drought effects [14,15,16,17].
In November 2009, the European Space Agency (ESA) launched the SMOS satellite carrying on board a passive sensor. This microwave imaging radiometer using aperture synthesis (MIRAS), used in the present work, operates on the L-band at frequency 1.4 GHz and polarization horizontal-vertical (H-V) [2,6,13,18]. These products are available with a daily time resolution for three-day, nine-day, monthly, and yearly periods [19] and have an average ground resolution of 43 km [13], but can be better depending on the level of processing (40 km for L2, 25 km for L3, and 1 km for L4).
A limited number of soil moisture monitoring networks exist around the world [20]. Some of these networks include: Soil Moisture Measurement Stations Network of the University of Salamanca (REMEDHUS), Spain [5,6]; Wales Soil Moisture Network (WSMN), UK [21]; and OzNet in Australia [14,20]. South America is an example of a region that lacks in situ data, mainly due to its large territory where data collection is often unviable. A soil moisture monitoring network was established in the Brazilian semiarid region with the objective of obtaining relevant information for use in agriculture productivity modelling. The in situ data are also important for remote sensing product validation [21] for the confident use of these data. However, maintaining a monitoring network is costly and a major challenge, mainly for large areas. Owing to the few studies developed with the goal of assessing the SMOS products in Brazil and South America, the present study seeks to validate these products, indicating which would be useful for future applications as drought monitoring in the semiarid regions. Northeast Brazil is considered the most densely populated semiarid region in the world with a population reaching 23.5 million inhabitants. The climate affects the life of the population that has to face long drought periods with consequences for water supply, irrigation and agriculture, among other activities. The impacts of droughts can be attenuated with tools that allow monitoring of the variables associated to this phenomenon, especially for large areas as is the case of Brazilian semiarid whose area is almost 1 million km2.
The SMOS products represent the heterogeneity of a surface with only one pixel, complicating validation [6,22], whereas the in situ observation networks provide data for validation on several scales [6,22,23]. The density of the in situ stations is crucial for the satisfactory representation of wet and dry periods in the region represented by the pixel. The coarse resolution of the soil moisture remote sensing products also creates challenges for comparisons with observation networks. Even for large networks, the sampling rate is not high enough to provide at least one station per grid cell [6,24].
The validation of products of passive microwaves can be performed using in situ data, models, and other satellite products. Several processes have been developed by the scientific community to validate soil moisture remote sensing products from satellites, such as the Advanced Microwave Scanning Radiometer for the Earth Observing System (AMSR-E) [10,12,25], SMAP [26,27,28], and SMOS [2,6,16,17,24,29]. These remotely sensed data have been used to obtain drought indices with monitoring goals [10,12], including SMOS soil moisture data [1,5,8,30]. This kind of application is relevant for the aim of our study.
Since 2012, the semiarid region of Northeast Brazil has been affected by drought encompassing a large area of about 1 million km2. By the end of 2017, precipitation was still below the historical average. The assessment of this drought showed it was the most extreme and longest drought ever registered in the area [31,32]. According to Alvalá et al. [32], in 2015–2016, 184 municipalities in the State of Pernambuco were affected by the drought, of which 76 had more than 50% of their area impacted with negative consequences on family agriculture. An estimate of family farming establishments susceptible to drought impact during 2015 and 2016 was equivalent to 141,143 establishments in Pernambuco State alone.
Considering the difficulties related to SMOS data validation and the importance of studies in different parts of the world, this paper reports on the validation of soil moisture data from MIRAS-SMOS using two in situ databases collected in Pernambuco State, located in Northeast Brazil. The extent of the study area ensures heterogeneity in terms of land cover, topography, and climate characteristics. The validation process considers two approaches, pixel-station comparison and areal average, for three regions in Pernambuco State with different climate characteristics. After validation, the SMOS data are used for drought assessment to calculate soil moisture anomalies for the period of data available.

2. Materials and Methods
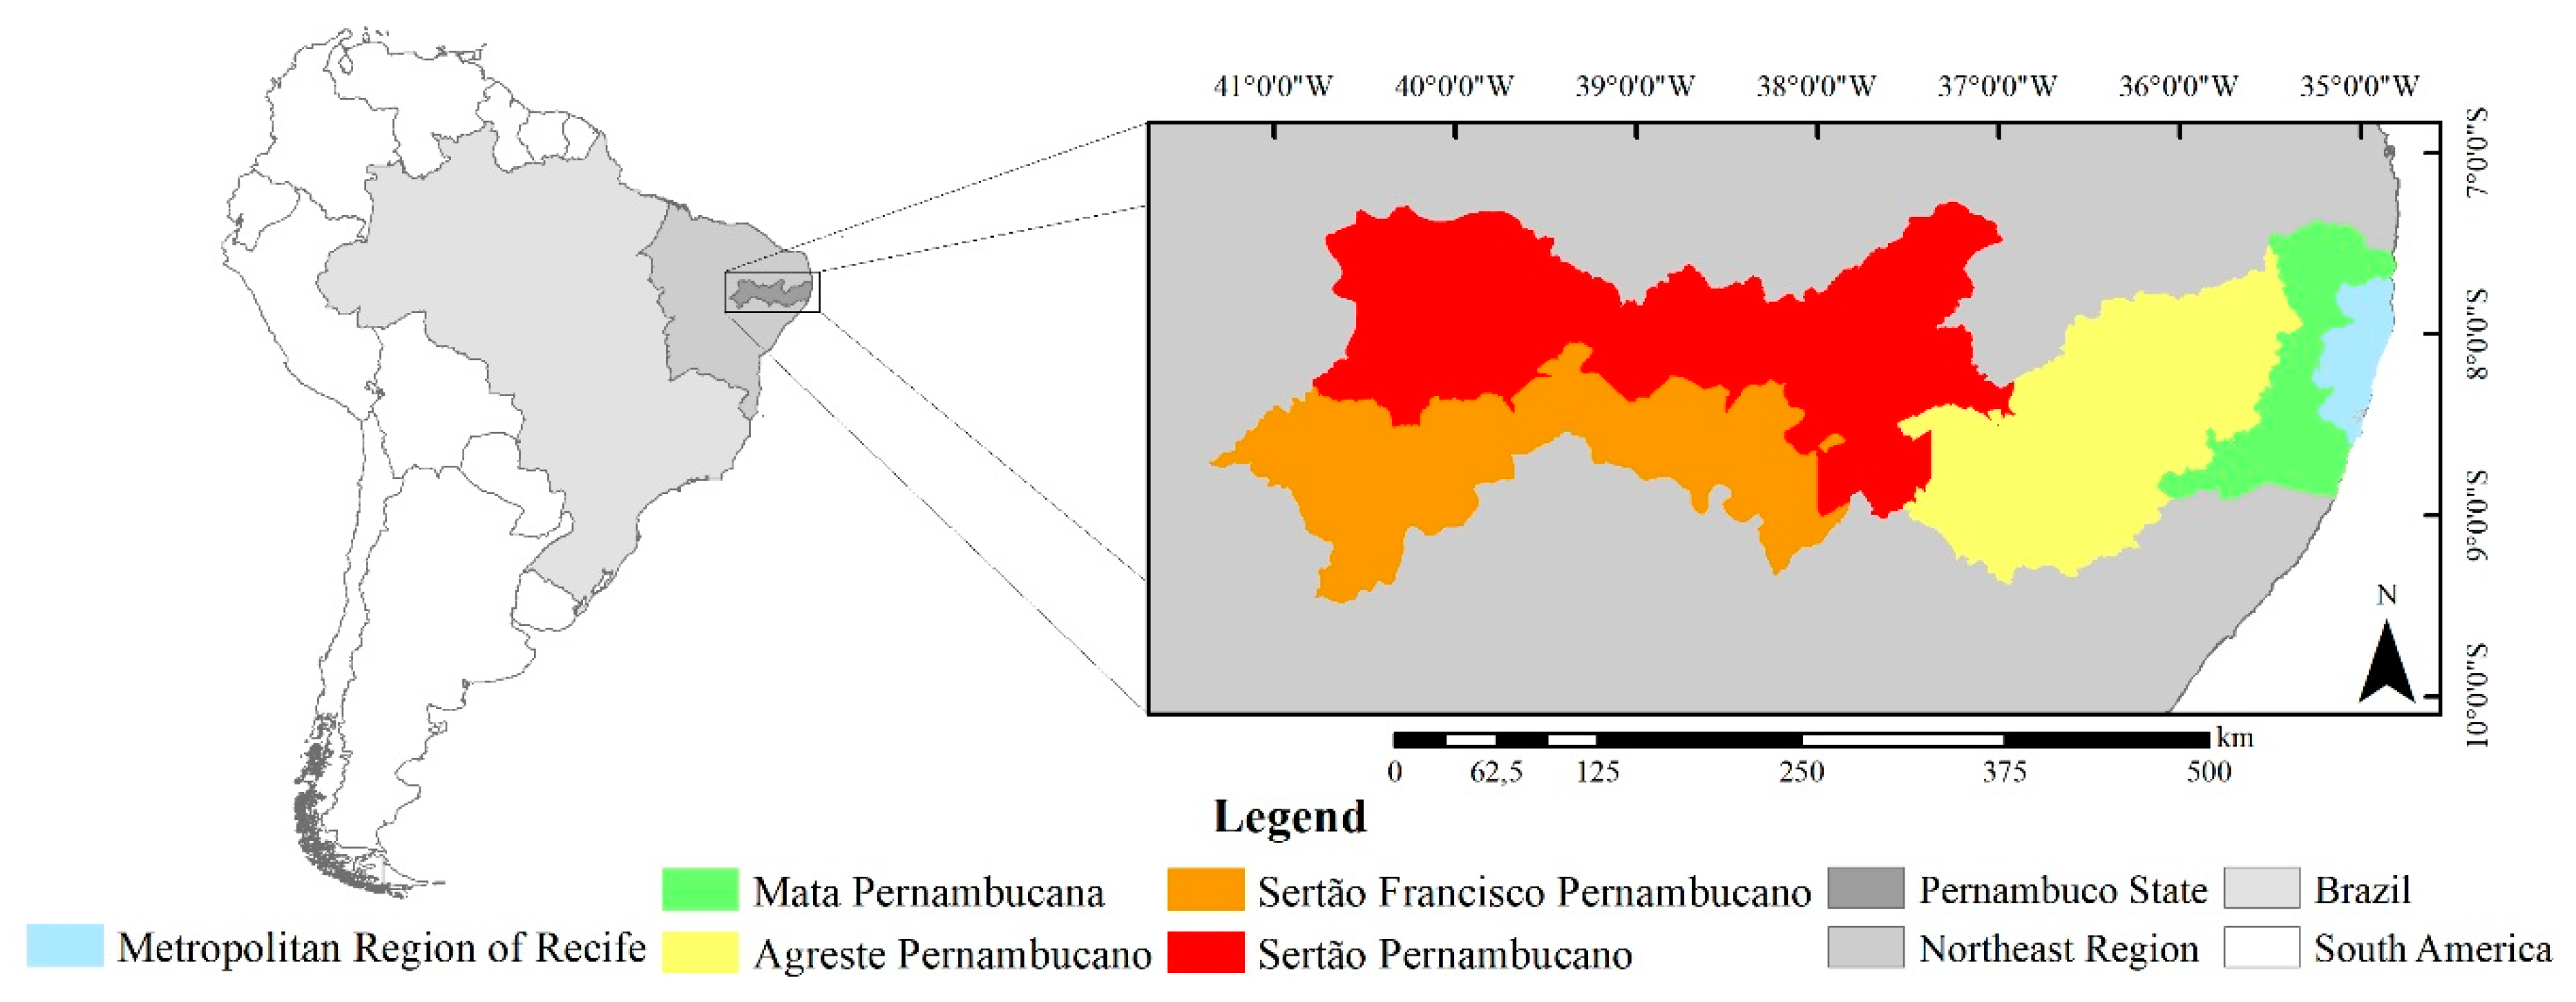
2.1. Study Area

The State of Pernambuco is located in Northeast Brazil and has an area of 98,281 km2 (Figure 1). Its climate is tropical with annual average temperatures varying between 25 and 31 °C. The precipitation is heterogeneous, with the highest rainfalls on the coast, which decrease in the western direction where the climate is semiarid. About 80% of the territory is semiarid land with irregular precipitation associated with drought phenomenon [33].
The state of Pernambuco has five mesoregions: Metropolitan Region of Recife, Mata Pernambucana, Agreste, Sertão of São Francisco, and Sertão Pernambucano (Figure 1) [33]. To analyze the SMOS data, the five regions were grouped into three based on their climate characteristics. Region 1 is the Metropolitan Region of Recife plus Mata Pernambucana, Region 2 is the Agreste, and Region 3 is the Sertão (São Francisco and Pernambucano). Region 1 has the largest economic and demographic potential. The vegetation is characteristic of Atlantic forest with precipitation varying between 800 to greater than 2000 mm per year [33]. The Agreste mesoregion occupies 24,000 km2 with 71 municipalities. It is the transition zone between the humid tropical climate of the Mata region to the semiarid climate of the Sertão [34]. The mesoregion Sertão of São Francisco is cut through by the São Francisco River, which favors the irrigation of agriculture and increases the potential for food production. The Sertão is characterized by shallow soils, Caatinga vegetation (thornscrub, cactus, and bunch grasses), an annual precipitation of 400–800 mm and a hot and dry climate with high temperatures and intermittent rivers. Different levels of agriculture production are performed in the area, from family subsistence to large irrigated farms for production of fruit for exportation using water from the São Francisco River. The land cover in Pernambuco State is characterized by large areas used for farming of crops at different stages of growth and pasture [35] totaling an area of 70,310.23 km2 (71.54% of the Pernambuco’s territory). This large proportion of land used for farming makes Pernambuco State vulnerable to the impacts of drought.

2.2. In Situ Data

Precipitation and soil moisture from the in situ databases were used for the validation of the MIRAS-SMOS soil moisture data. The network of stations belongs to the Water and Climate Pernambuco State Agency (APAC) and National Center for Monitoring and Early Warning of Natural Disasters (CEMADEN) (Figure 2). APAC has 12 stations that have been collecting data since 2013 with soil moisture sensors at three depths (10, 20, and 40 cm), using model PR2/4 produced by Delta-TDevices (Cambridge, England). The accuracy of the data collected by the sensor is 0.05 m3·m−3. The CEMADEN networks cover the Brazilian semiarid region with measurements collected since 2015 from two sets of equipment, i.e., by sensors installed at two depths (10 and 20 cm) and at four depths (10, 20, 30, and 40 cm), using model EC-5 produced by Decagon Devices (Pullman, United States) (accuracy of 0.03 m3·m−3). Both sensors are able to collect data every hour, but they were set for daily and eight-day time intervals. For the analysis, 104 stations from the CEMADEN networks were selected to characterize the soil moisture in Pernambuco State. For both networks, the comparison with SMOS data was completed considering only values taken from the depth of 10 cm, since the satellite is only able to obtain information from the soil surface. The databases were different sizes: CEMADEN’s stations time series covered the period from July 2015 to July 2017, whereas APAC’s stations included the period from May 2013 to November 2017. The total number of stations was 116 for the two networks. Of these, 64 were used in the comparison pixel-station (located inside Pernambuco State) and 116 used in the areal average calculation (located inside and near Pernambuco’s boundary). The number of samples from the APAC’s time series varied between 353 to 1334 and 107 to 208 for the one-day and eight-day time intervals, respectively. For the CEMADEN’s stations, the variation was 34–661 (for daily time interval) and 11–96 (eight-day).
Precipitation data were also used in the analysis. The precipitation database has a 5 km spatial resolution generated by the Center for Weather Forecasts and Climate Studies (CPTEC) of the National Institute for Space Research (INPE) [36]. This product was obtained by using data from meteorological stations of the INPE, State Meteorological Centers, and National Institute of Meteorology (INMET) [36].

2.3. SMOS Data

The satellite products used in this work include soil moisture data (m3·m−3) version L3 with 25 km spatial resolution and one-day time resolution prepared by the SMOS Barcelona Expert Center (SMOS BEC) and available on its website (http://cp34-bec.cmima.csic.es/data/data-access/). These products were generated from L2 Soil Moisture User Data Product (UDP) supplied by the ESA. The L2 products were filtered to discard unreliable values, such as negative soil moisture and a Data Quality Index greater than 0.07 [6,13,20]. The analysis presented here used daily data, and we then calculated the average of eight days [30].
The SMOS satellite has a sun-synchronous orbit and uses an interferometric radiometer operating in the L-band to measure brightness temperature and then estimate soil moisture [17]. The satellite operates in two orbits: ascendant and descendant. In the first, the satellite moves in the south–north direction and passes over the equator at 6:00 a.m., whereas the descendant orbit moves in the north–south direction and passes over the equator at 6:00 p.m. [2,18,20]. When a record was completed in both orbits on the same day, the two values are averaged. If only one orbit had a valid value, this value was considered for that day and, if no valid value was obtained in either orbit, the day had a gap in the data. The daily time series was aggregated later for the eight-day average. This time interval was also assessed since it was used for the calculation of drought indices in a previous study [30]. Further application of SMOS data for drought monitoring in Northeast Brazil is expected so such indices can be used.
Soil moisture can vary significantly with depth. According to Escorihuela et al. [37], the vertical sampling depth of the SMOS L-band observations is generally assumed in the order of 2.5–3.5 cm. SMOS measures the brightness temperature, which is a function of the emissivity, and therefore a function of near surface (0–5 cm depth) soil moisture. Days with precipitation can affect SMOS retrievals due to a shortening of the sensing depth [29].
As pointed out by Jackson et al. [29], an ideal in situ soil moisture dataset that is able to validate satellite surface soil moisture demands must obtain surface layer observations at a soil depth of 5 cm, the 0–100 cm profile moisture, and additional meteorological measurements with coverage over numerous domains in a variety of climate and geographic regions. Few currently available bases meet all these requirements. Surface soil moisture from 1–15 cm shows extensive variation and dependencies on the prevailing environment, since the soil directly gains or loses moisture through rainfall or evaporation.
In fact, satellites measuring microwave radiation with the L-band are sensitive to soil moisture at the surface, which, in some cases, may be less than 5 cm. The soil depth that contributes to radiometer observation becomes shallow when the near surface is wet. This may occur during and shortly after a precipitation event. After some elapsed time, the soil moisture profile becomes more uniform (i.e., the moisture at the surface will be roughly consistent over the 0–5 cm profile of the soil) [29,37]. This difference in sensing depth should be understood by users. After large rainfall events, the SMOS measurement may represent a thinner contributing layer.
Considering that the soil moisture monitoring observational network in Brazil’s semiarid region was established to obtain relevant information for use in agricultural productivity modeling, in situ measurements of the most superficial layer (0–5 cm) are not being collected. However, since the mean annual precipitation in the semiarid region is not high, the variability in the humidity at a depth of 5 cm is not significant when compared to the depth of 10 cm, which cannot be extended to the Mata region in Pernambuco State.

2.4. Analysis Criteria

To evaluate the comparison between in situ and SMOS level L3 data, four statistics were used: Pearson correlation coefficient (Pearson’s r), Willmott index of agreement, BIAS, and root mean squared difference (RMSD). Pearson’s r establishes the distribution of a probability system, which represents the level of relation between two variables, which is given by the equation:
r = i = 1 n ( S M I N S I T U , i S M I N S I T U ¯ ) × ( S M S M O S , i S M S M O S ¯ ) i = 1 n ( S M I N S I T U , i S M I N S I T U ¯ ) 2 × i = 1 n ( S M S M O S , i S M S M O S ¯ ) 2
where r is the Pearson correlation coefficient, SMINSITU is the soil moisture measured on the ground, SMSMOS is the soil moisture obtained from the satellite, n is the number of values, and the overbar is the mean operator. The Pearson’s r varies between −1 and 1. The closer the r value to 1, better the correlation between the samples, which may be positive or negative. The first case occurs when x increases, as y also increases. The r value is negative if x increases, then y decreases. All correlations were submitted to the Student’s t test with a level of 5% considered significant (p < 0.05) [38].
The Willmott index (d) indicates the level of agreement between the estimated values in relation to the observed data. The d coefficient varies between 0 and 1. The closer the value to 1, the greater the agreement. d measures the proximity of the satellite data to the in situ data, differing from the Pearson coefficient observed, which assesses the correlation of the SMOS data in relation to in situ measurement regardless the proximity of the paired values. The following equation is used to calculate this index:
d = 1 [ i = 1 n ( S M S M O S , i S M I N S I T U , i ) 2 i = 1 n ( | S M S M O S , i S M I N S I T U ¯ | + | S M I N S I T U , i S M I N S I T U ¯ | ) 2 ]
The BIAS and RMSD criteria involve obtaining the difference between data of soil moisture and the data estimated by the satellite. BIAS is used to measure the trend in the satellite in overestimating or underestimating soil moisture in relation to the in situ data. This criterion may be affected by negative and positive errors with the same magnitude that result in a compensation for the errors. The use of RMSD helps to demonstrate a more realistic magnitude of disagreement between the data [4,20]. In both cases, the closer the value to 0, the better the performance for that statistic.
BIAS = i = 1 n ( S M S M O S , i S M I N S I T U , i ) n
RMSD = i = 1 n ( S M S M O S , i S M I N S I T U , i ) 2 n
Sánchez et al. (2012) [24] and Jackson et al. (2006) [39] list the characteristics that a robust program of validation should consider, for instance, as many types of comparison as possible and provide actual spatially representative ground-based soil moisture. In the present work, two methods of comparison were considered. Firstly, we considered using the values from the pair pixel-station, which are data from the pixel where the station is located. In the cases where two stations were available in the same pixel, besides the assessment of the pair pixel-station, a comparison was also made with the average of the two values. The second comparison method used involved the average soil moisture for three selected areas. The inverse distance weighted (IDW) method was used to interpolate soil moisture in the mesoregions and to calculate its average. This method was chosen due to its simplicity and efficiency demonstrated in applications that aimed to interpolate soil moisture data [40,41]. The result of the interpolation is a raster where each pixel is assigned a value of soil moisture determined by the equation:
S M I N T = i = 1 n S M i · 1 / d i 2 i = 1 n 1 / d i 2
where SMINT is the value of soil moisture interpolated in the pixel (x, y), di is the distance between the station i and the center of the pixel (x, y), SMi is the value of soil moisture in the station i, and n is the number of stations used in the calculation of SM.
The number of stations used in Equation (5) was defined based on the radius of influence on each pixel. Firstly, the distance of the nearest station to the center of the pixel (dmin) was calculated. The radius of influence was equal to dmin multiplied by two.

2.5. Drought Assessment

Two evaluations were completed using SMOS data. The first was the comparison of soil moisture considering two periods: 2010–2011 and 2012–2017. The first period was near the long term precipitation average, whereas the second period was below the historical average. The results are presented in terms of percentage anomaly for each season. The second assessment included a calculation of the annual anomaly for each year in comparison to the period of 2010 to 2017. In this case, the precipitation anomaly was also calculated.

3. Results

The analysis was accomplished in the following three steps: (1) application of the criteria presented in the prior section to daily and eight-day time interval firstly for pixel assessment; (2) application of the assessment criteria using areal average for the three regions; and (3) after validation of the SMOS data, using the soil moisture series to generate maps to evaluate the severity of the recent drought in terms of spatial and temporal dynamics.

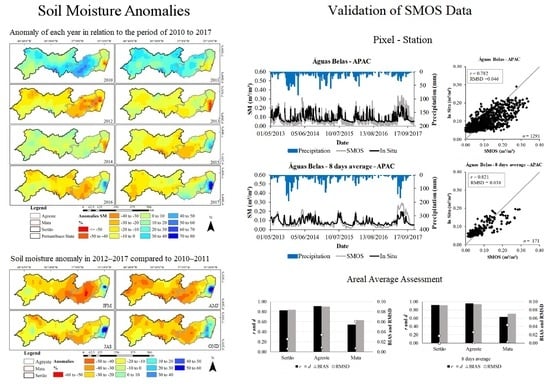
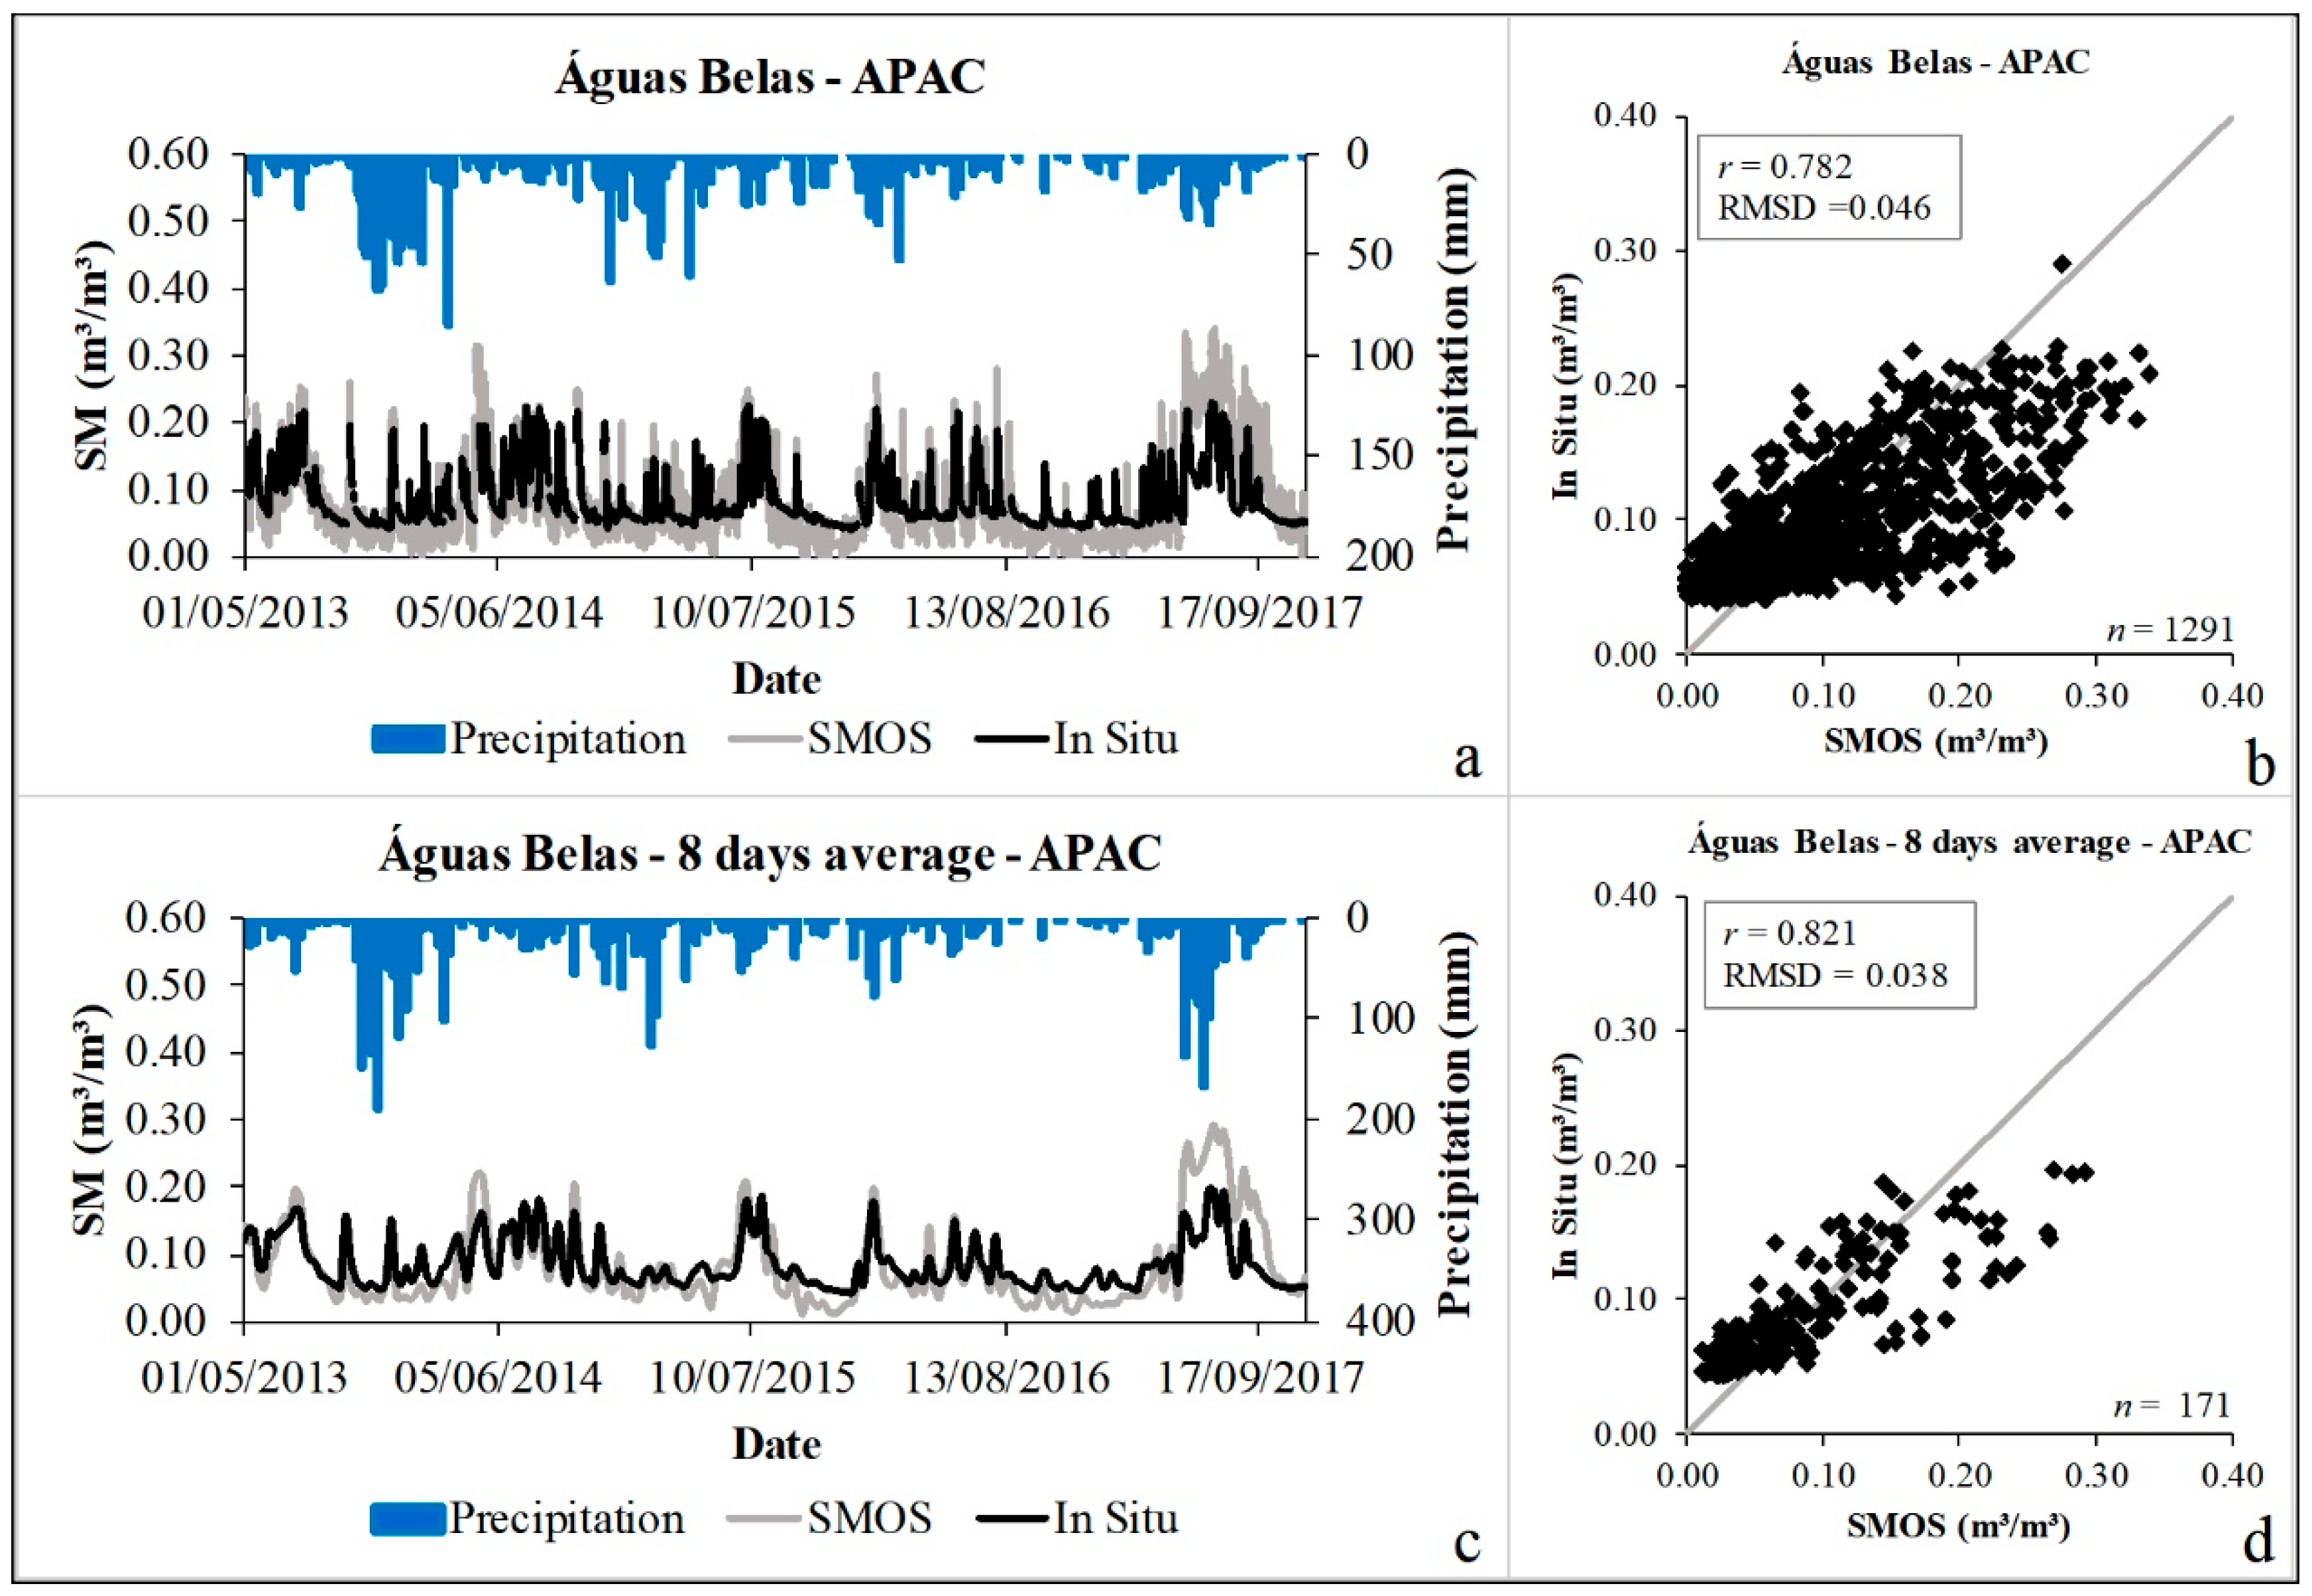
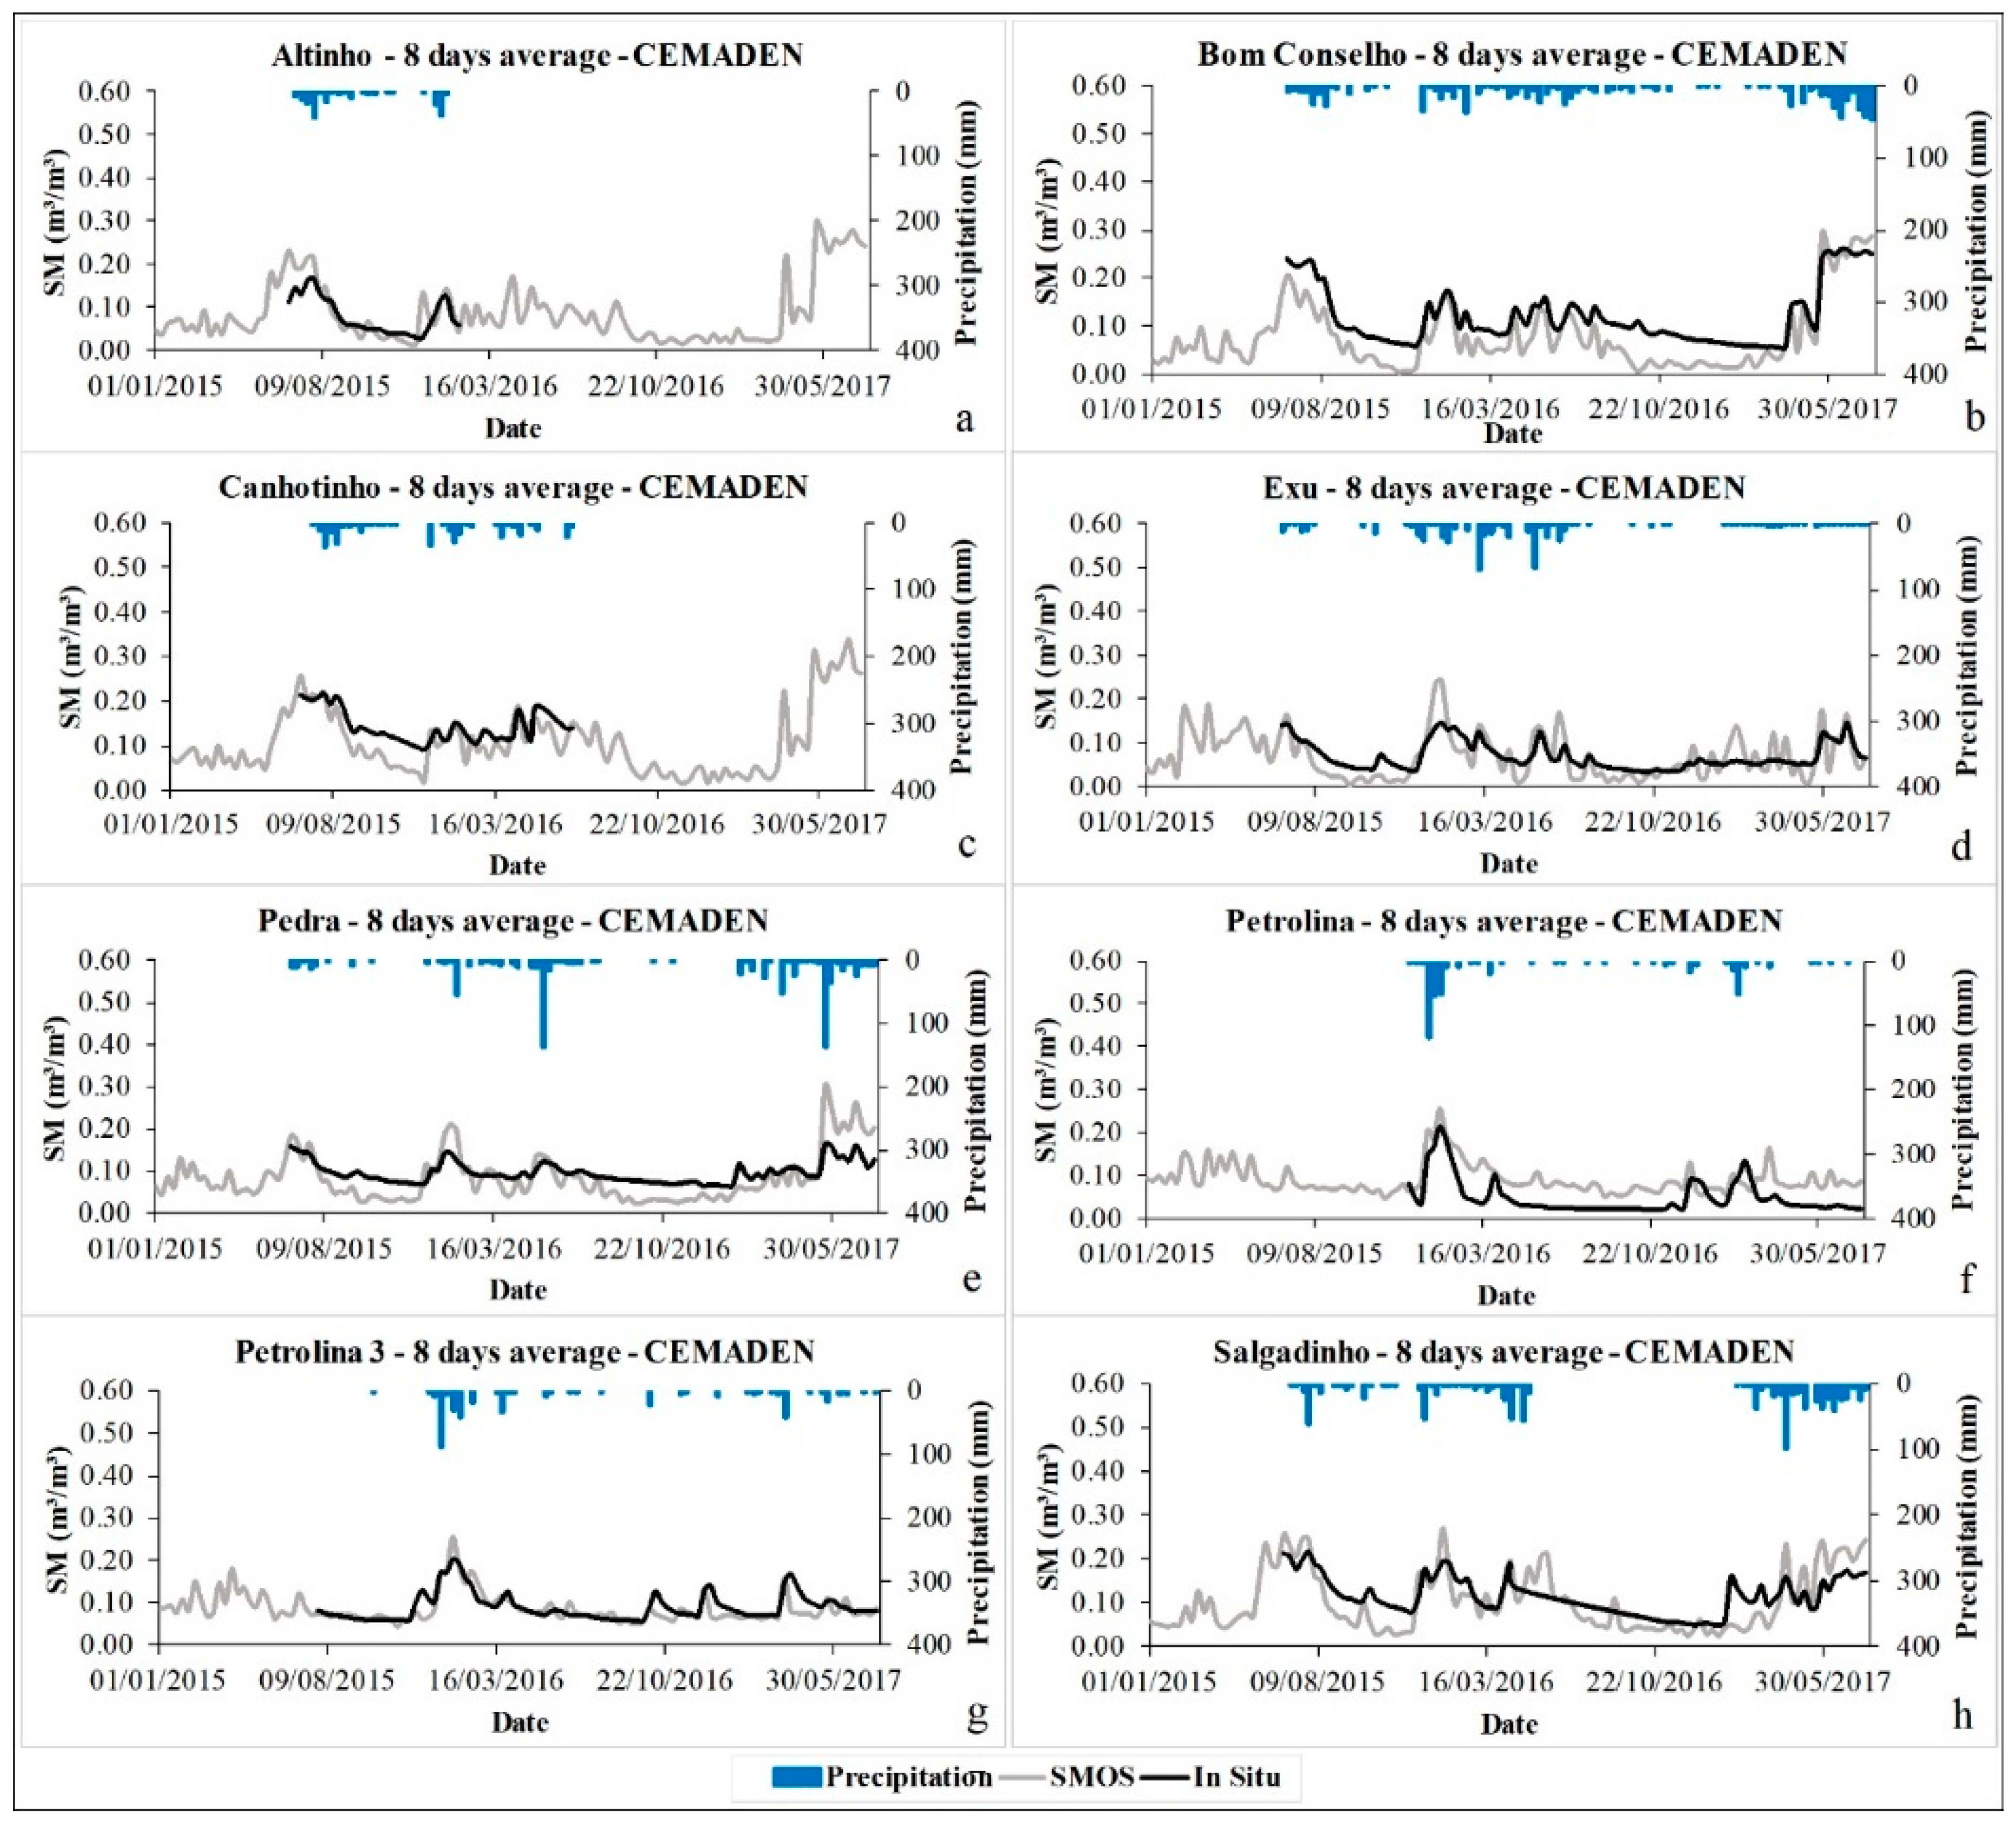
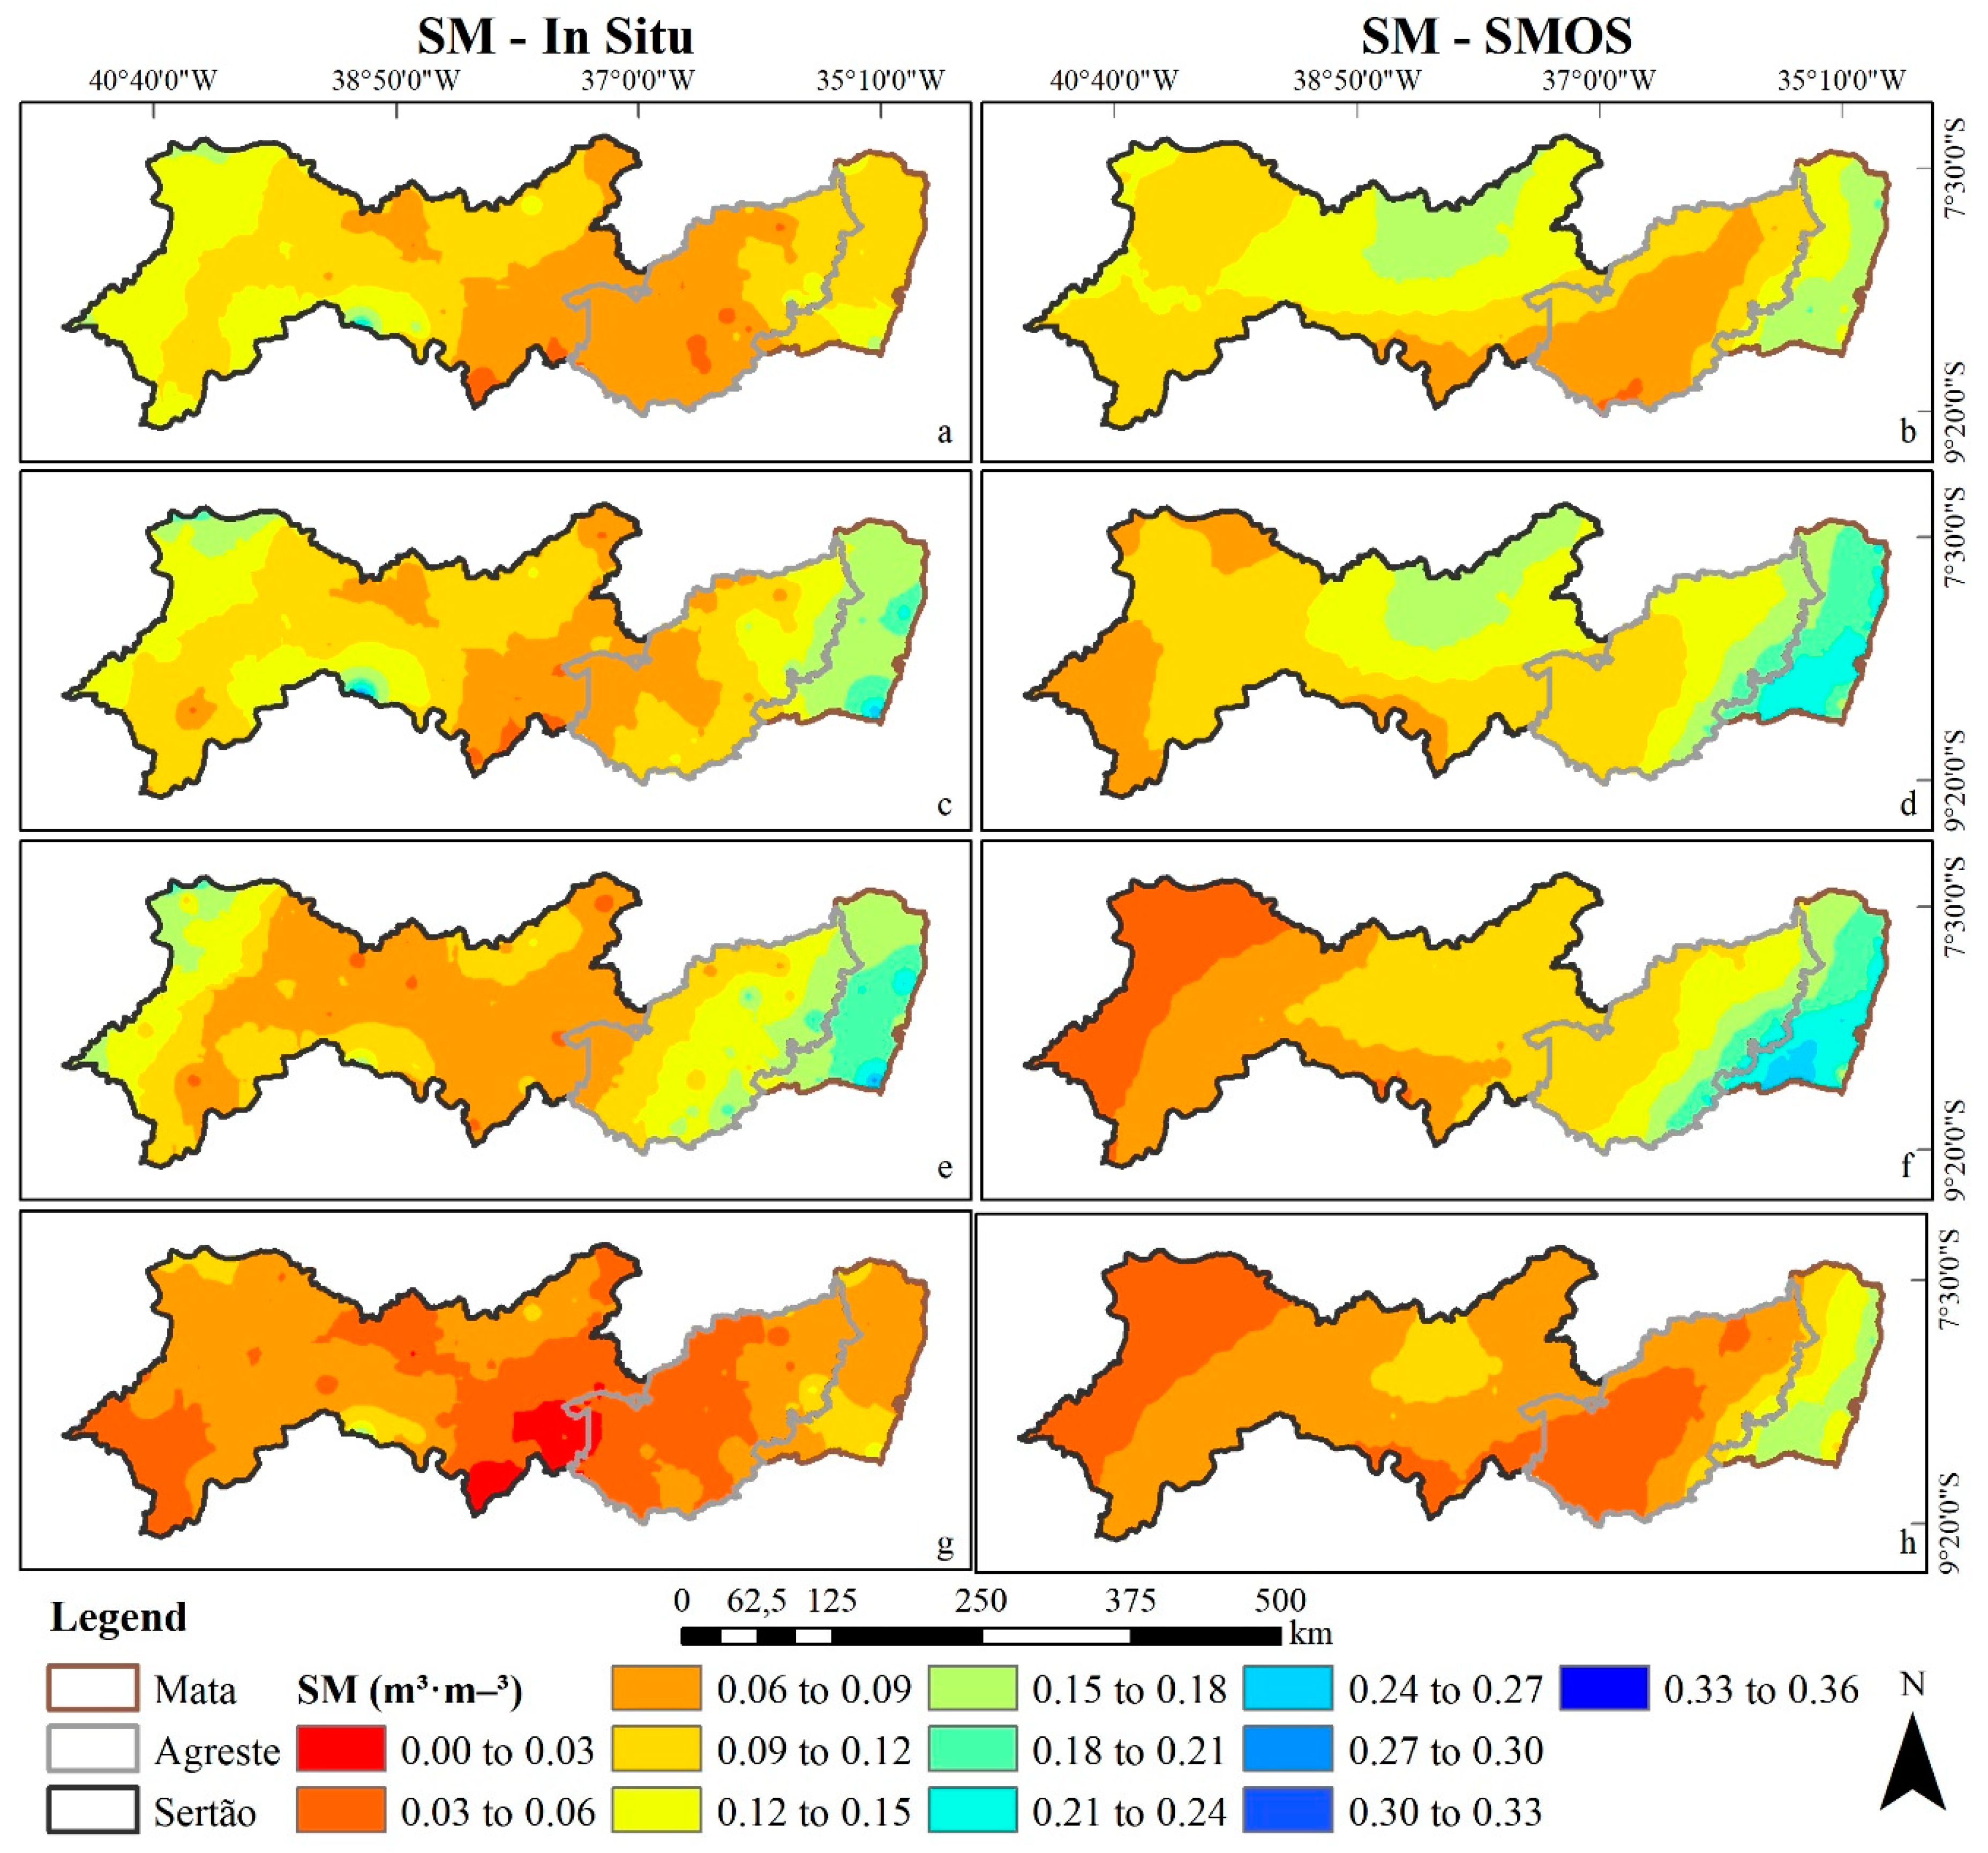
3.1. Pixel Assessment

The territory of Pernambuco State is covered by 169 pixels on the SMOS grid. Twelve pixels were identified for each APAC station, with six stations covering the Mata region, four in the Agreste, and two in the Sertão regions. The best result was observed for the station at Águas Belas, where the satellite data showed the same tendency as the in situ data. The result is presented in Figure 3a for the daily time interval and in Figure 3c for the eight-day interval. This station performed well for all criteria, especially for the eight-day time interval. The Pearson’s r was strongly correlated in both time intervals (0.782 and 0.821 for daily and eight-day, respectively) and the Willmott index changed from 0.867 for the daily data to 0.951 for the eight-day interval. Figure 3b,d show that the plot of the time series in the ordered pair system is close to the 1:1 line, corroborating the high correlation.
Figure 4 summarizes the results of the criteria for all stations (CEMADEN and APAC) in terms of frequency of occurrence. Considering the 12 APAC stations, the criteria values improved using the eight-day time interval in comparison to daily data. The performance of the criteria for the eight-day interval varied between weak (0.20–0.39) to strong (0.70–0.89) for Pearson’s r with prevalence toward strong classification (50% of the stations). The moderate classification was observed at 25% of the stations. The Willmott index classification showed values between 0.7 and 1.0 in 41.7% of the stations and prevalence of the interval 0.4–0.69 (50% of the cases) (Figure 4a,b). Approximately 34% of the APAC stations presented BIAS for the daily data between 0.00 and 0.02 m3·m−3, whereas the eight-day average had the highest percentage (25%), between 0.04 and 0.06 m3·m−3. In both time intervals, the prevalence was a positive BIAS, 75% (daily) and 66.7% (eight-day), which indicates trending toward overestimation of satellite data (Figure 4c). The RMSD for both time intervals exhibited values higher than 0.10 m3·m−3 for four stations. Three of these stations are located near the coast, where the data correlation was the lowest. Conversely, four stations with a RMSD between 0.02 and 0.06 m3·m−3 were located in the semiarid region (Figure 4d).
All CEMADEN stations considered in the analysis were located in semiarid land (53% in the Agreste region and 47% in the Sertão region). The SMOS data fit well to in situ data for both daily (Figure 5) and the eight-day (Figure 6) time intervals. The figures also show that satellite soil moisture responded well to precipitation events. Some of CEMADEN’s stations had many missing soil moisture values with long periods without any record, as can be seen in the Altinho (Figure 5a and Figure 6a) and Canhotinho stations (Figure 5c and Figure 6c). Regardless, data from both the Altinho and Canhotinho stations were closely correlated to the satellite data. As verified with the APAC stations, the eight-day time series correlated better than the daily interval.
The Pearson’s r from the 52 CEMADEN stations inside the territory of Pernambuco provided the following results: 53.8% classified as moderate (0.40–0.69) correlation and 42.3% as strong correlation for the daily time interval data. For the eight-day interval, 75.0% of the stations were strongly (0.70–0.89) and very strongly (0.9–1.0) correlated and 25.0% were classified as moderate. Similar values were verified for the Willmott index. Using the daily time series, 57.7% of the stations had a correlation between 0.4 and 0.69 and 34.6% between 0.7 and 1.0. For the eight-day interval, 50.0% of the stations exhibited values between 0.7 and 1.0, and in 46.2% of the stations, the correlation varied between 0.4 and 0.69 (Figure 4a,b). The calculation of the BIAS with CEMADEN data showed that 55.8% of the stations had positive values in both time intervals. A large proportion of the stations had RMSD values within 0.04–0.06 m3·m−3: 40.4% for daily and 48.1% for the eight-day time interval.
In nine pixels of the SMOS data, two stations were available. In those cases, the comparison was performed with the average of the in situ data. Table 1 shows the statistical criteria for these cases. As was verified, a strong correlation was prevalent. This is particularly relevant considering that the in situ data is more precise when it is calculated with two stations.

3.2. Areal Average Assessment

The average soil moisture estimate in the three regions displayed in Figure 2 was obtained considering 169 pixels covering the Pernambuco State territory. Equation (5) was applied with data from the in situ stations and from SMOS. Figure 7 shows the results of the statistical criteria applied in the areal assessment. Similar to the per pixel analysis, the Sertão and Agreste regions presented better results than the Mata region. In the semiarid land (Sertão and Agreste), the Pearson’s r was strong or very strong and the lower value of the Willmott index was 0.84, whereas near the coast (Mata), the Pearson’s r was moderate and the lowest Willmott index was 0.63. The BIAS statistics were positive for all regions and time intervals with values varying between 0.0 and 0.02 m3·m−3. The RMSD values exhibited distinct results for daily (0.02–0.06 m3·m−3) and eight-day intervals (0.02–0.04 m3·m−3).
The areal assessment allowed for the visualization of the spatial distribution of the soil moisture. Figure 8 shows the in situ and SMOS data distribution after application of the IDW method considering the study area as well as the four seasons: January-February-March (JFM), April-May-June (AMJ), July-August-September (JAS), and October-November-December (OND). The SMOS data were able to accurately represent the soil moisture spatial distribution in all seasons. The rainfall season in semiarid region usually occurs in the period of January–March, while it occurs between April and August in the Mata region near the coast. The major differences between in situ and SMOS soil moisture maps may be attributed to the distinct spatial resolutions. The low values for soil moisture in the semiarid region are related to the lingering period of precipitation below the historical average for the time period used for validation (2015–2017).

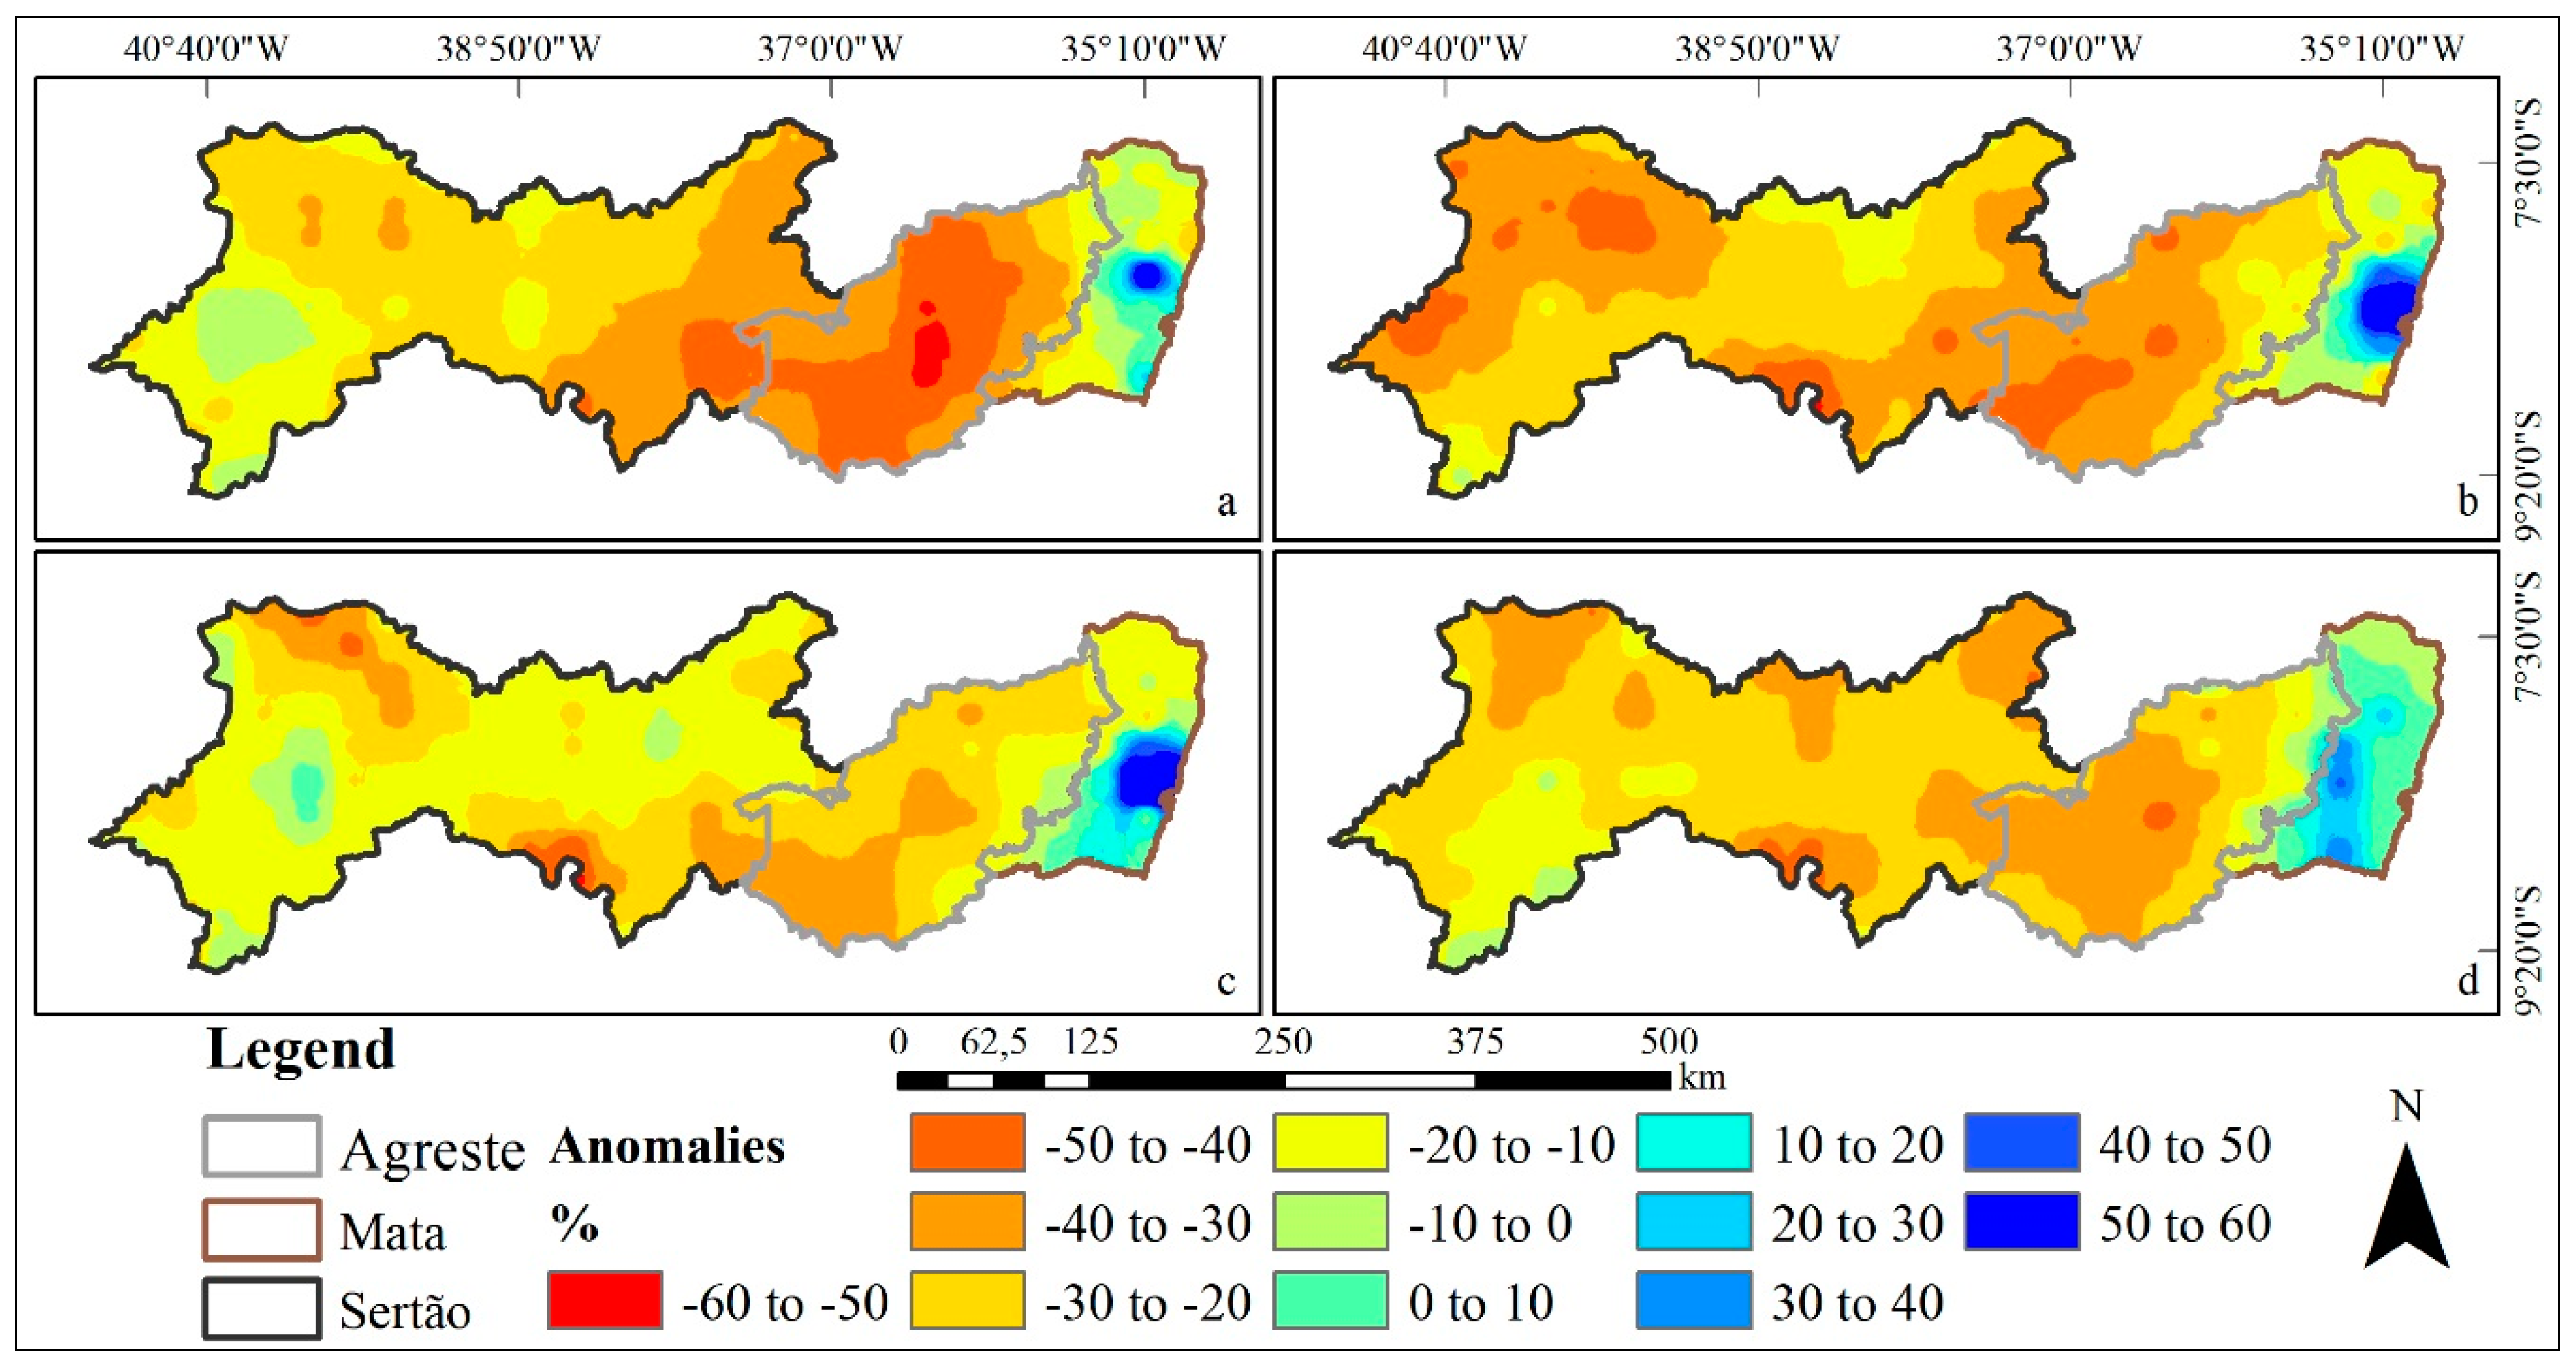
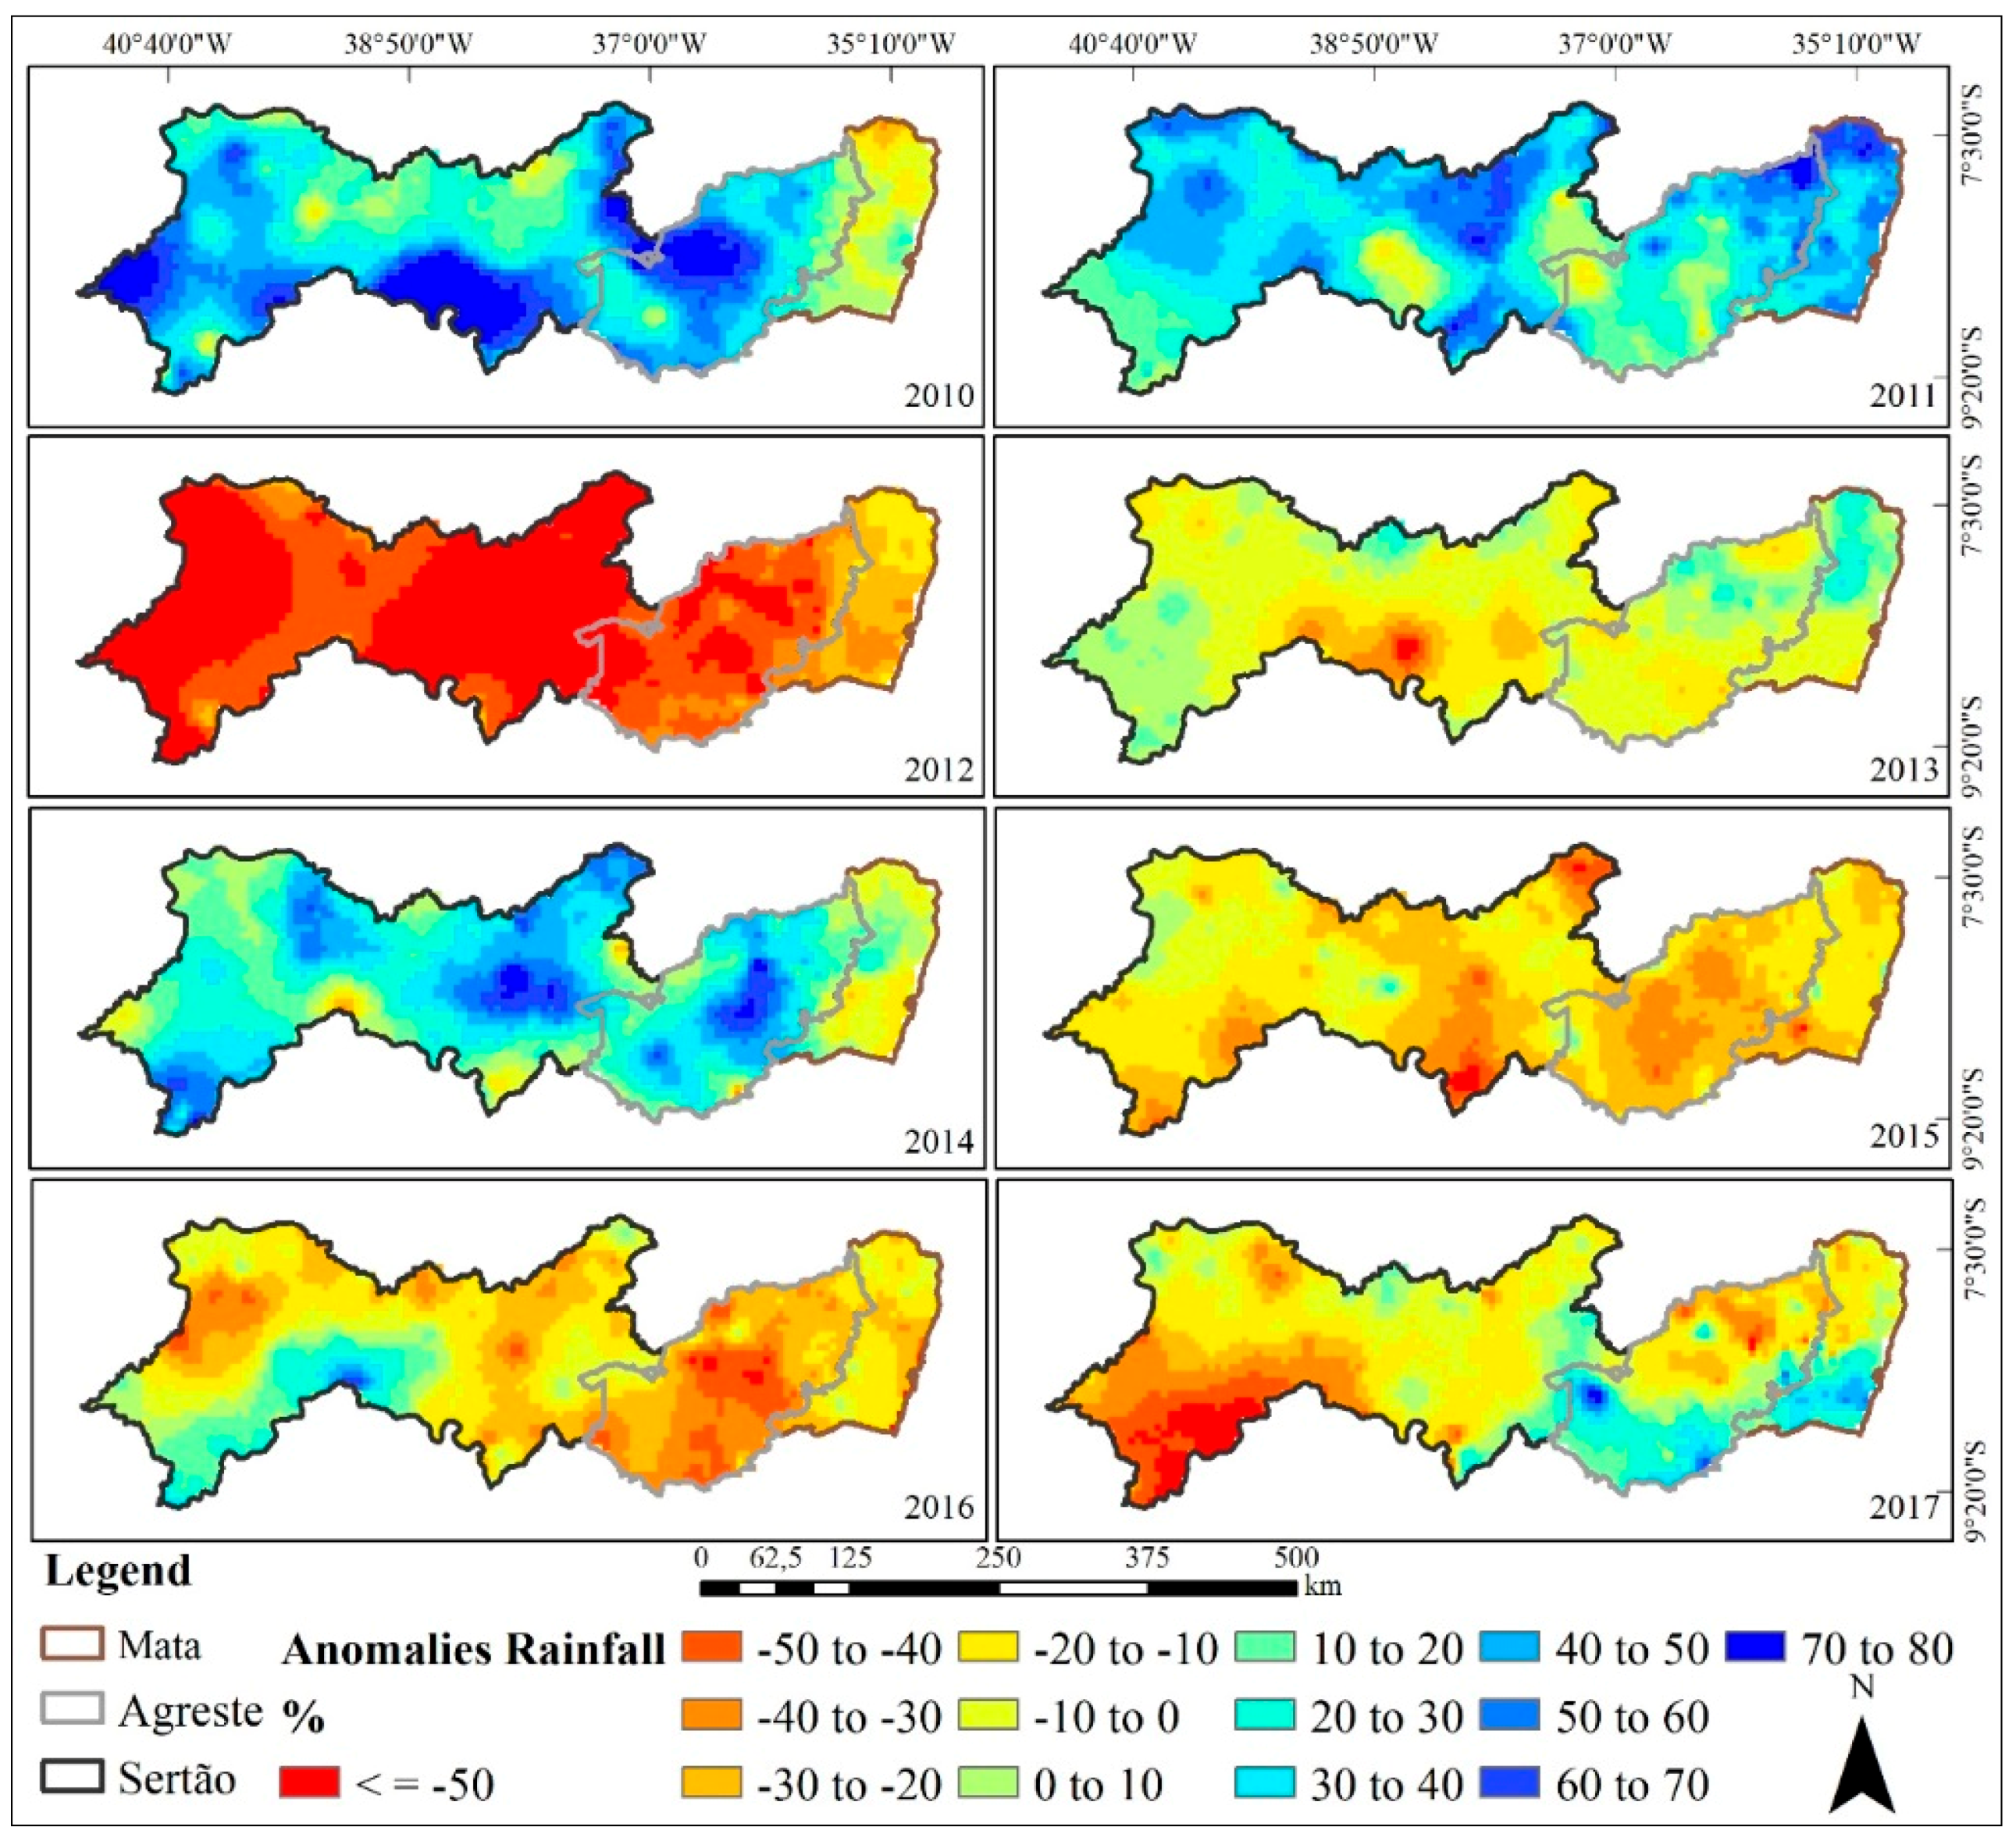
3.3. Soil Moisture Anomaly

Since 2012, the study area has been impacted by a lingering drought with environmental, social, and economic consequences. The period between 2012 and 2017 has been considered one of the most severe droughts ever registered in terms of precipitation in Northeast Brazil [31]. The use of SMOS data allowed us to assess the impact of the low precipitation on the soil moisture in Pernambuco State. Ideally, the drought period should be compared over as long a time period as possible. However, due to the beginning of the SMOS operation in 2010, the reference period was limited to 2010–2011. An analysis using precipitation series showed that the total annual precipitation in 2010 and 2011 may be considered near the historical average. The soil moisture anomaly was calculated in terms of percentage, in which a negative value means that the period 2012–2017 was drier than 2010–2011. Large areas of the Pernambuco State were impacted by the drought period, as can be seen in Figure 9, with emphasis on the semiarid land in the Sertão and Agreste mesoregions. Some parts of the study area exhibited negative anomalies close to 50% during the rainy season for both JFM and AMJ.
Another analysis method involved calculating the anomaly of each year in relation to the entire period. As can be seen in Figure 10, the wetter years were 2010 and 2011 in the semiarid region (Sertão and Agreste). For the Mata region (near the coast), 2017 was the wettest year. The driest year for all regions was 2012, where the anomaly values were about −50% in the Agreste and Mata regions. Similar behavior was observed by analyzing the precipitation anomaly for the same period (Figure 11). However, in the case of precipitation, the anomaly values were more noticeable than soil moisture.
This drought event has been studied by many authors. The year 2012 was identified as the most severe for the period, followed by the biennial 2015–2017 [7,31,36,42]. Brito et al. [43] highlighted the intensity of the droughts during the period of 1981 to 2016, including its severity, frequency, and duration, and considering hydrometeorological and agricultural aspects. The most severe and prolonged five-year period of drought occurred between 2011 and 2016.

4. Discussion

The performance of the SMOS data varied according to the climate characteristics of the study area. The APAC network has six stations located in the Mata region (humid tropical climate) and six in the semiarid region. The correlations of the Pearson’s r in the Mata region varied from very weak to moderate with daily data, and from moderate to strong for eight-day data. The Willmott index varied between 0.36 and 0.69, and 0.42 and 0.71 for the one-day and eight-day data, respectively. In the six stations located in the semiarid region, the Pearson’s r varied from moderate to strong correlations for the daily time interval and moderate to strong correlations for the eight-day time interval (five stations with strong correlation). For the Willmott index, the correlations varied from 0.51 and 0.86 with the daily time intervals to 0.52 and 0.95 with the eight-day time interval (four stations between 0.83 and 0.95). The SMOS data exhibited the strongest correlations with the CEMADEN network because all stations were located in the semiarid region. The assessment based on the areal average also showed that the stations located in the semiarid region performed the best. The correlations varied from strong to very strong in both time intervals. Considering the three regions, Agreste had the best correlation values. The Student’s t test was applied to all correlations to verify if the results were statistically significant. The results showed that SMOS and in situ data had a statistically significant correlation with just one exception. The station with the lowest number of samples for the eight-day interval (n = 11) had a p-value greater than 0.05.
Despite the difference in performance, the SMOS satellite was able to satisfactorily capture the time variation in the in situ data in both dry and wet regions, accurately capturing the seasonality due to the rainfall [44]. The SMOS soil moisture product supplied consistent results for all surfaces varying from very dry to wet. Similar performance was observed by Molero et al. [2], for which the best agreement between SMOS and the in situ data were obtained for a semiarid region. Other studies also reported better results for validating soil moisture remote sensing in semiarid land in comparison to temperate regions [45,46]. The validation of SMOS data accomplished by Molero et al. [2] was completed in four study areas with different climate characteristics. These data were processed by the DISaggregation based on Physical and Theoretical scale Change (DISPATCH) algorithm, which generates soil moisture data with a resolution of 1 km. The results showed that the product improved the space-time correlation with in situ measurements for semiarid regions with considerable soil moisture space variability due to precipitation and irrigation. In subhumid regions, the performance of the algorithm was poor, except in summer, for which the results were better.
The set of BIAS calculated presented positive and negative values. The results were mainly positive, which reveals a slight overestimation of the SMOS data in relation to both observation networks for areal average and pixel-station validations. In the latter, both networks had a BIAS that was more than 50% positive, and the overestimation was more evident when satellite data were validated with the APAC stations, for which 75% of the daily data had a positive BIAS and 66.7% for the eight-day average. The stations were located on terrain with a slope varying between 0% and 20%. The 0–3% slope interval (comprising 25 stations) tended to present a proportion of positive bias greater than the overall proportion, representing a positive bias in 76% of the stations and negative bias in 24% of the stations. The 3–8% interval (31 stations) had a proportion near the overall value (58% positive and 42% negative). Finally, the 8–20% interval (eight stations) presented a positive bias lower than the overall proportion (12.5% positive and 87.5% negative). Underestimation was identified by some authors during the validation procedures [1,6,24,44,47,48]. He et al. [49] verified that the sun-glint, which is the reflected solar radiation from the land surface near the specular direction, can affect the brightness temperature by increasing emissivity and decreasing soil moisture, which result in negative BIAS. The sun-glint is stronger for greater terrain slopes, lower solar incidence angles, and over wetter soils. The method developed by He et al. [49] showed that the inclusion of the terrain slope will result in stronger sun-glint for the SMAP radiometer, which means greater brightness temperature and, consequently, lower soil moisture.
The average RMSD calculated with daily time series in the pixel and areal assessment was 0.071 m3·m−3 and 0.04 m3·m−3, respectively. These values are near to the expected 0.04 m3·m−3 accuracy of the MIRAS-SMOS sensor. The RMSD was particularly low in the areal average for the Sertão (0.025 m3·m−3) and Agreste (0.033 m3·m−3) regions.
Some of CEMADEN’s stations presented inferior performance during the dry period, as shown in Figure 5 and Figure 6. González-Zamora et al. [6] observed underestimation of the SMOS data particularly in the dry periods, but this behavior has not yet been well characterized or understood.

5. Conclusions

The statistical criteria values showed that SMOS data fit the in situ data well. Both the pixel and areal assessments had RMSD values around the expected accuracy of the MIRAS sensor. Similar to other validation studies, better results were observed in the semiarid part of the study area. In general terms, the behavior of soil moisture satellite and in situ agreed, despite the slight overestimation verified in the assessment.
The assessment presented in this paper is one of the first accomplished in South America in an area the size of the state of Pernambuco. Another particular aspect of this study is the evaluation of the SMOS data in terms of areal average. The satisfactory results are relevant for their application to large areas for drought monitoring, as Northeast Brazil is almost 1 million km2.
The results obtained with the validation of the SMOS data in Pernambuco State encourage its use in other applications. The drought period showed the need for maintaining regular monitoring of the hydrological and climate variables related to this phenomenon. Soil moisture data from satellites can be used together with other data, such as precipitation, streamflow, and water storage in reservoirs to better characterize the state of drought over a period of time. This may be particularly relevant for planning in agriculture and supporting decision makers and farmers. One future application will be for the calculation of a drought index to monitor potential impacts for water resources and agriculture in Northeast Brazil. The application of the SMOS data can be extended to the entire Northeast of Brazil, which has been impacted by a long period of drought. The climate characteristics of Pernambuco State are similar to those for the entire Northeast.

Supplementary Materials

The following are available online at https://www.mdpi.com/2072-4292/10/8/1314/s1, Figure S1: Soil moisture spatial distribution with in situ and SMOS data for the January–February–March (JFM) season. The numbers indicate the soil moisture at the samples, Figure S2: Soil moisture spatial distribution with in situ and SMOS data for the April–May–June (AMJ) season. The numbers indicate the soil moisture at the samples, Figure S3: Soil moisture spatial distribution with in situ and SMOS data for the July–August–September (JAS) season. The numbers indicate the soil moisture at the samples, Figure S4: Soil moisture spatial distribution with in situ and SMOS data for the October–November–December (OND) season. The numbers indicate the soil moisture at the samples.

Author Contributions

Conceptualization, A.G.S.S.S., A.R.N. and L.R.; Data curation, A.G.S.S.S, A.R.N., L.R., R.C.S.A. and L.L.S.; Formal analysis, A.G.S.S.S., A.R.N., L.R., R.C.S.A. and L.L.S.; Funding acquisition, A.R.N.; Methodology, A.G.S.S.S., A.R.N., L.R. and R.C.S.A.; Project administration, A.R.N.; Validation, A.G.S.S.S., A.R.N. and L.L.S.; Writing—original draft, A.G.S.S.S. and A.R.N.; Writing—review and editing, A.G.S.S.S., A.R.N. and R.C.S.A.

Funding

This research received fund from the U.S. National Science Foundation (Grant GEO-1128040) and the program CAPES/ANA call 19/2015 (Grant 88887.115873/2015-01).

Acknowledgments

This paper is partially supported by a grant from the Inter-American Institute for Global Change Research (IAI) CRN3056, which was supported by the U.S. National Science Foundation (Grant GEO-1128040); the program CAPES/ANA call 19/2015 (Grant 88887.115873/2015-01); and the Brazilian Research Network on Global Climate Change FINEP/Rede CLIMA (Grant 01.13.0353-00). The Coordination for the Improvement of Higher Education Personnel (CAPES) granted a PhD scholarship for the first author. The authors also acknowledge APAC (Water and Climate Pernambuco State Agency) and CEMADEN (National Center for Monitoring and Early Warning of Natural Disasters) for making their soil moisture database available.

Conflicts of Interest

The authors declare no conflict of interest.

References

  1. Martínez-Fernández, J.; González-Zamora, A.; Sánchez, N.; Gumuzzio, A.; Jiménez, C.M.H. Satellite soil moisture for agricultural drought monitoring: Assessment of the SMOS derived Soil Water Deficit Index. Remote Sens. Environ. 2016, 177, 277–286. [Google Scholar] [CrossRef]
  2. Molero, B.; Merlina, O.; Malbéteaua, Y.; Al Bitar, A.; Cabot, F.; Stefan, V.; Kerr, Y.; Bacona, S.; Cosh, M.H.; Bindlish, R.; et al. SMOS disaggregated soil moisture product at 1 km resolution: Processor overview and first validation results. Remote Sens. Environ. 2016, 180, 361–376. [Google Scholar] [CrossRef]
  3. Zhan, Z.; Qin, Q.; Wang, X. The application of LST/NDVI index for monitoring land surface moisture in semiarid area. IEEE Trans. Geosci. Remote Sens. 2004, 3, 1551–1554. [Google Scholar] [CrossRef]
  4. Kerr, Y.H. Soil moisture from space: Where are we? Hydrogeol. J. 2007, 15, 117–120. [Google Scholar] [CrossRef]
  5. Scaini, A.; Sánchez, N.; Vicente-Serrano, S.M.; Martinez-Fernandez, J. SMOS-derived Soil Moisture and drought indices: A comparative analysis using in situ measurements. Hydrol. Process. 2015, 29, 373–383. [Google Scholar] [CrossRef]
  6. González-Zamora, A.; Sánchez, N.; Martínez-Fernández, J.; Gumuzzio, A.; Piles, M.; Olmedo, E. Long-term SMOS soil moisture products: A comprehensive evaluation across scales and methods in the Duero Basin (Spain). Phys. Chem. Earth 2015, 83–84, 123–136. [Google Scholar] [CrossRef]
  7. Rossato, L.; Alvalá, R.C.S.; Marengo, J.A.; Zeri, M.; Cunha, A.P.M.A.; Pires, L.B.M.; Barbosa, H.A. Impact of soil moisture on crop yields over Brazilian semiarid. Front. Environ. Sci. 2017, 5, 1–16. [Google Scholar] [CrossRef]
  8. Chakrabarti, S.; Bongiovanni, T.; Judge, J.; Zotarelli, L.; Bayer, C. Assimilation of SMOS soil moisture for quantifying drought impacts on crop yield in agricultural regions. IEEE J. Sel. Top. Appl. Earth Obs. Remote Sens. 2014, 7, 3867–3879. [Google Scholar] [CrossRef]
  9. Petropoulos, G.P.; Srivastava, P.K.; Piles, M.; Pearson, S. Earth observation-based operational estimation of soil moisture and evapotranspiration for agricultural crops in support of sustainable water management. Sustainability 2018, 10, 181. [Google Scholar] [CrossRef]
  10. Rossato, L.; de Jeu, R.; Alvalá, R.C.D.S.; Souza, S. Evaluation of soil moisture from satellite observations over South America. Int. J. Remote Sens. 2011, 32, 8013–8031. [Google Scholar] [CrossRef] [Green Version]
  11. Vall-llossera, M.; Duffo, N.; Camps, A.; Corbella, I.; Torres, F.; Bará, J. Reliability analysis in aperture synthesis interferometric radiometers: Application to L band Microwave Imaging Radiometer with Aperture Synthesis instrument. Radio Sci. 2001, 36, 107–117. [Google Scholar] [CrossRef]
  12. Liu, L.; Liao, J.; Chen, X.; Zhou, G.; Su, Y.; Xiang, Z.; Wang, Z.; Liu, X.; Li, Y.; Wu, J.; et al. The Microwave Temperature Vegetation Drought Index (MTVDI) based on AMSR-E brightness temperatures for long-term drought assessment across China (2003–2010). Remote Sens. Environ. 2017, 199, 302–320. [Google Scholar] [CrossRef]
  13. Kerr, Y.; Waldteufel, P.; Wigneron, J.P.; Delwart, S.; Cabot, F.; Boutin, J.; Escorihuela, M.J.; Font, J.; Reul, N.; Gruhier, C.; et al. The SMOS mission: New tool for monitoring key elements of the global water cycle. Proc. IEEE 2010, 98, 666–687. [Google Scholar] [CrossRef] [Green Version]
  14. Panciera, R.; Walker, J.P.; Jackson, T.J.; Ryu, D.; Gray, D.; Monerris, A.; Yardley, H.; Tanase, M.; Rüdiger, C.; Wu, X.; et al. The Soil Moisture Active Passive Experiments (SMAPEx): Towards Soil Moisture Retrieval from the SMAP Mission. IEEE Trans. Geosci. Remote Sens. 2014, 52, 490–507. [Google Scholar] [CrossRef]
  15. Vittucci, C.; Guerriero, L.; Ferrazzoli, P.; Rahmoune, R.; Tanase, M.; Panciera, R.; Walker, J.P. Airborne forest monitoring during SMAPEx-3 campaign. In Proceedings of the 2013 IEEE International Geoscience and Remote Sensing Symposium—IGARSS, Melbourne, Australia, 21–26 July 2013; pp. 987–990. [Google Scholar]
  16. Vittucci, C.; Ferrazzoli, P.; Kerr, Y.; Richaume, P.; Guerriero, L.; Vaglio Laurin, G. SMOS retrieval over forests: Exploitation of optical depth and tests of soil moisture estimates. Remote Sens. Environ. 2016, 180, 115–127. [Google Scholar] [CrossRef]
  17. Louvet, S.; Pellarin, T.; Al Bitar, A.; Cappelaere, B.; Galle, S.; Grippa, M.; Gruhier, C.; Kerr, Y.; Lebel, T.; Mialon, A.; et al. SMOS soil moisture product evaluation over West-Africa from local to regional scale. Remote Sens. Environ. 2015, 156, 383–394. [Google Scholar] [CrossRef]
  18. Piles, M.; Sánchez, N.; Vall-llossera, M.; Camps, A.; Martínez-Fernández, J.; Martínez, J.; González-Gambau, V. A dowscaling approach for SMOS land observations: Evaluation of high resolution soil moisture maps over the Iberian Peninsula. IEEE J. Sel. Top. Appl. Earth Obs. Remote Sens. 2014, 7, 3845–3857. [Google Scholar] [CrossRef]
  19. SMOS-BEC Team; Soil Moisture and Ocean Salinity—Barcelona Expert Center. SMOS-BEC Ocean and Land Products Description; Version 1.5; Barcelona Expert Center: Barcelona, Spain, 2016; p. 23. [Google Scholar]
  20. Loew, A.; Schlenz, F. A dynamic approach for evaluating coarse scale satellite soil moisture products. Hydrol. Earth Syst. Sci. 2011, 15, 75–90. [Google Scholar] [CrossRef] [Green Version]
  21. Petropoulos, G.P.; McCalmont, J.P. An Operational In Situ Soil Moisture & Soil Temperature Monitoring Network for West Wales, UK: The WSMN Network. Sensors 2017, 17, 1481. [Google Scholar] [CrossRef]
  22. Ochsner, T.E.; Cosh, M.H.; Cuenca, R.H.; Dorigo, W.A.; Draper, C.S.; Hagimoto, Y.; Kerr, Y.H.; Larson, K.M.; Njoku, E.G.; Small, E.E.; et al. State of the art in large-scale soil moisture monitoring. Soil Sci. Soc. Am. J. 2013, 77, 1888–1919. [Google Scholar] [CrossRef] [Green Version]
  23. Crow, W.T.; Berg, A.A.; Cosh, M.H.; Loew, A.; Mohanty, B.P.; Panciera, R.; de Rosnay, P.; Ryu, D.; Walker, J.P. Upscaling sparse ground-based soil moisture observations for the validation of coarse-resolution satellite soil moisture products. Rev. Geophys. 2012, 50, 1–20. [Google Scholar] [CrossRef]
  24. Sanchez, N.; Martinez-Fernandez, J.; Scaini, A.; Perez-Gutierrez, C. Validation of the SMOS L2 soil moisture data in the REMEDHUS Network (Spain). IEEE Trans. Geosci. Remote Sens. 2012, 50, 1602–1611. [Google Scholar] [CrossRef]
  25. Xie, X.M.; Xu, J.W.; Zhao, J.F.; Liu, S.; Wang, P. Validation of AMSR-E soil moisture retrievals over Huaihe River basin, in China. Appl. Mech. Mater. 2014, 507, 855–858. [Google Scholar] [CrossRef]
  26. Chan, S.K.; Bindlish, R.; O’Neill, P.; Jackson, T.; Njoku, E.; Dunbar, S.; Chaubell, J.; Piepmeier, J.; Yueh, S.; Entekhabi, D.; et al. Development and assessment of the SMAP enhanced passive soil moisture product. Remote Sens. Environ. 2018, 204, 931–941. [Google Scholar] [CrossRef]
  27. Cai, X.; Pan, M.; Chaney, N.W.; Colliander, A.; Misra, S.; Cosh, M.H.; Crow, W.T.; Jackson, T.J.; Wood, E.F. Validation of SMAP soil moisture for the SMAPVEX15 field campaign using a hyper-resolution model. Water Resour. Res. 2017, 53, 3013–3028. [Google Scholar] [CrossRef]
  28. Shellito, P.J.; Small, E.E.; Colliander, A.; Bindlish, R.; Cosh, M.H.; Berg, A.A.; Bosch, D.D.; Caldwell, T.G.; Goodrich, D.C.; McNairn, H.; et al. SMAP soil moisture drying more rapid than observed in situ following rainfall events. Geophys. Res. Lett. 2016, 43, 8068–8075. [Google Scholar] [CrossRef] [Green Version]
  29. Jackson, T.J.; Bindlish, R.; Cosh, M.H.; Zhao, T.; Starks, P.J.; Bosch, D.D.; Seyfried, M.; Moran, M.S.; Goodrich, D.C.; Kerr, Y.H.; et al. Validation of soil moisture and Ocean Salinity (SMOS) soil moisture over watershed networks in the U.S. IEEE Trans. Geosci. Remote Sens. 2012, 50, 1530–1543. [Google Scholar] [CrossRef] [Green Version]
  30. Sánchez, N.; González-Zamora, A.; Piles, M.; Martínez-Fernández, J.A. New Soil Moisture Agricultural Drought Index (SMADI) Integrating MODIS and SMOS Products: A Case of Study over the Iberian Peninsula. Remote Sens. 2016, 8, 287. [Google Scholar] [CrossRef]
  31. Marengo, J.A.; Torres, R.R.; Alves, L.M. Drought in Northeast Brazil—Past, present, and future. Theor. Appl. Clim. 2017, 129, 1189–1200. [Google Scholar] [CrossRef]
  32. Alvalá, R.C.S.; Cunha, A.P.M.A.; Brito, S.S.B.; Seluchi, M.E.; Marengo, J.A.; Moraes, O.L.L.; Carvalho, M.A. Drought monitoring in the Brazilian semiarid region. Anais da Academia Brasileira de Ciências 2017. [Google Scholar] [CrossRef]
  33. Vieira, R.M.S.P.; Cunha, A.P.M.A.; Alvalá, R.C.S.; Carvalho, V.C.; Ferraz Neto, S.; Sestini, M.F. Land use and land cover map of a semiarid region of Brazil for meteorological and climatic models. Braz. J. Meteorol. 2013, 28, 129–138. [Google Scholar] [CrossRef]
  34. CONDEPE/FIDEM. Bacia Hidrográfica do Rio Una, GL4 e GL5. Série Bacias Hidrográficas de Pernambuco 2006, 3, 85. [Google Scholar]
  35. Sobel, T.F.; Muniz, A.L.P.; de Costa, E.F. Divisão regional do desenvolvimento humano em Pernambuco: Uma aplicação da análise de cluster. Teoria e Evidência Econômica-Ano 2009, 15, 37–62. [Google Scholar]
  36. Cunha, A.P.M.A; Brito, S.S.B.; Alvalá, R.C.S.; Carvalho, M.A.; Zeri, M.; Vieira, R.M.S.P.; Rossato, L.; Maciel, A.P.R.; Andrade, E.S. Avaliação de indicador para o monitoramento dos impactos da seca em áreas de pastagens no semiárido do Brasil. Revista Brasileira de Cartografia 2017, 69, 89–106. [Google Scholar]
  37. Escorihuela, M.J.; Chanzy, A.; Wigneron, J.P.; Kerr, Y.H. Effective soil moisture sampling depth of L-band radiometry: A case study. Remote Sens. Environ. 2010, 114, 995–1001. [Google Scholar] [CrossRef] [Green Version]
  38. Albergel, C.; de Rosnay, P.; Gruhier, C.; Muñoz-Sabater, J.; Hasenauer, S.; Isaksen, L.; Kerr, Y.; Wagner, W. Evaluation of remotely sensed and modelled soil moisture products using global ground-based in situ observations. Remote Sens. Environ. 2012, 118, 215–226. [Google Scholar] [CrossRef]
  39. Jackson, T.J.; Cosh, M.H.; Zhan, X.; Bosch, D.D.; Seyfried, M.S.; Starks, P.J.; Keefer, T.; Lakshmi, V. Validation of AMSR-E soil moisture products using watershed networks. In Proceedings of the 2006 IEEE International Symposium on Geoscience and Remote Sensing, Denver, CO, USA, 31 July–4 August 2006; pp. 432–435. [Google Scholar]
  40. Perry, M.A.; Niemann, J.D. Generation of soil moisture patterns at the catchment scale by EOF interpolation. Hydrol. Earth Syst. Sci. 2008, 12, 39–53. [Google Scholar] [CrossRef] [Green Version]
  41. Chen, H.; Wu, W.; Liu, H.B. Comparison of spatial interpolation methods for soil moisture and its application for monitoring drought. Environ. Monit. Assess. 2017, 189, 525. [Google Scholar] [CrossRef] [PubMed]
  42. Marengo, J.A.; Alves, L.M.; Alvalá, R.C.S.; Cunha, A.P.M.A.; Brito, S.; Moraes, O.L.L. Climatic characteristics of the 2010–2016 drought in the semiarid Northeast Brazil region. Anais da Academia Brasileira de Ciências 2017. [Google Scholar] [CrossRef] [PubMed]
  43. Brito, S.S.B.; Cunha, A.P.M.A.; Cunningham, C.C.; Alvalá, R.C.S.; Marengo, J.A.; Carvalho, M.A. Frequency, duration and severity of drought in the Semiarid Northeast Brazil region. Int. J. Climatol. 2017, 38, 517–529. [Google Scholar] [CrossRef]
  44. Kerr, Y.H.; Al-Yaari, A.; Rodriguez-Fernandez, N.; Parrens, M.; Molero, B.; Lerouxc, D.; Bircher, S.; Mahmoodi, A.; Mialona, A.; Richaume, P.; et al. Overview of SMOS performance in terms of global soil moisture monitoring after six years in operation. Remote Sens. Environ. 2016, 180, 40–63. [Google Scholar] [CrossRef]
  45. Malbéteau, Y.; Merlin, O.; Molero, B.; Rüdiger, C.; Bacon, S. DisPATCh as a tool to evaluate coarse-scale remotely sensed soil moisture using localized in situ measurements: Application to SMOS and AMSR-E data in Southeastern Australia. IEEE J. Sel. Top. Appl. Earth Obs. Remote Sens. 2016, 45, 221–234. [Google Scholar] [CrossRef]
  46. Merlin, O.; Rüdiger, C.; Al Bitar, A.; Richaume, P.; Walker, J.P.; Kerr, Y.H. Disaggregation of SMOS soil moisture in Southeastern Australia. IEEE Trans. Geosci. Remote Sens. 2012, 50, 1556–1571. [Google Scholar] [CrossRef] [Green Version]
  47. Al Bitar, A.; Leroux, D.; Kerr, Y.H.; Merlin, O.; Richaume, P.; Sahoo, A.; Wood, E.F. Evaluation of SMOS soil moisture products over continental U.S. using the SCAN/SNOTEL network. IEEE Trans. Geosci. Remote Sens. 2012, 50, 1572–1586. [Google Scholar] [CrossRef] [Green Version]
  48. Lacava, T.; Matgen, P.; Brocca, L.; Bittelli, M.; Pergola, N.; Moramarco, T.; Tramutoli, V. A first assessment of the SMOS soil moisture product with in situ and modeled data in Italy and Luxembourg. IEEE Trans. Geosci. Remote Sens. 2012, 50, 1612–1622. [Google Scholar] [CrossRef]
  49. He, L.; Chen, J.M.; Chen, K.S. Simulation and SMAP Observation of Sun-Glint Over the Land Surface at the L-Band. IEEE Trans. Geosci. Remote Sens. 2017, 55, 2589–2604. [Google Scholar] [CrossRef]
Figure 1. Location of Pernambuco State and its mesoregions.
Remotesensing 10 01314 g001
Figure 2. Spatial distribution of soil moisture stations in Pernambuco state and the grid of the Soil Moisture Ocean Salinity (SMOS) satellite.
Remotesensing 10 01314 g002
Figure 3. Águas Belas station (Water and Climate Pernambuco State Agency (APAC)): (a) daily time interval and (c) eight-day time interval. Scatter plot of the SMOS and in situ data for the (b) daily interval and (d) eight-day interval. SM = soil moisture. RMSD = root mean squared difference.
Remotesensing 10 01314 g003
Figure 4. Frequency of occurrence of (a) Pearson’s r (r), (b) Willmott index (d), (c) BIAS, and (d) RMSD. CEMADEN = National Center for Monitoring and Early Warning of Natural Disasters.
Remotesensing 10 01314 g004
Figure 5. Daily soil moisture from CEMADEN stations, SMOS data, and measured precipitation during the period of July 2015 to July 2017. Each graph refers to a station.
Remotesensing 10 01314 g005
Figure 6. Eight-day average soil moisture from CEMADEN stations, SMOS data, and measured precipitation for the period of July 2015 to July 2017. Each graph refers to a station.
Remotesensing 10 01314 g006
Figure 7. Statistical criteria values for the regions in Pernambuco considering (a) daily and (b) eight-day time intervals. The number of samples for daily and eight-day intervals were 654 and 96 for Sertão and Agreste, and 630 and 95 for Mata, respectively.
Remotesensing 10 01314 g007
Figure 8. Soil moisture spatial distribution with (a,c,e,g) in situ and (b,d,f,h) SMOS data for the (a,b) January–February–March (JFM), (c,d) April–May–June (AMJ), (e,f) July–August–September (JAS), and (g,h) October–November–December (OND) seasons. Supplementary Materials Figures S1–S4 present these maps in detail with the numerical values at the samples.
Remotesensing 10 01314 g008
Figure 9. Soil moisture anomaly in 2012–2017 compared to 2010–2011 for the (a) JFM, (b) AMJ, (c) JAS, and (d) OND seasons.
Remotesensing 10 01314 g009
Figure 10. Soil moisture annual anomaly of each year in relation to the entire period of 2010 to 2017.
Remotesensing 10 01314 g010
Figure 11. Precipitation annual anomaly of each year in relation to the entire period of 2010 to 2017. Precipitation data source: Center for Weather Forecasts and Climate Studies of the National Institute for Space Research (CPTEC/INPE).
Remotesensing 10 01314 g011
Table 1. Correlation in pixels with two stations. The letter “A” indicates an APAC station.
LatLonStationrr-8dd-8BIAS (m3·m−3)BIAS-8 (m3·m−3)RMSD (m3·m−3)RMSD-8 (m3·m−3)
−8.56−35.92Cupira (A) and São Joaquim do Monte0.7650.8640.7210.7830.0350.0340.0710.059
−8.96−36.44Brejão and Palmerina0.8410.9170.7800.839−0.025−0.0270.0620.051
−8.56−36.44S.B. Una (A) and S.B. Una0.7690.8740.7930.846−0.020−0.0240.0480.039
−8.76−36.18Canhotinho and Jurema0.6610.7260.6740.7210.0410.0360.0770.065
−8.36−36.70Alagoinha and Pesqueira0.8050.8790.8520.8830.0220.0220.0450.036
−8.56−36.18Altinho and Lajedo0.8370.9100.8870.9090.0210.0260.0660.054
−8.16−39.29Salgueiro (A) and Terra Nova0.7670.8360.8120.8680.0080.0090.0340.024
−7.57−37.21São José do Egito and Tuparetama0.6880.7910.6360.6740.0550.0520.0740.064
−9.15−38.25Jatoba and Tacaratú0.7730.8640.8340.8490.0190.0210.0420.033

