1. Introduction
Three-dimensional (3D) building models with high level of detailed information play an important role in various applications, like building information modelling (BIM) [
1]; emergency management [
2]; augmented reality [
3]; and, construction site monitoring [
4]. Point clouds from active and passive sensors, which have various densities, are two data sources for urban modelling [
5]. 3D building reconstruction from dense point clouds normally entails special pattern detection for the identification of different features of the building. Hence; spatial data mining is a cardinal concept in modelling the details of the building using large spatial data sets through object detection [
6].
UAV is one of the state-of-the-art technologies that is used to gather extensive spatial data from the built environment [
7]. UAV is known under various names, such as Unmanned Aerial System (UAS), drone, and Remotely-Piloted Aerial System (RPAS). UAS is composed of a set of complementary technologies to fulfil a specific task. Some of main UAS components are UAV, ground control station, navigation sensors, and imaging sensors [
8]. Therefore, the UAV term will be used, when we want to refer to the platform. As a matter of fact, there is a clear global rise in the use of these off-the-shelf equipment since 2005, especially in civil applications [
8]. UAVs can be considered as a tool of short- and close-range data acquisition from small areas [
9], which leads to images with small GSDs. This data has the potential for fast updates of the reconstructed 3D city models with low costs [
10] and large-scale spatial data [
11]. The combination of UAS imagery with computer vision and photogrammetric techniques generates high accuracy point clouds, even with end-user, small format cameras [
8]. Multi-view dense image matching (DIM), which is a technique to compute a depth value for each pixel of an image, can generate image-derived dense point clouds from multi-view imagery. In general, the analysis of high-density point clouds poses challenges for complex real-world buildings. Furthermore, point clouds of DIM have high variations in point density [
12]. In addition, clutter, outliers, and noises which stem from reflective surfaces, movement of the platform, textureless objects, shadowed areas, occlusions, and unsuitable viewing angles [
12] suffer from this type of data. Nonetheless, point clouds of DIM win in terms of density when compared to laser scanning point clouds [
13]. Moreover, laser scanners cannot produce points on edges accurately. Additionally, variations of materials of objects’ surfaces may cause serious errors in laser scanning data [
14]. However, matching can benefit from edges as areas with strong gradients and from surface variations as textures to use to compute points.
Processing high-density non-uniform point clouds of DIM is time consuming and a big challenge for most of spatial analyses [
15]. Massive spatial data imposes scalability on the approach to accommodate complex processes of large datasets [
16]. Furthermore, large differences in density raise the uncertainty and, consequently, the challenge of analyzing this type of data [
17]. Indeed volume, inconsistency, and quality are the significant issues that should be considered for this kind of data. These concepts affirm the importance of spatial data mining for object detection from UAS-based image-derived point clouds, which convey large-scale detailed data.
Facades are important features in 3D models of buildings. One of their constituent elements is windows, which play a role in different applications, such as the thermal inspection of buildings. Moreover, the ratio of window to wall areas is a determining parameter to perform the energy assessment of buildings [
18]. This is why window detection is a significant factor in the calculation of the energy consumption of buildings. In addition, the number of floors is an item that can be determined via rows of windows. Furthermore, windows should be modelled to build a realistic visualization of a building [
4]. Windows belong in the openings subclass of the building module in the City Geography Markup Language (CityGML) standard. This standard enumerates the 3D building model in five levels of details (LoD) [
19]. LoD2 includes roof structures, and LoD3 involves detailed architecture [
20]. Openings, which are demonstrated in LoD3, enhance the building model semantically. Nonetheless, dormers, which are modelled in LoD2, are comprised of windows too.
Utilizing UAVs for the acquisition of oblique images from the top to the bottom of facades, which include most of the windows of a building, assigns priority to other methods of data capture, such as mobile/terrestrial laser scanning. The photogrammetric point cloud, generated from UAV imagery, can benefit from ultra-high density. This matter poses a difficulty in the process, but it provides the object with dense points, even on edges. Thus, in the case of proper visibility, point clouds of well-textured surfaces under stable lighting can be employed in the generation of detailed 3D models of buildings [
21]. For this purpose, the scene should observe the required LoD [
21]. Additionally, the viewing angle and the overlap of images should be determined properly. On the other hand, convergent image acquisition in case of large-scale projects and non-flat objects is still critical [
9]. Therefore, the purpose of this research is to develop an approach that can cope with capabilities and challenges of this type of point cloud for large-scale window detection. This paper endeavors to introduce a method that employs this type of data to building blocks, aside from using color information, to identify various rectangular and curved window frames.
Our main innovations are summarized as follows. First, our proposed method of employing a multi-scale filter, based on local density in feature space, can globally handle the scale issue for various structures in unorganized point clouds and variations in their density. Additionally, it maintains the data accuracy on edge areas. Second, employing the Gestalt principles in the detection of window patches demonstrates one of the fresh usages of human perception in 3D spatial data mining. In the next section, a literature review discusses several related studies to date.
2. Related Works
High-density point clouds comprise a deluge of data that can be utilized in modelling details of the building. Therefore, object detection is a basic step in building reconstruction and has been well-established by many researchers. In working with big datasets, the approach should be able to deal with a huge mass of data effectively. Decreasing the volume of data is one feasible procedure to handle massive datasets.
Filtering is one of the relevant issues, which has been widely addressed in different research studies. In [
22], a comprehensive analysis of various filters is presented. Most of the filters have been designed to remove outliers and noises. In addition, preserving the intended objects is a point that ought to be taken into consideration. Meanwhile, filters decrease the volume of the data to be handled with ease and expedite the process of identifying the target points. One type of filter is a neighborhood-based filter which uses similarity measures between neighbouring points. One type of this filter, which can carry out the aforementioned tasks successfully, is defined in [
23]. It eliminates sparse outliers employing the relative deviation of the local neighborhood and takes a clustering-based approach to remove small clusters of outliers. Another successful filter for removing outliers and noises and preserving features is described in [
24], in which a density-based method is applied. A particle swarm optimization approach is adopted for the approximation of the optimal bandwidth for kernel density to fulfill the robustness. Next, mean-shift clustering is utilized to remove outliers via thresholding. Wenzel et al. [
25] develops a multi-cloud filter that preserves the locally densest clouds. It splits the tree structure to reach just one point for each node from each point cloud. Therefore, it can remove noise. Additionally, this filter omits outliers via constraining a certain redundancy.
One of the proposed methods for multi-scale point cloud filtering is addressed in [
26]. In this research, a multi-scale operator is implemented by the difference of normal vectors (DoN) in two scales. This method is designed for large unorganized point clouds to generate scale-salient clusters. Edges of different objects, such as buildings, cars, windows, and trees are extracted from LiDAR data, to some extent, via defining vector fields with different radii. Normal vectors in different scales estimate surfaces of various objects with different sizes. The important matter in this method is setting the radii, which depends on the objects in question. A set of ground truth point clouds are employed to tackle this matter via maximizing the DoN for the objective classes and minimizing it for other classes. Another approach, which uses a multi-scale filter, is discussed in [
27]. A multi-scale morphological filter with different shapes is utilized to extract small objects, like cars and trees, along with big objects such as buildings. The size of the filter is changed exponentially and can be bigger than the biggest object in the experimental area. In this method, which separates ground and non-ground points, the size of the filter window is determining. In [
28], a multi-scale operator that is based on the Laplacian-Betrami operator is proposed to detect objects in an unorganized point cloud. It adopts a Gaussian kernel and defines an operator invariant to transformation and translation in order to detect regions of interest in the point cloud. However, these regions do not include edges.
Windows draw attentions in reconstruction of detailed building models. The detection of this object from aerial or close range images is pursued in different studies, such as [
29,
30,
31]. Furthermore, windows are recognizable through outdoor or indoor data. There is a variety of research on window detection from point clouds. However, the majority of the utilized data are generated from laser scanning systems, which is an outgrowth of the usage of these systems, including mobile mapping, terrestrial, or trolley-based [
32]. Methods that are based on deep learning are of particular interest for object detection tasks. Nonetheless, massive training dataset is a challenge for learning a model via this technique. There are too few publicly available suitable benchmark datasets for building classification and reconstruction using point clouds. Roofn3D is a new training dataset for classification of different roof types and semantic segmentation of buildings [
33]. To the best of our knowledge, there is still no available training dataset proper for window detection in 3D. The following is a summary of several studies on window detection, which utilized the laserscanning data. In [
4], indoor points behind the façade planes, which arise from the reflected laser pulses, are employed to detect centers of windows in sparse airborne laser scanning point clouds. Peaks of correlation functions and repetitive structures are two main features to detect window points. In [
34], points on the window frames are detected by slicing the point cloud of the façade horizontally and vertically. Then, points on the window frames are picked by a length threshold in the slices that have more clusters of points. In [
35], points on the frames are detected by thresholding a likelihood function. Points on the right and left edges, alongside points on the upper and lower edges, are separated via their relative positions, so that window patches are identified if they have the points on the four edges. In [
36], a hole-based approach is applied to detect and reconstruct windows. A TIN is generated, long TIN edges are the results of the holes. The points of each hole are grouped together and minimum bounding boxes are generated to reconstruct windows. Aijazi et al. [
37] presents a super voxel segmentation method for window detection from mobile terrestrial laserscanning. Points on facades are projected onto a plane parallel to the façade. A watertight boundary of the projected facade is generated and point inversion is conducted for the points inside it in order to segment holes. Windows are detected using these segments, along with a number of geometrical features, such as height and width.
One of the methods for object detection, which examines the problem space via an object-based approach, is perceptual organization. The Gestalt principles are suggested for perceptual organization by the Gestalt psychology, which studies the human perception of the visual environment [
38]. According to the Gestaltists, humans intend to organize patterns and group individual elements into larger objects, based on the particular rules. These rules can consist of symmetry, proximity, similarity, and continuity [
38]. In [
39], the Gestalt principles are investigated through the viewpoint of robotic vision. In this regard, objects are detected while using a saliency model, which is based on symmetry. Moreover, similarity in color and position alongside proximity in depth, are employed for super pixel segmentation. In addition, continuation, proximity, symmetry, color uniqueness, and parallelism are utilized for the evaluation of the quality of segmentation. In [
40], the relationship between surface patches, which are extracted from Gestalt rules, are employed to group surfaces in RGB-D data. These rules are defined on the basis of similarity of color, size, and texture and are learned by SVM. Tutzauer et al. [
41] reveals a study on the human perception of building categories. It summarizes some of the research on two-dimensional (2D) geometric building structures, which aim to totally recognize, generalize, and generate an abstraction of the building. It uses the human perception of 3D geometric objects in 3D building abstraction. The quantification of human perception in 3D is firstly addressed here, according to its claim. Furthermore, Xu et al. [
42] is another paper that reveals one of the first research efforts in this area. It presents a strategy for segmentation of two types of point clouds via voxel and super voxel structures. Graph-based clustering is applied to laserscanning and photogrammetric point clouds using perceptual grouping laws of proximity, similarity, and continuity. The outcomes demonstrate successful segmentation of facades, fences, windows, and the ground. In addition, they indicate that voxel graph-based segmentation yields better results with a photogrammetric point cloud.
While considering the literature, object detection from point clouds via filtering can detect points on the edge areas only to some extent and requires improvements for window detection purpose. Hence, we firstly devise a density-based multi-scale filter to downsize the input datasets and extract the points on edge areas globally. The designed filter should preserve the data accuracy [
25]. When employing unorganized point clouds, the spatial position of the input data has foremost importance in processing to discover their coherence without gaining any benefit from additional information [
43]. Therefore, the process of filtering should be position-invariant. Afterwards, inner clutter is discarded via color information and 3D points are clustered while using grouping concept of perceptual organization. Next, the concept of the Gestalt principles is tailored for identifying 3D points on window frames and recognizing window patches. Then, research experiments are reported and evaluated. Also, discussion is presented. Finally, overall results are discussed.
3. Materials and Methods
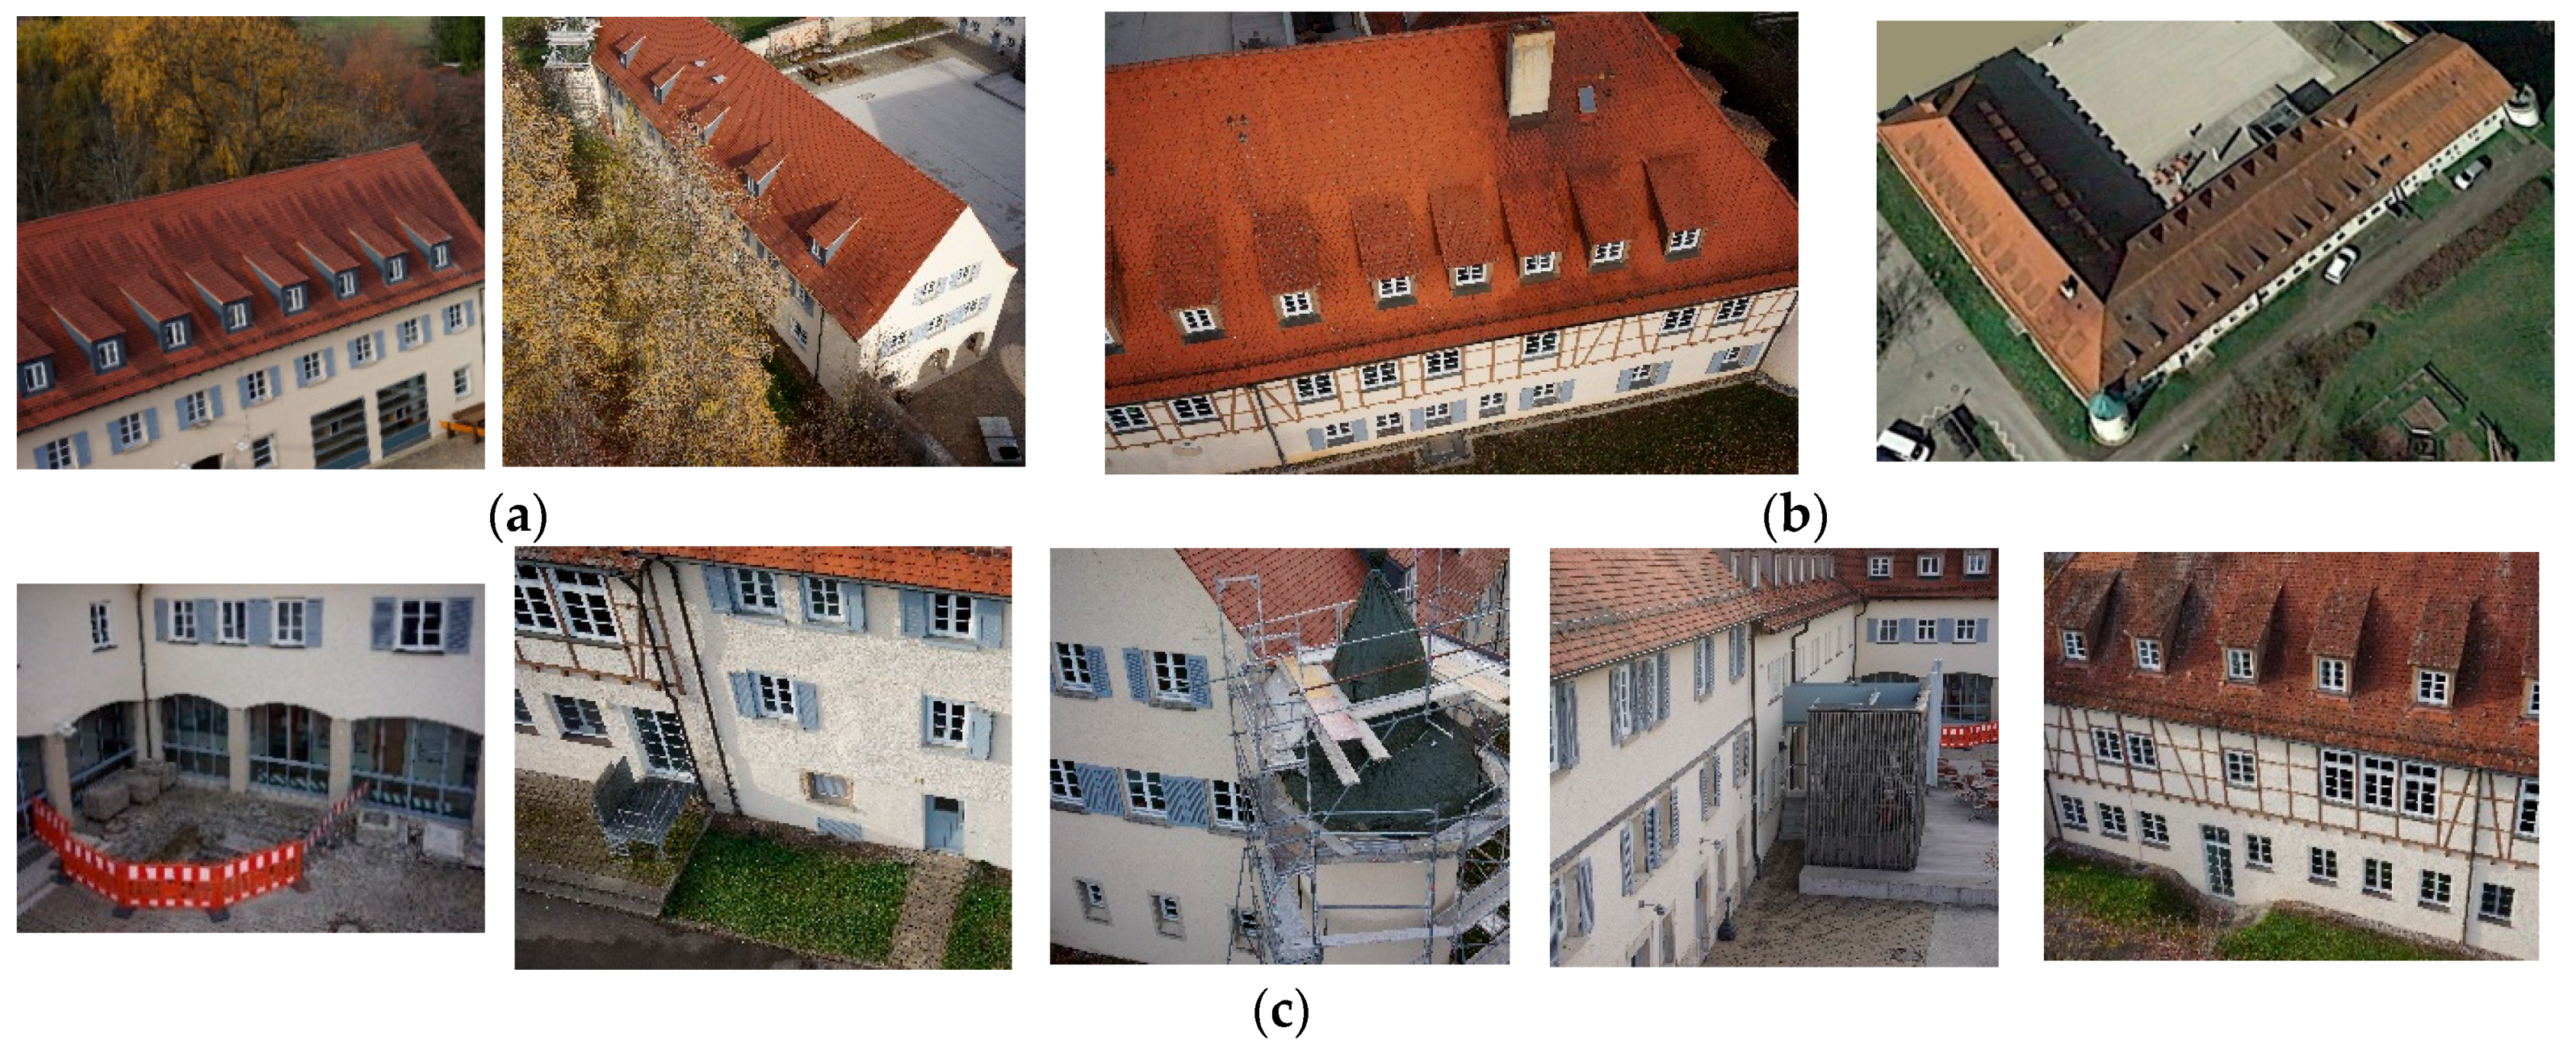
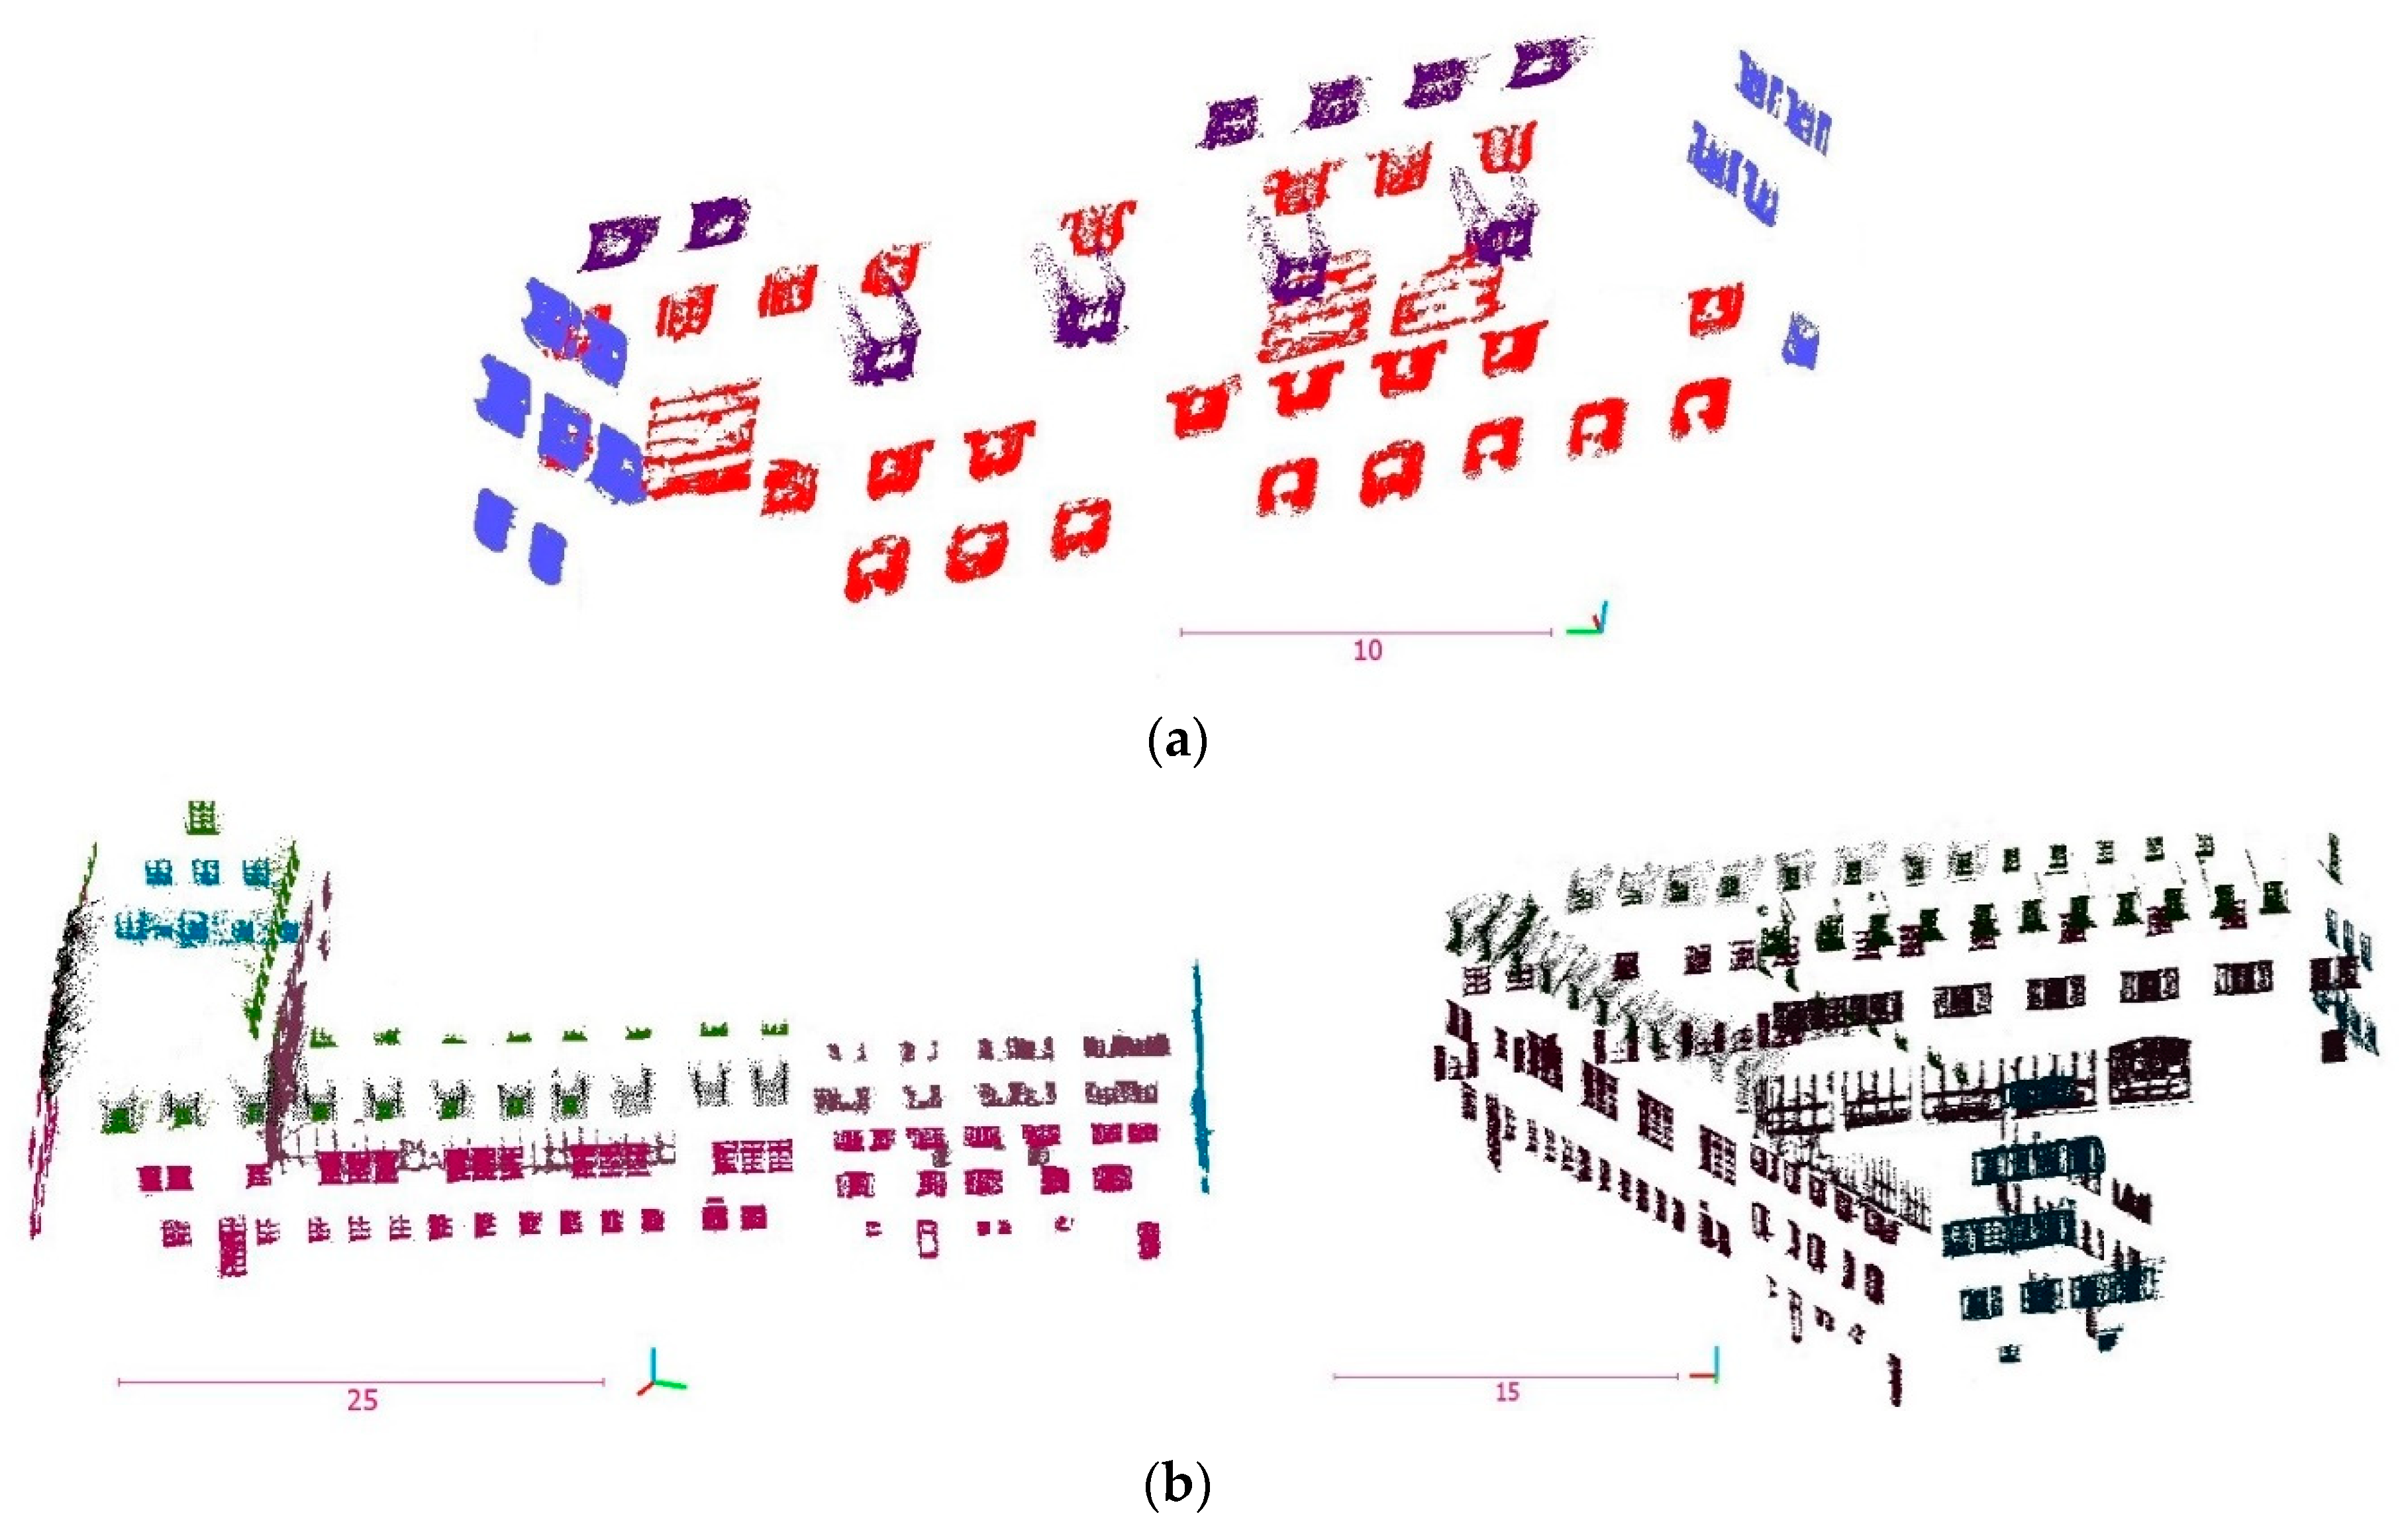
We exploit the data that includes two real-world heavy, inhomogeneous point clouds from two building blocks that are located in Baden-Wuerttemberg, Germany. They are composed of 20 and 53 million points, respectively. These point clouds, which are spread over areas of 520 and 1240 m
2, respectively, consist of various windows on the roofs and on the walls alongside non-window structures, which can misdirect the approach (
Figure 1). The images were captured while using an uncalibrated Sony camera, with focal length of 35 mm, on a UAV Falcon octocopter, which flew around the target buildings entirely and performed nadir and oblique imaging. The average GSD of the images is around 1 cm/pixel. The average end lap and side lap of the images are 80% and 70%, respectively. The average density on walls is 20 points/dm
2. 22 ground control points (GCPs) were used to do geo-referencing and model calculations. Images were processed with Photoscan software by Agisoft to generate spare point clouds via structure from motion (SfM) and then dense point clouds using multi-view stereo matching (MVS). The average horizontal and vertical accuracies on 16 control points are 0.5 and 1.2 cm, respectively. Those in the six check points are 0.7 and 1.5 cm, respectively. Accuracy assessments of GCPs were performed via root-mean-square error.
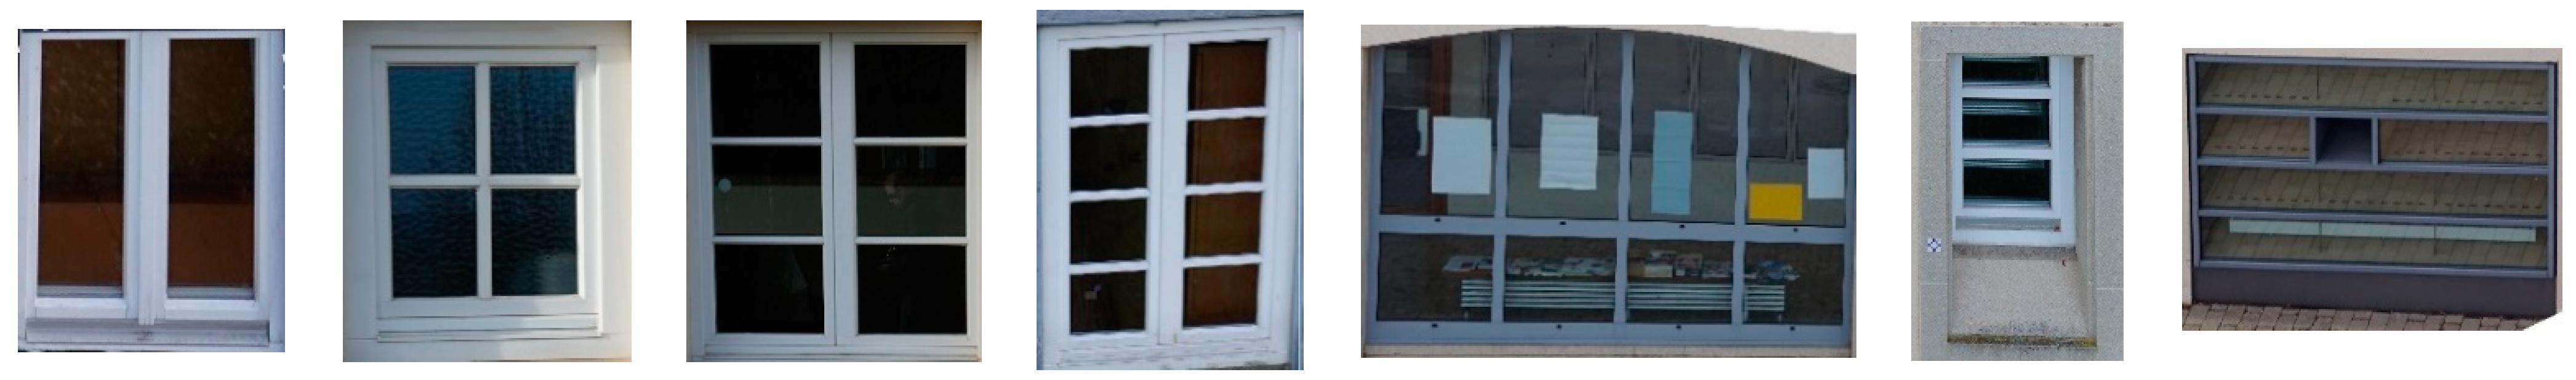
Different kinds of windows in
Figure 2, including casement windows, are taken into consideration. They are located on 10 wall faces and seven roof faces.
3.1. Filtering
Useful spatial data usually come with unsuitable data, such as clutter, noise, and outliers. Filtering is one of the possible methods to tackle this matter. It can facilitate data mining via downsizing the data and eliminating undesirable data.
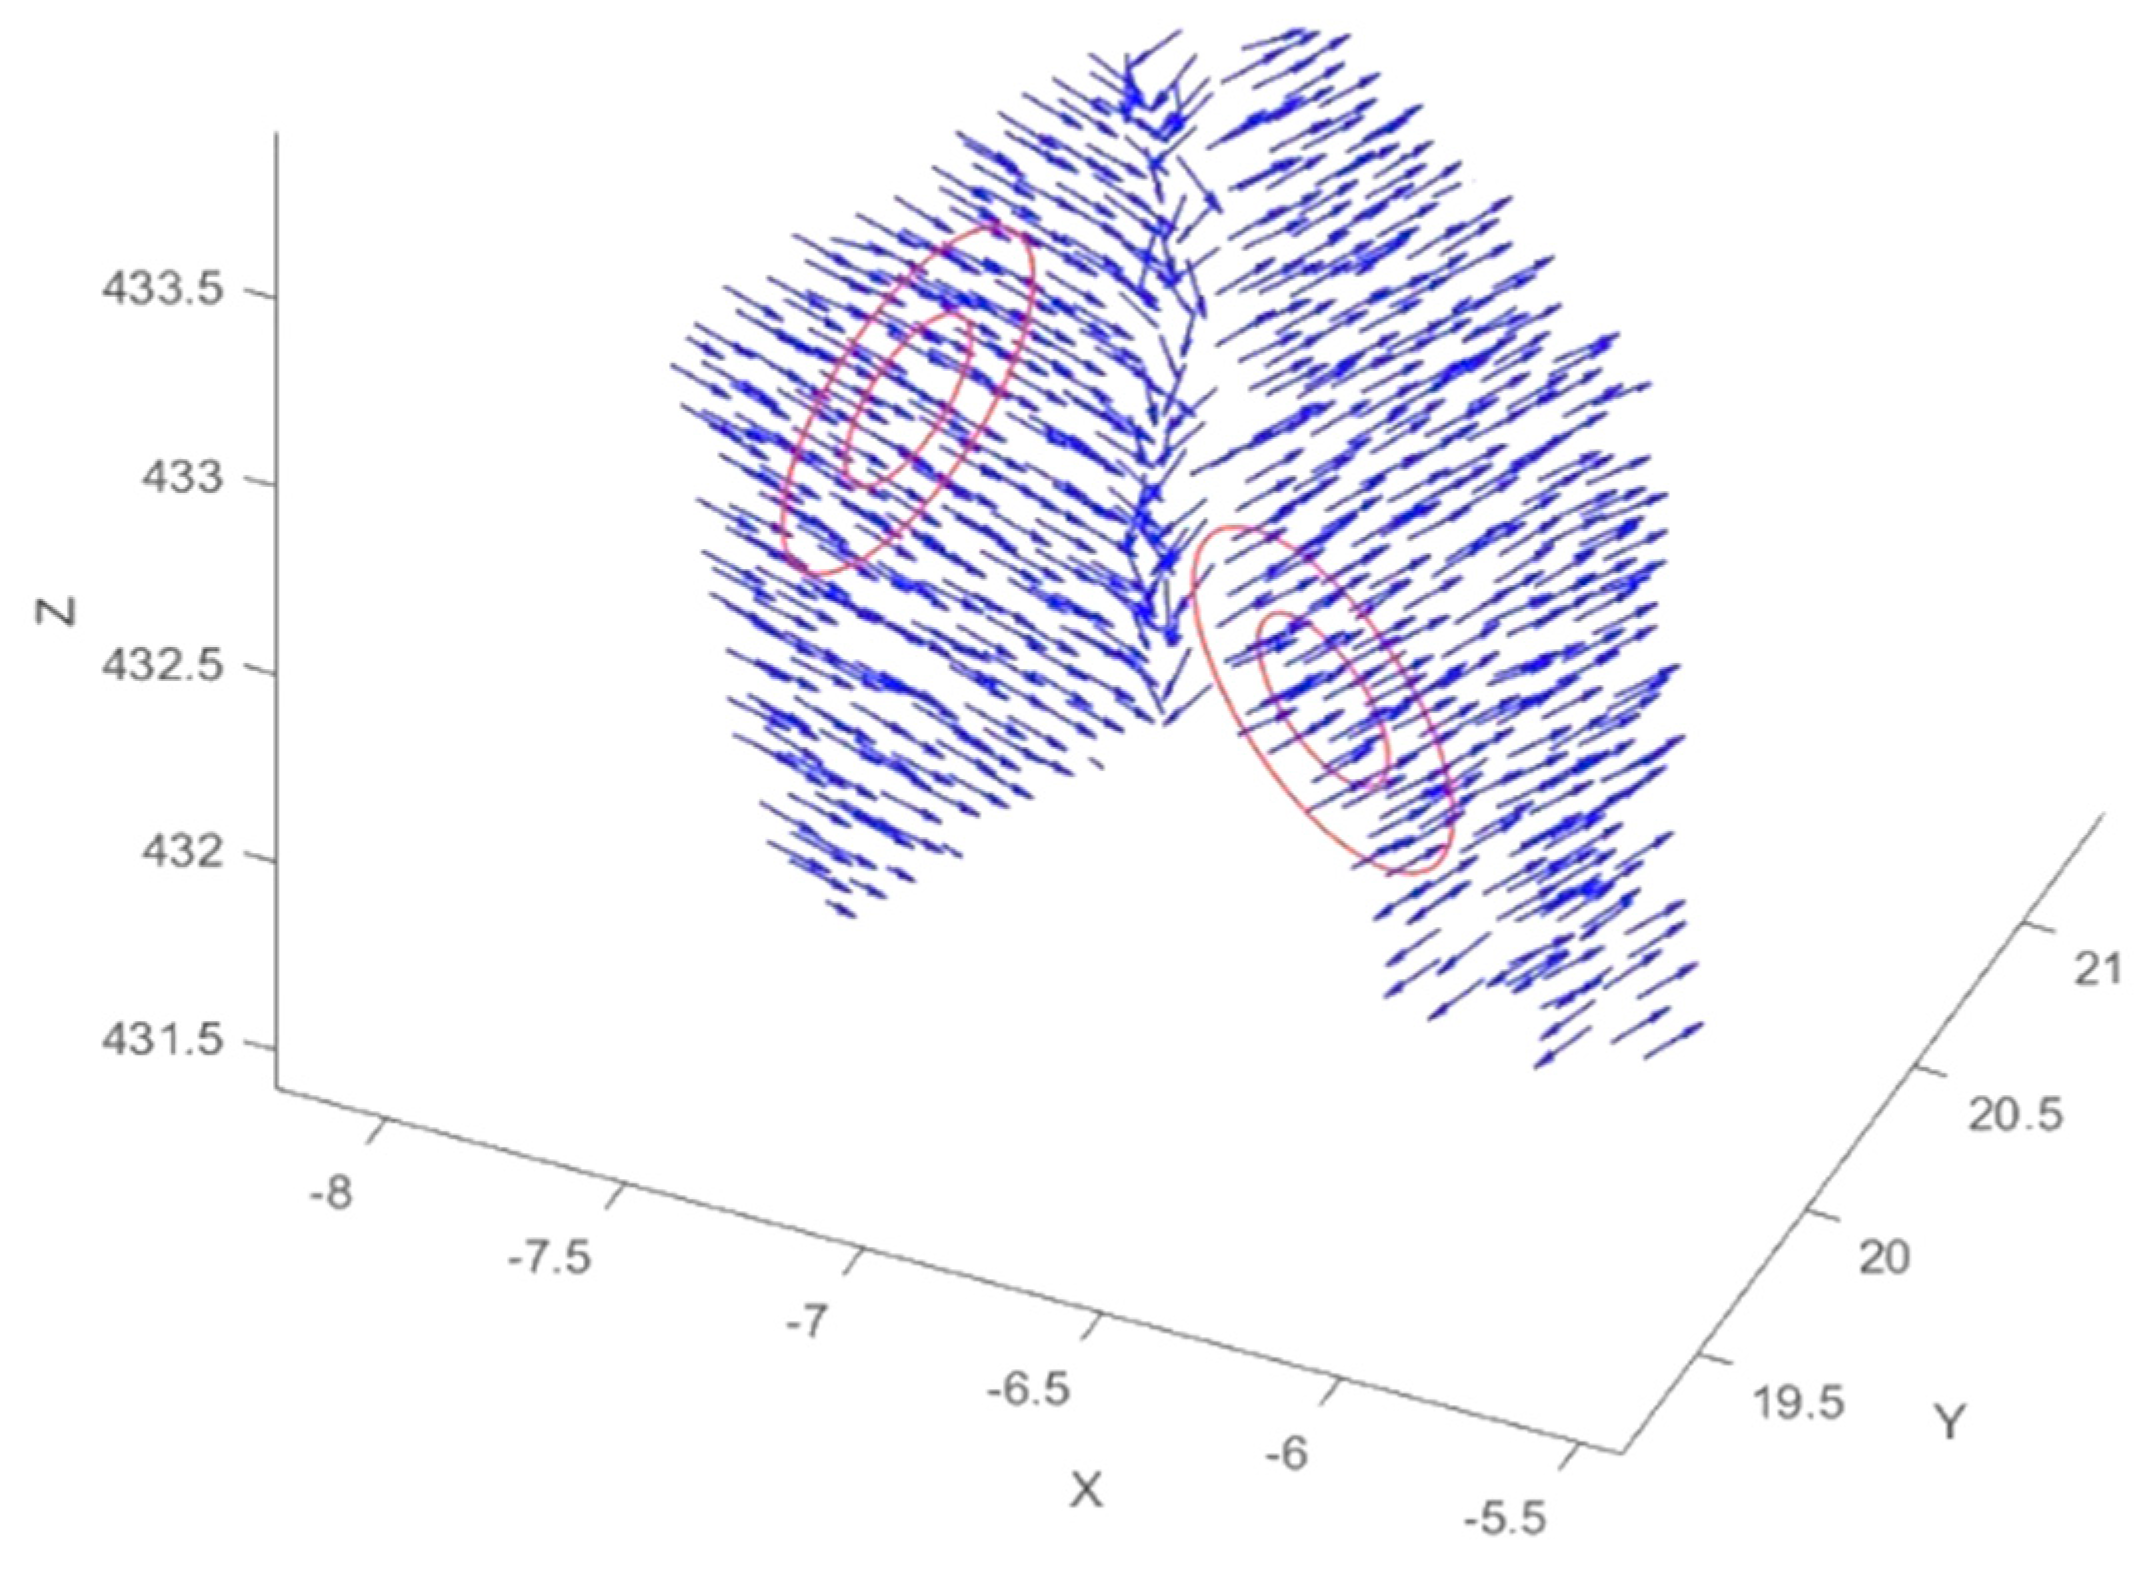
Normal vectors are important specifications of a surface since they can estimate the inclination of the underlying surface. One of the methods of normal vector computation is the approximation of the local plane tangent to the surface. This method employs points directly to generate normal vectors. Directions of the local normal vectors on a real-world surface are associated with its changes so that normal vectors near edges get distorted. Normal vectors on a planar surface are theoretically surrounded by parallel normal vectors (
Figure 3). Therefore, these normal vectors have an equal number of parallel normal vectors in their neighbourhood, defined by a specific radius.
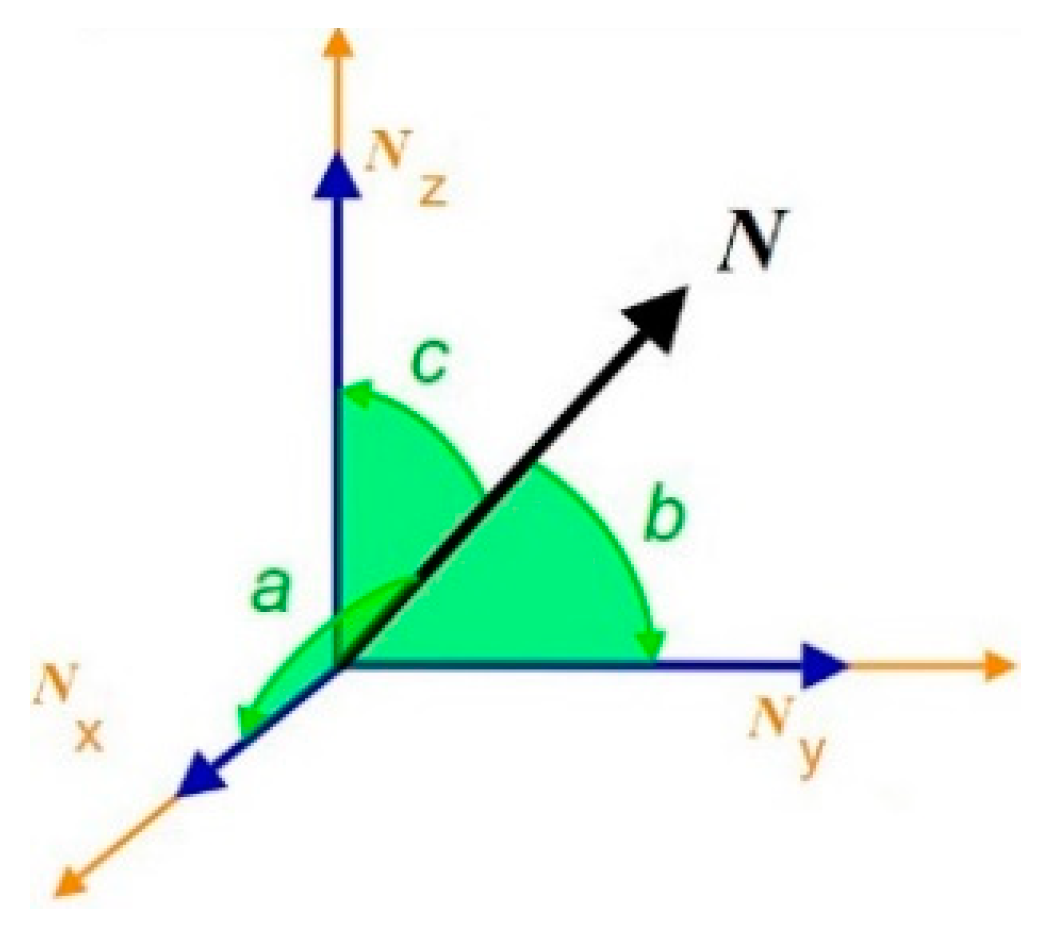
One demonstration of a normal vector is via the directional cosines (Equations (1)), where
is a normal vector whose three components are defined through three directional angles
(
Figure 4).
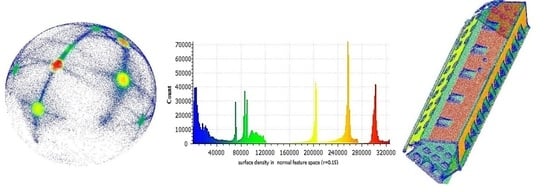
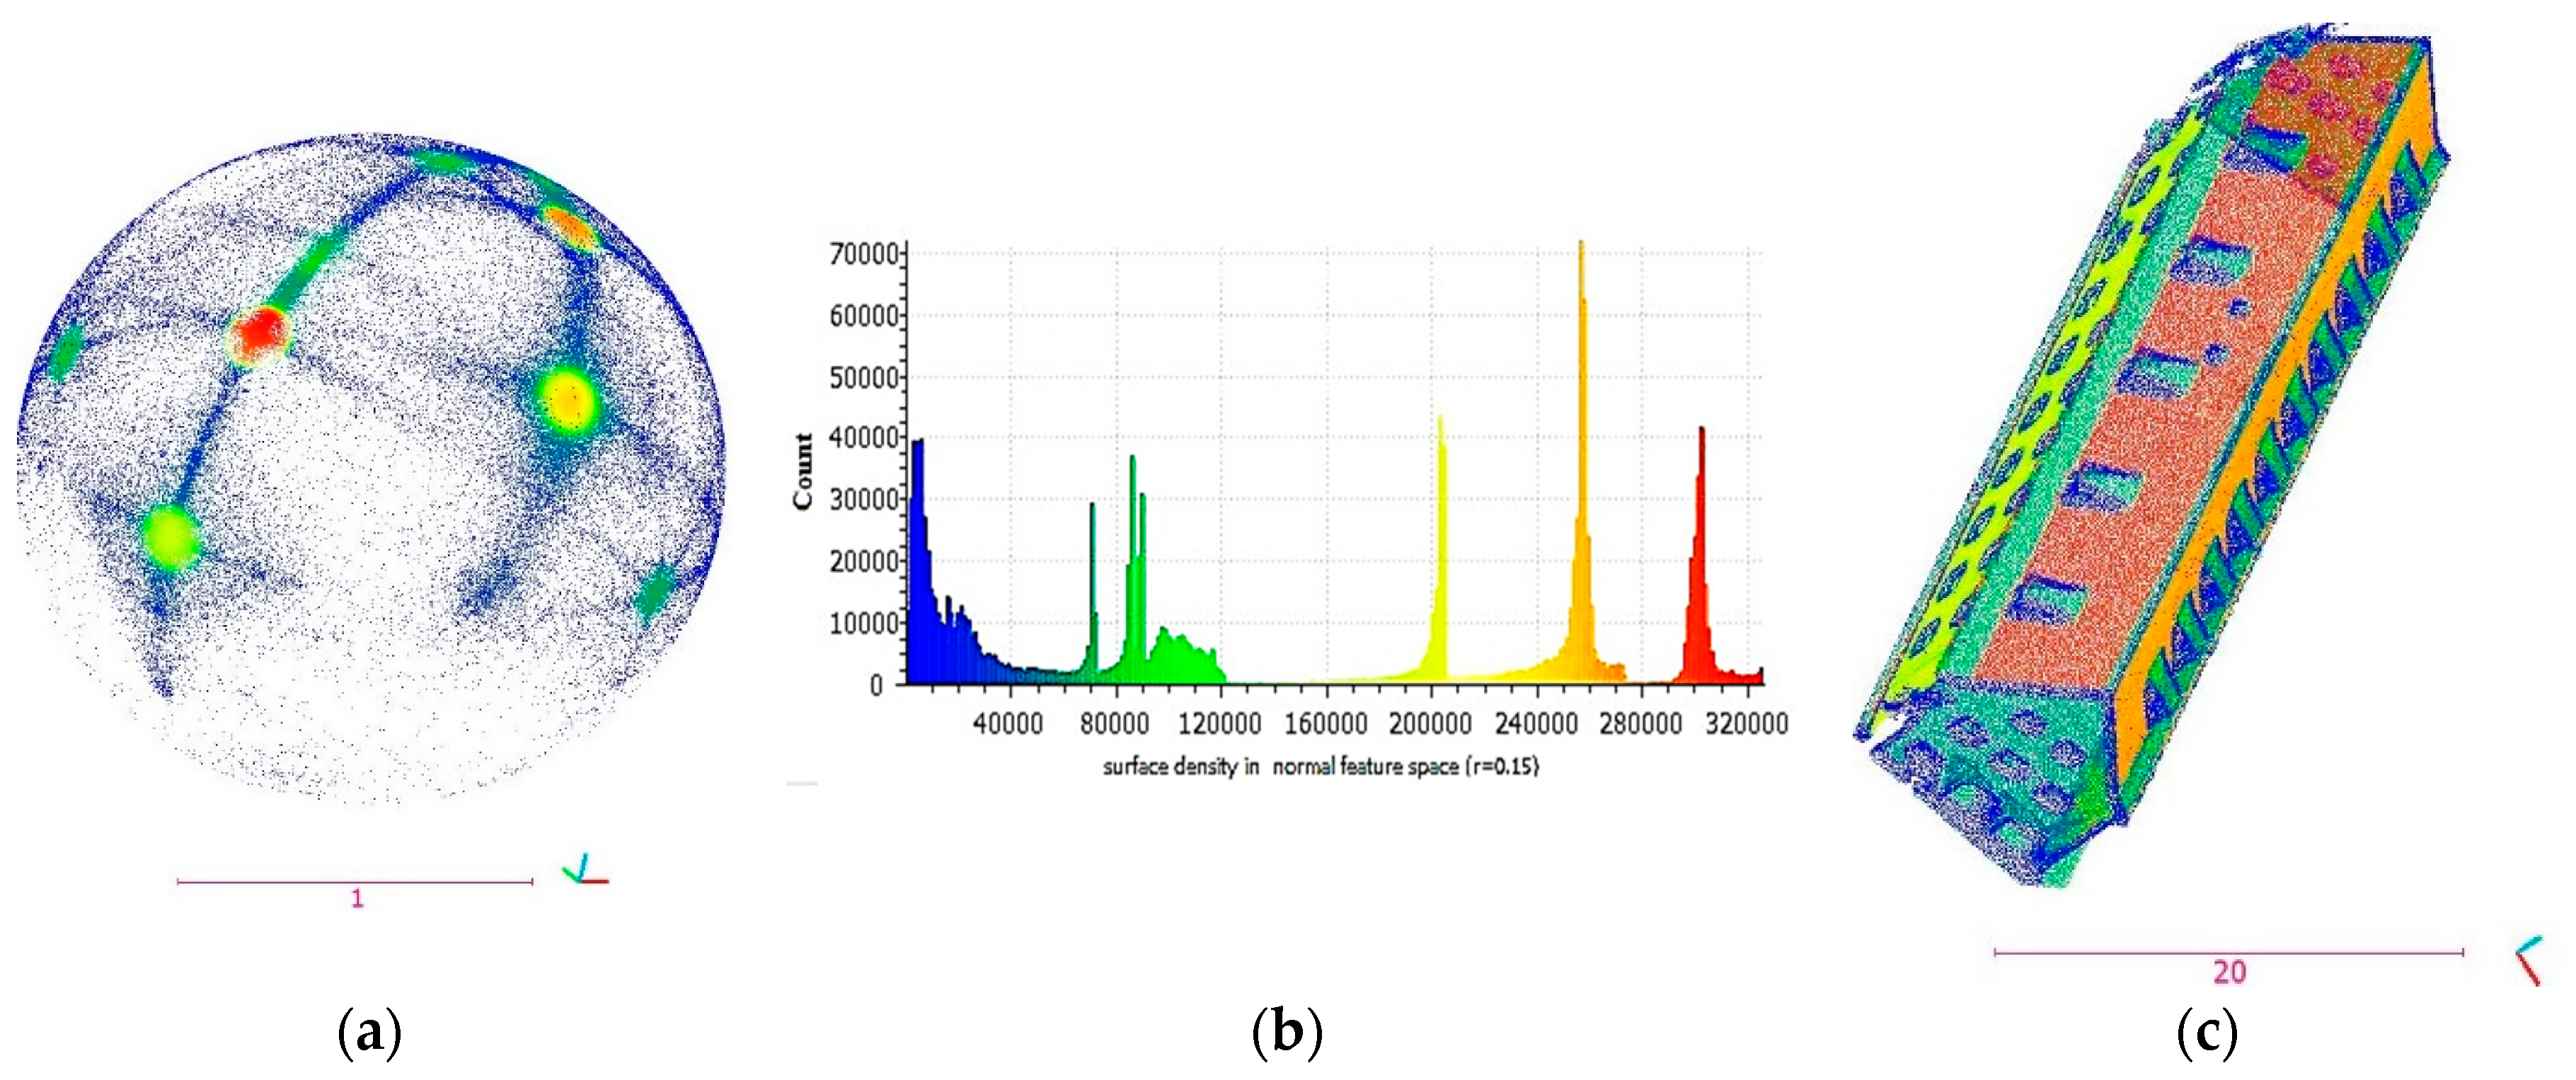
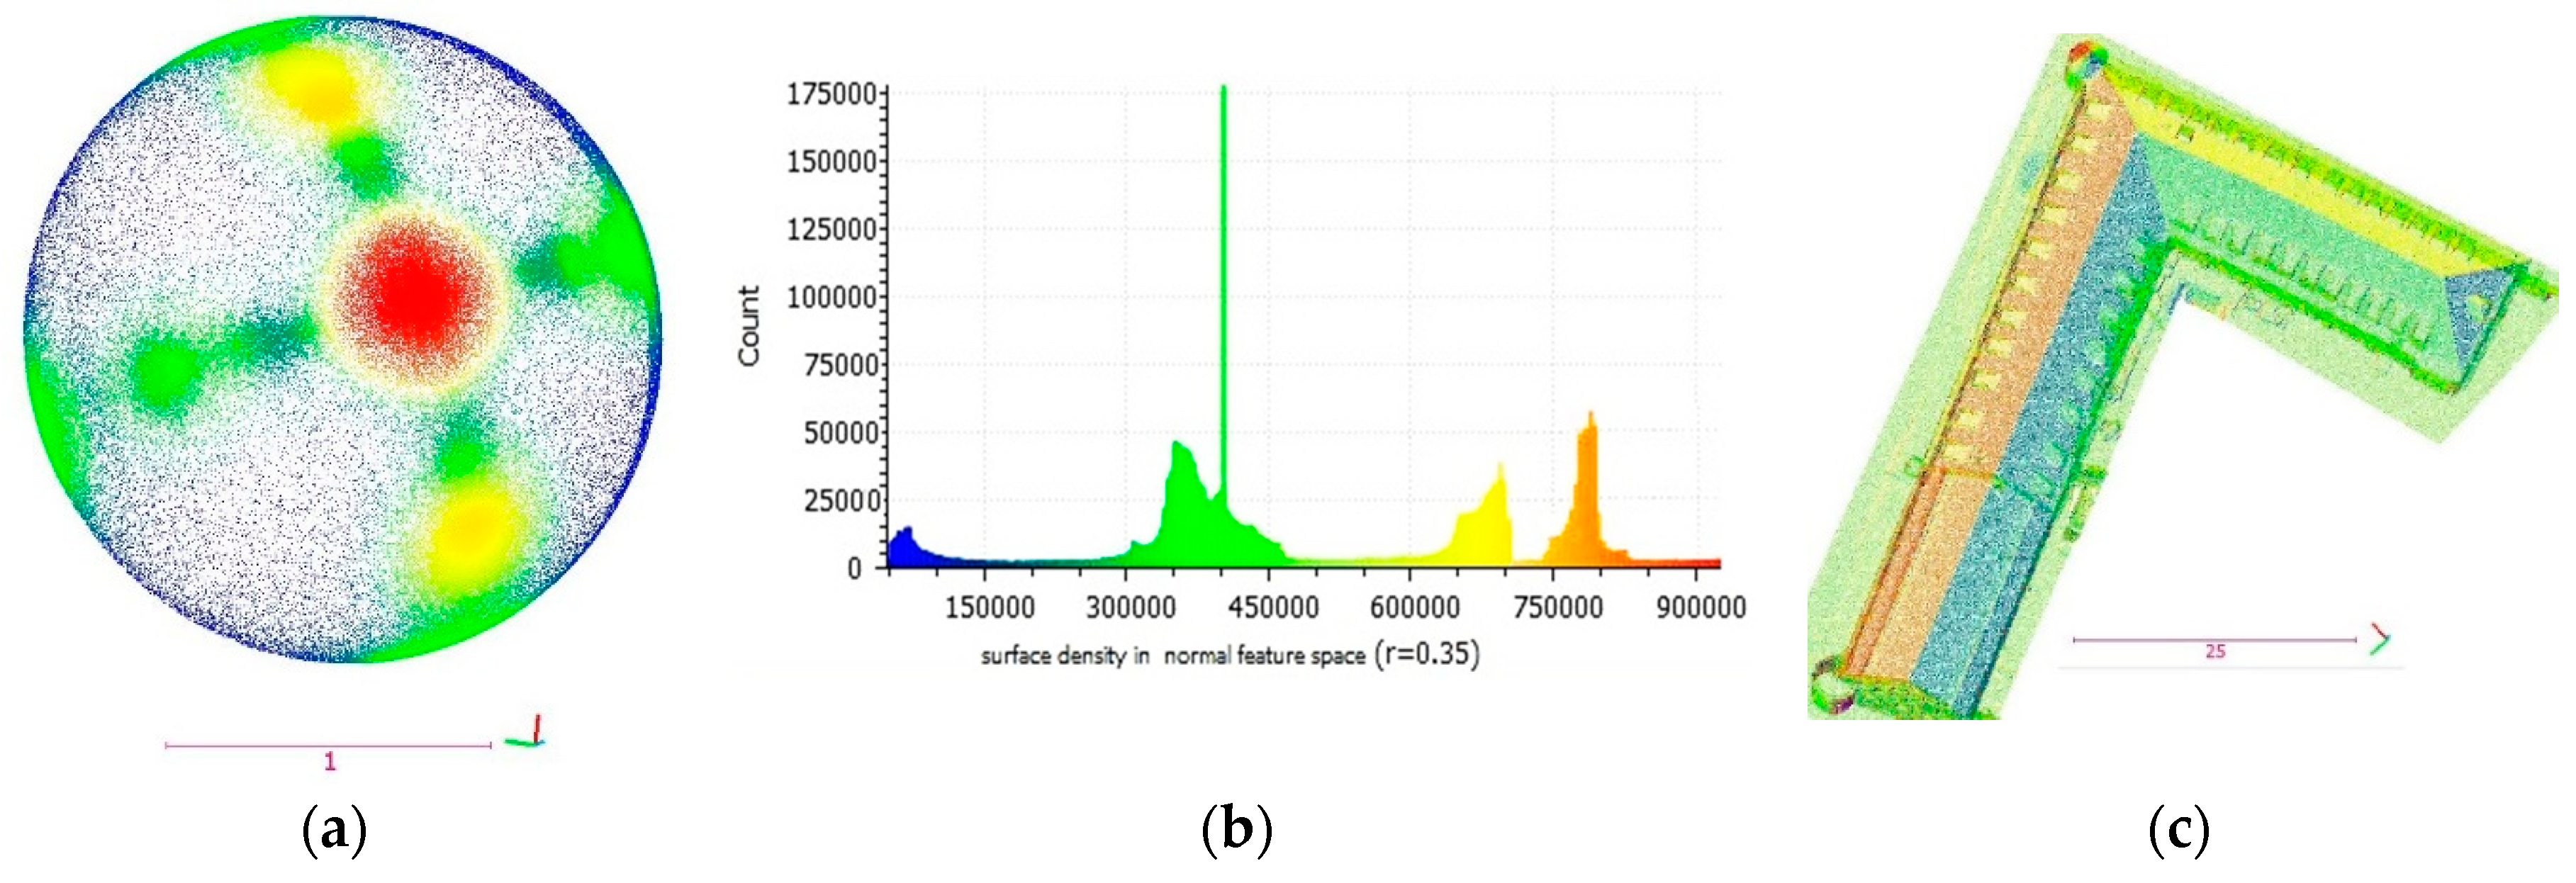
If the normal vectors are depicted by directional cosines, each point on the sphere (
Figure 5a) displays a normal vector. Each colorful area on the sphere shows a planar surface of the building. In addition, in the feature space of normal vectors (
Figure 5a), local surface densities of the edge areas (in
Figure 5b, in blue) are lower than other areas because they are narrow areas, with normal vectors of different directions. However, other areas with similar characteristics exist in the image-derived point cloud on account of heterogeneity and clutter. Indeed, pseudo edges bring the same effect as real edges. This fact is the basis of the proposed filter to detect points on edges and window frames. In
Figure 5c, the clustering of the first dataset is generated employing density grouping, as demonstrated in the histogram in
Figure 5b. These clusters are conformed to the planes of the faces of the building.
Different planar patches have various normal vectors and are discriminated in the feature space (
Figure 5a), in the histogram of the local density (
Figure 5b), and on point cloud of the building (
Figure 5c) with similar colors. In addition, points on the break lines of the roofs, footprints and walls and beside windows, the scaffold, and walls of dormers are recognizable in blue (
Figure 5c). In order to discriminate these areas, a threshold has to be determined.
Setting a threshold in the feature space of a heterogeneous point cloud is a complicated matter. However, the feature space has more uniformity, it inherits high variations. Hence, we utilize the ratio of densities to employ a computationally efficient parameter. In the local normal vectors space, local surface densities (
) around a point in two different radii (
), have a relationship that is represented by Equation (2). A scale parameter is imposed upon the filtering approach via employing two radii to examine the surface around each point.
where
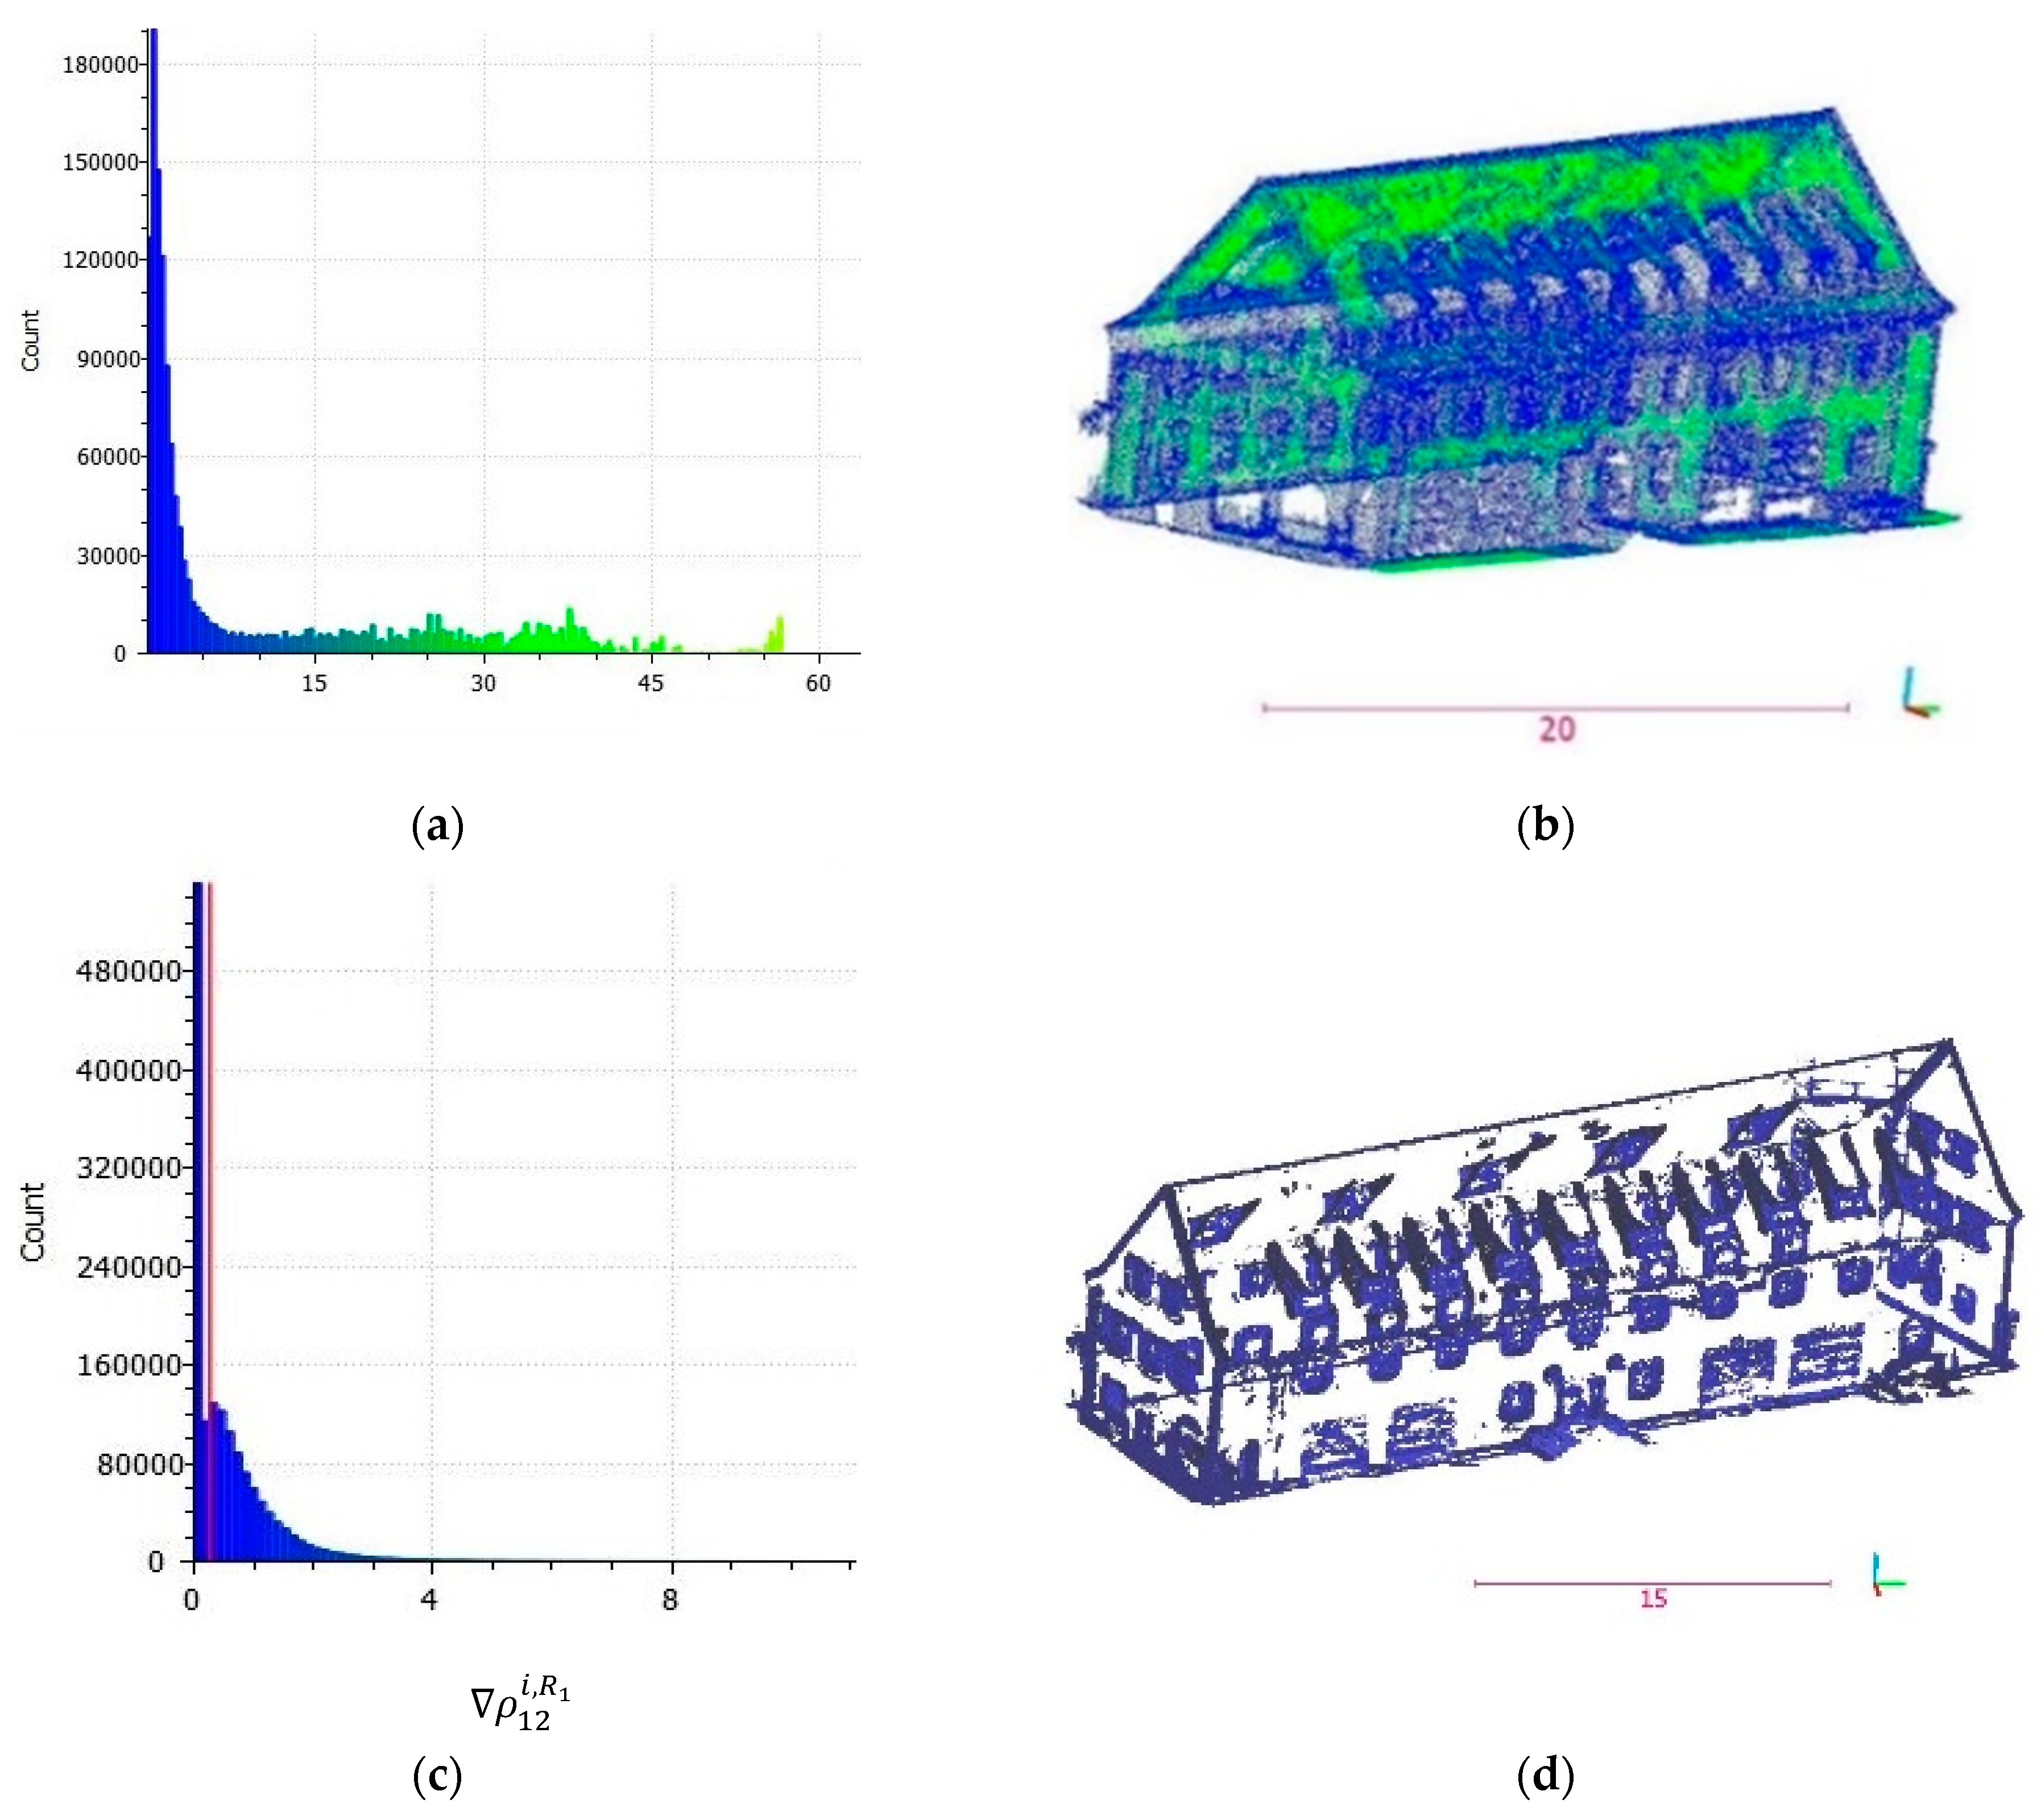
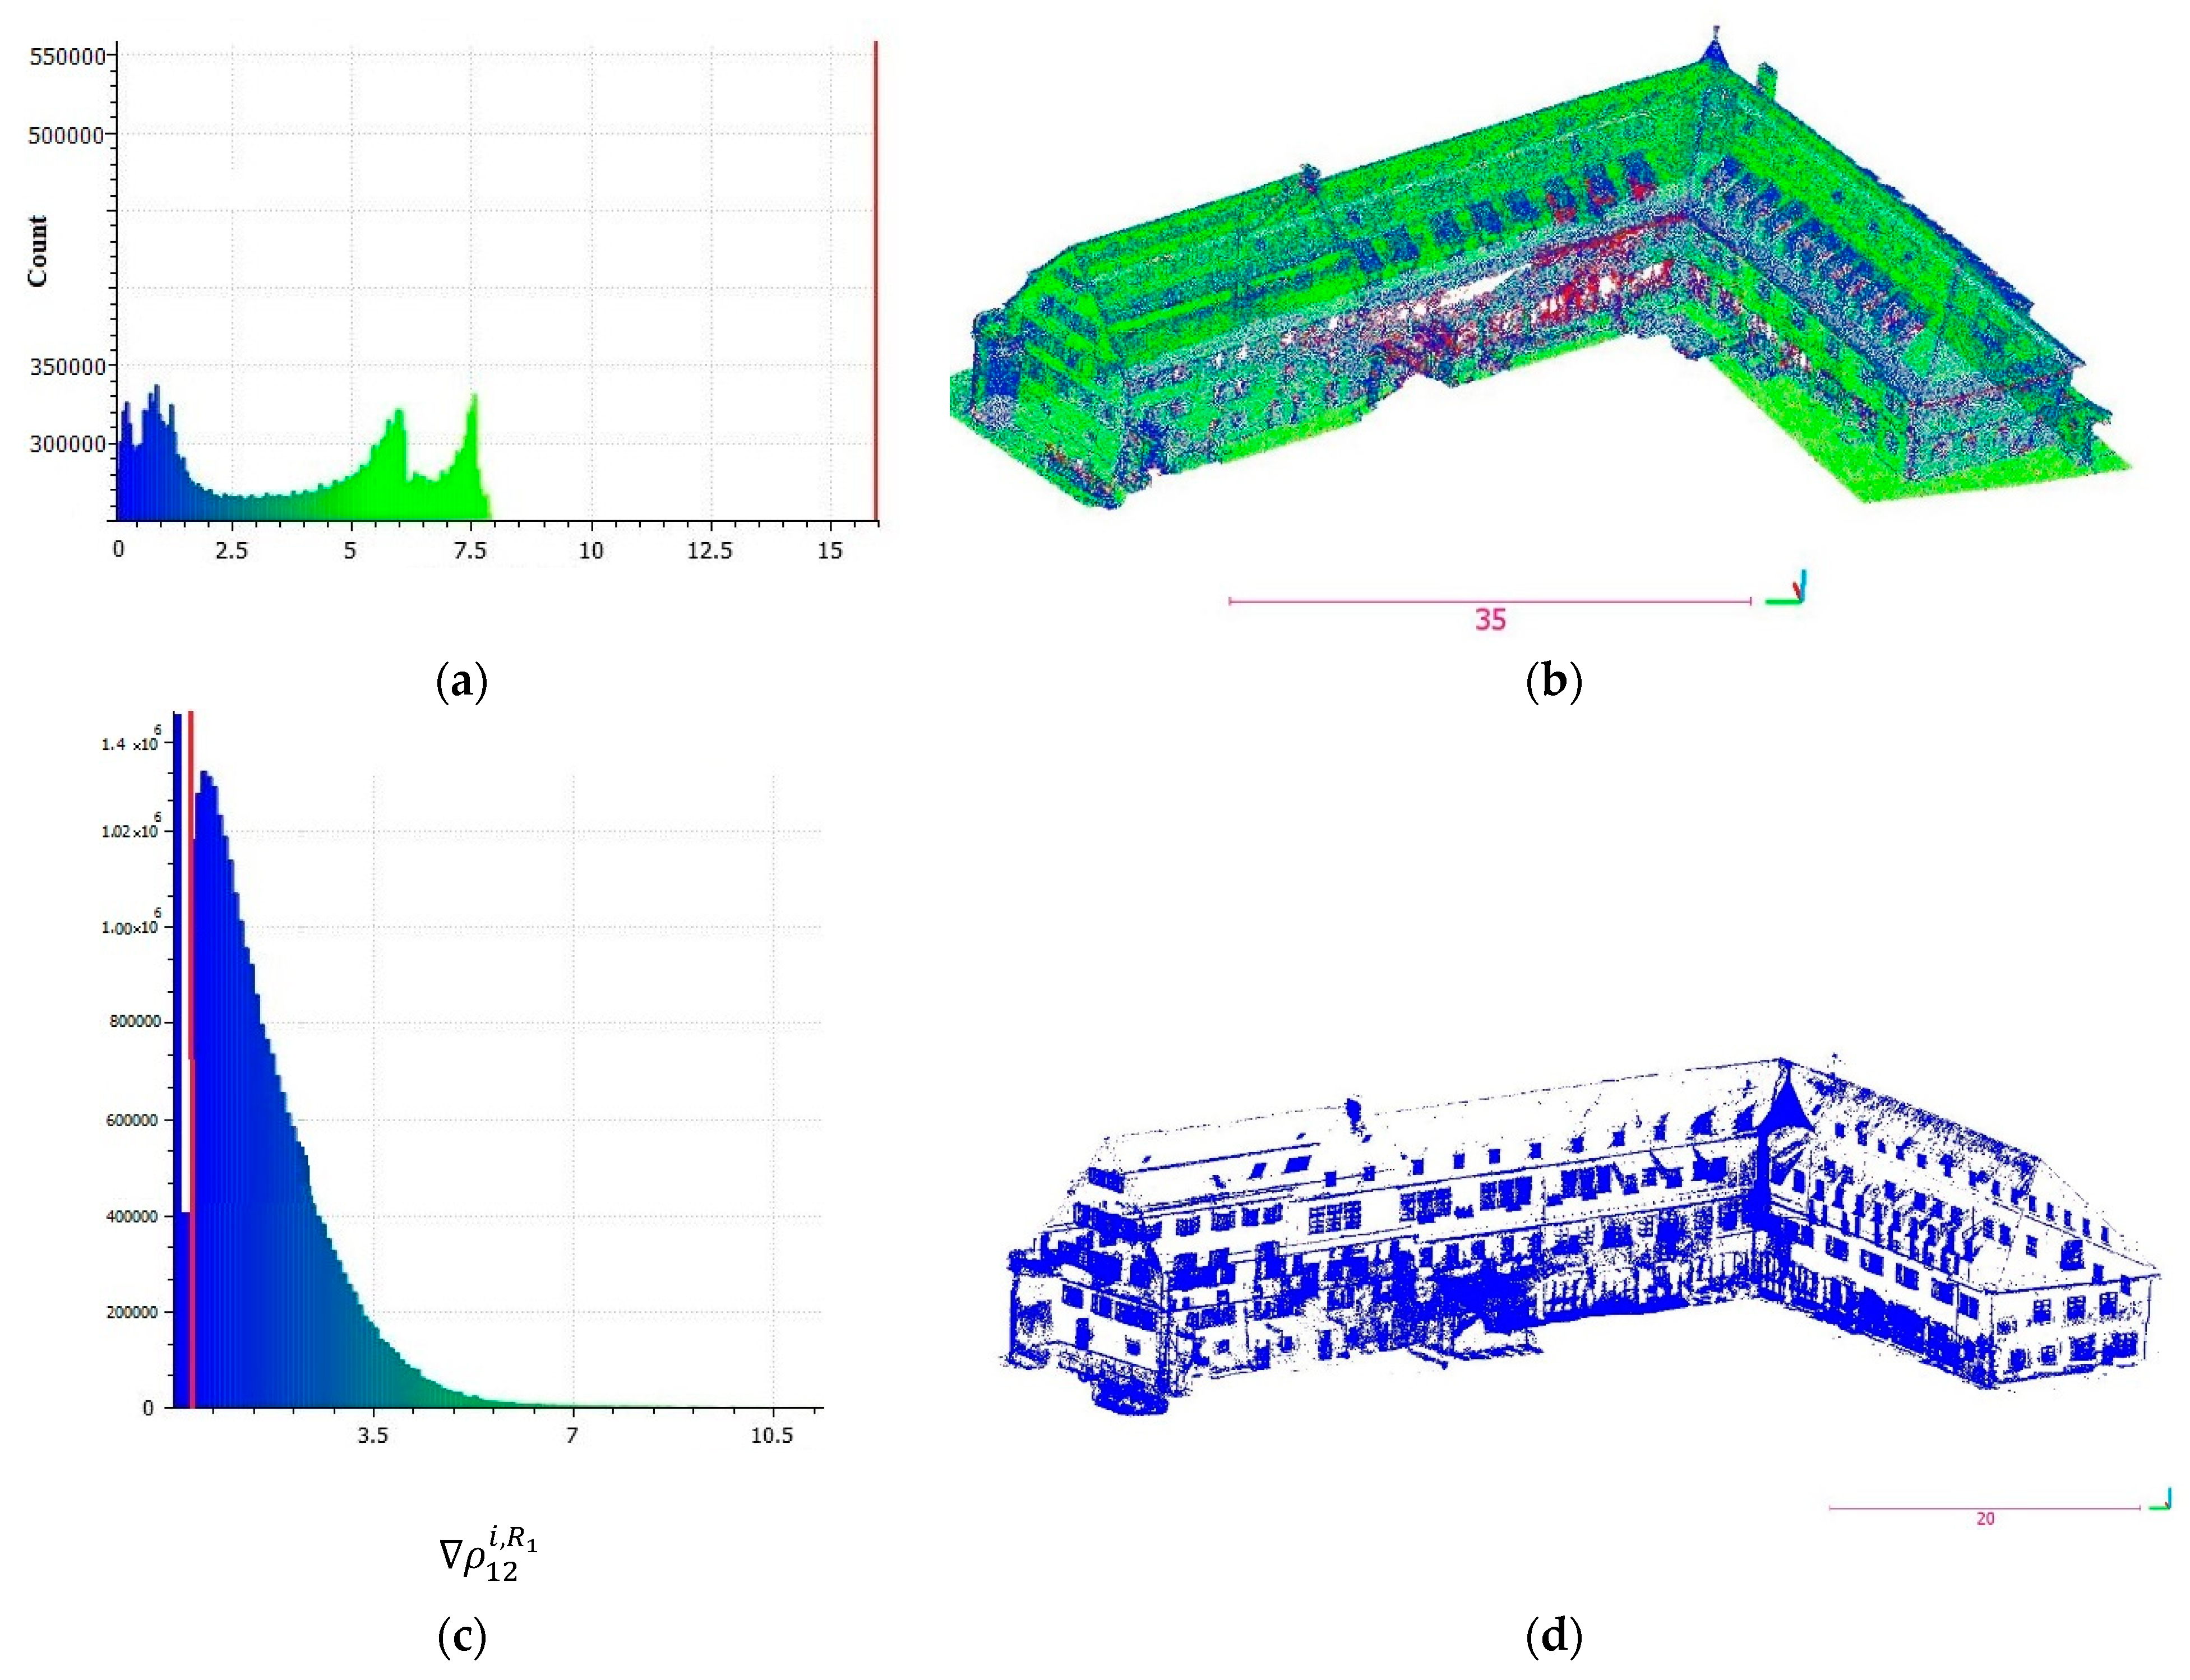
are the number of points in the feature space. In
Figure 6a, the histogram of
is depicted. In
Figure 6b, the point cloud of the building is labelled correspondingly.
In
Figure 3, local normal vectors around two points near and far from the edges are depicted schematically. Directions of vectors around the point far from the edge are similar. If
is defined as the two-scaled density,
values are remarkably close for these points. Nevertheless, directions of local normal vectors around the point near the edge are varied, especially inside the bigger circle. Hence,
values are diverse for these points. Therefore, changes of
are high on break lines and real/pseudo edges.
Which considering this fact, the rate of changes of
over two points
and
(
) is calculated through Equation (3), in which
is the Euclidean distance of two points. Next, the magnitude of this parameter (changes of the two-scaled surface density of point) over the neighborhood with the radius of
(
) is computed via Equation (4).
This feature is computed for
using a parallel processing server with two Intel E5-2690 processors with 2.6 GHz, 12 cores, and a RAM of 256 GB DDR4. Processes are carried out concurrently in the data level, while utilizing the parallel computing of MATLAB. It lasts 8.4 h for the first dataset and 46.2 h for the second one. By thinning out the points with gradients near 0 (
Figure 6c), the points, which have high gradients and are mostly located on the break lines and edges, remain.
Figure 6d displays the outcome of the proposed global edge detection method.
Sensitivity Analysis of Filtering to the Radius of Density Computation in the Feature Space
The support radius (R) is a determining parameter in the computation of density in the feature space, and it affects the next steps of the algorithm. This is why setting this parameter is analyzed here. Generally, there are two major approaches to estimating normal vectors. Employing a fixed radius or a fixed number of neighbouring points are two main methods to compute the local tangent surface, which is the basis of local normal vector computation.
In order to recognize the local geometry around each point, the density in the feature space needs to be computed in a fixed radius, especially in unorganized heterogeneous point clouds. This is because using different radii results in generating local surfaces in different scales. Big radii demonstrate big structures. While small radii suppress them and indicate fine structures. This is in contrast to some studies, such as [
44], in which radii were computed based on Shanon entropy minimization to raise the distinctiveness of the features.
In
Figure 7, the effect of employing varied radii upon the scale of segmentation in the feature space is demonstrated. In
Figure 7a, using a big radius leads to big clusters and under segmentation. It cannot match the inter-class responses. While in
Figure 7b, a small radius segments the point cloud into very small clusters and cannot arrange the proper intra-class responses. Consequently, they cannot discriminate the clusters on the cross sections completely.
Figure 5a displays the segmentation with a radius of 0.15, which produces segments of each face of the building.
In
Figure 8, the impact of using different sets of radii for the computation of
on the filtered patches of the point cloud is depicted. In
Figure 8a, there is still plenty of clutter and patches on the faces. In
Figure 8b, plenty of pseudo edges are demonstrated. In
Figure 8c, a few points from different patches are kept and most of the points are discarded. In
Figure 6d, windows and major break lines of the building are held using (
) values of (0.15, 1).
The results of the sensitivity analysis assert the fact that noises and clutter are included in the isolated segments if radii are too small. This matter is of importance, especially for photogrammetric point clouds because these data usually suffer in depth from clutter [
45]. In the current data, there is great clutter on the back of windows, on some parts of walls near big windows, and on the walls of dormers. Hence, a small radius cannot remove it. If radii are too big, sparse patches from subsections of the building such as windows and walls remain.
3.2. Window Detection
The filtered point cloud mostly consists of ridges and edges of the roof, walls, doors, windows, stairs, and dormers. A photogrammetric point cloud benefits from color. This non-geometrical feature is usually represented in RGB space. However, color values in this space suffer from high correlation. Therefore, they are transformed into an HSI color space. Afterwards, the algorithm undergoes a color-based two-step selection process and identifies window patches next.
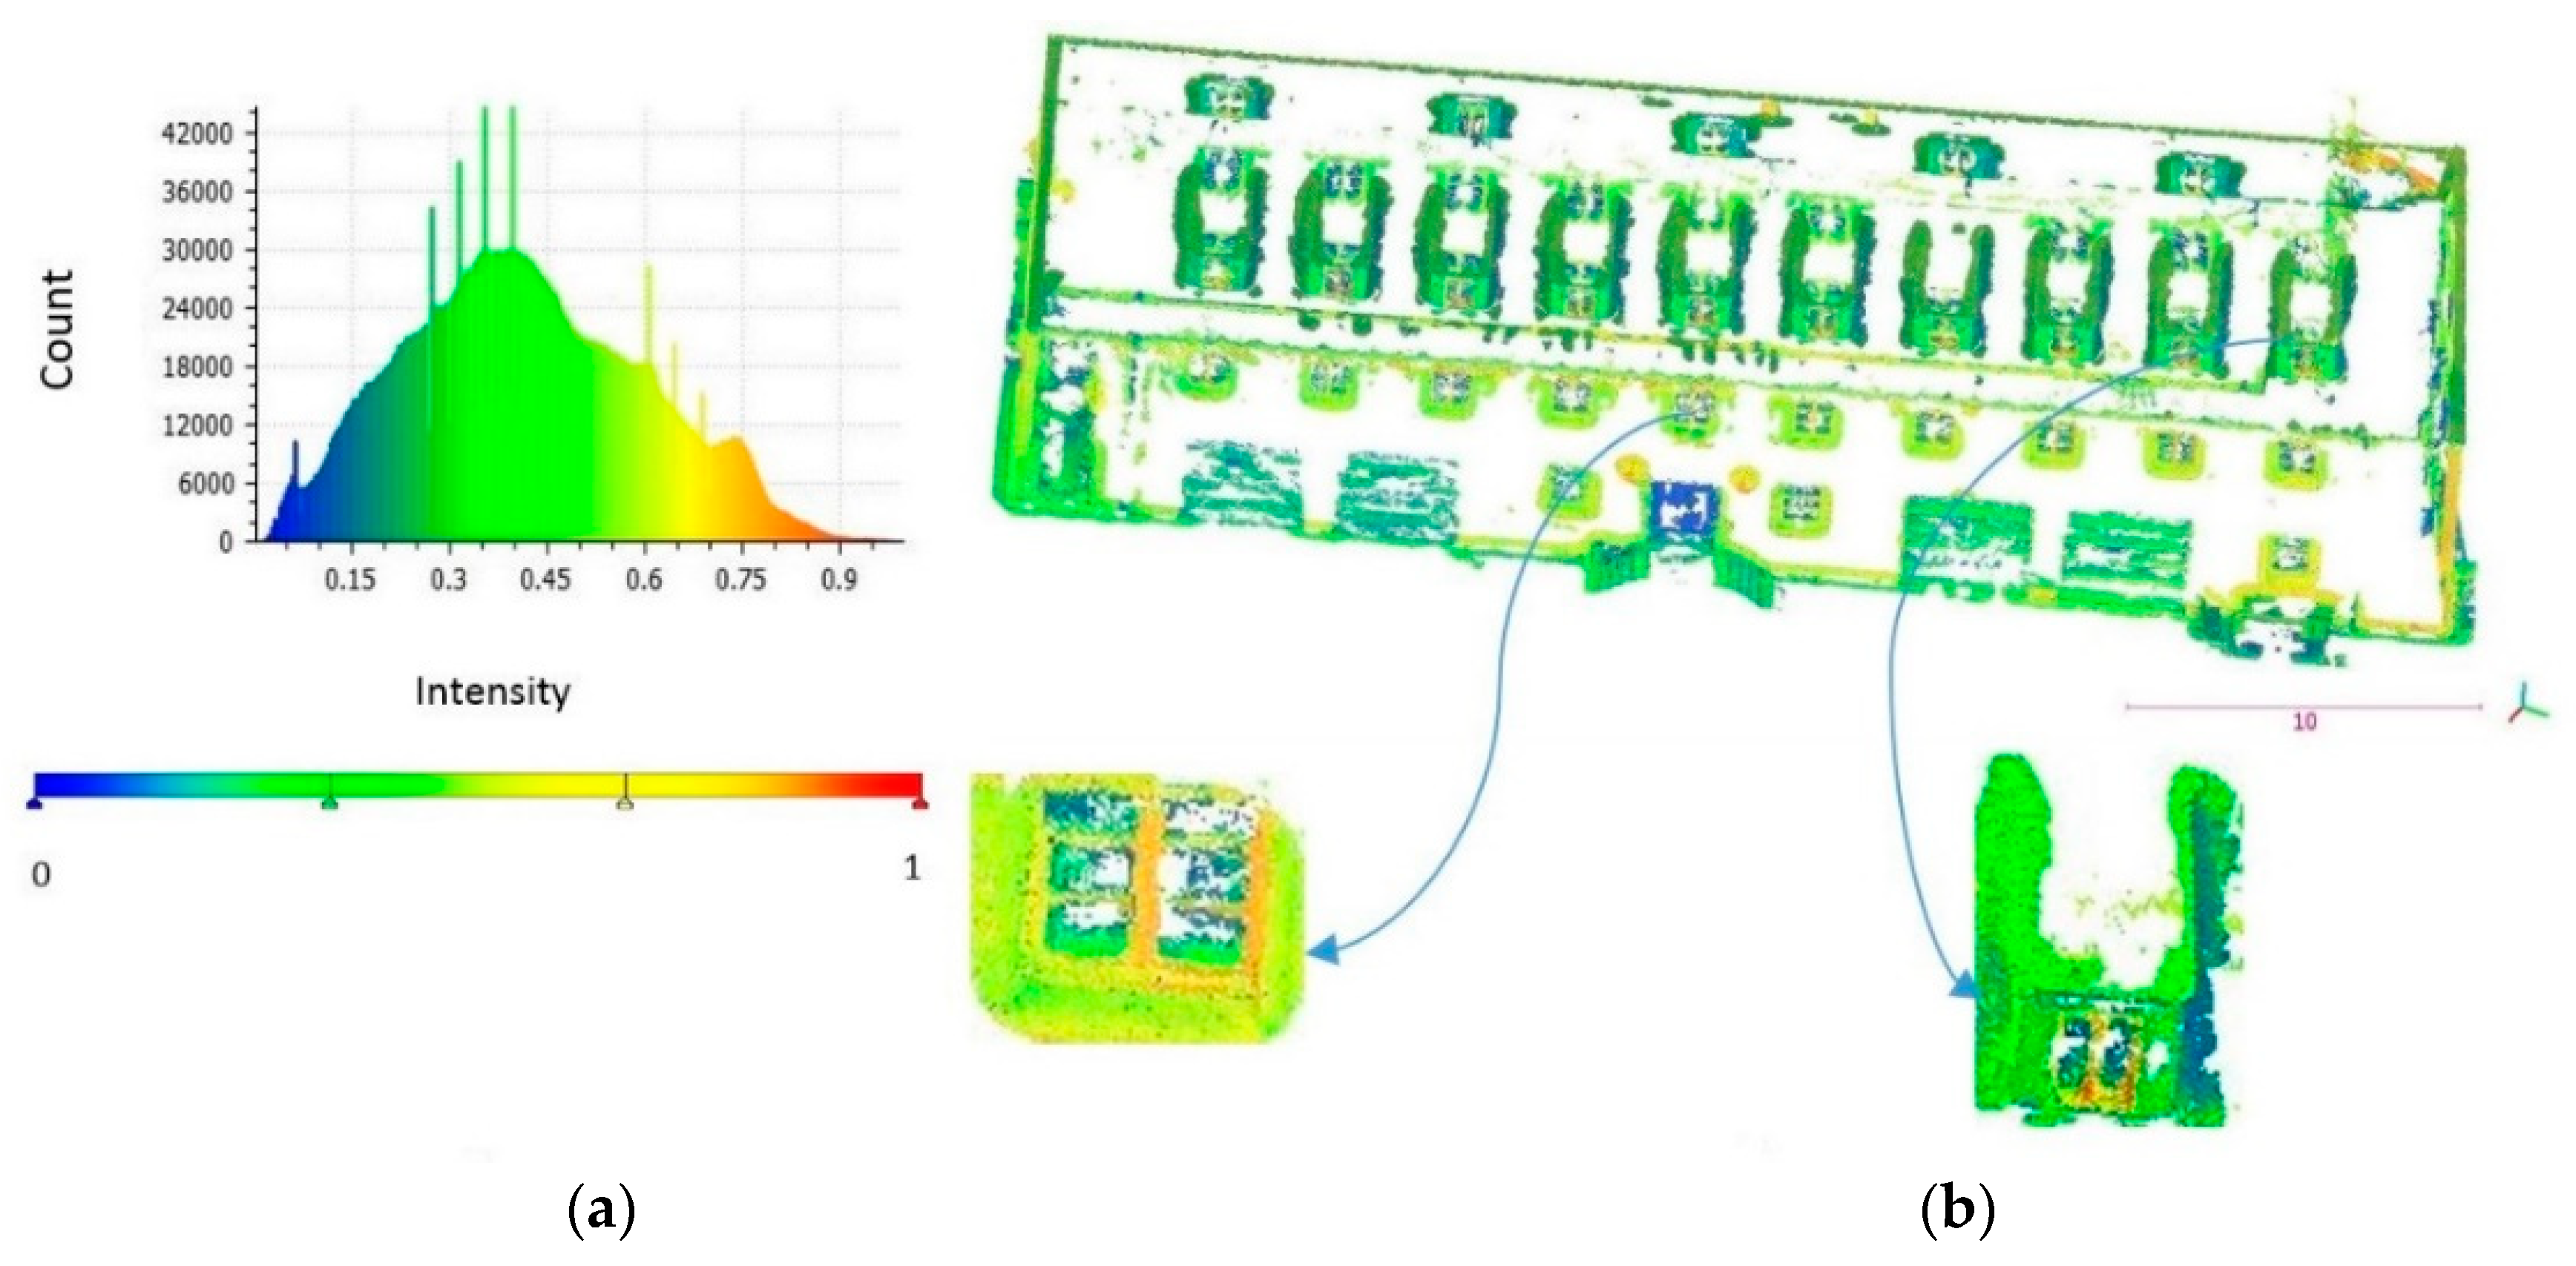
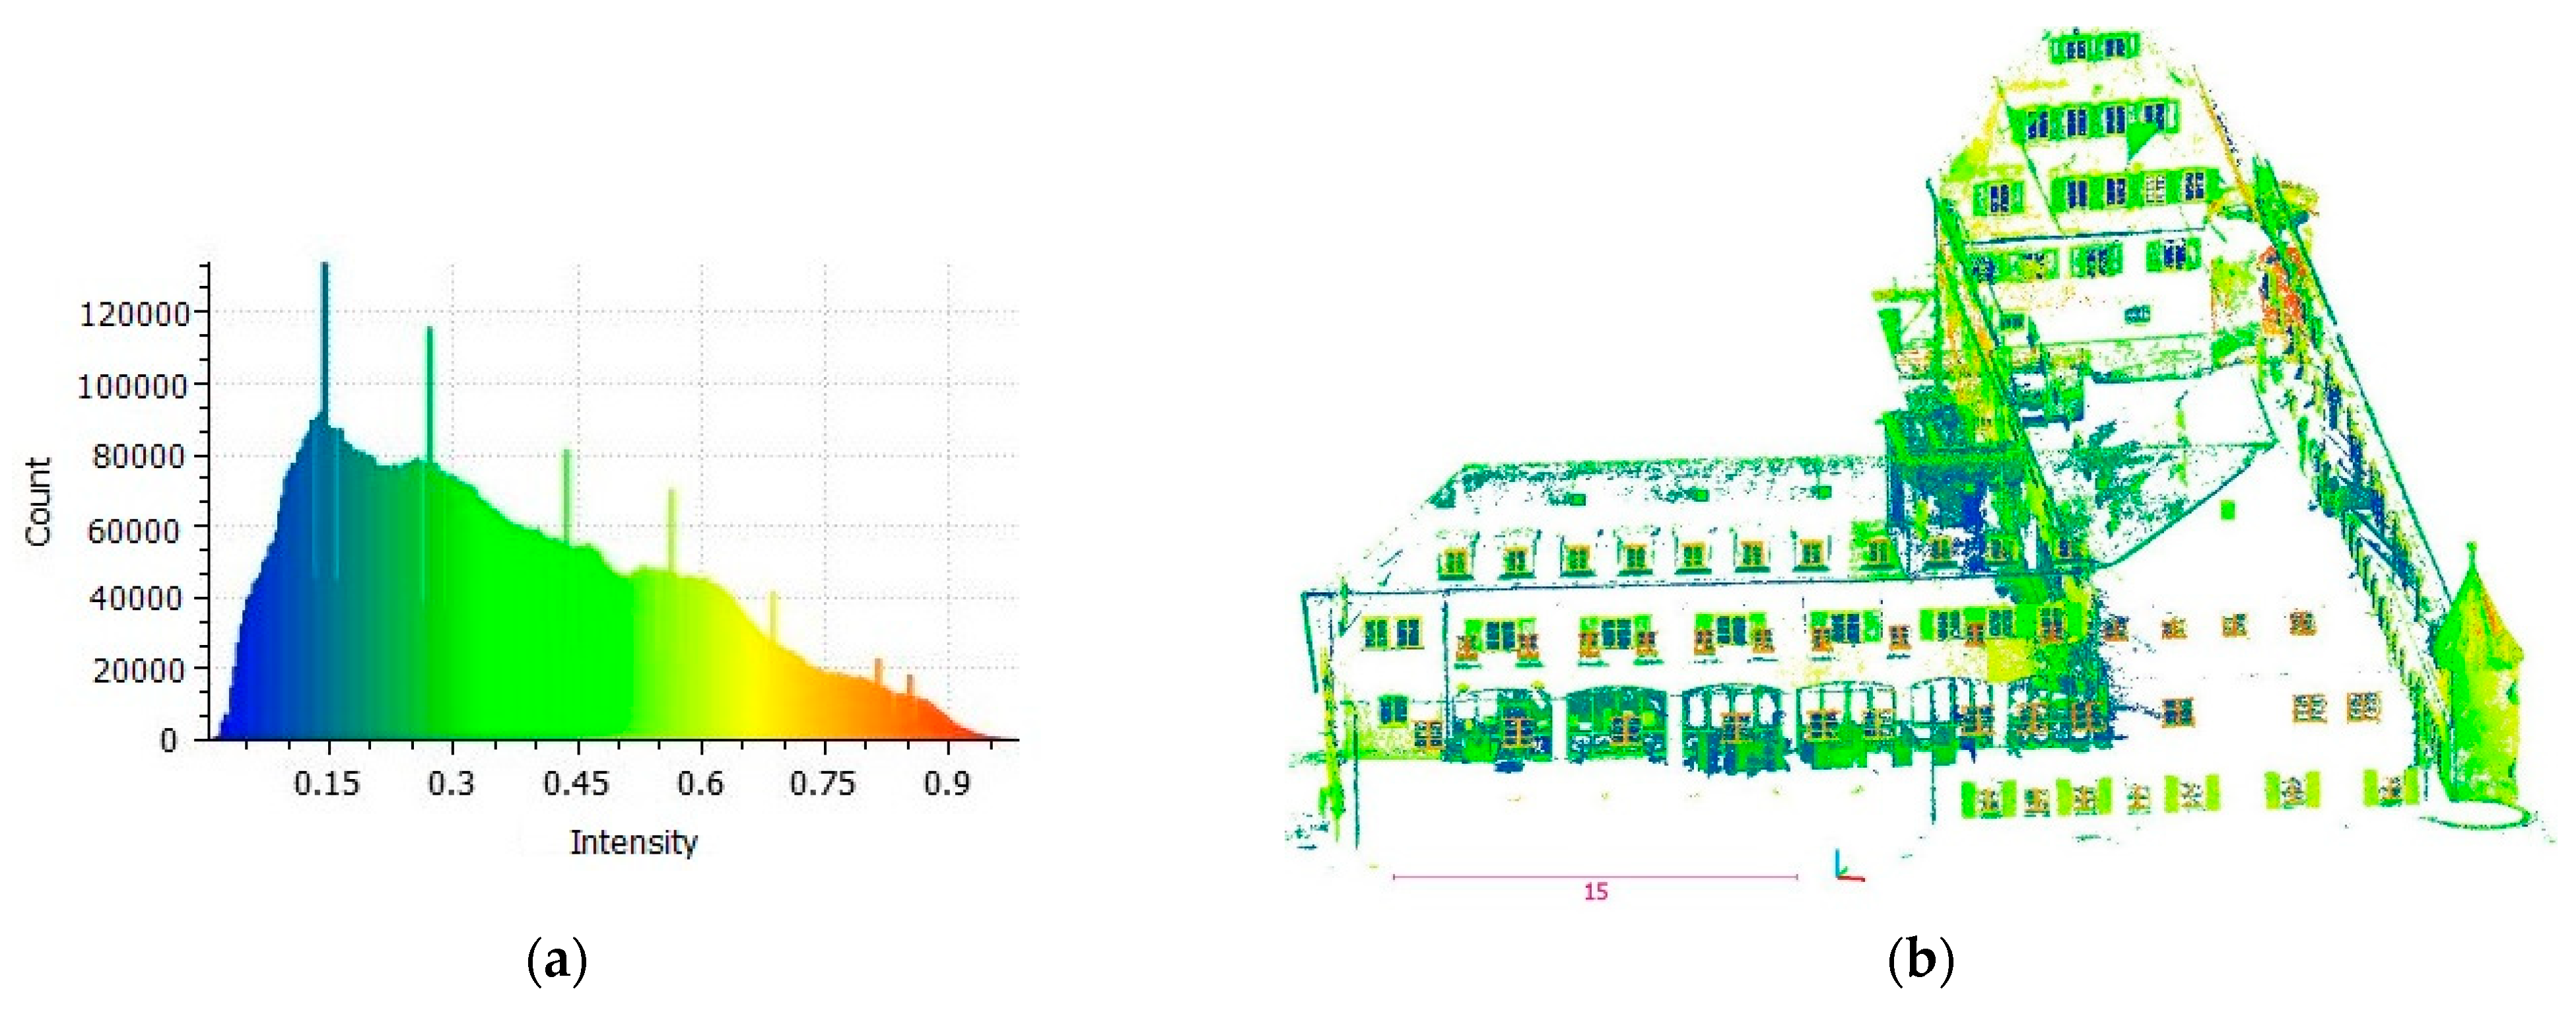
The points, which are generated from what is inside the building, are referred to as the voyeur effect, according to [
46]. The histogram of intensity (I)—namely the amount of each color’s light–is created (
Figure 9a). The voyeur points, which are located on the back of glass or intrusions, occupy the lowest part of the histogram (
Figure 9a,b). Therefore, these points are removed by thresholding.
3.2.1. Perceptual Organization
Perceptual organization concerns the fact that humans perceive the world in the form of objects. According to this concept, individual elements build parts which, in their turn, are grouped into bigger objects. The two main types of organization are grouping and shape. Grouping creates segregated parts within a holistic percept [
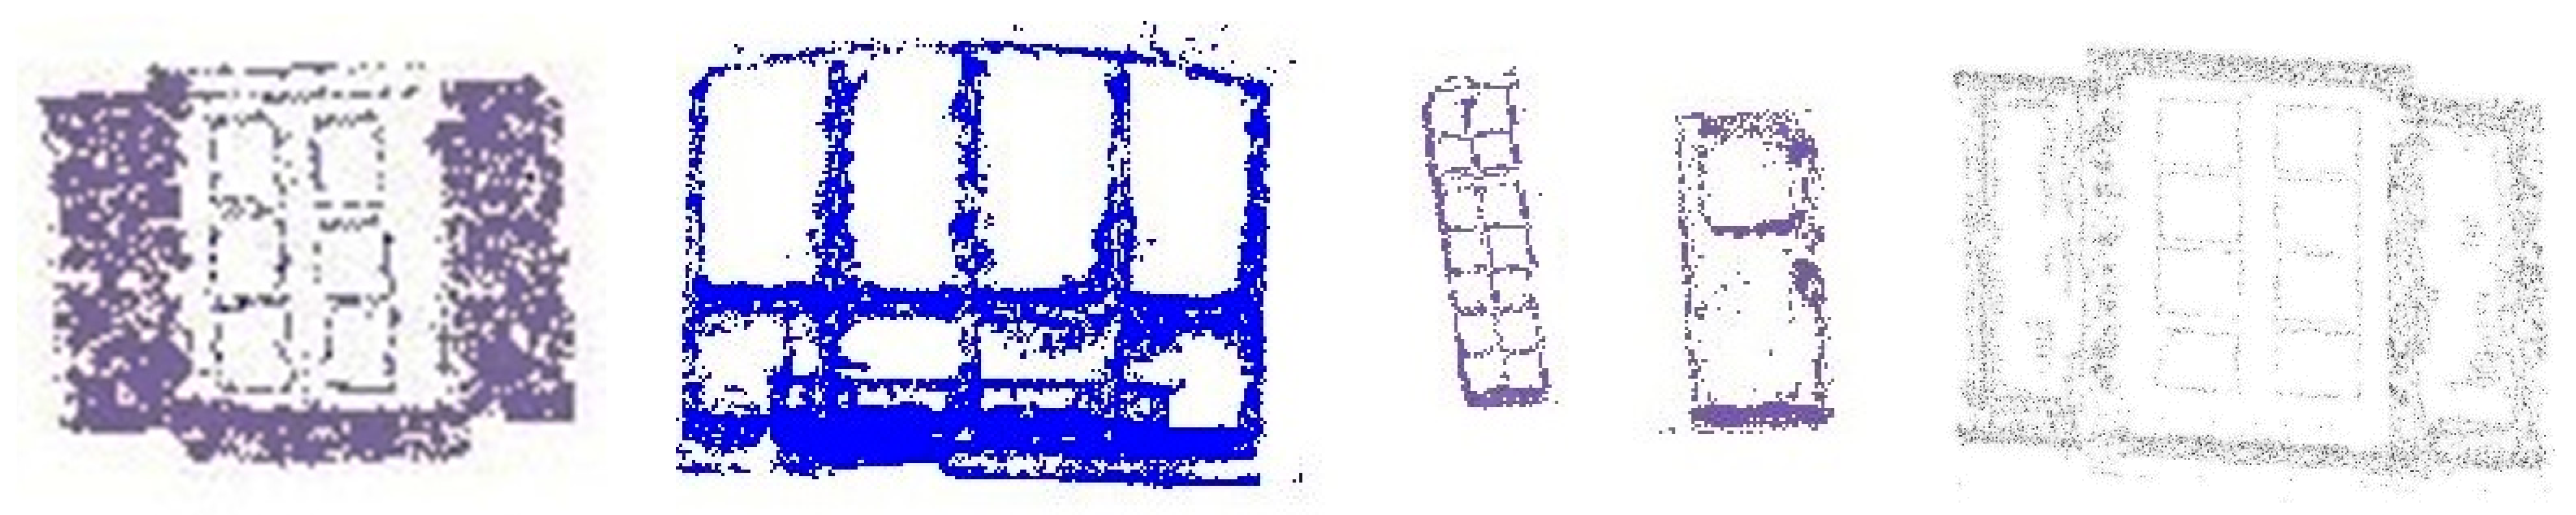
47]. In this study, the law of proximity is applied for perceptual grouping. It states that close elements probably belong to the same group. In addition, the similarity in sizes of groups is utilized in that elements in similar-sized groups are probably the same. Therefore, thresholds for the minimum distance of points and the size of bounding boxes of patches are determined. In this regard, the average density and sizes of windows are investigated. Each patch consists of a group of points that are perceived as a separate whole. In
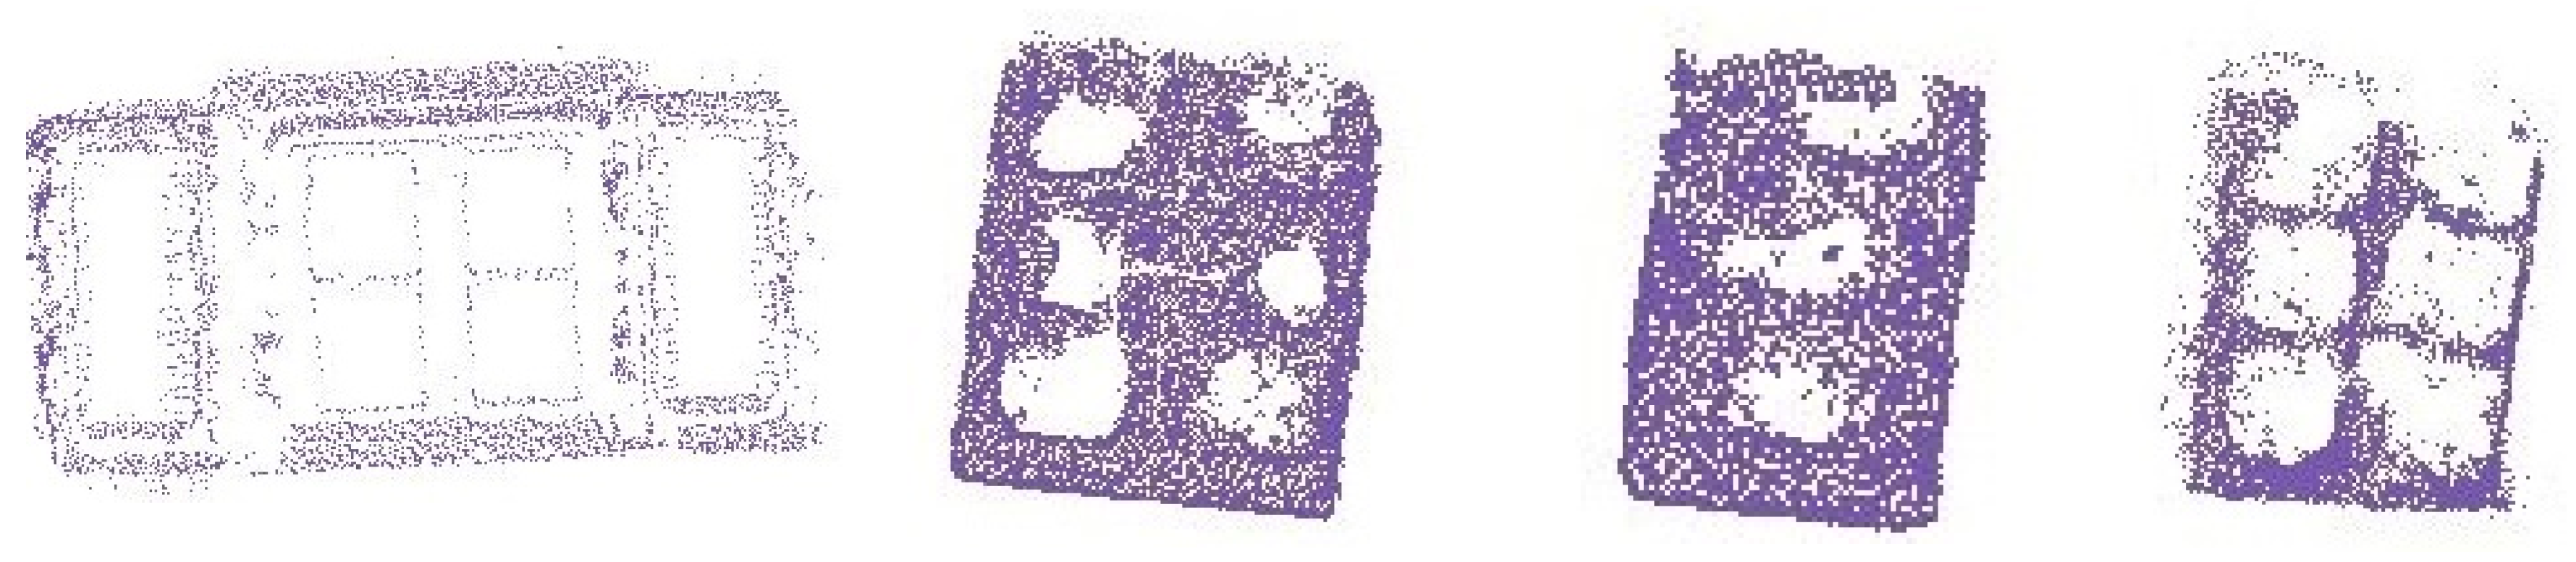
Figure 10, some of the extracted patches are demonstrated.
Another associated concept in perceptual organization is shape. It is the result of a global perceptual process that usually identifies rules to give each patch a form [
47]. The Gestalt principles are employed to define the rules of the shape detection problem and are taken into consideration to detect window patches. Window patches consist of gaps, and their structures are similarly composed of consecutive sub-segments of points and gaps. Hence, the difference in the number of points that belong to these consecutive sub-segments are high. Therefore, by following this pattern, Inequality (5) works out, where
are numbers of a sub-segment in a window patch and in a non-window patch, respectively. This inequality expresses big differences of differential number of points between windows and non-windows patches.
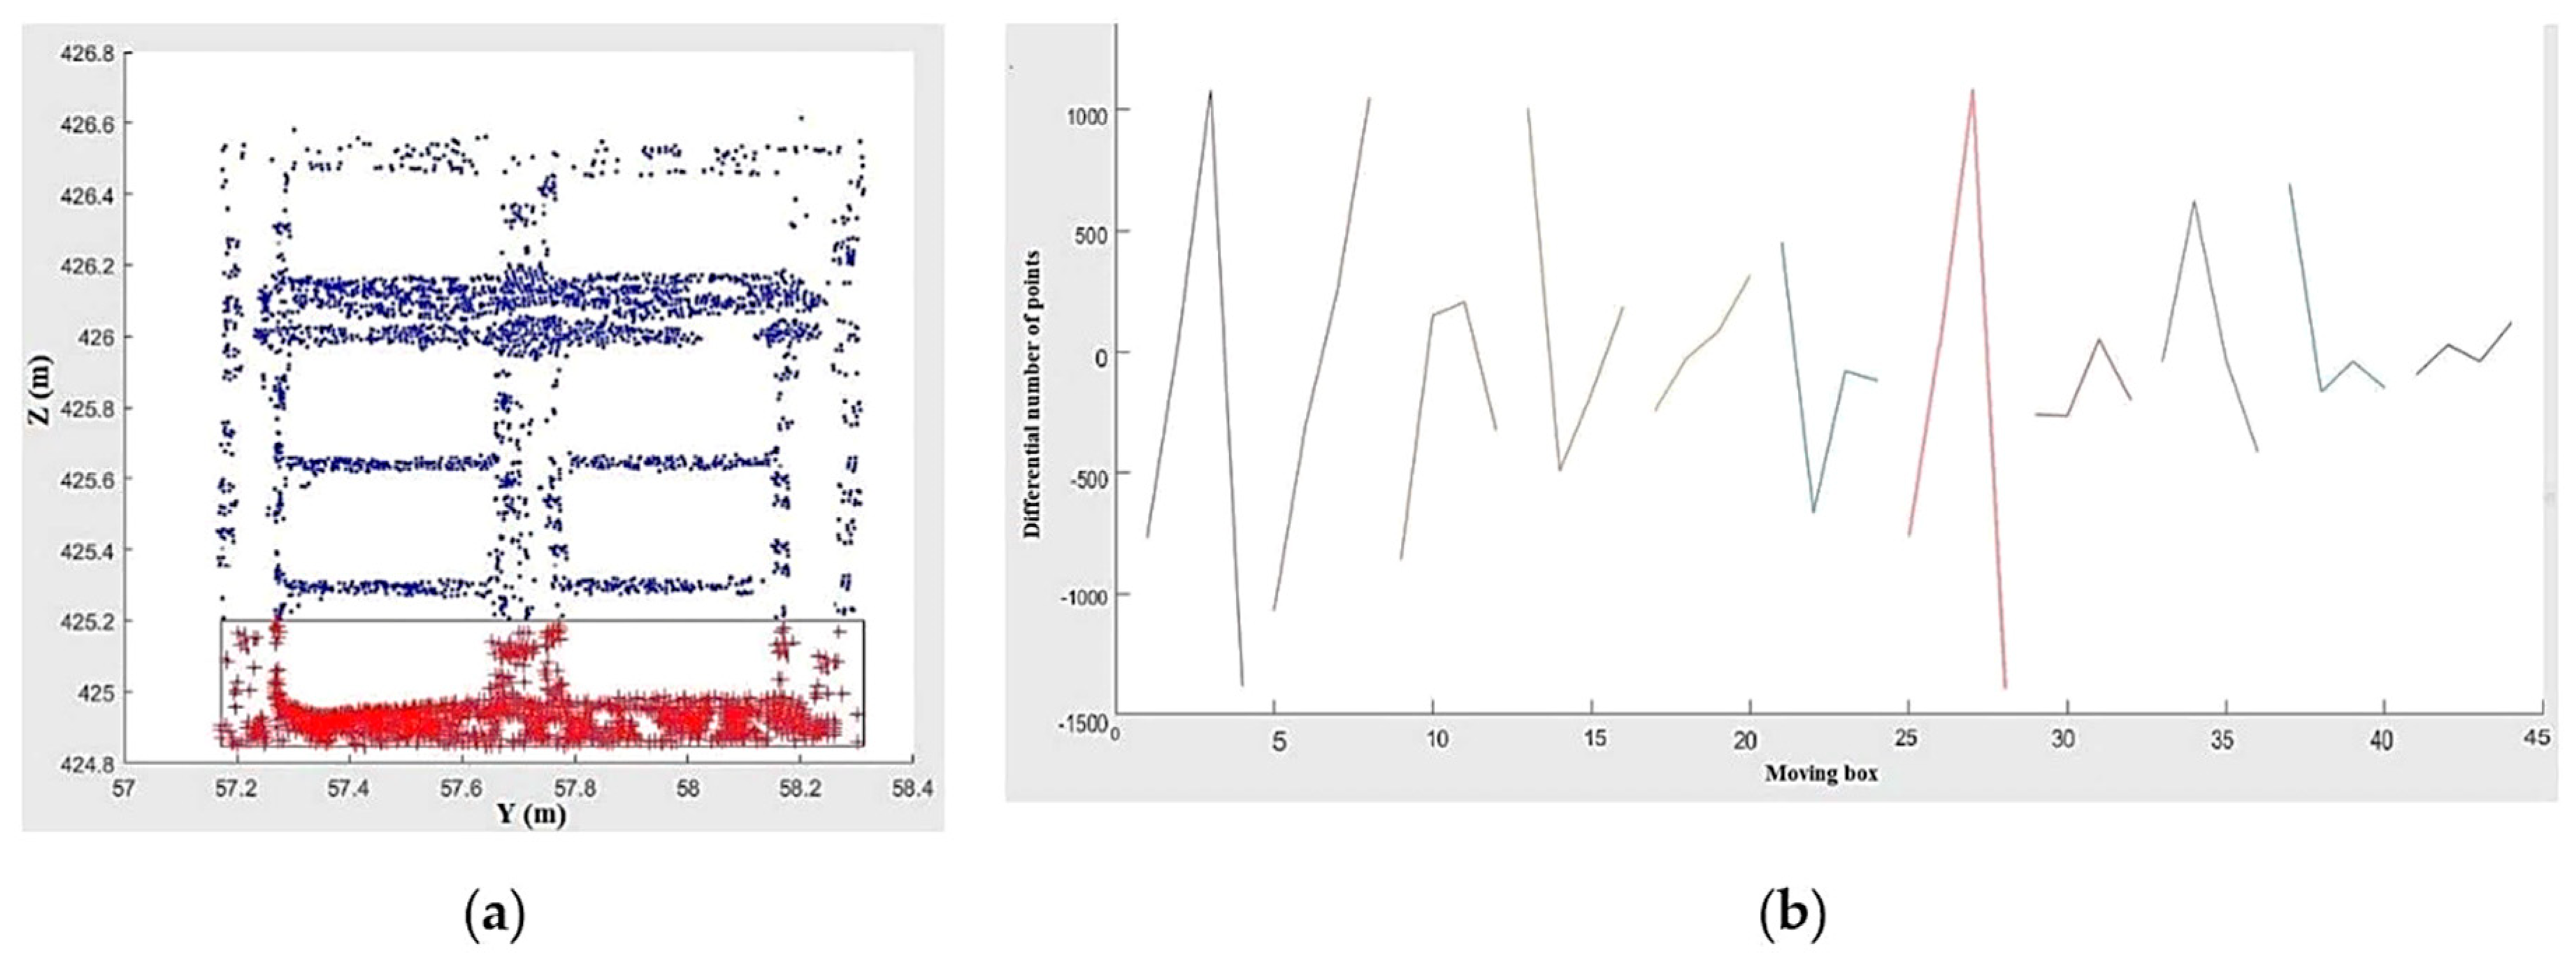
Each patch is divided into several sub-segments using a partitioning moving box, as seen as in
Figure 11a. The width of the box defines the number of sub-segments or steps for each patch. Afterwards, the difference in the number of points in consecutive sub-segments are computed and displayed in the diagram of
Figure 11b.
In this diagram, each patch is segmented into 10 parts and displayed as a separate zigzag line. Except for two last zigzag lines, each of the lines possesses at least one big difference or leap. Apart from these two latest lines, which belong to a wall and a door, the difference between the maximum and minimum of other lines are large or have several large leaps. Therefore, the patches with repetitive big differences or leaps can be windows. However, this matter depends on the size of the moving box, which is utilized to divide patches.
3.2.2. Sensitivity Analysis of Window Detection Approach to the Size of Moving Box
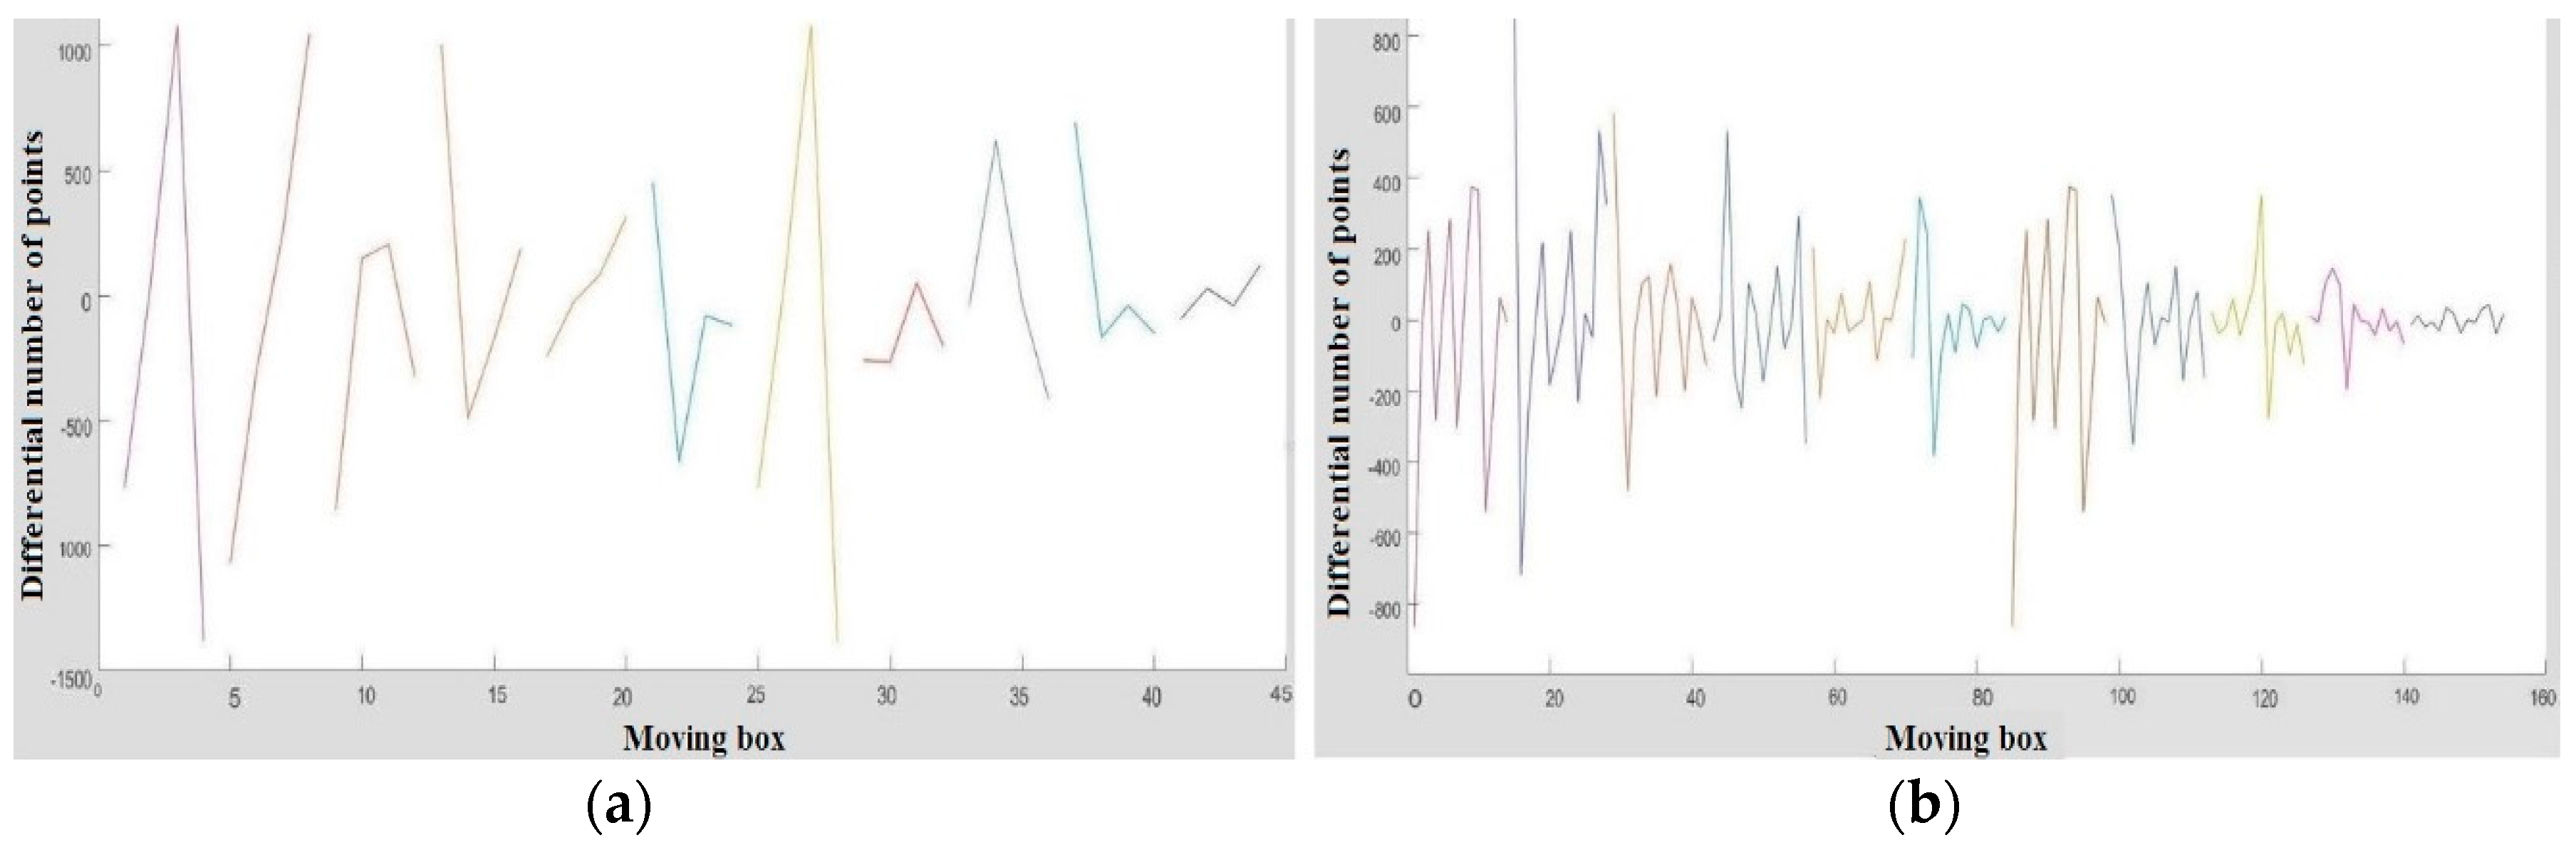
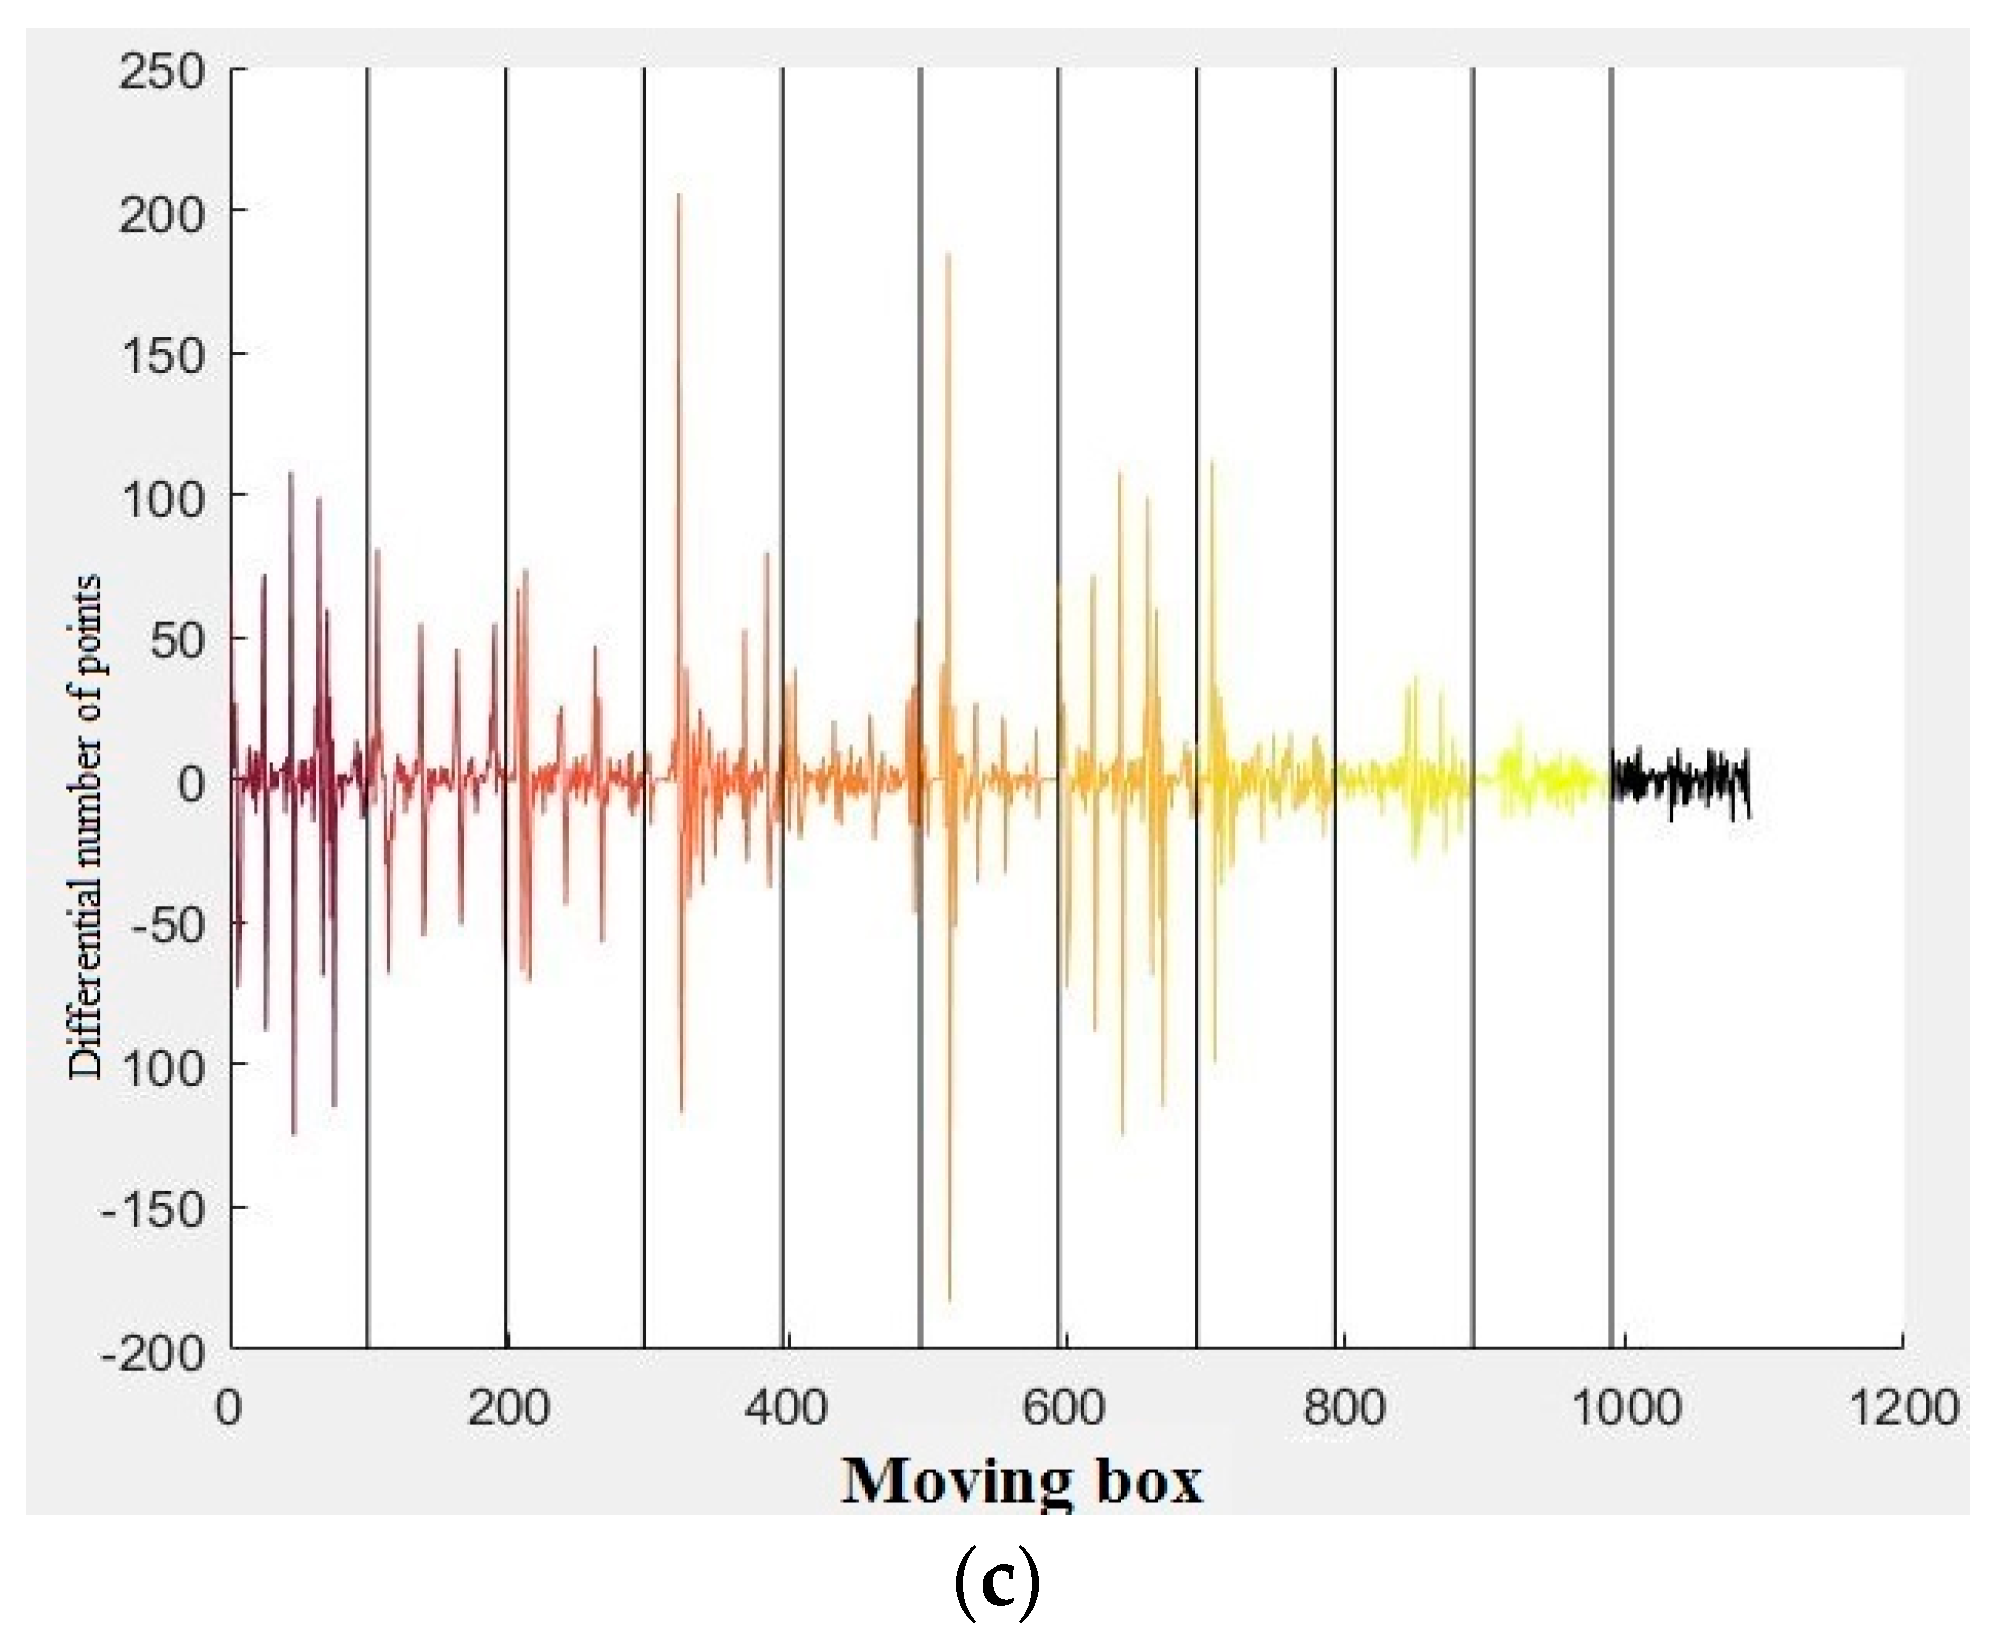
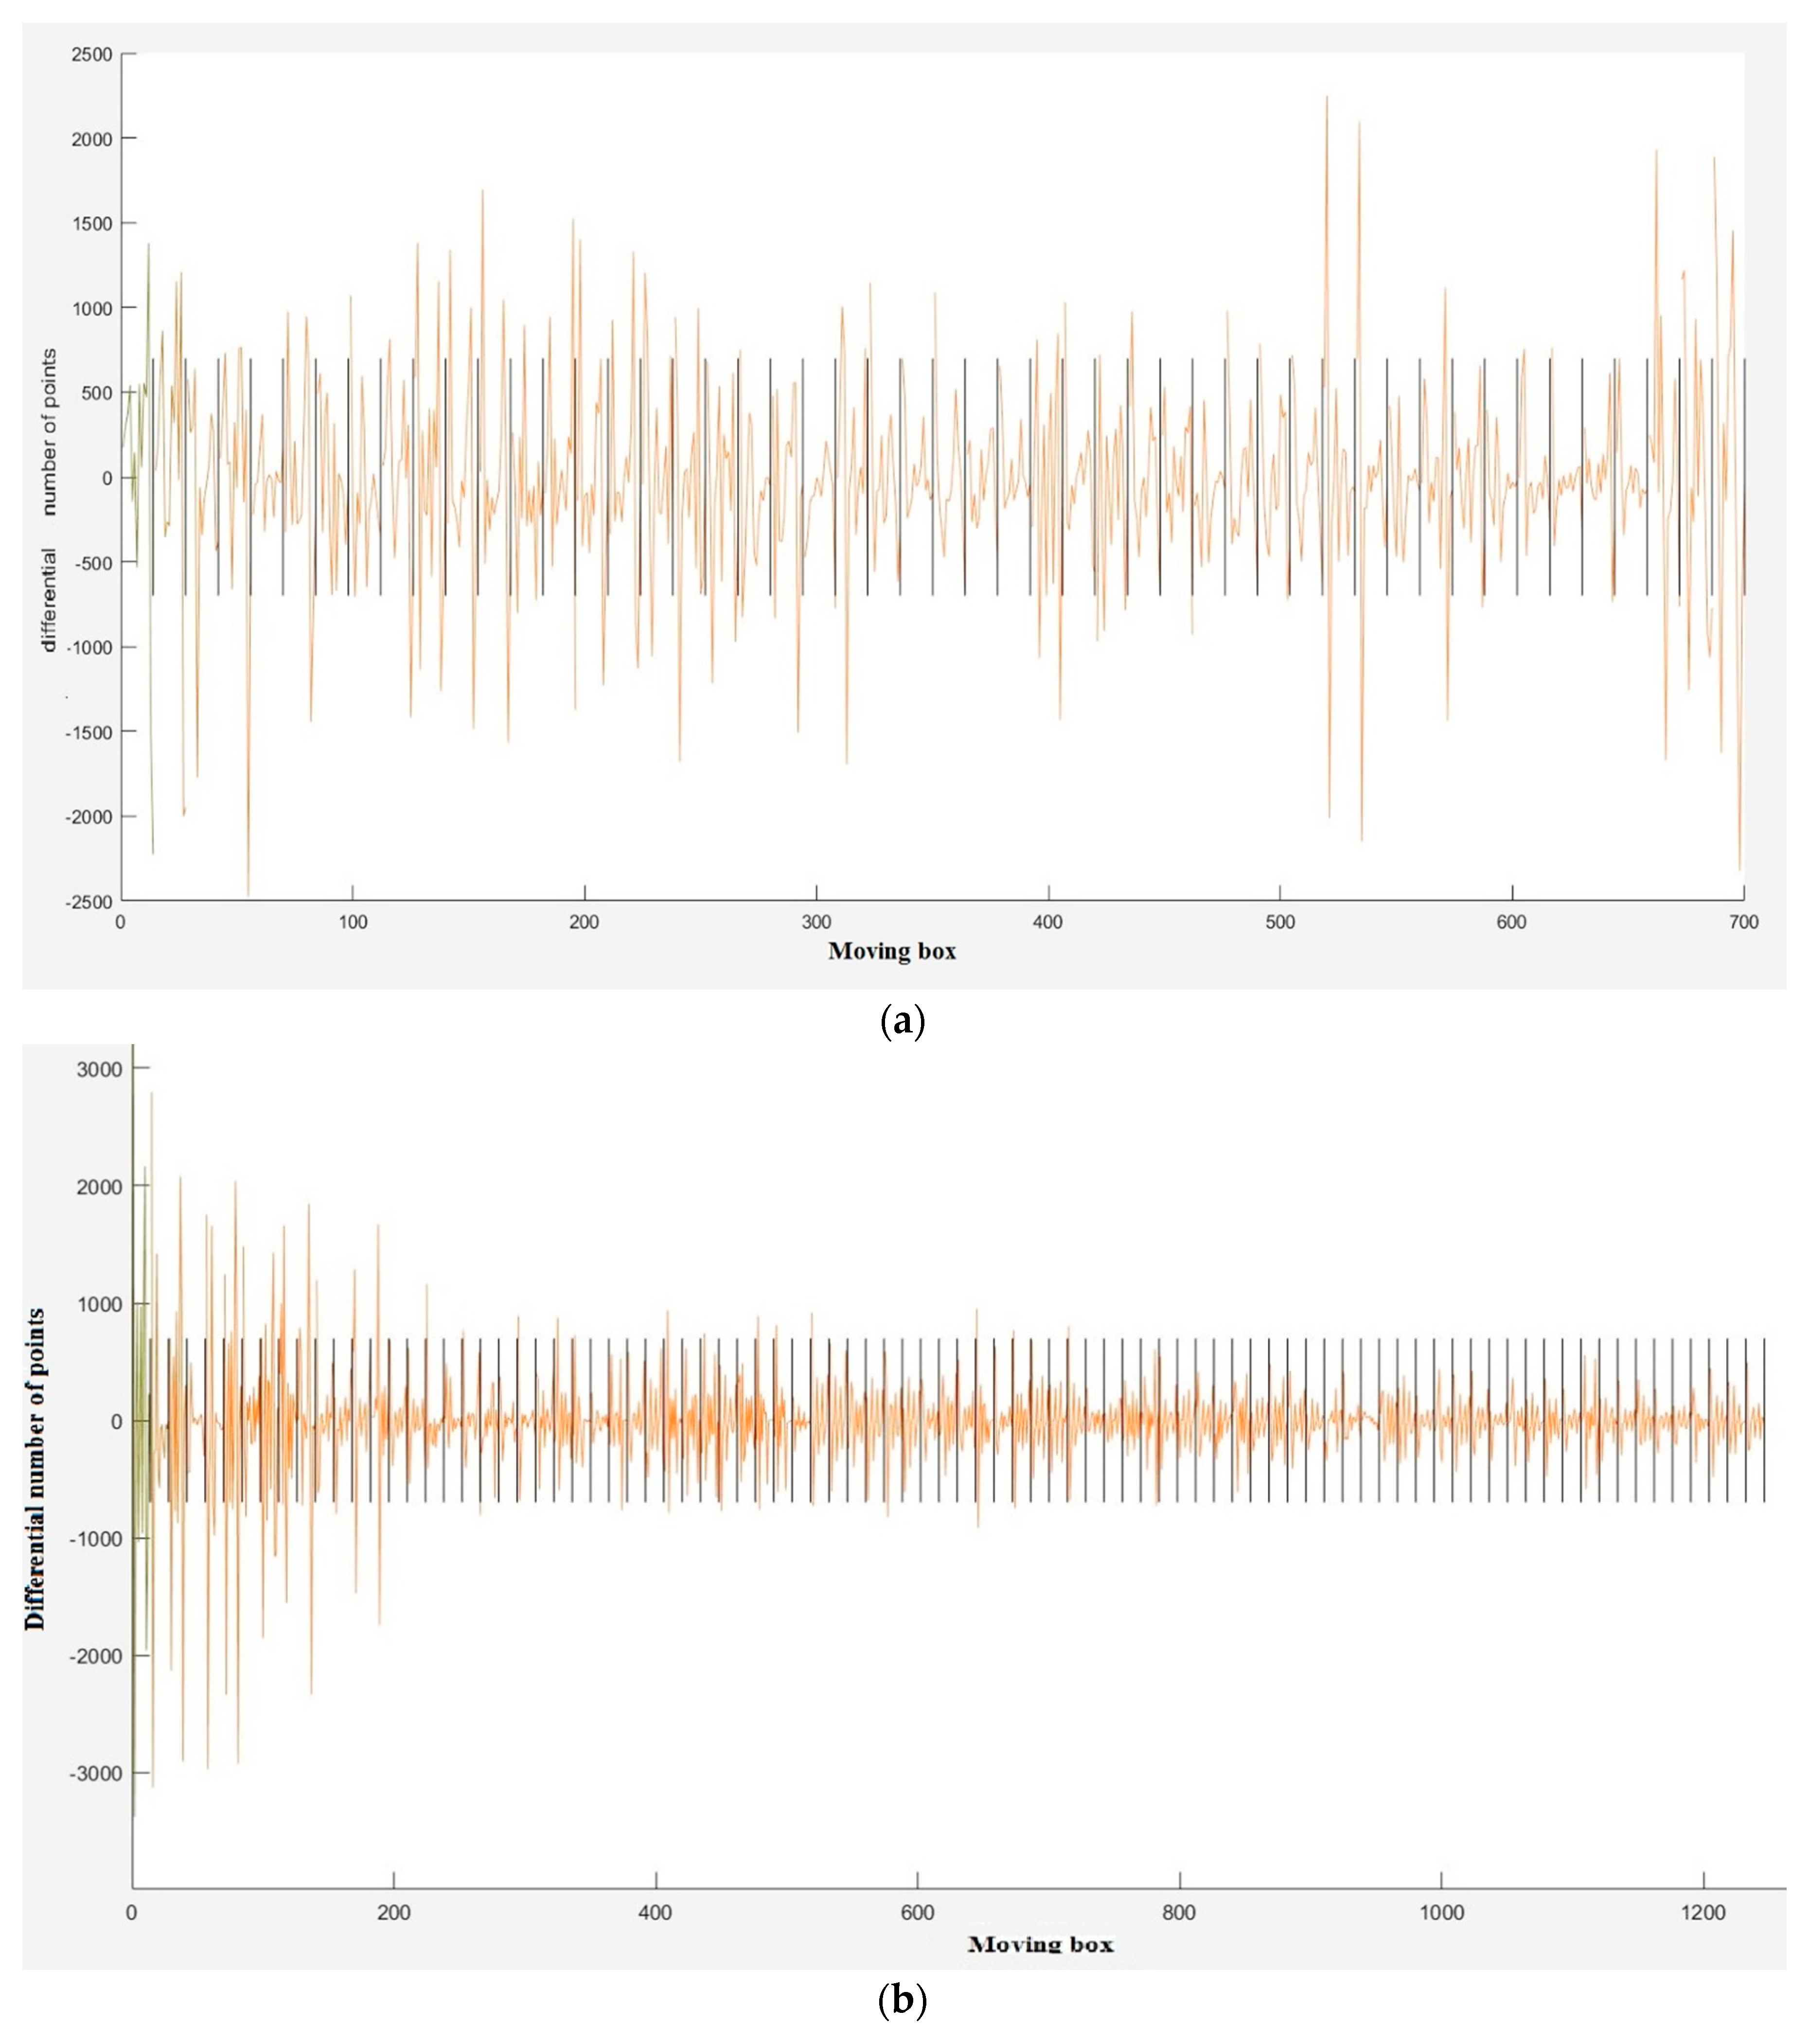
In order to evaluate the influence of the size of moving box parameter on the results of window detection, sensitivity analysis is carried out for a number of window and non-window patches. Next, the computed input parameter will be used for the rest of the data, in the experiments section. In diagrams of
Figure 12, the differential number of points for consecutive sub-segments of the patches, employed for
Figure 11b, is depicted with three different steps.
With the adoption of the proposed criteria for the assessment of object detection in [
48], the detection approach can be evaluated based on correctness and completeness. These criteria are computed via Equations (6) and (7). In these equations, true positive (TP) is a window patch that is detected as a window by our method, false positive (FP) is a non-window patch that is detected as a window by our method, and false negative (FN) is a window patch that is not detected as a window by our method. The number of patches are denoted by
.
The results of the evaluation are listed in
Table 1. The results of completeness demonstrate the sensitivity of the algorithm to the width of the moving box and discover the fact that increasing the steps does not lead to an improvement in the detection process. This is because, on some window patches with low density or windows with shutters, narrow partitioning results in a few points in each sub-section. Consequently, their differentials are near to that of non-window patches. According to
Table 1, using 15 steps is the best choice for partitioning. This will be utilized to carry out the rest of patches partitioning.
4. Experiments and Results
The method is applied on the second dataset. The second dataset is a high-density heterogeneous point cloud from a complex building block, which includes three buildings with an L-shaped junction. The feature space of local normal vectors and building clustering, through local density in the feature space, are demonstrated in
Figure 13.
In
Figure 14a,b, the histogram of
and point labelling, respectively are demonstrated for radii of 0.15 and 1.5 m. In this diagram, most of the clutter due to the voyeur effect gathered in the separate red bin. Thresholding
(
Figure 14c) leads to the filtered point cloud, which majorly contains building edges (
Figure 14d). They belong mainly to ridges, intersections of walls, window frames, stairs, chimneys, dormers, and items on the ground.
The outcome of the filtering consists of edge and non-edge areas. Non-edge areas are comprised of the remaining clutter inside the building, some parts of towers, installations, small patches of the roof, and walls. The existence of non-edge areas is mostly due to the heterogeneity of the point cloud, which brings pseudo-edge areas. According to
Figure 15, the intensity of the filtered point cloud on the frames are the highest and the intensity on the points on the back of glass are the lowest. Therefore, the points of clutter areas inside the building are removed by thresholding.
Afterwards, the remaining points are analyzed according to
Section 3.2.1. In
Figure 16, the output of the grouping process and some of the segregated patches are displayed.
Employing Inequality (5), window detection is carried out with 15 steps for the partitioning process. Therefore, patches with consecutive big leaps on the diagrams (
Figure 17) or with big differences between the maximum and the minimum are identified as windows.
To evaluate the window detection approach, their bounding boxes are determined on the original point clouds as the ground truth. We prefer to perform a pessimistic assessment while considering the ability of the proposed approach in large-scale window detection. Therefore, if at least 70% of points of a detected patch are located inside one of the reference bounding boxes, the patch is considered TP.
If less than 50% of points of a detected patch are placed inside a reference bounding box or it has no correspondence in the ground truth, the patch is counted as FP. If a bounding box does not contain at least 50% of points of one of the detected patches or it has no correspondence among the patches, then it is considered as FN. The evaluation results of both datasets are presented in
Table 2.
In
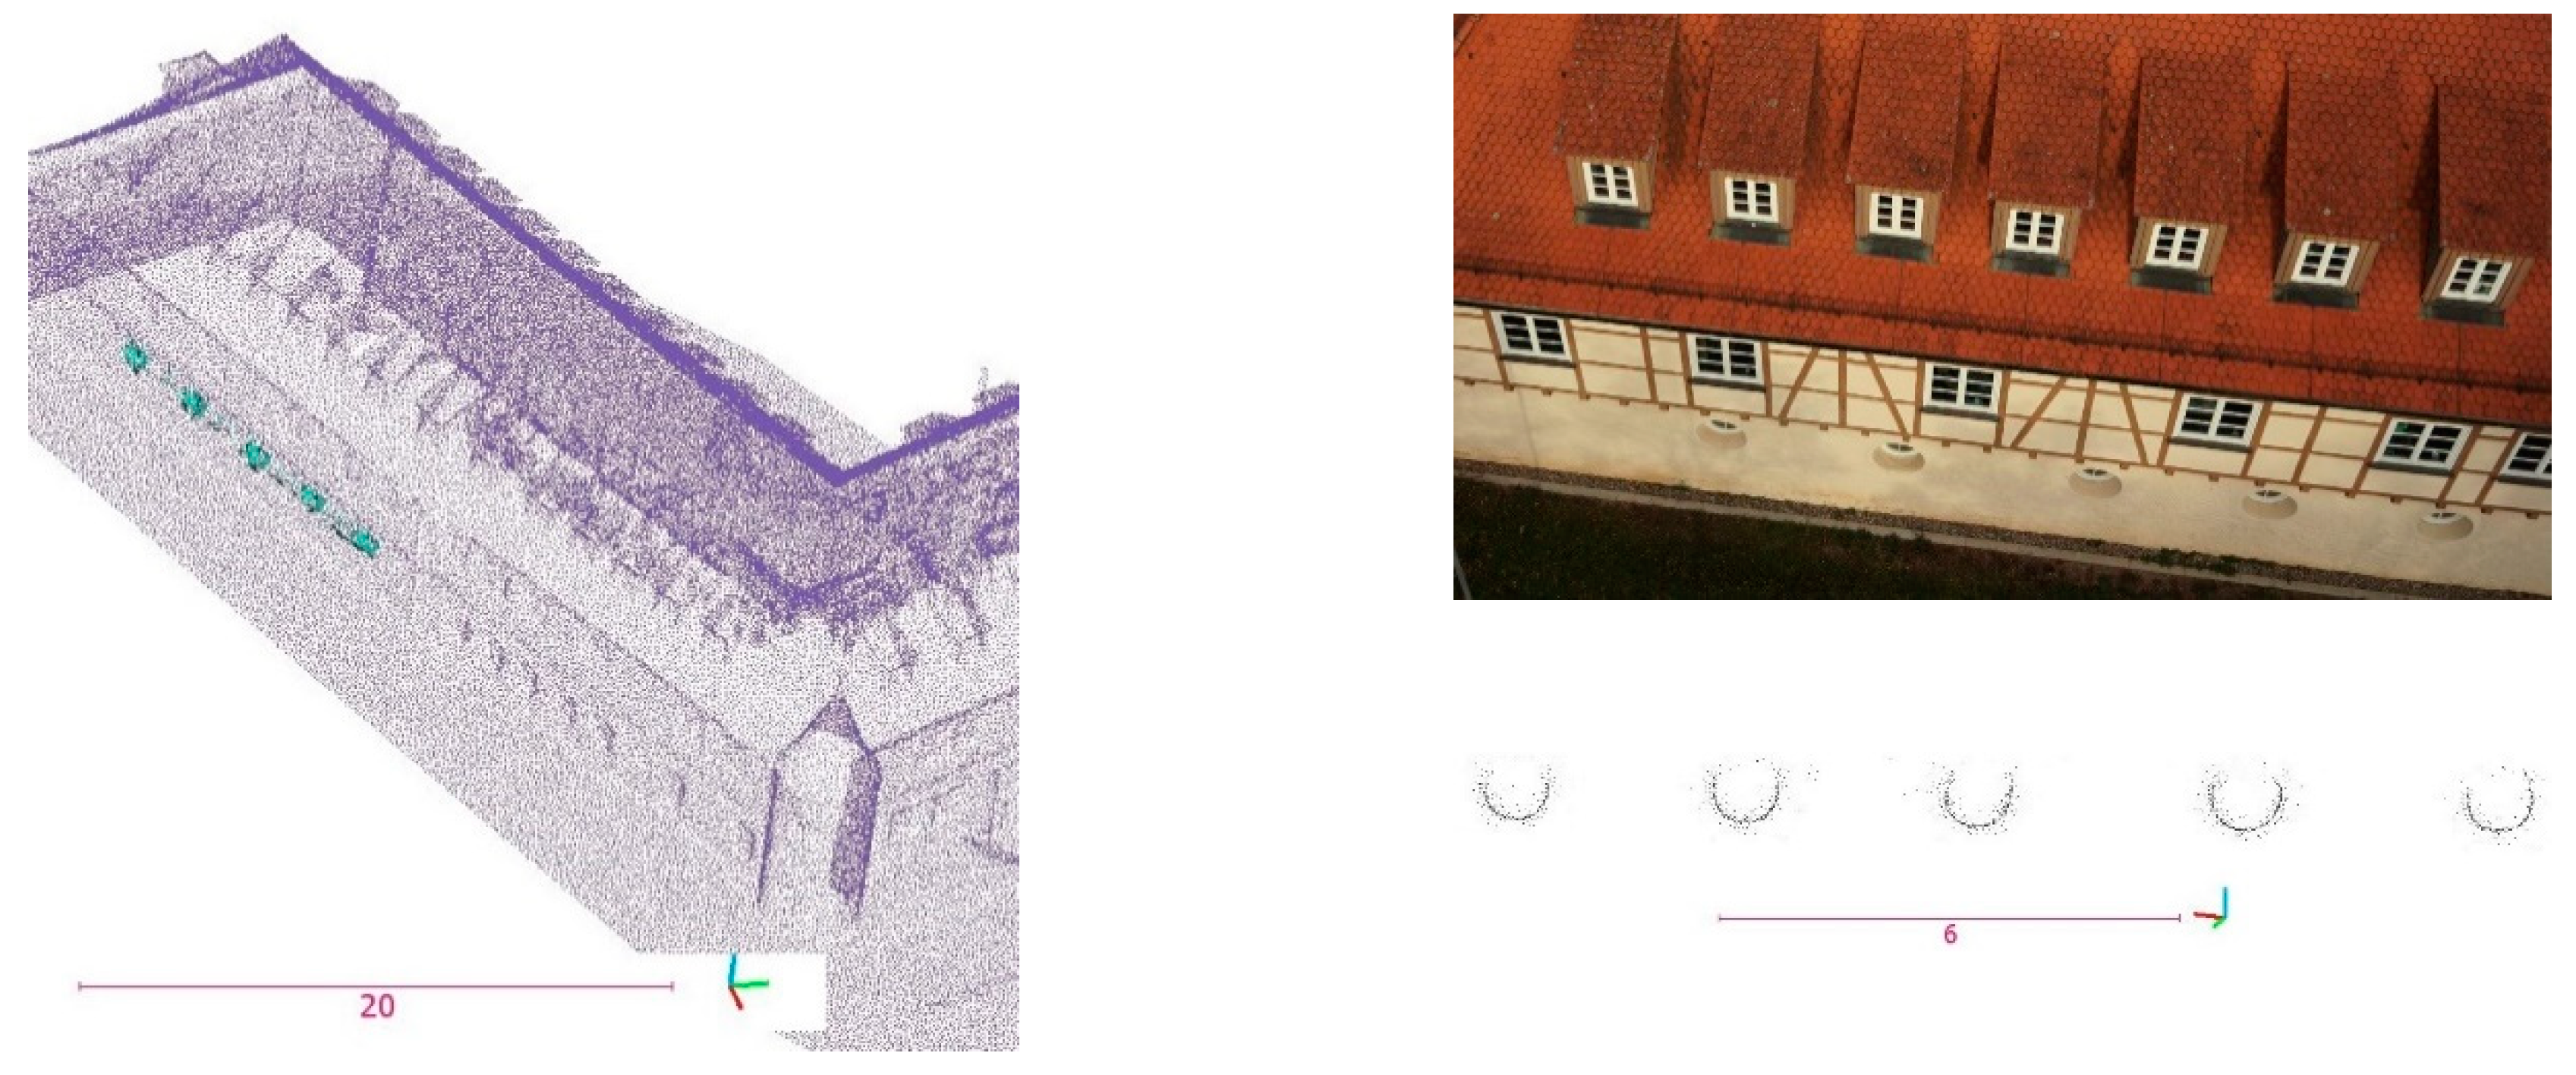
Figure 18 the results of the method are displayed. The extracted patches inside the bounding boxes illustrate the outcome.
In the first dataset, patches of door and scaffolding were wrongly detected as a window. In addition, three windows near the scaffolding were partly detected (less than 70% of points). In the second dataset, patches that belong to the doors and walls were falsely detected. Furthermore, eight windows were partly detected and three windows near the tower and close to the installation and big holes were not detected.
Comparison and Discussion
We examine the proposed approach by comparison with another multi-scale filtering method. This method was proposed in [
26] for the extraction of edges in unorganized point clouds. The critical issue in this method is the selection of proper radii which can reflect the structure of surfaces in two small and big scales. In addition, the tolerance of DoN should be determined suitably to detect intended edges. In order to detect window frames in different parts of the building, several sets of radii are set empirically according to
Figure 19.
After applying this filter using PCL, the statistical outlier removal (SOR) filter [
49] is employed to remove noises. Then, the intensity is utilized to remove the clutter inside the buildings, such as the approach in
Section 3.2. Afterwards different patches in point clouds are segregated, employing the grouping method in
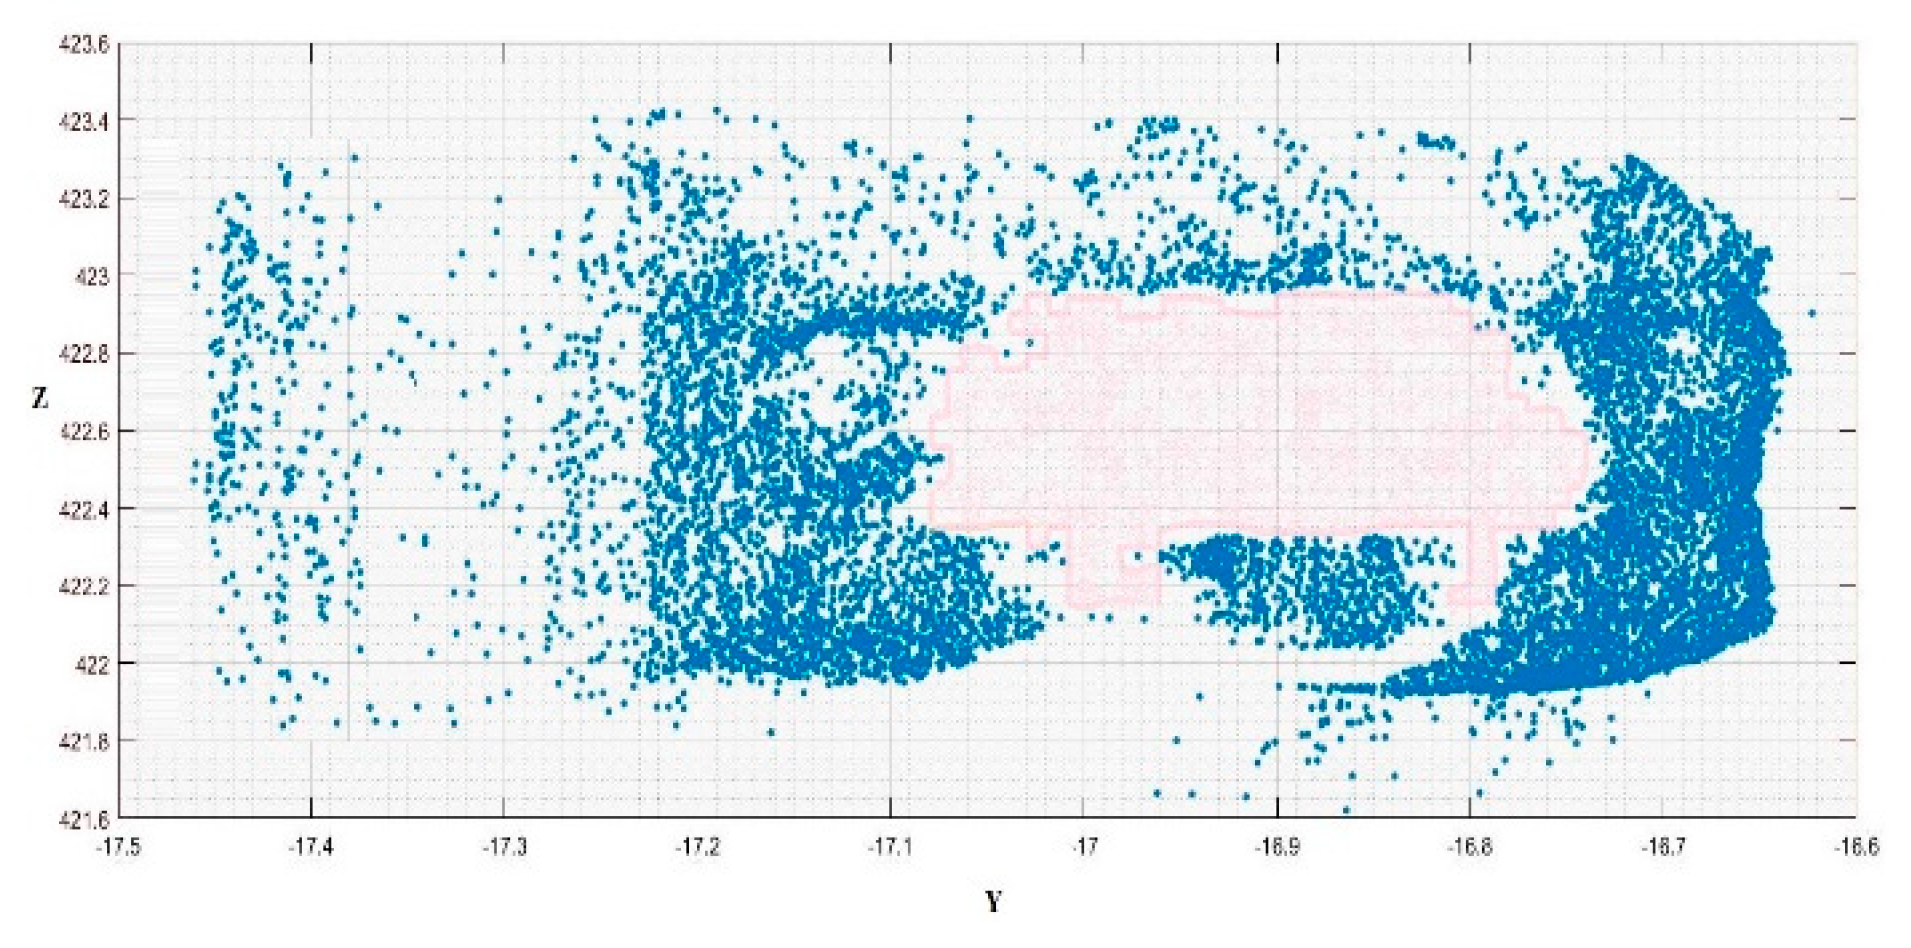
Section 3.2.1. Since the DoN method does not detect points on the middle bars of the frames on most of windows, the proposed method that is based on the Gestalt principles cannot be applied here. Therefore, in order to remove patches of major edges of buildings such as ridges and edges of walls, the method of thresholding the ratio of the length to the width of bounding boxes are applied. However, there are still non-window patches in the remaining points, which are indeed pseudo edges in the light of high variations of point cloud density. A hole detection method in 2D space is suggested to discard these kind of patches so that, in each bounding box, points are projected to the biggest face. The projected points, which are on the x-z or y-z plane, surround a big hole if they belong to a window (
Figure 20). Therefore, the plane is gridded and squares that contain points less than a threshold are counted as empty squares. If the area of all neighbouring squares is more than a threshold, the connected squares generate a hole and, consequently, the patch belongs to a window. This threshold is set by considering the area of glass parts for different windows.
The evaluation results of window detection via DoN, thresholding and hole detection methods are listed in
Table 3.
In the first dataset, six shutters and dormers were wrongly detected as windows. In addition, 18 windows on dormers and partly curved big windows were not detected. In the second dataset, 12 patches of doors, shutters, and dormers and on a tower were incorrectly detected as window. Moreover, 22 windows on dormers and 17 windows on walls, plus three partly curved big windows were not detected.
Alongside these results, a consequence of the DoN method is the partial detection of circular windows (
Figure 21), which is beyond the scope of our method. The relative size of this type of window is small.
The filtered point clouds demonstrates 95% and 96% correctness, respectively, and 95% and 92% completeness, respectively. Hence, it can alleviate the clutter effect and local changes of the point cloud density greatly. However, structures, like the remaining parts of the scaffolding with a pattern of parallelism in dataset 1 and doors with glass parts, are mistaken in the proposed method. On the contrary, the DoN method cannot detect most of the middle window bars and reach 71% and 72% completeness for the two kinds of windows, respectively. Therefore, its function gets into difficulties with the heterogeneous photogrammetric point cloud, which suffers from clutter and holes. The lack of detection of big windows near the installation part and big holes confirm this matter. In addition, it is highly dependent on the determination of radii so that some shutters and dormers, which are neighboring structures of the windows close in size to them, are wrongly detected as window. However, it can detect edges of circular windows. This issue poses a problem for this method, especially in processing various close-sized structures.
5. Conclusions
In this study, patches of window frames are detected within high density cluttered photogrammetric point clouds, as generated from UAS imagery. The proposed approach introduces a density-based multi-scale filter in the feature space of local normal vectors to downsize the data and globally detect edges in heterogeneous unorganized point clouds. Afterwards, intensity is computed from color information to remove the voyeur effect. Next, perceptual organization is tailored and utilized for the grouping and then window patches are detected via the Gestalt principles. The proposed method is compared with a multi-scale DoN filter.
The processed point clouds gained 8% and 7% of the points of the original datasets 1 and 2, respectively, after applying the proposed method. The implementation of the presented filter via parallel processing facilitates spatial data mining for the detection of window patches with ratios of diminution in volume near the aforementioned amounts. The outcome of utilizing perceptual organization for the filtered point clouds displays 95% and 96% correctness, respectively, and 95% and 92% completeness, respectively, in rectangular and partially curved window detection. The presented approach can cope with the clutter effect and local changes of the point cloud density, successfully. However, some structures with a pattern of parallelism or with glass parts impair the performance of the proposed method.
Analyzing different radii in computing in the feature space shows the sensitivity of the proposed method of filtering to this parameter. Determining a proper radius depends on the variations of point cloud density and can be analyzed in ongoing research. Employing perceptual organization acts successfully in window detection. In addition, based on the sensitivity analysis to the size of moving box the determination of proper steps in partitioning window patches via the Gestalt principles is of great importance. The analysis demonstrates that smaller steps do not necessarily result in better partitioning. Thanks to the Gestalt principles, the proposed multi-scale filtering method achieves satisfying results, employing the human perception even on most middle bars of window frames. Thus, this method retains high correctness and completeness criteria, with a pessimistically defined TP, via the proposed large-scale window detection method. Furthermore, windows are correctly discriminated from intrusions such as doors, except for some which include glass parts and protrusions like installations, stairs, and towers, apart from parallel parts of scaffolding.
In future works, we intend to utilize big data concepts for the analyses of photogrammetric point clouds with ultra-high densities. On account of the high densities of input datasets, big data platforms can be fairly advantageous in handling this demanding type of data. Furthermore, employing more features, extracted from color information, is one possible future research effort to progress the development of the object detection approach. In case of availability of proper training 3D dataset, deep learning can be employed to automatically recognize windows in future research studies.


