Searching for Viking Age Fortresses with Automatic Landscape Classification and Feature Detection


1
Department of Archaeological Science and Conservation, Moesgaard Museum, Moesgård Allé 20, 8270 Højbjerg, Denmark
2
Department of Geoscience, Aarhus University, Høegh-Guldbergs Gade 2, 8000 Aarhus C, Denmark
3
Center for Urban Network Evolutions (UrbNet), Aarhus University, Moesgård Allé 20, 8270 Højbjerg, Denmark
*
Author to whom correspondence should be addressed.
Remote Sens. 2019, 11(16), 1881; https://doi.org/10.3390/rs11161881
Submission received: 19 June 2019
/
Revised: 19 July 2019
/
Accepted: 25 July 2019
/
Published: 12 August 2019
Abstract
:Across the world, cultural heritage is eradicated at an unprecedented rate by development, agriculture, and natural erosion. Remote sensing using airborne and satellite sensors is an essential tool for rapidly investigating human traces over large surfaces of our planet, but even large monumental structures may be visible as only faint indications on the surface. In this paper, we demonstrate the utility of a machine learning approach using airborne laser scanning data to address a “needle-in-a-haystack” problem, which involves the search for remnants of Viking ring fortresses throughout Denmark. First ring detection was applied using the Hough circle transformations and template matching, which detected 202,048 circular features in Denmark. This was reduced to 199 candidate sites by using their geometric properties and the application of machine learning techniques to classify the cultural and topographic context of the features. Two of these near perfectly circular features are convincing candidates for Viking Age fortresses, and two are candidates for either glacial landscape features or simple meteor craters. Ground-truthing revealed the latter sites as ice age features, while the cultural heritage sites Borgø and Trælbanke urge renewed archaeological investigation in the light of our findings. The fact that machine learning identifies compelling new candidate sites for ring fortresses demonstrates the power of the approach. Our automatic approach is applicable worldwide where digital terrain models are available to search for cultural heritage sites, geomorphological features, and meteor impact craters.

1. Introduction
Finding rare natural or cultural features on the surface of our densely vegetated and fast eroding planet is an urgent challenge. Recently, improvements in sensors, data processing, and visualization have transformed the scope of archaeological discovery and investigation. Successful, recent examples include the use of airborne laser scanning (ALS) data to detect structures at Rome’s ancient harbor [1] or to map the jungle-covered settlement landscape of Cambodia’s Angkor Wat complex [2] and the multi-period city of Jerash, Jordan [3]. In a similar manner, meteor impact craters are detected in Google Earth images [4], or in airborne radar soundings of the Greenland Ice-sheet [5].
Not all archaeological monuments are easily detected. Recently, ALS survey data led to the discovery of a previously unknown Viking Age (10th Century CE) ring fortresses, Borgring, near Copenhagen, Denmark [6]. These rare sites comprise circular turf and timber ramparts 10–18 m broad and up to 5 m high, which enclosed an area of 120 to 250 m in diameter, with a geometrically arranged system of streets and houses in the interior (Figure 1). Borgring was overlooked because a millennium of erosion and truncation by the cultivation mean that only subtle remains of the rampart are visible on the surface today as an interrupted bank 0.15 m high.
The ring fortresses are believed to form a network of royal strongholds marking a budding state formation during the reign of King Harald Bluetooth c. 958 to 986 CE [7]. The regular spacing of the five known examples suggest that further unrecognized fortresses forming part of this network may have existed. Evidence from excavations at Fyrkat and Borgring also suggest that the construction of these fortresses may not have been completed at the time of their abandonment [8,9]. Thus, being able to confirm or refute the existence of further examples is of great importance for our understanding of the politics of the era. However, to date, there has not been a systematic attempt to discover them.
Limited resources prohibit manually interpreting the ALS data on a national scale. We addressed this using an automatic feature detection workflow to look for unrecognized ring fortress in ALS data covering 42,036 km2 of present-day Denmark (the whole landmass of the country excluding the island of Bornholm).
This presents a difficult problem for feature detection approaches of remote sensing, where a large number of examples are usually used to train classifiers [10,11,12,13,14,15]. In this case, these methods are inappropriate, as Borgring is the only example of an erosion damaged fortress that has not been extensively reconstructed in the recent past [16]. Additionally, unidentified Trelleborg-type fortresses are unlikely to be complete, as they may be truncated by later development and erosion processes. Thus, the methods used in this research must be capable of detecting partial or fragmented features, which are sensitive to features with poorly defined ramparts, and not reliant on large training datasets.
To address this, we used computer vision methods to detect 202,048 annular topographic features in the ALS data, which were then refined by training a Random Forests Classifier on the topographic and historical context of the known examples (see Figure 2). The classified results were further refined using the geometric properties of the features to 199 candidates. We suggest that two of the candidates should be further investigated as potential ring fortresses of this period.
2. Materials and Methods
2.1. Experimental Design
The recognized Trelleborg-type ring fortresses are defined by a circular earthen rampart typically 120 to 250 m in diameter. Unrecognized Viking Age or Medieval ring fortresses and similar earth works are likely to be heavily truncated by centuries of cultivation and obscured by landcover. ALS data is ideal for this task, as the high spatial resolution data is ideal for detecting subtle differences in elevation, and can detect features of this scale even under dense forest canopies. Additionally, there is also a high likelihood that these features are detectable as only partial rings, since they may be impacted by modern development and erosion processes. Thus, any detection algorithm must be able to detect interrupted, fragmented, and partial ring structures. Additionally, the low number of extant examples that have not been reconstructed means that there is simply not enough training data for deep learning object detection approaches [18,19,20].
To deal with this, we used computer vision algorithms designed to detect circular features based on their geometry rather than a large training set of examples. The algorithms utilized in this study do this successfully. However, a large number of false positives are detected. This is desirable, as the scarcity of these features means that overlooking potential fortresses is a risk.
The well-defined and coherent geometric properties of the known examples of the ring fortress meant that the number of false positives can be reduced by selecting features of particular shapes, sizes, and proportions.
Furthermore, the topographic and landscape context of these features can be used to classify the detected rings to attempt to distinguish potential fortresses from other features. While the general topography has not changed greatly since the Viking period, large-scale drainage, land reclamation, and canalization mean that the locations and extent of coasts, rivers, and wetlands were very different. Thus, ALS data was used for topographic context in conjunction with coastlines, rivers, wetlands, and roads digitized from mapping dating to the late 18th Century, before many of these changes took place. These data, in conjunction with significant toponyms, were used to train a Random Forests classifier [21]. This approach has two advantages. First, by using the wider context of the fortresses, all of the existing examples of ring fortresses can be used to train the classifier even though the sites themselves have been extensively modified since they were excavated. Second, the Random Forests classifier is resistant to overfitting with the comparatively small training data sets used in this study [22,23].
2.2. Data and Data Processing
The 2007 DHM (Danmark’s Højde Model) airborne laser scanning derived digital terrain model (DTM) was used for this study. The data were acquired as a 1.6 m spatial resolution raster, interpolated from points classified as ground surface by The Danish National Geodata Agency (Kortforsyningen) and supplied as 1 km2 tiles [24]. The 2007 dataset was chosen for this task over the higher resolution 2014 survey [25] because the spatial resolution is sufficient for the large features considered in this case. In addition, the impact of soil erosion on archaeological features highlighted by recent work [26] is reduced. Tiles for the entirety of Denmark (excluding the island of Bornholm) were collated into 900 km2 tiles with a 300 m overlap to mitigate edge effects in data processing and feature detection. The data were then smoothed using a 3-pixel radius median filter to reduce the influence of spikes and noise. The data were then processed using the residual relief [27,28] technique to enable segmentation of the model into relative positive and negative topographic features at the scale of the ring castles.
The technique implemented, in this case, uses the convolution of two Gaussian filters at different spreads to remove the general trend of the terrain while preserving smaller topographic features. The advantage of this method is that the weighting of the kernel using the Gaussian distribution preserves coherent features smaller than the spread of the function, and is more resistant to the introduction of high-frequency artifacts through ringing than using a uniform box or median filters [29]. The weighting of the Gaussian smoothing filters is dictated by the standard deviation or σ of the Gaussian distribution. Values of 2σ and 10σ were used for the surface and trend raster respectively. The spread of the function at 10σ is flat, which effectively functions as a standard low-pass filter. A threshold at 0 was then applied to the resulting raster to segment the image into positive and negative elevation trends. Smaller positive objects comprising fewer than 128 pixels were reclassified as 0 in the Boolean array.
2.3. Ring Detection
Two approaches to ring detection were applied using the implementations in the scikit-image Python library [30], the Hough circle transform, and template matching.
The input of the Hough transform is a boolean edge array. To produce this, the threshold boolean array was subtracted from the same array dilated by a single pixel. This was then used to apply the Hough circle transform [31] to the image at radii between 20 and 150 m. The Hough circle transform is ideal for this problem, as it excels at detecting partial or fragmented rings. This has been utilized successfully in archaeology to identify burial mounds in ALS data [32]. The width of the ramparts for both meteor craters and possible ring fortresses mean that there are likely to be multiple points identified in the same locations at different radii. The more circular the feature, the more likely it is that the points will be tightly clustered. To identify these points, the Density-Based Spatial Clustering of Applications with Noise (DBSCAN) algorithm [33,34] was used to identify clusters of more than five points within a 3 pixel radius, and the coordinates of the identified rings were derived from the centroid of the point clusters.
Template matching compares a kernel iterating over the target array to a template image of the same dimensions using fast normalized cross-correlation. This produces an array of the same dimensions as the target image where each pixel is scored, according to its similarity to the template. Template matching has been successfully applied to detect archaeological features in ALS [35,36,37], satellite imagery [37], and geophysical survey data [38,39]. For this, an implementation of Lewis’s [40] method was used with procedurally generated rings with radii of 20 to 150 m and a width of 1 pixel. An empirically derived threshold of 0.35 was applied to the score of the resultant arrays and pixels below this score were discarded. The DBSCAN algorithm was again used to identify closely spaced clusters of points because the template matching algorithm detected a large number of points within each ring. This is because adjacent pixels return similar values and templates at many radii match the topographic feature defining the detected ring. Clusters of 40 or more points where the distance between points in each cluster did not exceed the diagonal of one pixel (2.26 m) were used (Figure 3).
2.4. Refinements
This resulted in the detection of a large number (202,048) of circular features, which clearly contained a high proportion of false positives representing a wide variety of both anthropogenic and natural features (Figure 4). The anthropogenic features included major roundabouts, sewerage farms, circular berms surrounding storage tanks, and athletics tracks. Natural features, by far the most numerous, comprise a wide variety of geomorphological features, including kettle holes and pingo remains, which are classes of round fossil glacial landforms formed in a high arctic environment [41,42], and river meanders, which can be quarter or half-circles in DTMs.
To reduce these, a number of parameters were used to refine the clustered points (Table 1). These parameters were used to remove spurious features. In particular, a ratio between the standard deviations of the X and Y points in each cluster were used to establish concentricity at different radii (Figure 3). A circular feature will produce a large number of tightly clustered points at different radii, whereas more amorphous topographic features such as glacial kettle holes and relict river meanders exhibit a more extensive, diffuse spatial distribution. The difference between the maximum and minimum radii indicates the breadth of the rampart. Many modern anthropogenic features were observed to have narrow ramparts in comparison to ring fortresses. These were differentiated using a threshold at 5 m. A threshold of 45 m was also applied to the maximum radius of each ring to exclude features smaller than the known Viking period fortresses. Lastly, the maximum normalized score for each cluster was used to select highly scored features using an empirically derived threshold of 0.26.
2.5. Landscape Context Classification
To further refine the detected rings, all 202,048 rings were classified using their wider context in the landscape utilizing topographic data, pre-industrial mapping, and place name elements. This comprised the slope and Topographic Position Index (TPI) [43] derived from the ALS DTM. Additionally, the proximity to the pre-land reclamation coastline and geographical features digitized from the first nation-wide maps (“Videnskabernes Selskabs” from the 18th Century CE, Figure 5) [44], and relevant historical place names from the nation-wide Danish place name database [45].
The topographic position is useful in order to identify the fortresses since these tend to be built on prominent, defensible locations in the landscape, as opposed to glacial and fluvial features, which tend to be low-lying in comparison to the surrounding terrain. Additionally, the interior of the fortresses tends to be relatively flat, as steeply sloping ground would preclude the construction of buildings in the interior. To derive this information, a 7-m pixel size DTM was made from the 2007 ALS DTM using inverse distance weighted resampling. A lower spatial resolution was chosen for this task since it was sufficient for the scale of the features. This was used to derive slope and the topographic position index (TPI) [46,47] at two scales to examine both the local and wider topographic context of each pixel in the DTM (Table 1).
Landscape features from the Videnskabernes Selskabs maps [44] were employed to provide natural and cultural context. This 1:120,000 mapping represents the most detailed and complete mapping of the country before large scale land reclamation and drainage altered the shape of the environment. Vectorized data from these maps was used to produce a series of proximity rasters on the same grid as DTM data above. It has been suggested that proximity to communication routes such as rivers and roads is also an important factor in the location of the fortresses [6]. Thus, pre-industrial communication routes were added following the removal of the 17th Century CE “Kongevej” network of royal roads, and crossings over fjords and between islands were added to preserve the centrality of, otherwise, seemingly remote locations in the road network (Table 2).
Significant place name components from the Danmarks Stednavne database [17,48] were also used to explore the correlation between these names and possible fortress locations. The place name elements registered in the database are assembled from historical mapping and parish records, and preserve the names of settlements and topographic features dating to the medieval and Viking periods [49]. Some of these are located at the level of individual fields and topographic features. However, the majority are registered at the parish level. Thus, the names were joined to parish boundaries and these were used to derive proximity rasters for each name element. The place name elements pertinent to the ring fortresses [50] are described in Table 3.
The values of the topographic and proximity rasters at each of the 202,048 filtered candidate rings were sampled. A subset of these were manually interpreted to provide examples to use as training data for the subsequent classification of the points (Table 4). Modern cultural features were excluded from this classification, since these are constructed with little regard for topographic and historical context. These data were used to train a random forests classifier [21] using the implementation in Scikit-learn [51]. Furthermore, 100 estimators were used, with no constraint on the depth of the trees. Additionally, the classifier returns the relative importance of each proximity raster for each feature in the training data. This indicates that the topographic position and proximity to major communication routes are the most useful layers for distinguishing the fortresses from natural features (Table 5), while the place names are comparatively unimportant.
2.6. Evaluation
After refinement using geometric criteria and landscape context classification described above, the number of classified rings was reduced from 202,048 to 2814. This was further reduced to 2252 by eliminating features less than 90 m in diameter (Figure 6). At this point, we felt it was practical to undertake a manual, visual assessment of these features to assess the accuracy of the classification. To do this, expert interpreters with experience in geomorphology and archaeology examined and classified each of the 2814 rings in GIS software at the 1:2500 scale over the course of two weeks. Data used included residual relief visualization, hill shades, and contours derived from both the 2007 and higher spatial resolution (0.4 m) 2014 ALS derived DTMs [25], in addition to imagery from the national orthophoto-graphic surveys. This 0.15 m spatial resolution RGB imagery is acquired with full national coverage annually during the spring, and are freely available as open data [52]. The 2018 image was used unless there had been significant changes since 2007.
This revealed that a significant number of the highly scored rings identified by the Hough transform were spurious, as a result of high frequency noise from forestry and crop cultivation. While the high number of spurious positives identified could be mitigated to some extent by more stringent noise removal, especially Fast Fourier Transforms (FFT) [53,54], template matching proved more resistant to this noise. After manually removing rings identified as resulting from noise patterns and those related to modern anthropogenic construction, the accuracy of the classifier could be evaluated for the three feature classes.
2.7. Ground Truthing
A key rationale for this remotely sensed automatic feature detection approach was that no destructive archaeological excavation should be done, as the lessons learned from Borgring [6] showed that it takes years of careful excavation to prove a ring feature belongs to the Trelleborg-type. No legally protected cultural heritage sites under the jurisdiction of The Agency for Culture and Palaces were investigated on the ground. However, of the candidate sites outside protected areas, two sites with near-perfect circular rims around a central depression was selected for ground truthing since they were the best candidates for meteor impact craters in the dataset.
3. Results
3.1. Summary
We tested applied ring detection computer vision techniques to the national ALS derived DTM, using a residual relief convolution segmented into positive and negative elevation trends. The detected features were then refined using their geometric properties, and classified using their topographic and cultural context by ensemble machine learning.
3.2. Archaeological Candidate Sites
This resulted in the identification of 199 candidate features. In total, nine fortresses were correctly identified (Figure 7), including four of the five extant Trelleborg-type ring fortresses (Aggersborg, Borgring, Fyrkat, and Trelleborg), with only Nonnebakken not being detected. This site has been levelled and obscured by recent urbanization, and no topographic remains of the feature are visible on the surface [55].
The two most compelling candidates for unrecognized ring fortresses are those at Trælbanken and on Borgø (Figure 8). Both are defined by substantial annular ramparts. These sites are described in detail in the discussion below. Further fortresses identified were the earlier Iron Age fortifications at Trælborg near Skanderborg [56], the Medieval fortress at Borrebanken (Lolland), and a 19th Century Sconce at Havmøllen (Djursland). The ramparts at these sites are not circular like the ring fortresses. Trælborg and Borrebanken are defined by ovate rings, whereas Havmøllen is defined by a substantial square fortification.
Of the remaining 2053 detected rings not classified as archaeological features, four fortresses were misidentified as geomorphological features. However, these were constructed later in the medieval and post-medieval period and are all located in low-lying topographic positions. Thirty-one geomorphological features and 84 modern anthropogenic features were incorrectly identified as potential ring fortresses. Additionally, 79 detected fortresses resulted from noise or cultivation patterns.
3.3. Geological Sites
Throughout Denmark, only two near-perfect rings (Gudum and Kongsbjerg, Figure 4a,c) with an outer rim were detected. Based on the remote sensing data, these could be candidate sites for meteor impact craters. However, since they could be either glacial rimmed pingos, kettle-holes, or meteor craters [41,42,57], and were identified during the manual interpretation of the 2814 candidate features (Figure 6). The sites were investigated by a walkover survey, small test pits, and auguring.
Coring, walk-over survey and small soil pits of the ring at Gudum (Figure 4a) revealed >2 m thick, undisturbed silty clay from an ice-lake, which made it a candidate for a rimmed glacial kettle-hole, or eventually a recently modified site as late 19th Century maps show pits dug in this area. Similarly, ground truthing at a site next to Kongsbjerg (Figure 4c) revealed that this site has been heavily eroded by ploughing, peat excavation, and a badger’s sett. This site with strongly podzolised soil on a late-glacial outwash plain, had a flat-bottomed interior filled with 1.5 m of peat and gyttja. Neither surface shatter cones or tektites, which is indicative of impact craters [57,58], were found. The Kongsbjerg circle, hence, likely belongs to a glacial landform such as a rimmed pingo or a rimmed kettle-hole [41,42,59], even though it is a rare example with a nearly perfectly circular, well-developed rim even after ten millennia of erosion.
Since no indicators of anthropogenic origin for these features such as turf in the rims/rampart or artifacts could be found, the two sites are not relevant for further investigation within our research, which aims to detect Viking Age ring fortresses.
4. Discussion
4.1. Evaluating Our Approach
Automatic feature detection approaches for archaeology are a rapidly and fast developing field in archaeological prospection [60,61,62]. Recent studies have demonstrated machine learning methods for detecting a wide variety of features, including burial mounds, charcoal kilns, buildings, and field systems [10,63,64,65,66].
The approach considered above differs from these studies in that it seeks to test a specific hypothesis: Are there any further fortresses of the Trelleborg-type in Denmark? Searching for such specific, rare features across the landmass of a whole country presents unique challenges, especially given the paucity of training data and large size of the features. The combined ring detection and classification approach addresses this by searching for anything that fits the morphological characteristics of the fortresses and then classifying these features based on their context.
Our approach detected >2800 features, the majority of which are false positives that need to be manually checked. This is time consuming, and even though we feel it is worthwhile given the scarcity and significance of the features of interest, should be addressed in further work. More stringent noise removal is essential, and could be achieved by careful reprocessing of the raw data. Consensus of classifications between the 2007, 2014, and forthcoming 2019 ALS datasets could mitigate the effects of sensor and platform noise [67,68], and reduce the influence of artificial textures introduced by vegetation and cultivation. The large number of modern features could be identified and removed by classification of orthophotography. Furthermore, areas where modern development has led to gaps in our ALS dataset can be addressed by using structure from motion techniques to derive DTMs from archival aerial photographic surveys [3,69], in Denmark such as those with national coverage including the Basic Cover series from 1954 and RAF series from 1965 [70].
A potential criticism of this work is that it could be construed as machine learning for machine learning’s sake. Manually searching for fortresses across the whole landmass of the country would have been untenable, but if we had undertaken a systematic review of the 1395 known voldsteder (fortifications) and vold (ramparts) in the Danish state heritage database [71] using the ALS data, we could have arrived at the same conclusions as this work with much less effort. However, we contend that this is a circular argument. We would not know this if we had not looked for undiscovered fortresses, which could have remained undetected and unidentified given their poor condition, and we should never rely on our existing understanding being complete. This is especially important given the nature of the problem. An indicated absence of further fortresses is just as important for our understanding of the geography of power and dynastic politics in Northern Europe during this period as finding new examples.
A further potential criticism is that our two most compelling ring fortress candidates are already known sites, but these sites have not been exhaustively investigated, and evidence from known sites must always be re-evaluated. On such large sites, small excavations can only reveal so much, and the methods at our disposal for dating and provenancing sites improve continually. An important motivation of our method is that there is always the potential for the morphology and context of sites to be misinterpreted and overlooked given incomplete evidence. Borgring [6] is a good example of this. Even though the place name evidence and historical records indicated the presence of a fortification, it was not until 1970 that the site was serendipitously discovered in aerial photography after a light snowfall. Trial excavations revealed some scant evidence of Roman Iron Age settlement, and this date was applied to the whole fortification. In 2014, the site was re-evaluated using ALS data and it was identified as the potential Trelleborg-type fortress. This hypothesis, however, took three extensive campaigns of excavation and scientific analyses to confirm. Similarly, the site at Borgø has been ascribed to a later period, but the possibility of an earlier date for the rampart or the entire fortification has never been articulated or investigated.
4.2. Borgø-Archaeological Consideration
This site is located on a small island in Maribo Lake (Figure 8 and Figure 9). The site has a circular rampart with a diameter approximately of 92 m, with a series of five linear outworks blocking a promontory. Extensive construction at the site, including earthworks and masonry, has been dated to 13th Century CE, when a castle was constructed at the island [72]. However, both the size and shape of this fortification are anomalous for the Medieval period. A small number of Viking Age finds from the adjacent lake, including a worked oak plank felled after 975 CE suggests earlier activity at the island [72]. We suggest that the 12–13th Century medieval structures represent a re-working of an earlier Viking Age fortification, which has remained unacknowledged because it was assumed to be part of the later constructions. The location of Borgø on a small island resembles Slavic lake fortresses from the same period from the south Baltic region [73], which is a relevant comparison in light of the evidence for contemporaneous Slavic colonization in this part of Denmark [74]. The fortress can be compared in general terms to sites like Gross Raden or Behren-Lübchin in Mecklenburg, present-day Germany, which were both erected by Slavic rulers in the late 10th Century CE [75]. An identification of the site as a late Viking-age ring fortress would, thus, be consistent with several, very different historical scenarios, which can only be clarified by further investigations on the ground.
4.3. Trælbanke-Archaeological Considerations
This known cultural heritage site near the Wadden Sea coast of the North Sea, consists of a rampart of approximately 113 m in the outer diameter. Trial excavations have identified traces of settlement from the early Roman period (1st–2nd Century CE) in the earliest strata at the site, when a similar date was suggested for the earthworks. However, the date of the substantial fortification, with a 11.5-m wide rampart, cannot be established beyond being younger than the settlement traces [76]. Although our machine learning approach identified it, Trælbanke’s rampart, at first appears imperfectly circular (Figure 8), even though major changes in its surface appearance are very likely since coastal deposition is evident at the south and east quadrants of the rampart, which, today, are surrounded by marsh sediments (Figure 9). These deposits are likely from the era before dykes were built from 1556 CE onwards [77]. The elevations of the rampart’s crest suggest that the major storm tides of 1362 and 1634 CE could have flooded the entire site. Furthermore, truncation by cultivation and modern ditches is also evident, and written records describe levelling and infilling of the ramparts in the 19th Century [71]. The Trælbanke earthwork has previously been associated with a group of similar ring fortresses in the German part of the Wadden Sea: Archsumburg and Tinnumburg on Sylt and Borgsumburg on Föhr. Like Trælbanke, these have previously been dated to the Roman Iron Age [78], and settlement structures from this period are certainly present at all three sites. However, more recent investigations suggest that these major fortifications in Germany were more likely established in the Viking Age [79]. In light of this revision, the case for dating Trælbanke to the Iron Age appears increasingly unfounded, and the alternative Viking-Age date, suggested by our analysis, must be considered more plausible. The fact that previous excavations did not identify Viking-age artifacts is not conclusive. Early excavations at Fyrkat, Aggersborg, and Borgring all failed to produce datable artifacts, likely due to the short use-life of the sites [7,9].
4.4. Archaeological Implications
The interpretation of the archaeological evidence from both Trælbanke and Borgø should be carefully reconsidered, and further on-ground investigations should be undertaken to obtain a more precise date. The diameter of both is smaller than that of known Trelleborg-type sites (Figure 7 and Figure 8). However, the exact circular layout is strongly reminiscent of the currently recognized Trelleborg-type fortresses. What makes the latter sites unique is the fact that they were constructed as a concerted effort across several provinces, which is a defensive network outlining the scope of the Viking-age Danish kingdom [6]. If one or both of Trælbanke and Borgø are to be considered as part of this network, current historical narratives must be revised thoroughly.
The identification of the two sites by our workflow as potential Viking-age sites, thus, points to evidence of far-reaching archaeological importance. The Trelleborg-type fortresses are prime, but scarce evidence for political evolution in the Viking state formation and the transition to the medieval world, for which we rely almost entirely on archaeological evidence, with military installations being a key parameter [80]. The recent discoveries at Borgring demonstrate the extent to which new sites may alter established narratives. If these two candidate sites at the southern edge of present-day Denmark are confirmed as dating to this period, it will fundamentally revise our understanding of the political center of gravity in the early Danish kingdom.
4.5. Detection of the Natural Surface Feature
While the focus of this paper is archaeological, the morphology of the ring fortresses is comparable to a number of natural and other anthropogenic circular features also identified by our algorithm (Figure 4). Our automatic approach is, hence, adaptable to search for a wide variety of circular surface structures where digital elevation models (DEMs) are available. Such future studies could focus on common geomorphological features such as meandering rivers, coastal erosion scars, and glacial landforms [10,42,82], but also remote mapping of impact craters from meteors [57], bomb craters [83], and center pivot irrigation [84]. It may be even applicable on extra-terrestrial bodies [85].
Of these, the possibility of identification of meteor impact craters is the most promising since they are extremely rare and are discovered at a rate of only three to five per year [58]. Although we did not identify undiscovered meteor impact craters in Denmark, we can now argue that the chance of finding unidentified impact craters in the range of a 45 to 250-m diameter is low in our study area. After modification of our code and improved training data, it will be possible for further work to automatically search for meteor impact craters in ALS DTMs wherever these are available.
5. Conclusions
The successful identification of both heavily eroded Pleistocene features and previously known, though poorly dated, fortresses demonstrates that our method is capable of detecting relatively ephemeral and incomplete features. Our methodology empowers archaeologists and historians by demonstrating that large-scale searches for features at national scales are feasible. Societies have limited resources for exploring and protecting cultural heritage, which makes it essential that we can identify which sites are of key scientific potential before they disappear. Automated feature detection and characterization affords the means to exploit the vast global archives [86,87,88] of data to achieve this.
Beyond archaeology and geomorphology, impact craters from hypervelocity projectiles, are fast vanishing due to weathering, obliteration, deformation, vegetation regrowth, erosion, and burial of their impact craters. Previous attempts to automatically identify terrestrial impact craters have focused on large scale craters [89] without success, while digital terrain models have generated data that can aid identification of impact craters on other bodies in our solar system [85]. As a consequence of our archaeologically driven choice of parameters in the random forests’ classification (Table 3, Table 5 and Table S2), i.e., distance to specific site names and water courses, we have somewhat biased our ability to successfully detect these rare, randomly distributed features in Denmark. Our needle-in-the-haystack machine learning approach to ALS data is, nevertheless, a promising way forward for detecting more candidates for terrestrial impact craters from meteors and comets, as only 190 are recognized worldwide [57,58].
As further automatic identification of larger areas can produce numerous points of interest, a natural next step for research in surface feature detection is to include citizen science for ground-truthing, as demonstrated by a recent Dutch study [63].
Supplementary Materials
The following are available online at https://www.mdpi.com/2072-4292/11/16/1881/s1.
Author Contributions
Conceptualization, D.S., S.M.K., and S.M.S. Methodology, D.S., S.M.K., and S.M.S. Software, D.S. Validation, D.S. and S.M.K. Formal analysis, D.S. Investigation, D.S., S.M.K., and S.M.S. Resources, D.S., S.M.K., and S.M.S. Data curation, D.S. Writing—Original draft preparation, D.S. Writing—Review and editing, D.S., S.M.K., and S.M.S. Visualization, D.S. and S.M.S. Supervision, S.M.K. and S.M.S. Project administration, S.M.K. Funding acquisition, none.
Funding
This research received no external funding.
Acknowledgments
We thank landowners at the sites with geological features for access to their land, and Thomas Ljungberg and Pernille Trant for help during field work. Nikolaj K. Larsen is thanked for discussions on the geological features, and Peter Jensen and Thomas Ljungberg for preparing figures. We are also grateful to the many contributors to the open source software used in this work, including Python, Numpy, Scipy, Scikit-learn, Scikit-Image, GDAL, SAGA, GRASS, and Qgis.
Conflicts of Interest
The authors declare no conflict of interest.
References
- Keay, S.J.; Parcak, S.H.; Strutt, K.D. High resolution space and ground-based remote sensing and implications for landscape archaeology: The case from Portus, Italy. J. Archaeol. Sci. 2014, 52, 277–292. [Google Scholar] [CrossRef]
- Evans, D.; Fletcher, R. The landscape of Angkor Wat redefined. Antiquity 2015, 89, 1402–1419. [Google Scholar] [CrossRef]
- Stott, D.; Kristiansen, S.M.; Lichtenberger, A.; Raja, R. Mapping an ancient city with a century of remotely sensed data. Proc. Natl. Acad. Sci. USA 2018, 115, E5450–E5458. [Google Scholar] [CrossRef] [PubMed] [Green Version]
- Folco, L.; Di Martino, M.; El Barkooky, A.; D’Orazio, M.; Lethy, A.; Urbini, S.; Nicolosi, I.; Hafez, M.; Cordier, C.; van Ginneken, M.; et al. The Kamil Crater in Egypt. Sci. Express 2010. [Google Scholar] [CrossRef] [PubMed]
- Kjær, K.H.; Larsen, N.K.; Binder, T.; Bjork, A.A.; Eisen, O.; Fahnestock, M.A.; Funder, S.; Garde, A.A.; Haack, H.; Helm, V.; et al. A large impact crater beneath Hiawatha Glacier in northwest Greenland. Sci. Adv. 2018, 4. [Google Scholar] [CrossRef] [PubMed]
- Goodchild, H.; Holm, N.; Sindbaek, S.M. Borgring: The discovery of a Viking Age ring fortress. Antiquity 2017, 91, 1027–1042. [Google Scholar] [CrossRef]
- Roesdahl, E.; Sindbæk, S.M. The purpose of the fortress. In Aggersborg: The Viking-Age Settlement and Fortress; Roesdahl, E., Sindbæk, S.M., Pedersen, A., Wilson, D.M., Eds.; Jysk Arkæologisk Selskabs Skrifter: Højbjerg, Denmark, 2014; Bind Volume 82; pp. 383–414. [Google Scholar]
- Olsen, O.; Schmidt, H. Fyrkat: En jysk vikingeborg. In Borgen og Bebyggelsen. Med et Bidrag af Hilmar Ødum og en Excurs af Hans Helbæk; Det kgl. nordiske Oldskriftselskab: København, Denmark, 1977; p. 282. [Google Scholar]
- Christensen, J.; Holm, N.; Schultz, M.K.; Sindbæk, S.M.; Ulriksen, J. The Borgring Project 2016–2018. In The Fortified Viking Age: 36th Interdisciplinary Viking Symposium; Hansen, J., Bruus, M., Eds.; Syddansk Universitetsforlag: Odense, Denmark, 2018; Volume 3, pp. 60–68. [Google Scholar]
- Trier, Ø.D.; Cowley, D.C.; Waldeland, A.U. Using deep neural networks on airborne laser scanning data: Results from a case study of semi-automatic mapping of archaeological topography on Arran, Scotland. Archaeol. Prospect. 2019, 26, 165–175. [Google Scholar] [CrossRef]
- Guyot, A.; Hubert-Moy, L.; Lorho, T. Detecting Neolithic burial mounds from LiDAR-derived elevation data using a multi-scale approach and machine learning techniques. Remote Sens. 2018, 10, 225. [Google Scholar] [CrossRef]
- Rizaldy, A.; Persello, C.; Gevaert, C.M.; Oude Elberink, S.J. Fully Convolutional Networks for Ground Classification from Lidar Point Clouds. ISPRS Ann. Photogramm. Remote Sens. Spat. Inf. Sci. 2018, 2. [Google Scholar] [CrossRef]
- Colgan, M.S.; Baldeck, C.A.; Feret, J.B.; Asner, G.P. Mapping Savanna Tree Species at Ecosystem Scales Using Support Vector Machine Classification and BRDF Correction on Airborne Hyperspectral and LiDAR Data. Remote Sens. 2012, 4, 3462–3480. [Google Scholar] [CrossRef] [Green Version]
- Liu, Y.S.; Piramanayagam, S.; Monteiro, S.T.; Saber, E. Dense Semantic Labeling of Very-High-Resolution Aerial Imagery and LiDAR with Fully-Convolutional Neural Networks and Higher-Order CRFs. IEEE Comput. Soc. Conf. 2017, 1561–1570. [Google Scholar] [CrossRef]
- Meng, X.L.; Currit, N.; Wang, L.; Yang, X.J. Detect Residential Buildings from Lidar and Aerial Photographs through Object-Oriented Land-Use Classification. Photogramm. Eng. Remote Sens. 2012, 78, 35–44. [Google Scholar] [CrossRef]
- Roesdahl, E. Aggersborg’s location and history. In Aggersborg—The Viking-Age Settlement and Fortress; Roesdahl, E., Sindbaek, S.M., Eds.; Jutland Archaeological Society: Højbjerg, Denmark, 2014; Volume 83, pp. 17–30. [Google Scholar]
- Gammeltoft, P.; Jakobsen, J.G.G.; Sindbæk, S.M. Vikingetidens bebyggelse omkring Kattegat og Skagerrak: Et forsøg på kortlægning. In Et Fælles Hav: Skagerrak og Kattegat i Vikingetiden; Pedersen, A., Sindbæk, S.M., Eds.; Nordlige Verdener: København, Denmark, 2015; pp. 6–23. [Google Scholar]
- Jain, A.; Zongker, D. Feature selection: Evaluation, application, and small sample performance. IEEE Trans. Pattern Anal. Mach. Intell. 1997, 19, 153–158. [Google Scholar] [CrossRef]
- Chen, X.W.; Lin, X.T. Big Data Deep Learning: Challenges and Perspectives. IEEE Access 2014, 2, 514–525. [Google Scholar] [CrossRef]
- Zhang, C.; Bengio, S.; Hardt, M.; Recht, B.; Vinyals, O. Understanding deep learning requires rethinking generalization. arXiv 2016, arXiv:physics/0402096. [Google Scholar]
- Breiman, L. Random forests. Mach. Learn. 2001, 45, 5–32. [Google Scholar] [CrossRef]
- Belgiu, M.; Dragut, L. Random forest in remote sensing: A review of applications and future directions. ISPRS J. Photogramm. 2016, 114, 24–31. [Google Scholar] [CrossRef]
- Strobl, C.; Malley, J.; Tutz, G. An Introduction to Recursive Partitioning: Rationale, Application, and Characteristics of Classification and Regression Trees, Bagging, and Random Forests. Psychol. Methods 2009, 14, 323–348. [Google Scholar] [CrossRef]
- Flemming, L. Ny højdemodel-nu også landsdækkende. GeologiskNyt 2007, 6, 4–6. [Google Scholar] [CrossRef]
- Rosenkranz, B.; Lund, J. Danmarks Højdemodel-én model med et utal af anvendelser. Geoforum Perspekt. 2015, 14, 1–9. [Google Scholar]
- Vennersdorf, M. Den lille (terræn-)forskel—Danmarks Højdemodel som kilde til erosion og slid på arkæologiske lokaliteter i dyrket mark. Arkæologisk Forum 2017, 37, 8–14. [Google Scholar]
- Doneus, M.; Briese, C.; Fera, M.; Janner, M. Archaeological prospection of forested areas using full-waveform airborne laser scanning. J. Archaeol. Sci. 2008, 35, 882–893. [Google Scholar] [CrossRef]
- Hesse, R. LiDAR-derived Local Relief Models—A new tool for archaeological prospection. Archaeol. Prospect. 2010, 17, 67–72. [Google Scholar] [CrossRef]
- Mitchell, D.P.; Netravali, A.N. Reconstruction filters in computer-graphics. ACM SIGGRAPH Comput. Graph. 1988, 22, 221–228. [Google Scholar] [CrossRef] [Green Version]
- van der Walt, S.; Schonberger, J.L.; Nunez-Iglesias, J.; Boulogne, F.; Warner, J.D.; Yager, N.; Gouillart, E.; Yu, T.; Contributors, S.I. Scikit-image: Image processing in Python. PeerJ 2014, 2. [Google Scholar] [CrossRef] [PubMed]
- Illingworth, J.; Kittler, J. The Adaptive Hough Transform. IEEE Trans. Pattern Anal. Mach. Intell. 1987, 9, 690–698. [Google Scholar] [CrossRef]
- Cerrillo-Cuenca, E. An approach to the automatic surveying of prehistoric barrows through LiDAR. Quat. Int. 2017, 435, 135–145. [Google Scholar] [CrossRef]
- Schubert, E.; Sander, J.; Ester, M.; Kriegel, H.P.; Xu, X.W. DBSCAN Revisited, Revisited: Why and How You Should (Still) Use DBSCAN. ACM T. Database Syst. 2017, 42. [Google Scholar] [CrossRef]
- Ester, M.; Kriegel, H.; Sander, J.; Xu, X. A density-based algorithm for discovering clusters in large spatial databases with noise. In Proceedings of the KDD’96 Proceedings of the Second International Conference on Knowledge Discovery and Data Mining, Portland, OR, USA, 2–4 August 1996; pp. 226–231. [Google Scholar]
- Schneider, A.; Takla, M.; Nicolay, A.; Raab, A.; Raab, T. A Template-matching Approach Combining Morphometric Variables for Automated Mapping of Charcoal Kiln Sites. Archaeol. Prospect. 2015, 22, 45–62. [Google Scholar] [CrossRef]
- Freeland, T.; Heung, B.; Burley, D.V.; Clark, G.; Knudby, A. Automated feature extraction for prospection and analysis of monumental earthworks from aerial LiDAR in the Kingdom of Tonga. J. Archaeol. Sci. 2016, 69, 64–74. [Google Scholar] [CrossRef]
- Trier, O.D.; Larsen, S.O.; Solberg, R. Automatic Detection of Circular Structures in High-resolution Satellite Images of Agricultural Land. Archaeol. Prospect. 2009, 16, 1–15. [Google Scholar] [CrossRef]
- Kvamme, K. An Examination of Automated Archaeological Feature Recognition in Remotely Sensed Imagery. In Computational Approaches to Archaeological Spaces; Bevan, A., Lake, M., Eds.; Routledge: Abingdon-on-Thames, UK, 2016; pp. 53–86. [Google Scholar]
- Verdonck, L. Detection of Buried Roman Wall Remains in Ground-penetrating Radar Data using Template Matching. Archaeol. Prospect. 2016, 23, 257–272. [Google Scholar] [CrossRef]
- Lewis, J.P. Fast template matching. Vision Interface 1995, 95, 120–123. [Google Scholar]
- Bryant, R.H.; Carenter, C.P. Ramparted ground ice depressions in Britain and Ireland. In Periglacial Processes and Landforms in Britain and Ireland; Boardman, J., Ed.; Cambridge University Press: Cambridge, UK, 1987; pp. 183–190. [Google Scholar]
- Sørensen, P.B.; Lykke-Andersen, H. Kortlægning af pingo-rester i Danmark. Geol. Tidsskr. 2017, 2017, 21–29. [Google Scholar]
- Guisan, A.; Weiss, S.B.; Weiss, A.D. GLM versus CCA spatial modeling of plant species distribution. Plant Ecol. 1999, 143, 107–122. [Google Scholar] [CrossRef]
- Korsgaard, P. Videnskabernes Selskabs kort. Geoforum Perspekt. 2004, 3, 5–13. [Google Scholar]
- Jørgensen, B. Danske Stednavne; Gyldendal: Copenhagen, Denmark, 2008. [Google Scholar]
- De Reu, J.; Bourgeois, J.; Bats, M.; Zwertvaegher, A.; Gelorini, V.; De Smedt, P.; Chu, W.; Antrop, M.; De Maeyer, P.; Finke, P.; et al. Application of the topographic position index to heterogeneous landscapes. Geomorphology 2013, 186, 39–49. [Google Scholar] [CrossRef]
- Riley, J.W.; Calhoun, D.L.; Barichivich, W.J.; Walls, S.C. Identifying Small Depressional Wetlands and Using a Topographic Position Index to Infer Hydroperiod Regimes for Pond-Breeding Amphibians. Wetlands 2017, 37, 325–338. [Google Scholar] [CrossRef]
- Knudsen, B.N. Danske stednavne på den digitale vej: Status på DigDag-projektet og digitaliseringen af Danmarks Stednavne. In Proceedings of the Den Femtende Nordiske Navneforskerkongres, Askov, Denmark, 6–9 June 2012; pp. 249–261. [Google Scholar]
- Jakobsen, J.; Gøgsig, G.; Gammeltoft, P. Stednavne som kilde til Sjællands bebyggelseshistorie i middelalderen. In Middelalderlig Landbebyggelses På Sjælland Og Øerne; Forlaget Hikuin: Højbjerg, Denmark, 2017. [Google Scholar]
- Andersen, H. De Glemte Borge. Skalk: Nyt Fra Fortiden 1992, 1/1992, 19–30. [Google Scholar]
- Pedregosa, F.; Varoquaux, G.; Gramfort, A.; Michel, V.; Thirion, B.; Grisel, O.; Blondel, M.; Prettenhofer, P.; Weiss, R.; Dubourg, V.; et al. Scikit-learn: Machine Learning in Python. J. Mach. Learn. Res. 2011, 12, 2825–2830. [Google Scholar]
- Steffensen, B.; Colding, T.S.; Carstens, A.M. Free Geodata Have Made the Number of Users of the Map Supply Website Explode. Geoforum Perspekt. 2014, 13. [Google Scholar] [CrossRef]
- Marmol, U.; Jachimski, J. A FFT based method of filtering airborne laser scanner data. Int. Arch. Photogramm. Remote Sens. Spat. Inf. Sci. 2004, 35, 1147–1152. [Google Scholar]
- Tsai, F.; Chen, W.W. Striping Noise Detection and Correction of Remote Sensing Images. IEEE Trans. Geosci. Remote Sens. 2008, 46, 4122–4131. [Google Scholar] [CrossRef]
- Runge, M.; Henriksen, M.B. The origins of Odense–new aspects of early urbanisation in southern Scandinavia. Dan. J. Archaeol. 2018, 7, 1–67. [Google Scholar] [CrossRef]
- Andreasen, J. FHM 5201 Trælborg, Tiset Sogn, Ning Herred, Tidligere Århus amt, Sted nr.15.04.09 Sb.nr. 10; Moesgaard Museum: Moesgaard, Denmark, 2016. [Google Scholar]
- French, B.M.; Koeberl, C. The convincing identification of terrestrial meteorite impact structures: What works, what doesn’t, and why. Earth-Sci. Rev. 2010, 98, 123–170. [Google Scholar] [CrossRef]
- Grieve, R.A.F.; Pesonen, L.J. The Terrestrial Impact Cratering Record. Tectonophysics 1992, 216, 1–30. [Google Scholar] [CrossRef]
- French, H.M. The Periglacial Environment, 4th ed.; John Wiley and Sons: Oxford, UK, 2018; p. 515. [Google Scholar]
- Davis, D.S. Object-based image analysis: A review of developments and future directions of automated feature detection in landscape archaeology. Archaeol. Prospect. 2019, 26, 155–163. [Google Scholar] [CrossRef]
- Lambers, K.; Traviglia, A. Automated detection in remote sensing archaeology: A reading list. AARGnews-Newsl. Aer. Archaeol. Res. Group 2016, 53, 5. [Google Scholar]
- Traviglia, A.; Cowley, D.; Lambers, K. Finding common ground: Human and computer vision in archaeological prospection. AARGnews-Newsl. Aer. Archaeol. Res. Group 2016, 53, 14. [Google Scholar]
- Lambers, K.; Verschoof-van der Vaart, W.B.; Bourgeois, Q.P.J. Integrating Remote Sensing, Machine Learning, and Citizen Science in Dutch Archaeological Prospection. Remote Sens. 2019, 11. [Google Scholar] [CrossRef]
- Trier, Ø.; Salberg, A.B.; Pilø, L.H. Semi-automatic mapping of charcoal kilns from airborne laser scanning data using deep learning. In Oceans of Data, Proceedings of the 44th Annual Conference on Computer Applications and Quantitative Methods in Archaeology, Oslo, Norway, 29 March–2 April 2016; Archaeopress Publishing Ltd.: Oxford, UK, 2016; pp. 221–231. [Google Scholar]
- Zingman, I.; Saupe, D.; Penatti, O.A.B.; Lambers, K. Detection of Fragmented Rectangular Enclosures in Very High Resolution Remote Sensing Images. IEEE Trans. Geosci. Remote Sens. 2016, 54, 4580–4593. [Google Scholar] [CrossRef]
- Verschoof-van der Vaart, W.B.; Lambers, K. Learning to Look at LiDAR: The Use of R-CNN in the Automated Detection of Archaeological Objects in LiDAR Data from the Netherlands. J. Comput. Appl. 2019, 2, 10. [Google Scholar]
- Zhu, L.; Tateishi, R. Fusion of multisensor multitemporal satellite data for land cover mapping. Int. J. Remote Sens. 2006, 27, 903–918. [Google Scholar] [CrossRef]
- Benediktsson, J.A.; Sveinsson, J.R.; Swain, P.H. Hybrid consensus theoretic classification. IEEE Trans. Geosci. Remote Sens. 1997, 35, 833–843. [Google Scholar] [CrossRef] [Green Version]
- Sevara, C.; Verhoeven, G.; Doneus, M.; Draganits, E. Surfaces from the Visual Past: Recovering High-Resolution Terrain Data from Historic Aerial Imagery for Multitemporal Landscape Analysis. J. Archaeol. Method Theory 2018, 25, 611–642. [Google Scholar] [CrossRef]
- Olesen, L.H. Aerial archaeology in Denmark. AARG News 2004, 28, 28–35. [Google Scholar]
- Fortidsminder, F. Available online: www.kulturarv.dk/fundogfortidsminder/ (accessed on 3 March 2018).
- Petersen, T.P. Refshaleborg—Borgen på øen i Søen; Museum Lolland-Falster: Nykøbing Falster, Denmark, 2015; p. 6. [Google Scholar]
- Biermann, F. North-western Slavic strongholds of the 8th–10th centuries AD. In Fortified Settlements in Early Medieval Europe. Defended Communities of the 8th–10th Centuries; Christie, N., Herold, N., Eds.; Oxbow Books: Oxford, UK; Philadelphia, PA, USA, 2016; pp. 85–94. [Google Scholar]
- Naum, M. Difficult middles, hybridity and ambivalence of a medieval frontier: The cultural landscape of Lolland and Falster (Denmark). J. Mediev. Hist. 2012, 38, 56–75. [Google Scholar] [CrossRef]
- Henning, J. Der slawische Siedlungsraum und die ottonische Expansion östlich der Elbe. Ereignisgeschichte, Archäologie, Dendrochronologie. In Europa im 10t Jahrhundert. Archäologie Einer Aufbruchszeit; Henninj, J., Verlag, P., Eds.; von Zabern: Mainz am Rhein, Germany, 2002; pp. 131–146. [Google Scholar]
- Harck, O. Archäologische Untersuchungen in Wallanlagen Nordfrieslands. Ber. Römisch-Ger. Komm. 1986, 67, 362–372. [Google Scholar]
- Overgaard, A.M. Diger i Fortid, Nutid og Fremtid; Nationalpark Vadehavet: Esbjerg, Denmark, 2016. [Google Scholar]
- Harck, O. Archsum auf Sylt. 3, Die Ausgrabungen in den RöMerzeitlichen Erdwerken Archsumburg, Tinnumburg uund Traelbanken an der Westküste Schleswigs; Verlag, P., Ed.; von Zabern: Mainz am Rhein, Germany, 1990. [Google Scholar]
- Segschneider, M. Die Ringwälle auf den nordfriesischen Inseln. In Ringwälle und Verwandte Strukturen des Ersten Jahrtauseds n. Chr. An Nord-und Ostsee; Segschneider, M., Ed.; Wachholtz: Neumünster, Germany, 2009; pp. 99–111. [Google Scholar]
- Thurston, T.L. Landscapes of Power, Landscapes of Conflict: State Formation in the South Scandinavian Iron Age; Springer: Berlin/Heidelberg, Germany, 2002. [Google Scholar]
- Høy, T.; Dahl, J. Søerne i Storstrøm Amt og Bornholm; Strandbergs Forlag: Charlottenlund, Denmark, 1991. [Google Scholar]
- Wu, Q.; Deng, C.; Chen, Z. Automated delineation of karst sinkholes from LiDAR-derived digital elevation models. Geomorphology 2016, 266, 1–10. [Google Scholar] [CrossRef]
- Certini, G.; Scalenghe, R.; Woods, W.I. The impact of warfare on the soil environment. Earth-Sci. Rev. 2013, 127, 1–15. [Google Scholar] [CrossRef]
- Zhang, C.X.; Yue, P.; Di, L.P.; Wu, Z.Y. Automatic Identification of Center Pivot Irrigation Systems from Landsat Images Using Convolutional Neural Networks. Agriculture 2018, 8. [Google Scholar] [CrossRef]
- Silburt, A.; Ali-Dib, M.; Zhu, C.; Jackson, A.; Valencia, D.; Kissin, Y.; Tamayo, D.; Menou, K. Lunar crater identification via deep learning. Icarus 2019, 317, 27–38. [Google Scholar] [CrossRef]
- Hanson, W.S.; Oltean, I.A. Archaeology from Historical Aerial and Satellite Archives; Springer Science & Business Media: Berlin/Heidelberg, Germany, 2012. [Google Scholar]
- Cowley, D.C.; Stichelbaut, B.B. Historic Aerial Photographic Archives for European Archaeology. Eur. J. Archaeol. 2012, 15, 217–236. [Google Scholar] [CrossRef]
- Sevara, C. Top secret topographies: Recovering two and three-dimensional archaeological information from historic reconnaissance datasets using image-based modelling techniques. Int. J. Herit. Digit. Era 2 2013, 3, 395–418. [Google Scholar] [CrossRef]
- Krogh, S.O.; Dypvik, H.; Etzelmuller, B. Automatic detection of circular depressions in digital elevation data in the search for potential Norwegian impact structures. Norw. J. Geol. 2007, 87, 157–166. [Google Scholar]
Figure 1.
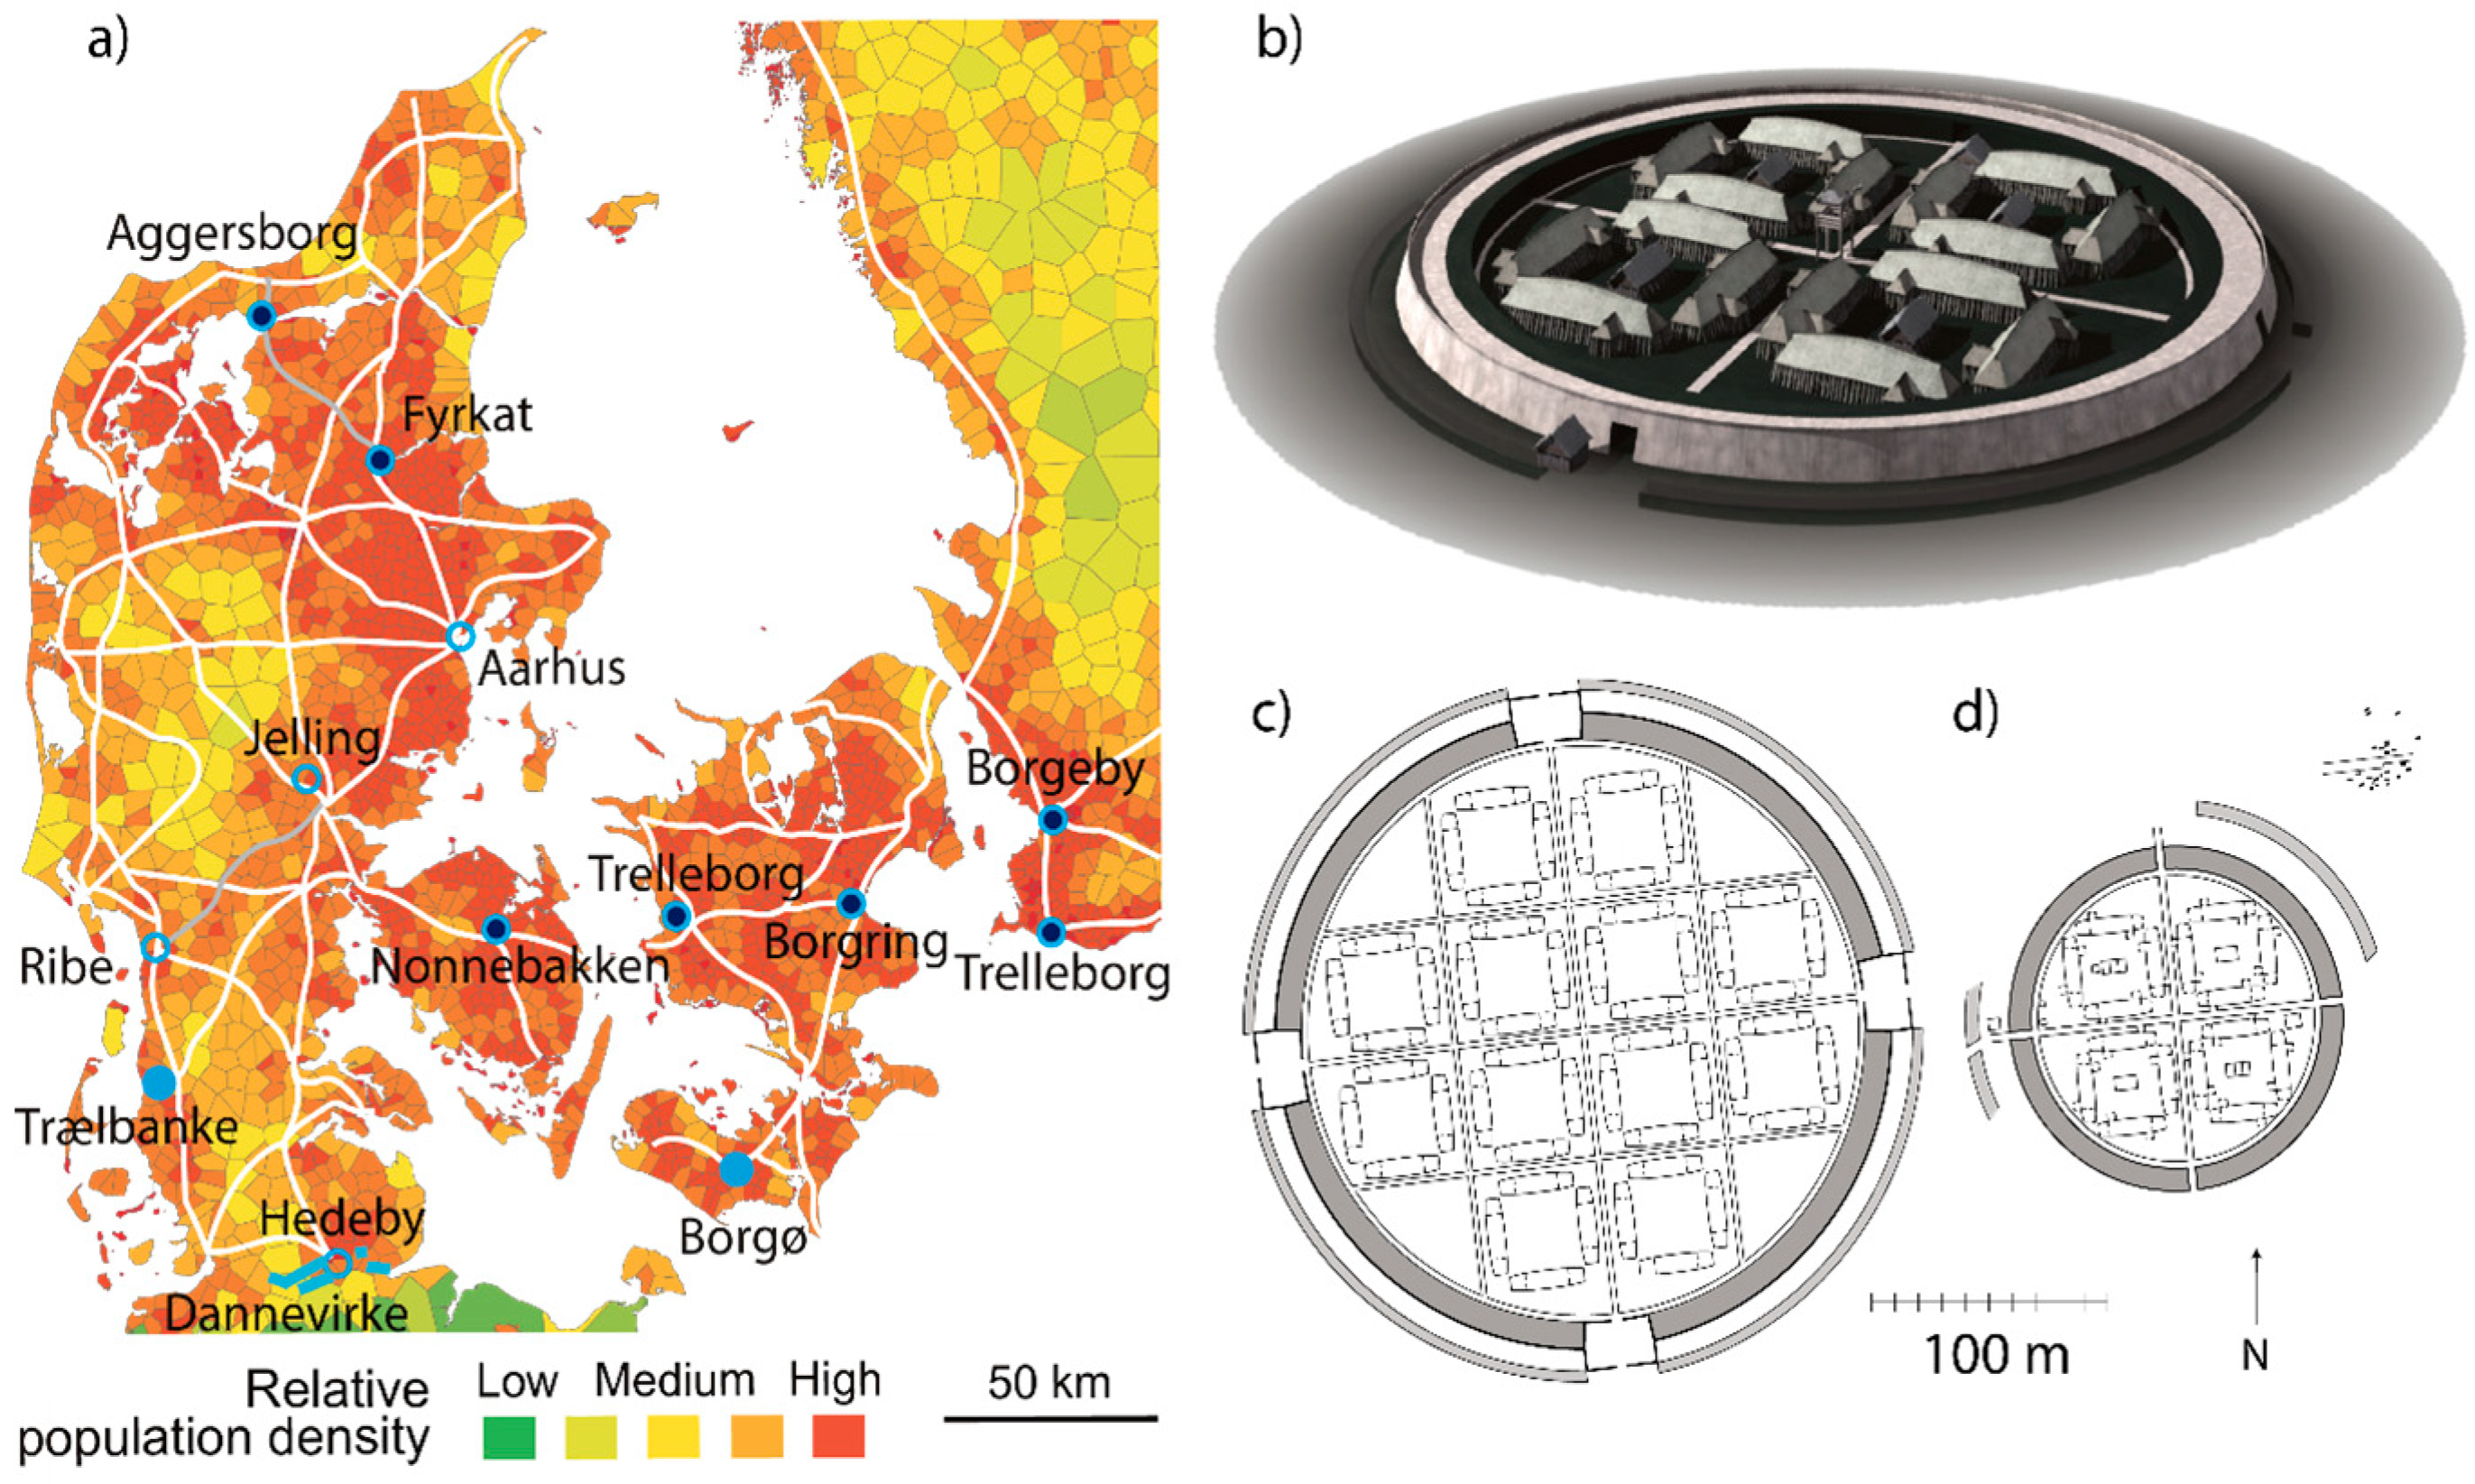
Confirmed and new candidates for Viking Age military installations and ring fortresses on the map of Denmark and adjacent areas of present-day Germany and Sweden showing estimates of relative late Viking Age human (10th Century CE) population density [17], the confirmed Viking Age ring fortresses (blue-black circles), contemporary fortified cities, and the royal center in UNESCO World Heritage site Jelling (open blue) [6], the fully developed linear defensive earthwork across the southern frontier, the UNESCO World Heritage site Dannevirke, and the two new candidate sites, Trælbanke and Borgø (larger blue circles), from the automatic feature detection (a), archaeological reconstruction of the Fyrkat ring fortress (b), and an example of plans of recognized ring fortresses Aggersborg (c), and Fyrkat (d) [6,8].
Figure 1.
Confirmed and new candidates for Viking Age military installations and ring fortresses on the map of Denmark and adjacent areas of present-day Germany and Sweden showing estimates of relative late Viking Age human (10th Century CE) population density [17], the confirmed Viking Age ring fortresses (blue-black circles), contemporary fortified cities, and the royal center in UNESCO World Heritage site Jelling (open blue) [6], the fully developed linear defensive earthwork across the southern frontier, the UNESCO World Heritage site Dannevirke, and the two new candidate sites, Trælbanke and Borgø (larger blue circles), from the automatic feature detection (a), archaeological reconstruction of the Fyrkat ring fortress (b), and an example of plans of recognized ring fortresses Aggersborg (c), and Fyrkat (d) [6,8].

Figure 2.
Summary of feature detection, classification, and evaluation workflow, with inset map of Denmark showing the locations of the resulting 199 ring features classified as candidate fortresses and their actual classifications.
Figure 2.
Summary of feature detection, classification, and evaluation workflow, with inset map of Denmark showing the locations of the resulting 199 ring features classified as candidate fortresses and their actual classifications.

Figure 3.
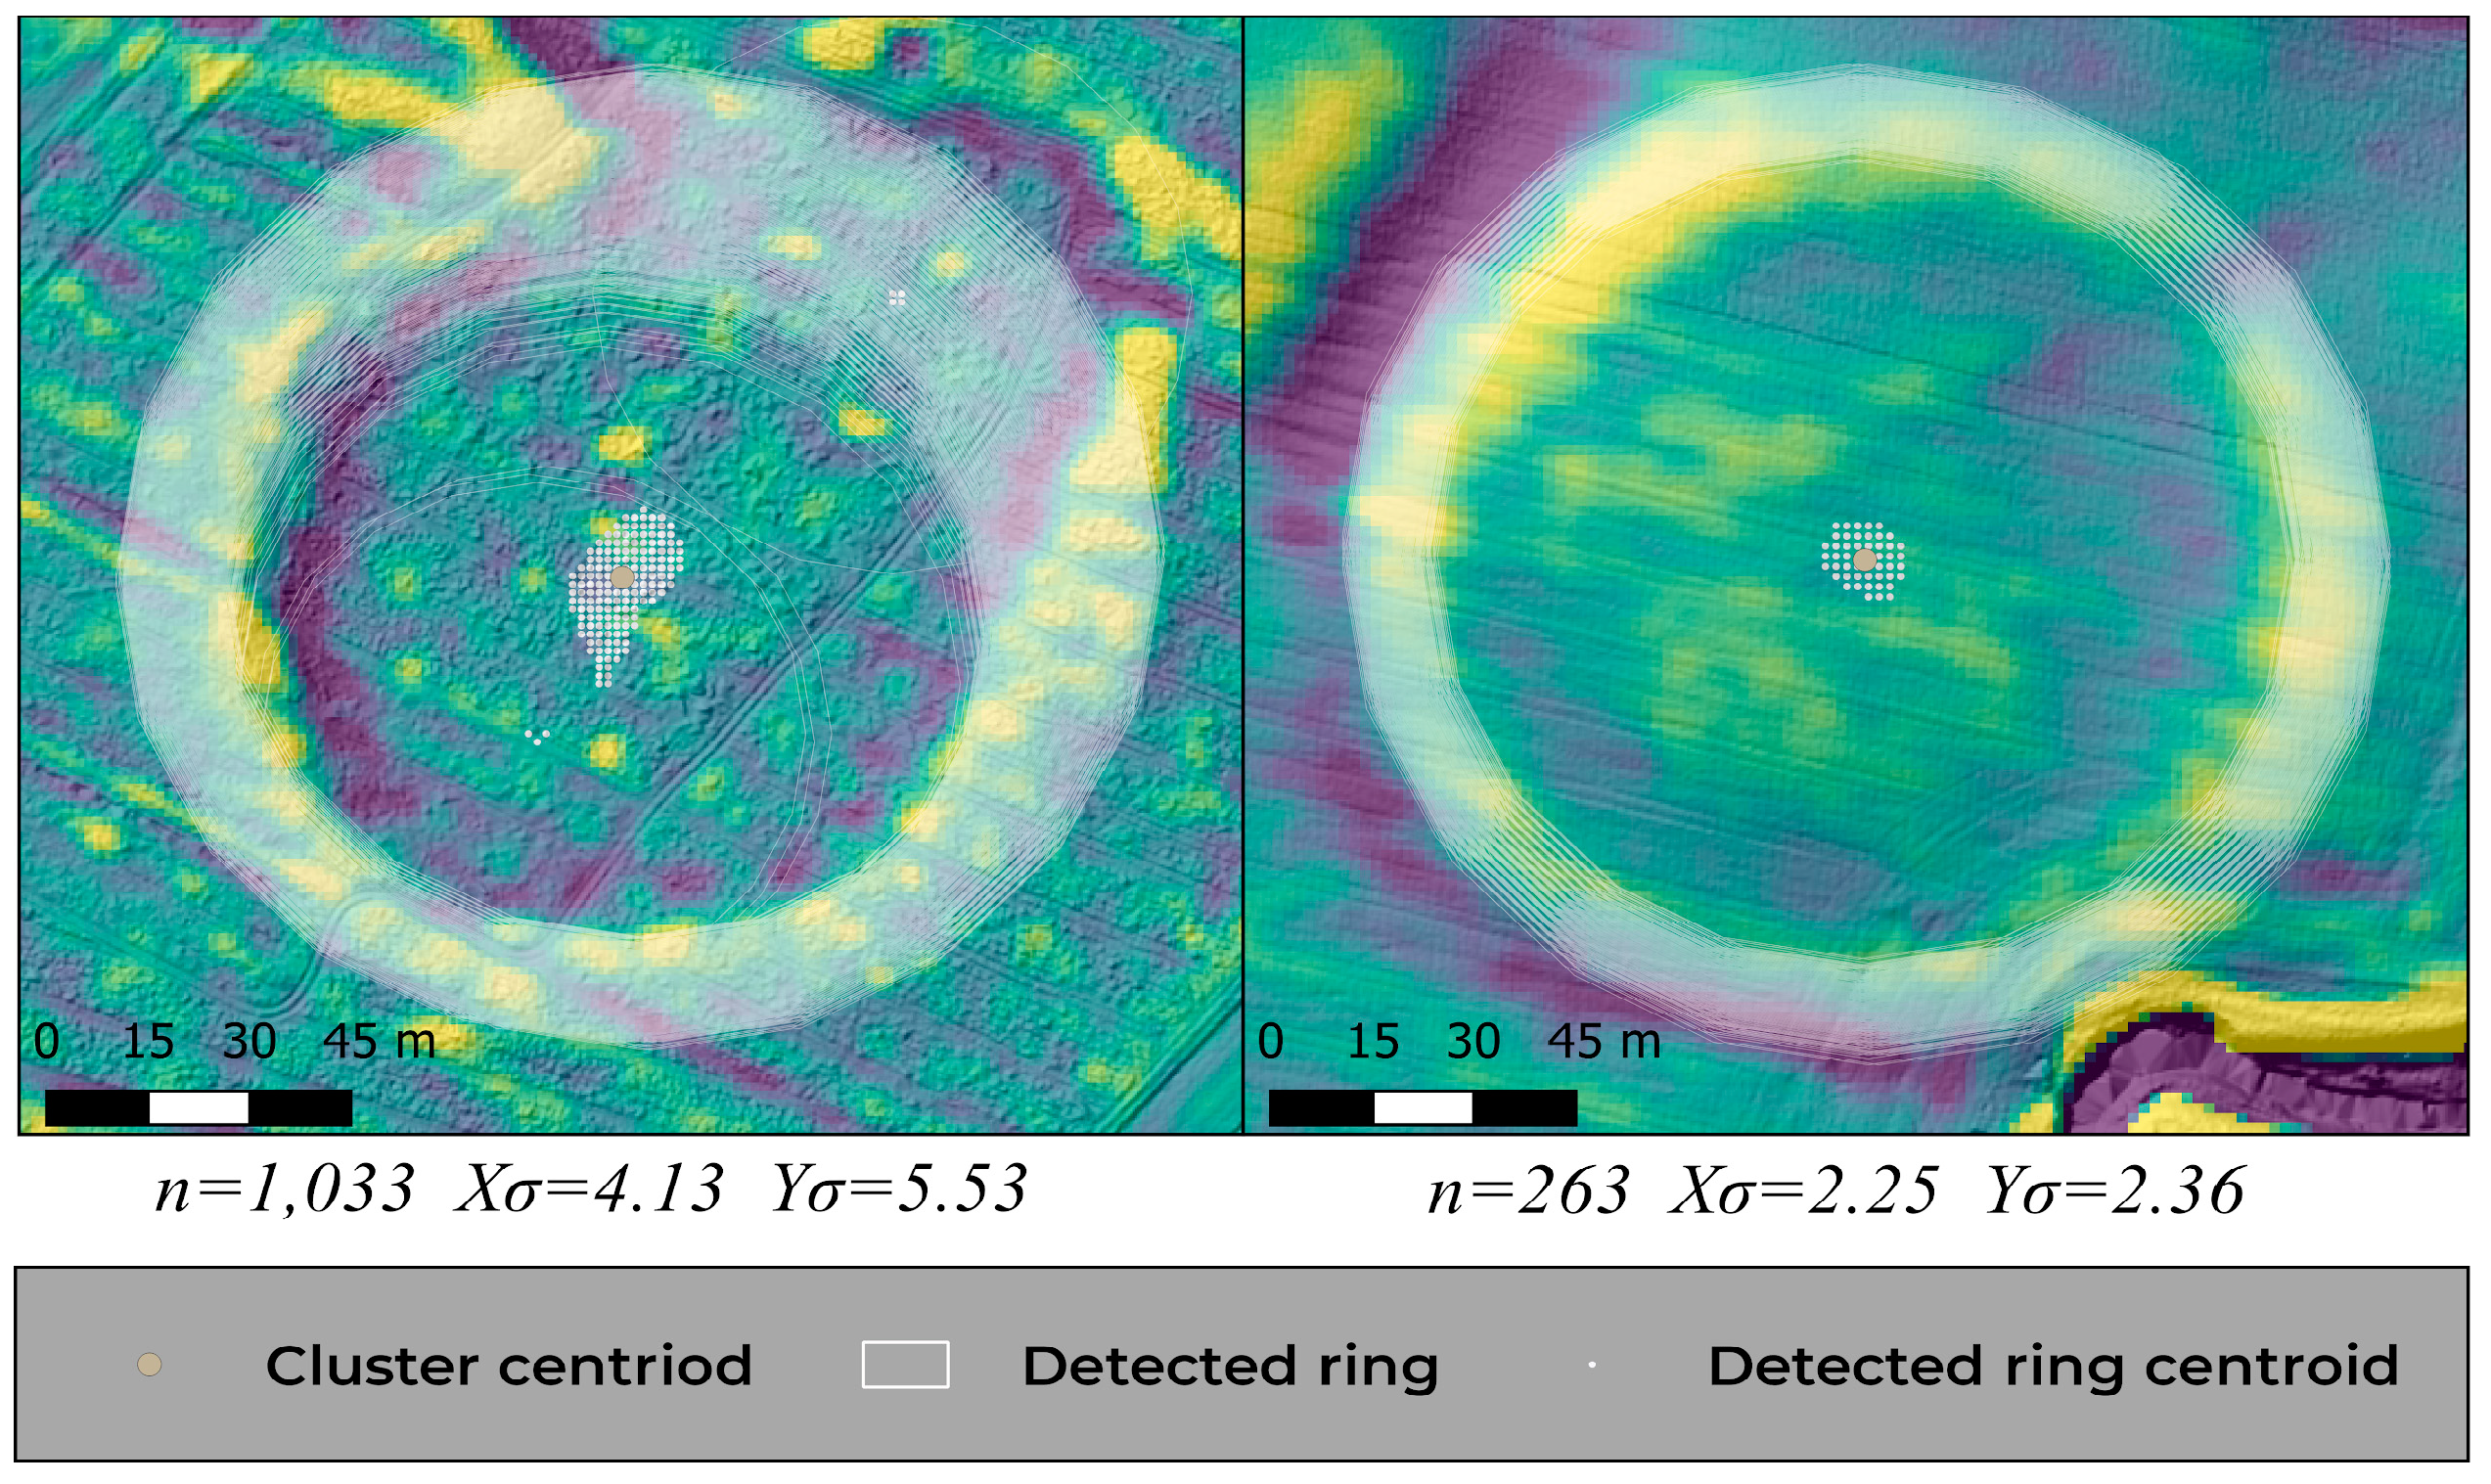
Point clusters from template matching, comparing an ovate glacial feature (left) with a circular ring fortress (right). A large number of superimposed and adjacent rings were detected for each feature. The DBSCAN algorithm was used to identify clusters of points within 2.26 m of each other (the diagonal of one pixel). The coordinate used for each cluster (of n points) was used as the center of the detected points. A ratio between the standard deviation (σ) of the X and Y coordinates of each point cluster was used to estimate concentricity.
Figure 3.
Point clusters from template matching, comparing an ovate glacial feature (left) with a circular ring fortress (right). A large number of superimposed and adjacent rings were detected for each feature. The DBSCAN algorithm was used to identify clusters of points within 2.26 m of each other (the diagonal of one pixel). The coordinate used for each cluster (of n points) was used as the center of the detected points. A ratio between the standard deviation (σ) of the X and Y coordinates of each point cluster was used to estimate concentricity.

Figure 4.
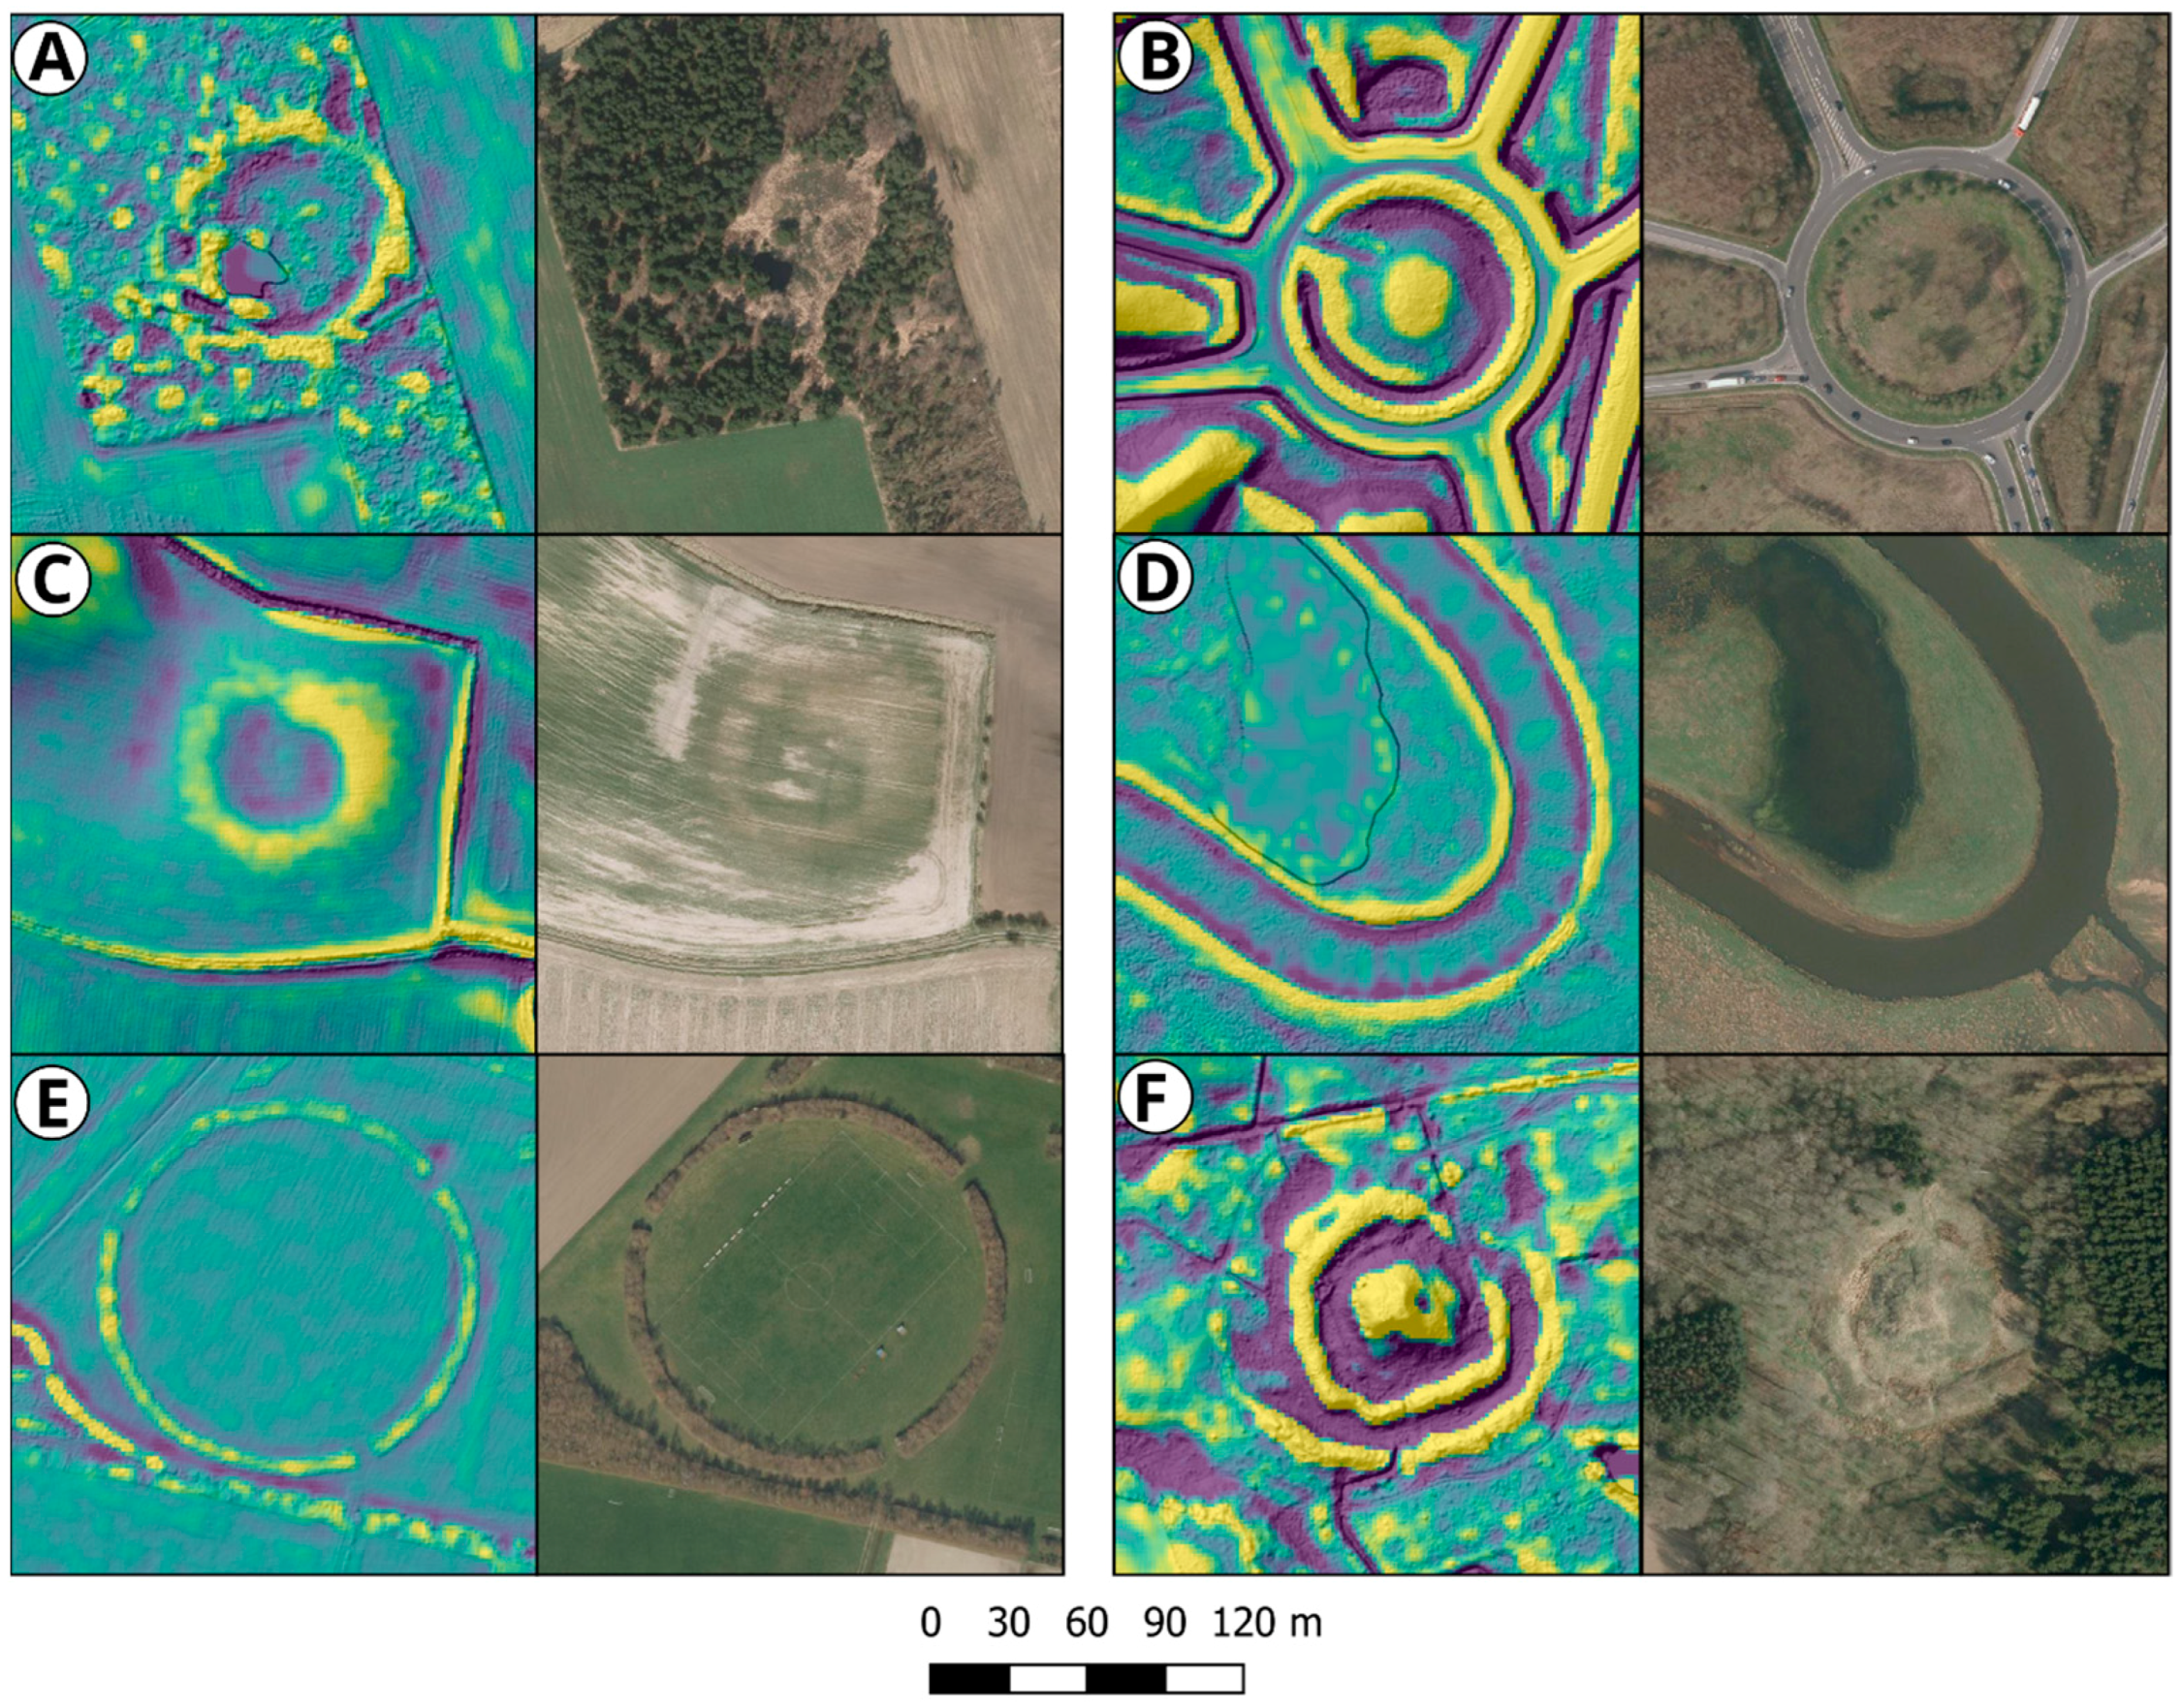
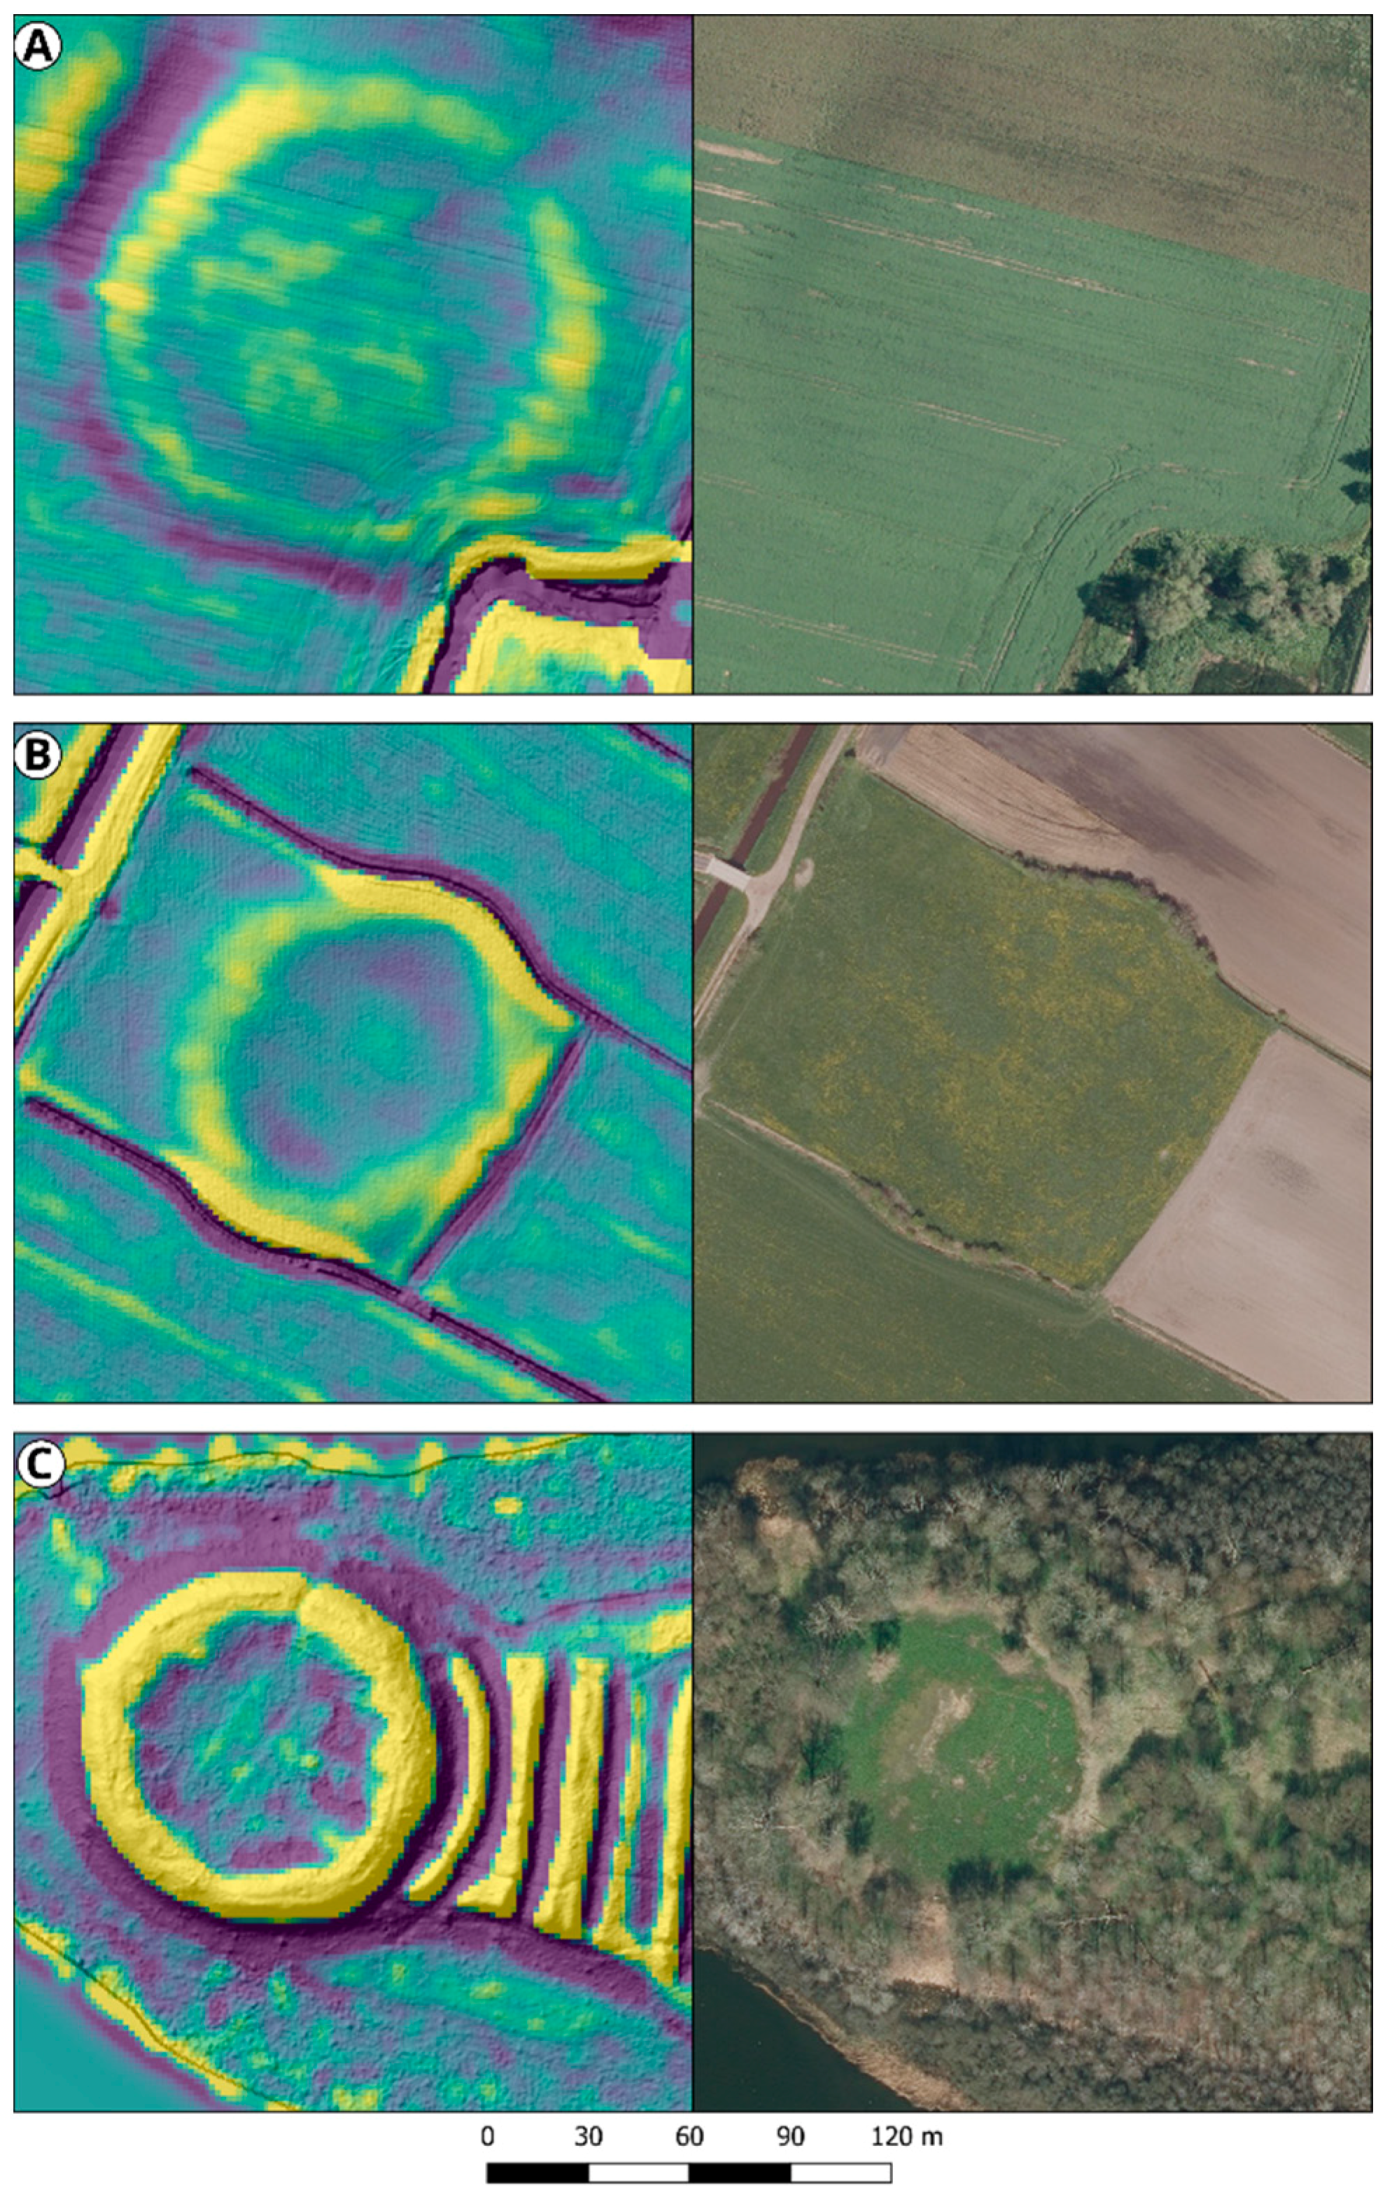
Examples of features detected in this study, seen in both airborne laser scanning (ALS) derived residual relief and in orthophotography showing the importance of having both the ALS data and the aerial photography for interpreting the automatically identified features: probable glacial pingo remains at Kongsbjerg near Tønder, South Jutland (A), contemporary roundabout (B), likely partly rimmed kettle-hole from the last glacial at Gudum near Lemvig (C), Meander on the river Skjern Å (D), modern sports field (E), Medieval fortification (Sigersholm) on Zealand with a partial circular outer moat and ramparts (F).
Figure 4.
Examples of features detected in this study, seen in both airborne laser scanning (ALS) derived residual relief and in orthophotography showing the importance of having both the ALS data and the aerial photography for interpreting the automatically identified features: probable glacial pingo remains at Kongsbjerg near Tønder, South Jutland (A), contemporary roundabout (B), likely partly rimmed kettle-hole from the last glacial at Gudum near Lemvig (C), Meander on the river Skjern Å (D), modern sports field (E), Medieval fortification (Sigersholm) on Zealand with a partial circular outer moat and ramparts (F).

Figure 5.
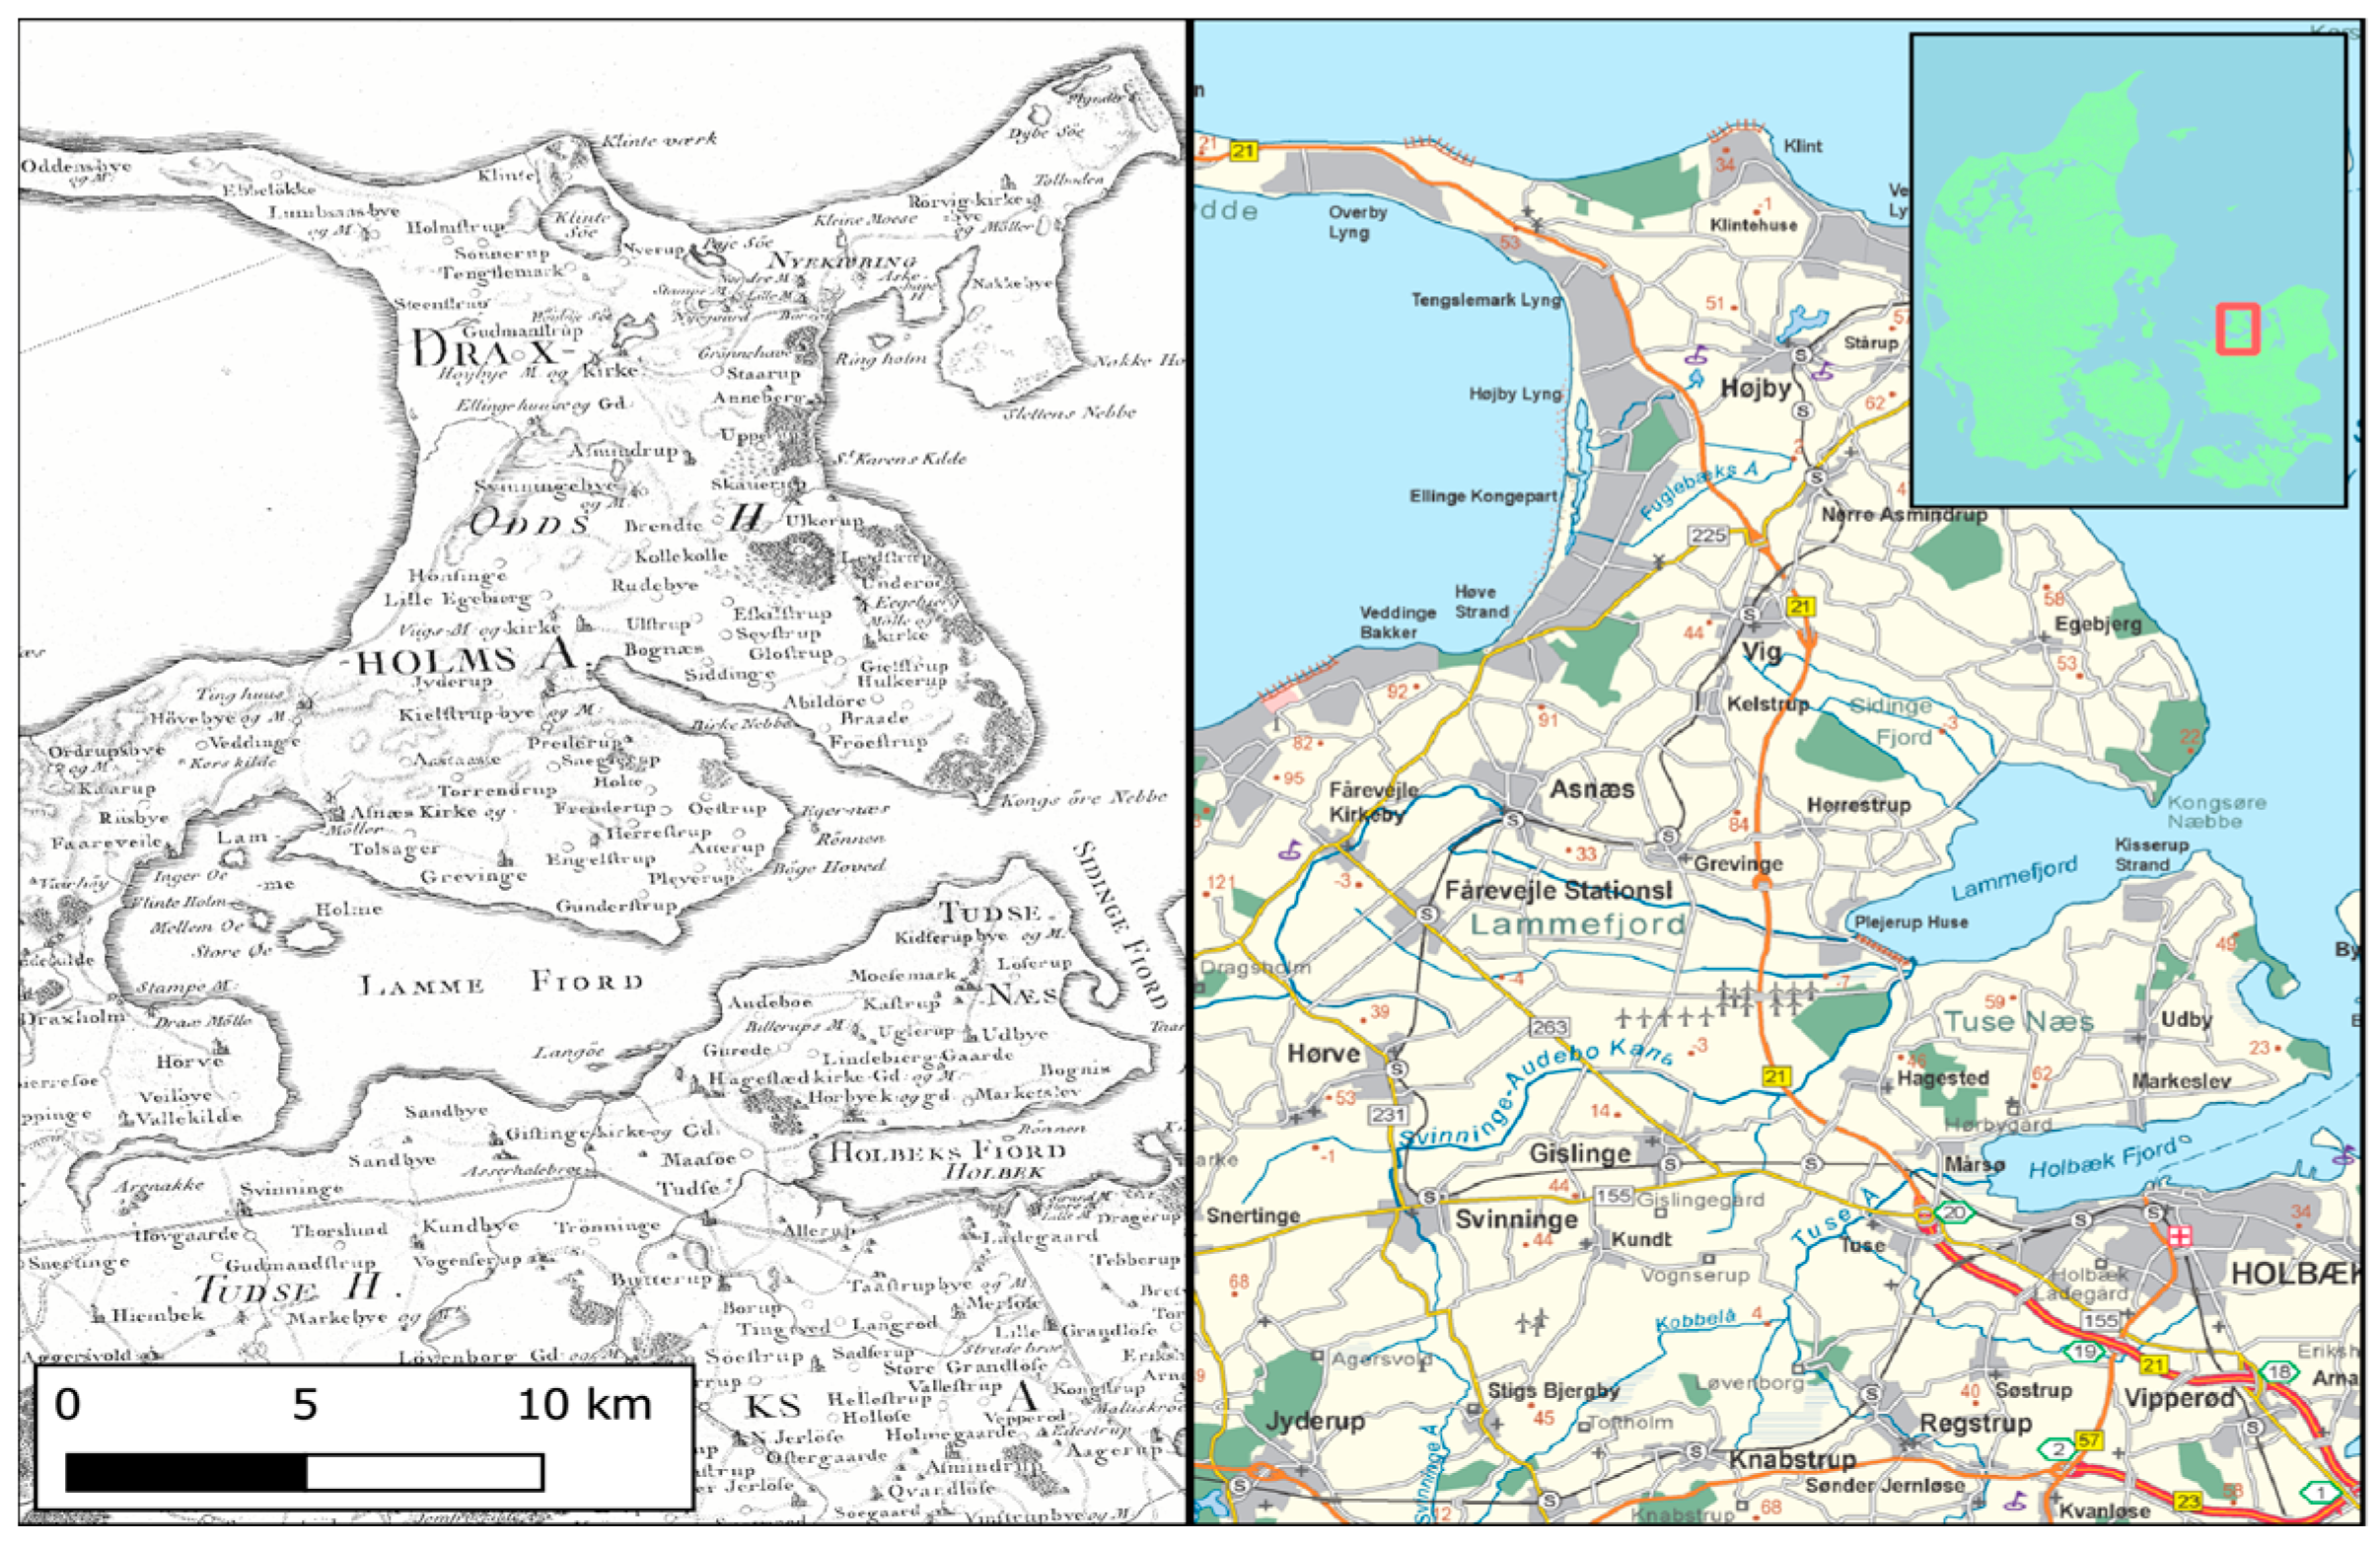
Comparison between the Videnskabernes Selskabs map from 1770 (left) [44] and 1:200,000 present day mapping of the Lammefjord area from Kortforsyningen (right). Extensive land reclamation in the inner fjord occurred from the mid-19th Century CE. This is illustrative of the dramatic alteration of landscapes that occurred across the country.
Figure 5.
Comparison between the Videnskabernes Selskabs map from 1770 (left) [44] and 1:200,000 present day mapping of the Lammefjord area from Kortforsyningen (right). Extensive land reclamation in the inner fjord occurred from the mid-19th Century CE. This is illustrative of the dramatic alteration of landscapes that occurred across the country.

Figure 6.
Sankey diagram showing the relationship between predicted and manual classifications. A high number of features are either modern or result from noise. Additionally, classes of features not included in the classification workflow were identified, including marine features related to relict beach ridges and other archaeological features not related to fortifications.

Figure 7.
(A): The five known examples of Trelleborg-type fortresses in Denmark. Note that Trelleborg, Fyrkat, and Aggersborg have been extensively reconstructed and that Nonnebakken has been obliterated by modern development (location marked with a red diamond). (B): Further fortresses identified by the classifier. (C): The four fortresses misidentified by the classifier.

Figure 8.
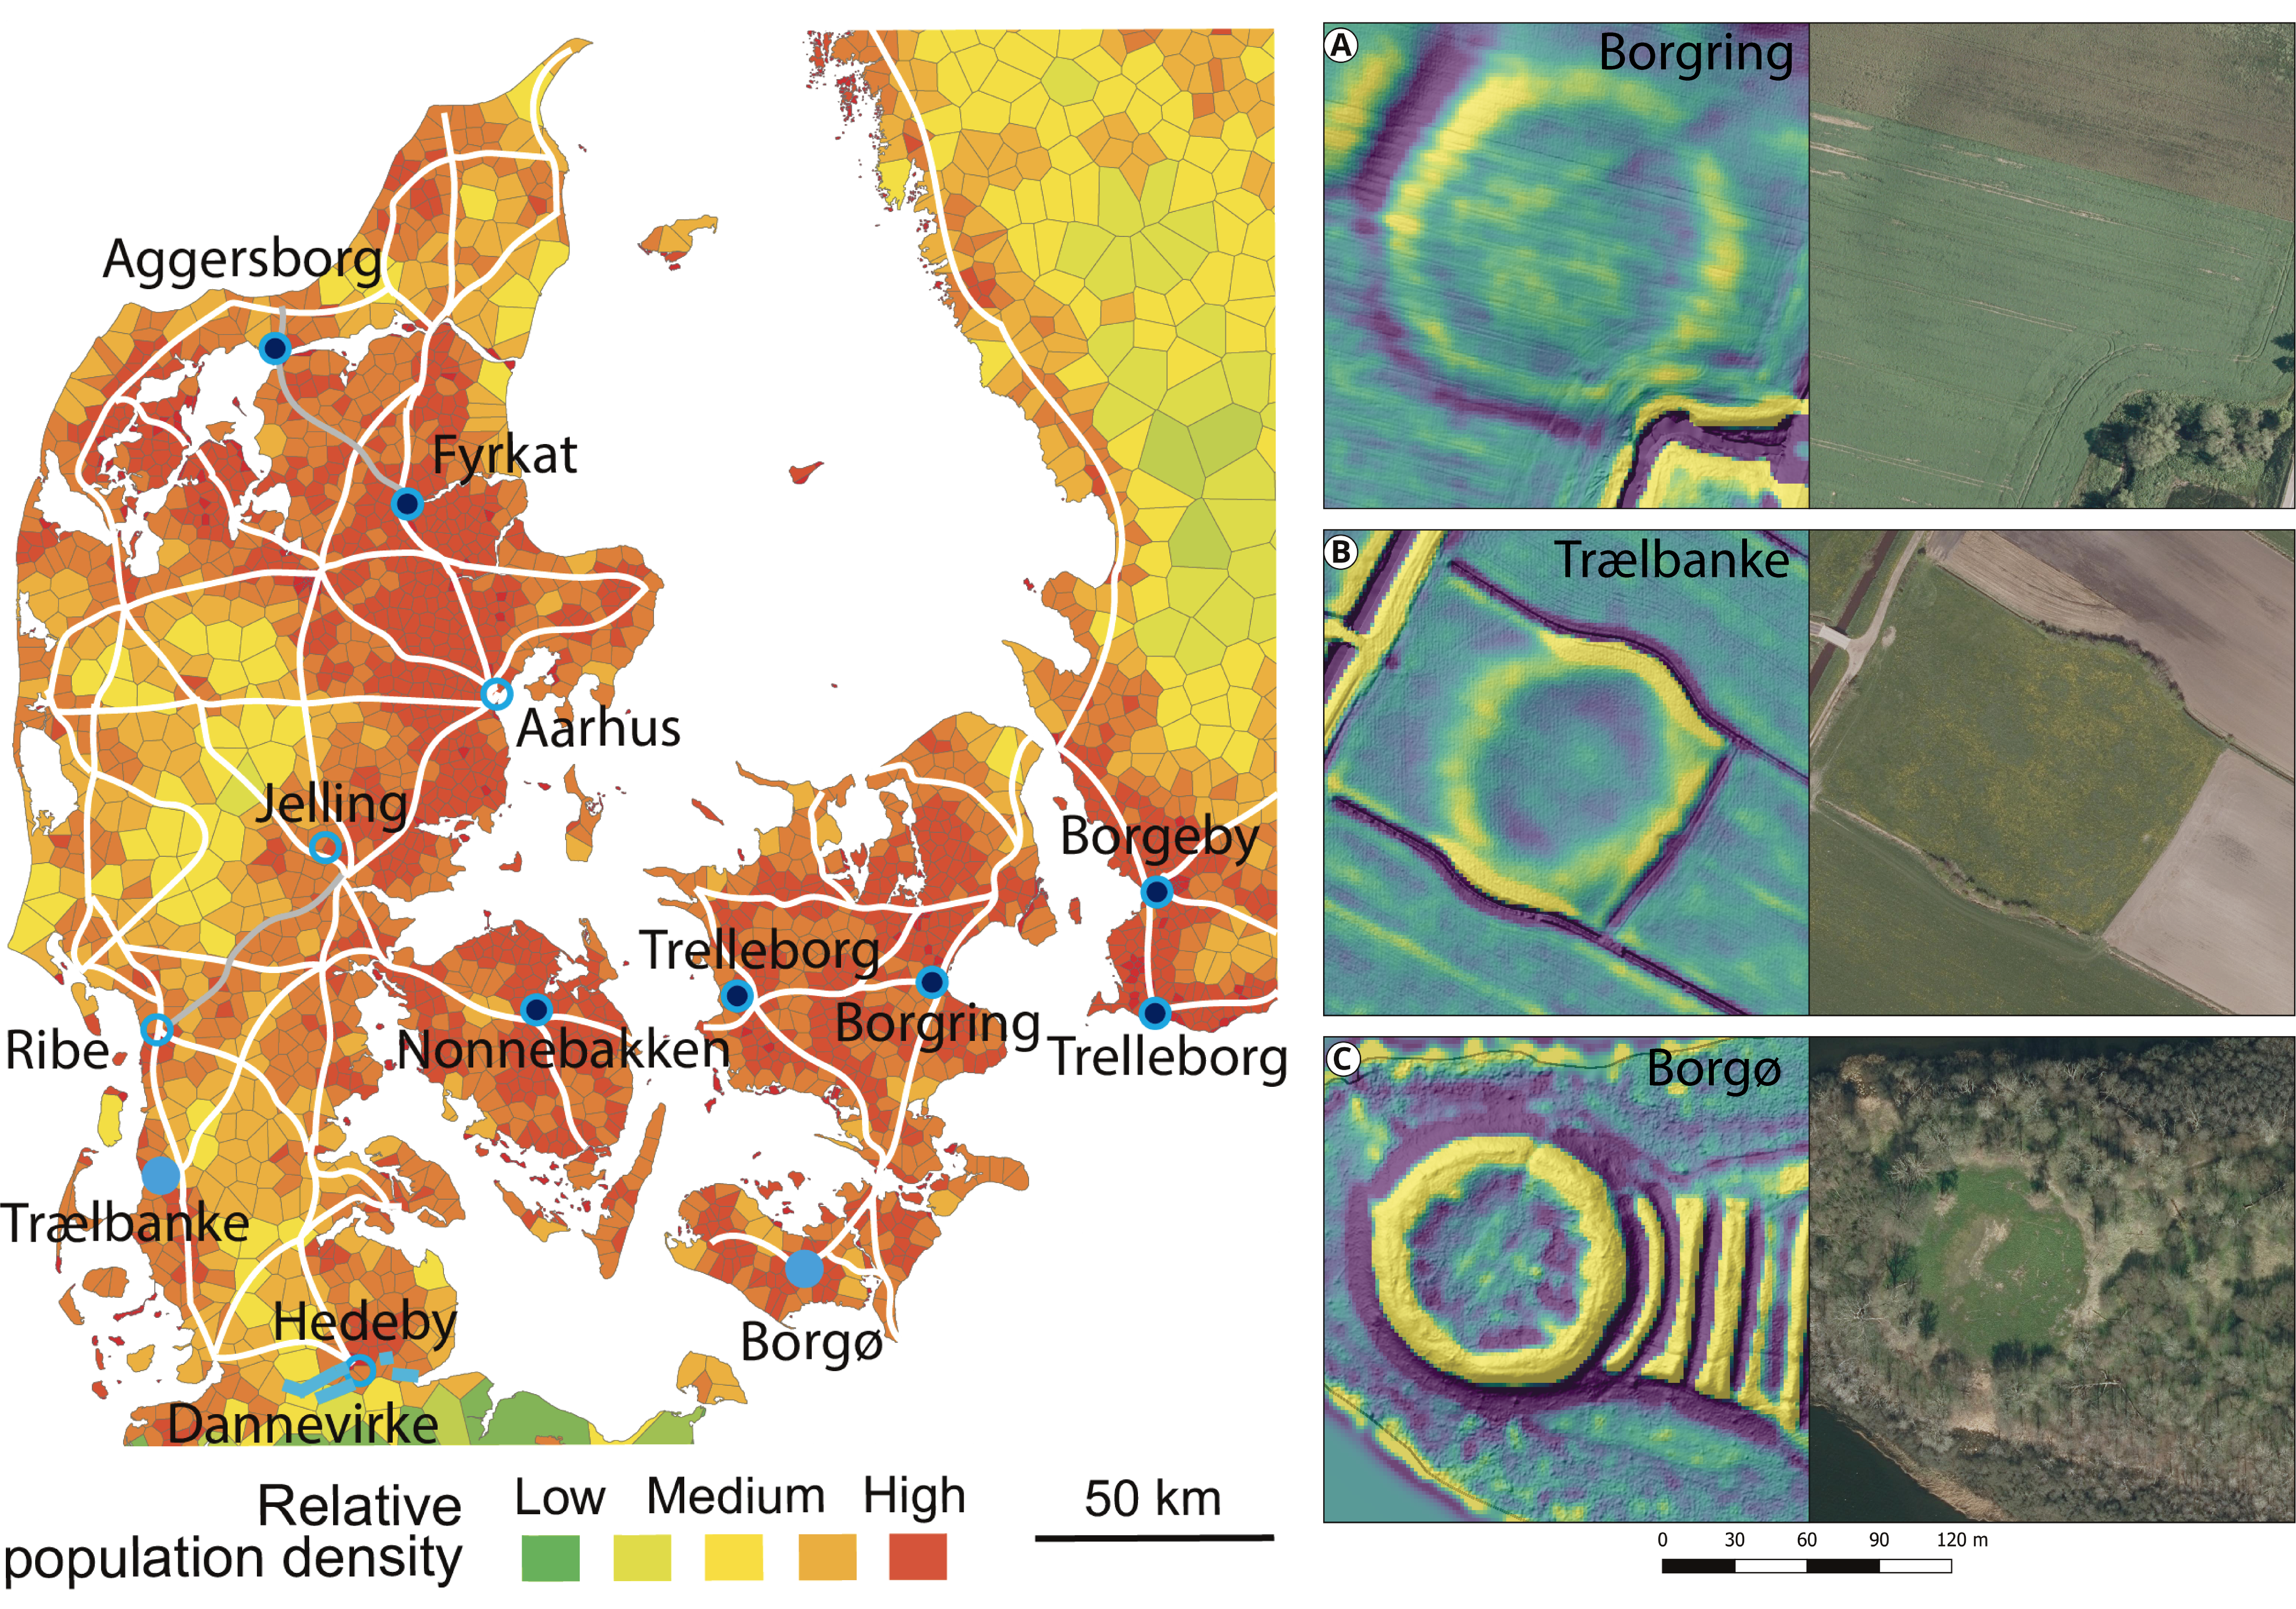
Detailed view of the known Viking Age site at Borgring (A) and candidate sites at Trælbanken (B) and Borgø (C) shown with both the residual relief model and orthophotography. All three sites have previously been identified as belonging to other periods, but are positively correlated as Trelleborg-type ring fortress candidates by our automatic feature detection approach. Only Borgring is now a recognized Trelleborg-type dated to the reign of Harald Bluetooth c. 958 to 986 CE.
Figure 8.
Detailed view of the known Viking Age site at Borgring (A) and candidate sites at Trælbanken (B) and Borgø (C) shown with both the residual relief model and orthophotography. All three sites have previously been identified as belonging to other periods, but are positively correlated as Trelleborg-type ring fortress candidates by our automatic feature detection approach. Only Borgring is now a recognized Trelleborg-type dated to the reign of Harald Bluetooth c. 958 to 986 CE.

Figure 9.
Suggestions for paleo-landscapes at the two candidate sites in the late Viking-Age Borgø (A) and Trælbanke (B) as regional overviews based on a false-color digital elevation model below a transparent residual relief visualization. At Borgø, the blue signature depicts a likely paleo-lake level before a major drainage of the Maribo lakes [81] with present-day then flooded areas around the Borgø site as shading in the blue (C). At Trælbanke, the blue signature is marsh sediments (Danish Geological Surveys Soil Map 1:25,000), showing where thickness of storm-flood generated Wadden Sea tidal sediments are greater than approximately 90 cm today (D).


Table 1.
Parameters used to refine classified rings.
| Parameter | Description | Usage | Explanation |
|---|---|---|---|
| Minimum radius (minRad) | The minimum radius identified in the point cluster | Where (maxRad − minRad) > 5 | Discard likely modern sites with narrow rampart widths |
| Maximum radius (maxRad) | The maximum radius identified in the point cluster | ||
| Xσ | Standard deviation of the points within the cluster in the X dimension | Where (max(XσYσ)/min(XσYσ)) < 1.1 | A large ratio between these parameters indicates a more amorphous feature (e.g., river meanders with changing radii) |
| Yσ | Standard deviation of the points within the cluster in the Y dimension | ||
| Score maximum | The normalized maximum score from the ring finding algorithm | Score maximum > 0.26 | Established using known Trelleborg-type sites |
Table 2.
Vectorized data from the first nation-wide Danish maps (Videnskabernes Selskabs kort [44]).
Table 2.
Vectorized data from the first nation-wide Danish maps (Videnskabernes Selskabs kort [44]).
| Dataset | Description | Motivation |
|---|---|---|
| Coast | 18th Century coastline | It has been hypothesized that proximity to the sea is an important determinant for ring fortress location |
| Rivers | 18th Century water courses | These represent barriers to movement, sources of fresh water, and potential communication routes. |
| Water bodies and water meadows (enge) | 18th Century lakes and marshes | Barriers to movement. |
| Major roads | 18th Century major roads (landevej) communication routes between large population centers. | Known ring fortresses are located near important routes between population centers. |
| Minor roads | 18th Century minor roads between villages and hamlets | Minor communication routes could also be important. |
Table 3.
Place names that possible are correlated to fortress locations used as proximity rasters to explore correlation between these names and possible fortress locations.
Table 3.
Place names that possible are correlated to fortress locations used as proximity rasters to explore correlation between these names and possible fortress locations.
| Name | Meaning | Justification |
|---|---|---|
| borg | Fortress, hill | Common element in ring fortress names (e.g., Borgring, Trelleborg, Aggersborg, Borgeby) |
| borre | As borg | |
| banke | Bank, hill | Found in association with a number of fortresses |
| træl | Slave, thrall | Found in association with a number of earlier fortresses (e.g., Trælborg) |
| trelle | Staves, palisade/pallisade | Associated with ring fortresses at Trelleborg on Zealand and in Sweden |
| ring | Ring | Associated with a ring fortress at Borgring |
| trold | Troll, wizard | Found in association with a number of earlier fortresses (e.g., Troldborg) |
Table 4.
Examples of natural and anthropogenic features uses as training data for the subsequent classification for ring fortress (Ringborg) detection within Denmark.
Table 4.
Examples of natural and anthropogenic features uses as training data for the subsequent classification for ring fortress (Ringborg) detection within Denmark.
| Class | Description | n |
|---|---|---|
| Kettle hole | Glacial kettle holes and possible pingo remains | 86 |
| Meanders | River meanders, oxbow lakes | 11 |
| Ringborg | Recognized Viking Age ring fortresses | 5 |
Table 5.
The relative importance for map layers/features used to train the random forests classifier.
Table 5.
The relative importance for map layers/features used to train the random forests classifier.
| Feature | Feature Importance |
|---|---|
| Topographic Position Index (140-m radius) | 0.26 |
| Topographic Position Index (70-m radius) | 0.16 |
| 18th Century Major roads | 0.1 |
| 18th Century Rivers | 0.09 |
| 18th Century Minor roads | 0.07 |
| ~ring place name element | 0.06 |
| Slope | 0.05 |
| Coast | 0.05 |
| Lakes, bogs, and water meadows | 0.05 |
| ~borre place name element | 0.04 |
| ~borg place name element | 0.04 |
| ~bank place name element | 0.04 |
| trold~ place name element | 0.02 |
| træl~ place name element | 0.01 |
| trelle~ place name element | 0.01 |
© 2019 by the authors. Licensee MDPI, Basel, Switzerland. This article is an open access article distributed under the terms and conditions of the Creative Commons Attribution (CC BY) license (http://creativecommons.org/licenses/by/4.0/).
Share and Cite
MDPI and ACS Style
Stott, D.; Kristiansen, S.M.; Sindbæk, S.M. Searching for Viking Age Fortresses with Automatic Landscape Classification and Feature Detection. Remote Sens. 2019, 11, 1881. https://doi.org/10.3390/rs11161881
AMA Style
Stott D, Kristiansen SM, Sindbæk SM. Searching for Viking Age Fortresses with Automatic Landscape Classification and Feature Detection. Remote Sensing. 2019; 11(16):1881. https://doi.org/10.3390/rs11161881
Chicago/Turabian StyleStott, David, Søren Munch Kristiansen, and Søren Michael Sindbæk. 2019. "Searching for Viking Age Fortresses with Automatic Landscape Classification and Feature Detection" Remote Sensing 11, no. 16: 1881. https://doi.org/10.3390/rs11161881
Note that from the first issue of 2016, this journal uses article numbers instead of page numbers. See further details here.