Technical Note

Quantitative Phenotyping of Northern Leaf Blight in UAV Images Using Deep Learning

1
Plant Breeding and Genetics Section, School of Integrative Plant Science, Cornell University, Ithaca, NY 14853, USA
2
Department of Computer Science, Columbia University, New York, NY 10027, USA
3
Department of Mechanical Engineering and Institute of Data Science, Columbia University, New York, NY 10027, USA
4
Plant Pathology and Plant-Microbe Biology Section, School of Integrative Plant Science, Cornell University, Ithaca, NY 14853, USA
*
Author to whom correspondence should be addressed.
Remote Sens. 2019, 11(19), 2209; https://doi.org/10.3390/rs11192209
Submission received: 29 July 2019 / Revised: 13 September 2019 / Accepted: 16 September 2019 / Published: 21 September 2019

Abstract

:
Plant disease poses a serious threat to global food security. Accurate, high-throughput methods of quantifying disease are needed by breeders to better develop resistant plant varieties and by researchers to better understand the mechanisms of plant resistance and pathogen virulence. Northern leaf blight (NLB) is a serious disease affecting maize and is responsible for significant yield losses. A Mask R-CNN model was trained to segment NLB disease lesions in unmanned aerial vehicle (UAV) images. The trained model was able to accurately detect and segment individual lesions in a hold-out test set. The mean intersect over union (IOU) between the ground truth and predicted lesions was 0.73, with an average precision of 0.96 at an IOU threshold of 0.50. Over a range of IOU thresholds (0.50 to 0.95), the average precision was 0.61. This work demonstrates the potential for combining UAV technology with a deep learning-based approach for instance segmentation to provide accurate, high-throughput quantitative measures of plant disease.

1. Introduction

Global food production is severely threatened by plant disease [1,2]. In order to breed for increased plant resistance and better understand the mechanisms of disease, breeders and researchers alike need accurate and repeatable methods to measure subtle differences in disease symptoms [3,4].
Although examples exist of qualitative disease resistance where plants exhibit presence/absence of disease symptoms, the majority of observed resistance is quantitative [5]. Quantitative traits exhibit a continuous distribution of phenotypic values and are controlled by multiple underlying genes that interact with the environment. Additionally, pathogen virulence is quantitative [6], with the combination of these two systems resulting in complex plant–pathogen interactions [7]. The ability to accurately measure subtle phenotypic differences in this complex multidimensional system is necessary to better understand host–pathogen interactions and develop disease resistant plant varieties.
Northern leaf blight (NLB) is a foliar fungal disease affecting maize (Zea mays L.) caused by Setosphaeria turcica (anamorph Exserohilum turcicum). It occurs worldwide and is a particular problem in humid climates [8,9]. In the US and Ontario, estimated yield losses due to NLB have increased over recent years and accounted for estimated yield losses of 14 million tons in 2015 [10]. NLB symptoms begin as gray-green, water soaked lesions that progress to form distinct cigar shaped necrotic lesions. Visual estimates of NLB severity are typically carried out in the field using ordinal [11] or percentage scales [12]. However, visual estimates have been shown to be subject to human error and variation both between and among scorers in NLB [13], as well as various other plant diseases (e.g., [14,15]).
Advances have been made in recent years using image-based approaches to detect and quantify disease symptoms that increase throughput and eliminate human error [16]. More recently, deep learning has shown tremendous potential in the field of plant phenotyping [17] and has previously been applied to plant disease identification and classification [18].
Image-based deep learning can be broadly grouped into three areas: image classification, object detection, and object segmentation. Image classification provides qualitative (presence/absence) measures of objects in an image, as was previously used for identification of NLB symptoms in images [19]. Instance segmentation, however, advances image classification to identify individual objects in an image, thus providing quantitative measures such as number, size, and location of objects within an image. The area of instance segmentation is rapidly advancing [20], with a recent breakthrough being Mask R-CNN [21]. Mask R-CNN performs instance classification and pixel segmentation of objects and has been successfully used in a diverse range of tasks, including street scenes [21], ice wedge polygons [22], cell nuclei [23], and plant phenotyping [24].
The rapid advancement of unmanned aerial vehicle (UAV) technology has made these platforms capable of capturing images suitable for plant phenotyping [25,26]. The combination of UAV-based image capture and a deep learning-based approach for instance segmentation has the potential to provide an accurate, high-throughput method of plant disease phenotyping under real world conditions.
The aim of this study was to develop a high-throughput method of quantifying NLB under field conditions. A trained Mask R-CNN model was used to accurately count and measure individual NLB lesions in UAV-collected images. To our knowledge, this is the most extensive application of Mask R-CNN to quantitatively phenotype a foliar disease affecting maize using UAV imagery.

2. Materials and Methods

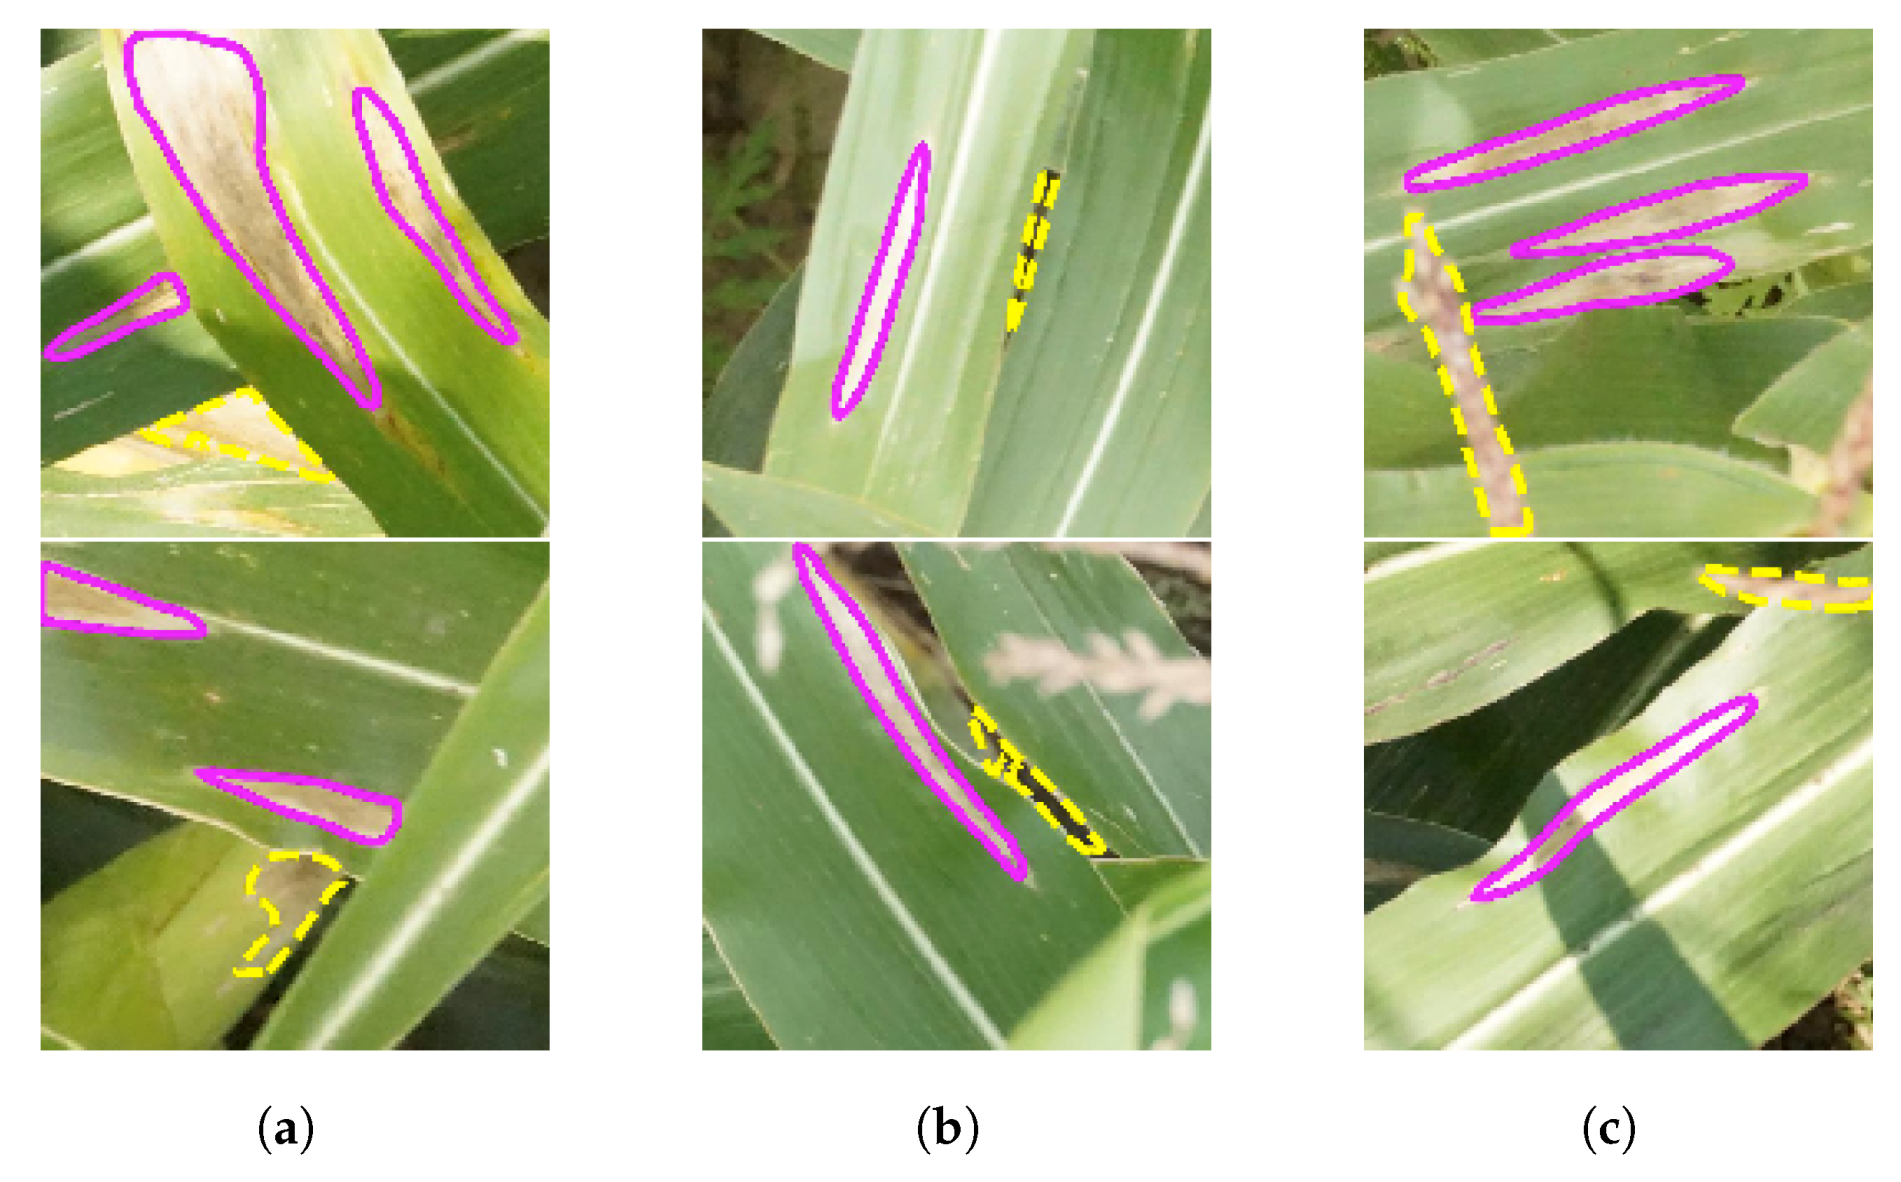
2.1. Image Annotation

Through collection by a camera mounted on a UAV flown at an altitude of 6 m, aerial images of maize artificially inoculated with S. turcica [27] were used as a starting point for our image dataset. The location of lesions was previously annotated by trained plant pathologists in 7669 UAV-based images using a simple line annotation tool [27]. Using the line annotations, individual lesions were cropped out of the full-size images (Figure A1). From the center point of each line, images were cropped in all directions determined by:
b b o x m a x 2 + b ,
where b b o x is the smallest bounding box that can be drawn around the line annotation, b b o x m a x is the maximum dimension of the bounding box and b is a 300 pixel buffer (Figure A2). Cropping resulted in square images to preserve lesion aspect ratios. As a result the proximity of lesions, cropped images may contain more than one lesion. Images were further resized to 512 × 512 using the antialias filter in the Python imaging library [28]. Individual lesions in 3000 resized images were further annotated with polygons using a custom ImageJ [29] annotation macro (File S1). The perimeter of each lesion was delineated using the free hand line tool. For each image, the annotation macro produced a 512 × 512 × n binary .tiff image stack where n represents the number of lesion instances.

2.2. Annotated Dataset

The resultant annotated dataset comprised a total of 3000 resized aerial images and corresponding ground truth masks containing 5234 lesion instances. Images were in .jpg format and binary .tiff masks were converted to binary ndarrays using NumPy [30]. The dataset was split 70:15:15 into training (2100 images), validation (450 images), and test (450 images) sets (File S2).

2.3. Model and Training
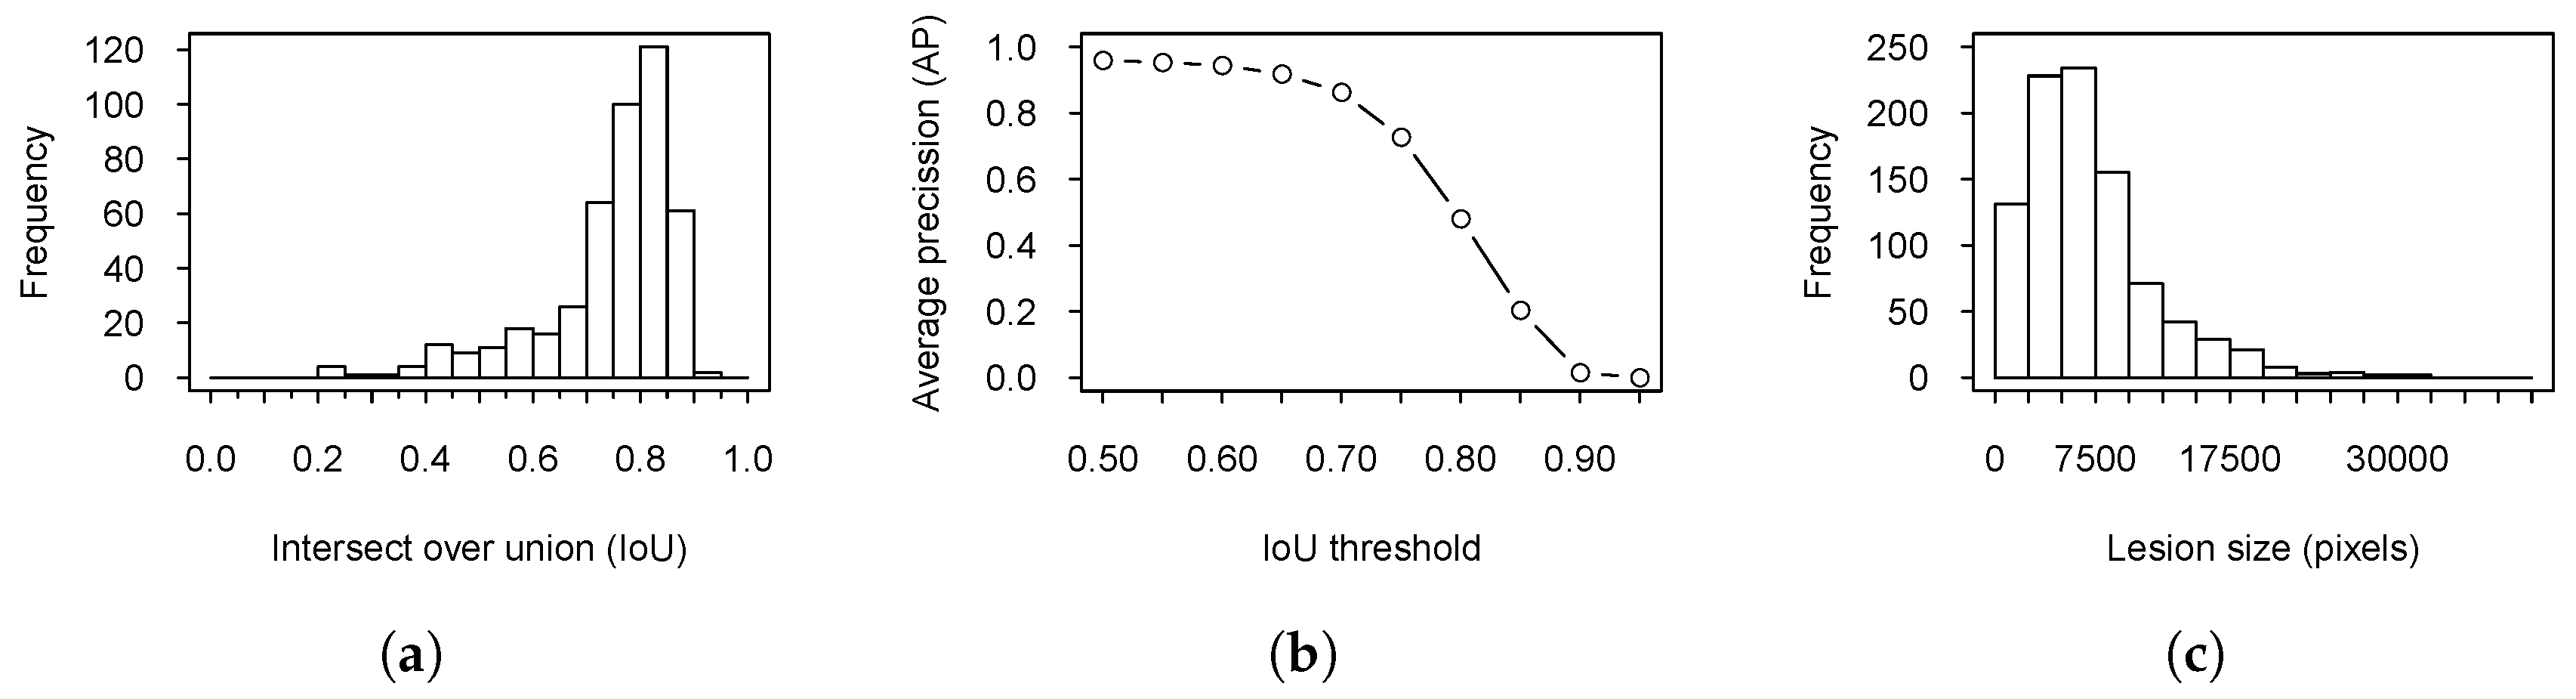
A Mask R-CNN model [21] was trained using code modified from [31] (File S3). The model was built with a resNet-101 backbone initiated with weights from a model pretrained on the MS-COCO dataset [32]. The training dataset was augmented by rotating images 90, 180, and 270, as well as rotating 0, 90, 180, and 270 followed by mirroring, resulting in seven additional augmented images per image. The model was trained for a total of 10 epochs. The pretrained weights of the resnet backbone were frozen for the first four epochs, and the head branches were trained using a learning rate of 1 × 10 - 3 . All layers were then trained for an additional epoch using a learning rate of 1 × 10 - 3 . The model was fine tuned by reducing the learning rate to 1 × 10 - 4 for the remaining five epochs. The model began to overfit after the sixth training epoch; therefore, weights from the sixth epoch were used for subsequent model validation. Training was performed on a linux PC running Ubuntu 16.04 LTS fitted with an Intel Xeon E5-2630 CPU, 30 GB RAM, and two NVIDIA GeForce 1080Ti GPUs. Training was performed with four images per GPU giving an effective batch size of eight. Inference was conducted on single images on a single GPU.

2.4. Validation

After training, the model was used to classify the test image set and evaluated with metrics used by the COCO detection challenge [33]. Average precision was calculated with an intersection over union (IOU) threshold of 0.50 (AP 50 ) and over a range of thresholds from 0.50 to 0.95 in 0.05 increments (AP). Predictions were considered to be true positives if the predicted mask had an IOU of >0.50 with one ground truth instance. Conversely, false positives were declared if predictions had <0.50 IOU with the ground truth. Instances present in the ground truth with an IOU of <0.50 with the predictions were assigned as false negatives. The mask IOU was calculated between the predicted and ground truth masks for each image. In cases where more than one instance was present in either mask, the masks were flattened to produce 512 × 512 × 1 dimension binary masks.

3. Results

A Mask R-CNN model was trained to segment NLB lesions in images acquired by a UAV. Using the weights from the sixth epoch, the model was used to classify a hold-out test set. Training time for the six epochs was 1 h and 5 min. Mean inference time on the test set was 0.2 s per 512 × 512 pixel image.
Over the 450 image test set, the mean IOU between the ground truth and predicted masks test set was 0.73 (Figure 1a). The IOU gives a measure of the overlap between the ground truth and the prediction, with values >0.50 considered to be correctly predicted. Notably, 93% of the predicted test set masks had >0.50 IOU with the ground truths.
Average precision (AP), which is the proportion of the predictions that match the corresponding ground truth at different IOU thresholds, was found to be 0.61. The AP 50 of the trained model was 0.96, revealing that the model performed well at the lenient IOU threshold of 0.50. In contrast, an AP of 0.61 showed that the performance of the model decreased as more stringent thresholds were applied (Figure 1b). Moreover, the trained model was robust to variation in image scale. The size of the predicted lesions in the test set ranged from 162 to 45,457 pixels, with a mean size of 7127 pixels (Figure 1c).
Even though the ground truth masks of the test set contained 825 lesion instances, the trained network detected a total of 932 lesions. Of the predicted lesions, 779 were true positives (Figure 2) and 153 were false positives. Additionally, there were 46 false negatives where the model failed to predict a lesion (Figure 3). After manual expert verification, only 23 predicted instances were true false positives. That is, 66 of the false positive instances were lesions with missing annotations in the ground truth masks (Figure 4) and the remaining 64 instances were deemed ambiguous and could not be declared either way.
Of the false positive instances, the most common causes were partially occluded patches of senesced tissue (Figure 5a), patches of soil with a similar shape to lesions (Figure 5b), and senesced male flowers (Figure 5c). Coalesced lesions were frequently annotated as a single lesion in the ground truth, but predicted to be two separate lesions or vice versa, thus having an IOU of <0.50 and were considered ambiguous. Similarly, 11 of the 46 false negative instances were due to differences in the prediction and ground truth of coalesced lesions resulting in an IOU between predicted and ground truth instances of <0.50.

4. Discussion

The work presented demonstrates the potential of instance segmentation with a deep learning-based approach for field-based quantitative disease phenotyping. Despite the challenges of field imagery, the trained Mask R-CNN network performed well at detecting and segmenting lesions with results comparable to similar work in other systems [23]. It has previously not been possible to phenotype plant disease from the air at such a high-resolution. The ability to measure both the number and size of lesions provides the opportunity to better study the interaction between S. turcica and maize under realistic field conditions.
Both pathogen virulence and plant resistance are predominantly quantitative traits [5,6]. The ability to accurately phenotype these traits is key to successful application of genetic dissection approaches such as linkage analysis and genome-wide association studies, as well as successfully selecting resistant lines in a breeding program. There is evidence in other pathosystems that different disease symptoms represent differences in the underlying genetics of resistance in the plant [34] or virulence in the pathogen [35]. Considering individual components of disease symptoms rather than simply assigning a single overall value, on an ordinal or percentage scale for example, has led to the discovery of new genetic loci responsible for pathogen virulence [35] and plant resistance [36].
Previous studies have demonstrated the ability of deep learning to classify the presence/absence of single diseases [19], as well as classify multiple diseases on a range of plants [37,38,39,40] in images acquired under field and controlled conditions. The ability to detect and measure individual lesions in UAV images builds on previous work to classify the presence/absence of NLB in ground- [19] and aerial-based images [41]. Whilst image classification may be useful for tasks such as disease identification, it does not give precise measures of symptoms required as part of a breeding or research program. In contrast, instance segmentation has the ability to provide accurate quantitative measures of disease.
As a result of the nature of field imagery, collected images can frequently contain features that are similar in size and color to lesions. Such non-lesion features resulted in our network returning a greater number of false positives than false negatives. As with other studies, we found that patches of soil between leaves, senesced male flowers, and areas of leaf necrosis not caused by disease were commonly misclassified as lesions [19,41]. Interestingly, we found that a large number of false positives were actually lesions that were missed by human ‘experts’, an observation also previously made in this pathosystem [19]. A similar number of false positives were ambiguous instances which, upon manual inspection, could not be determined either way.
Our instance masks used pixels as a proxy to measure lesion size. As a result of the differences in leaf height on tall stature crops such as maize and the constant elevation of the UAV, the number of pixels within a given lesion varied depending on its position on the plant and subsequent distance from the camera. With current technology, this is not an obstacle that can be easily overcome. However, if distances were available, the narrow focal plane of the images would allow for the estimation of error within a known range.
The presented work focuses on a single disease from an artificially inoculated maize field with a single disease. The Mask R-CNN framework has the ability to classify and segment multiple instance classes [21]. The potential exists for expansion of the current work to multiple diseases affecting maize, provided that sufficient image resolution and training data can be acquired.
The presence of publicly available deep learning models, as well as annotated image datasets, allows for state-of-the-art techniques to be brought to bear on long-standing questions. To illustrate this point, our minor modifications to the Mask R-CNN model initiated with pre-trained weights from everyday objects allowed for rapid application to the niche problem of NLB detection. In parallel, the use of UAVs allows large areas of land to be surveyed for plant disease more quickly and in more detail compared to human observers [26]. The combination of UAV technology and a deep learning approach, for instance, segmentation, shows tremendous promise to beneficially alter the field of agricultural research [42]. Integrating these technologies together into plant disease research and breeding programs has the potential to expedite the development of resistant varieties and further our understanding of pathogen virulence, plant resistance, and the interaction between host and pathogen.

Supplementary Materials

The following are available online. File S1: ImageJ macro used to create lesion polygon annotations. https://github.com/GoreLab/NLB_Mask-RCNN/tree/master/annotation_macro/NLB_polygon_annotation_macro.txt. File S2: Annotated image dataset used for training and validating the Mask R-CNN model. http://datacommons.cyverse.org/browse/iplant/home/shared/GoreLab/dataFromPubs/Stewart_NLBimages_2019. File S3: Code used to train and validate the Mask R-CNN model. https://github.com/GoreLab/NLB_Mask-RCNN.

Author Contributions

Conceptualization, E.L.S. and M.A.G.; methodology, E.L.S.; formal analysis, E.L.S.; investigation, E.L.S., T.W.-H., N.K.; resources, M.A.G., R.J.N.; data curation, E.L.S., T.W.-H., N.K.; writing—original draft preparation, E.L.S.; writing—review and editing, M.A.G., T.W.-H., C.D., H.W., R.J.N., H.L.; visualization, E.L.S.; supervision, M.A.G., R.J.N., H.L.; funding acquisition, M.A.G., R.J.N., H.L.

Funding

This research was funded by the U.S. National Science Foundation IIS-1527232 and IOS-1543958.

Acknowledgments

The authors are grateful for the hard work and technical support of Paul Stachowski, Jeff Stayton, and Wes Baum at Cornell’s Musgrave research farm.

Conflicts of Interest

The authors declare no conflict of interest. The funders had no role in the design of the study; in the collection, analyses, or interpretation of data; in the writing of the manuscript, or in the decision to publish the results.

Appendix A

Figure A1. Typical full-size image (4000 × 600 pixels) of NLB symptoms from which individual lesions were cropped to generate the training dataset.
Remotesensing 11 02209 g0a1
Figure A2. Graphical representation of the method used to determine the crop dimensions of lesions from full-size images. The annotation line denotes the location of the lesion in the image (solid red line) and corresponding bounding box (dashed grey line). The dimension of the final crop location (solid grey arrows) from the center point of the annotation line is determined using the equation from Section 2.1 in the Materials and Methods. The solid blue line denotes final crop location.
Remotesensing 11 02209 g0a2

References

  1. Strange, R.N.; Scott, P.R. Plant disease: A threat to global food security. Annu. Rev. Phytopathol. 2005, 43, 83–116. [Google Scholar] [CrossRef] [PubMed]
  2. Savary, S.; Ficke, A.; Aubertot, J.; Hollier, C. Crop losses due to diseases and their implications for global food production losses and food security. Food Secur. 2012, 4, 519–537. [Google Scholar] [CrossRef]
  3. Mahlein, A. Plant disease detection by imaging sensors—Parallels and specific demands for precision agriculture and plant phenotyping. Plant Dis. 2016, 100, 241–251. [Google Scholar] [CrossRef] [PubMed]
  4. Yang, Q.; Balint-Kurti, P.; Xu, M. Quantitative disease resistance: Dissection and adoption in maize. Mol. Plant 2017, 10, 402–413. [Google Scholar] [CrossRef] [PubMed]
  5. St. Clair, D.A. Quantitative disease resistance and quantitative resistance loci in breeding. Ann. Rev. Phytopathol. 2010, 48, 247–268. [Google Scholar] [CrossRef] [PubMed]
  6. Lannou, C. Variation and selection of quantitative traits in plant pathogens. Ann. Rev. Phytopathol. 2012, 50, 319–338. [Google Scholar] [CrossRef] [PubMed]
  7. Corwin, J.A.; Kliebenstein, D.J. Quantitative resistance: More than just perception of a pathogen. Plant Cell 2017, 29, 655–665. [Google Scholar] [CrossRef] [PubMed]
  8. Galiano-Carneiro, A.L.; Miedaner, T. Genetics of resistance and pathogenicity in the maize/Setosphaeria turcica pathosystem and implications for breeding. Front. Plant Sci. 2017, 8, 1490. [Google Scholar] [CrossRef]
  9. Hooda, K.S.; Khokhar, M.K.; Shekhar, M.; Karjagi, C.G.; Kumar, B.; Mallikarjuna, N.; Devlash, R.K.; Chandrashekara, C.; Yadav, O.P. Turcicum leaf blight-sustainable management of a re-emerging maize disease. J. Plant Dis. Prot. 2017, 124, 101–113. [Google Scholar] [CrossRef]
  10. Mueller, D.S.; Wise, K.A.; Sisson, A.J.; Allen, T.W.; Bergstrom, G.C.; Bosley, D.B.; Bradley, C.A.; Broders, K.D.; Byamukama, E.; Chilvers, M.I.; et al. Corn yield loss estimates due to diseases in the United States and Ontario, Canada from 2012 to 2015. Plant Health Prog. 2016, 17, 211–222. [Google Scholar] [CrossRef]
  11. Fullerton, R.A. Assessment of leaf damage caused by northern leaf blight in maize. N. Z. J. Exp. Agric. 1982, 10, 313–316. [Google Scholar] [CrossRef] [Green Version]
  12. Vieira, R.A.; Mesquini, R.M.; Silva, C.N.; Hata, F.T.; Tessmann, D.J.; Scapim, C.A. A new diagrammatic scale for the assessment of northern corn leaf blight. Crop Prot. 2014, 56, 55–57. [Google Scholar] [CrossRef]
  13. Poland, J.A.; Nelson, R.J. In the eye of the beholder: The effect of rater variability and different rating scales on QTL mapping. Phytopathology 2011, 101, 290–298. [Google Scholar] [CrossRef] [PubMed]
  14. Bock, C.H.; Parker, P.E.; Cook, A.Z.; Gottwald, T.R. Visual rating and the use of image analysis for assessing different symptoms of citrus canker on grapefruit leaves. Plant Dis. 2008, 92, 530–541. [Google Scholar] [CrossRef] [PubMed]
  15. Stewart, E.L.; McDonald, B.A. Measuring quantitative virulence in the wheat pathogen Zymoseptoria tritici using high-throughput automated image analysis. Phytopathology 2014, 104, 985–992. [Google Scholar] [CrossRef] [PubMed]
  16. Mutka, A.M.; Bart, R.S. Image-based phenotyping of plant disease symptoms. Front. Plant Sci. 2015, 5, 734. [Google Scholar] [CrossRef] [PubMed] [Green Version]
  17. Ubbens, J.R.; Stavness, I. Deep plant phenomics: A deep learning platform for complex plant phenotyping tasks. Front. Plant Sci. 2017, 8, 1190. [Google Scholar] [CrossRef]
  18. Singh, A.K.; Ganapathysubramanian, B.; Sarkar, S.; Singh, A. Deep learning for plant stress phenotyping: Trends and future perspectives. Trends Plant Sci. 2018, 23, 883–898. [Google Scholar] [CrossRef]
  19. DeChant, C.; Wiesner-Hanks, T.; Chen, S.; Stewart, E.L.; Yosinski, J.; Gore, M.A.; Nelson, R.J.; Lipson, H. Automated identification of northern leaf blight-infected maize plants from field imagery using deep learning. Phytopathology 2017, 107, 1426–1432. [Google Scholar] [CrossRef]
  20. Guo, Y.; Liu, Y.; Georgiou, T.; Lew, M.S. A review of semantic segmentation using deep neural networks. Int. J. Multimed. Inf. Retr. 2018, 7, 87–93. [Google Scholar] [CrossRef]
  21. He, K.; Gkioxari, G.; Dollár, P.; Girshick, R.B. Mask R-CNN. arXiv 2017, arXiv:1703.06870. [Google Scholar]
  22. Zhang, W.; Witharana, C.; Liljedahl, A.K.; Kanevskiy, M. Deep convolutional neural networks for automated characterization of Arctic ice-wedge polygons in very high spatial resolution aerial imagery. Remote Sens. 2018, 10, 1487. [Google Scholar] [CrossRef]
  23. Johnson, J.W. Adapting Mask-RCNN for automatic nucleus segmentation. arXiv 2018, arXiv:1805.00500. [Google Scholar]
  24. Santos, T.T.; de Souza, L.L.; dos Santos, A.A.; Avila, S. Grape detection, segmentation and tracking using deep neural networks and three-dimensional association. arXiv 2019, arXiv:1907.11819. [Google Scholar]
  25. Sankaran, S.; Khot, L.R.; Espinoza, C.Z.; Jarolmasjed, S.; Sathuvalli, V.R.; Vandemark, J.G.; Miklas, P.N.; Carter, A.H.; Pumphrey, M.O.; Knowles, R.; et al. Low-altitude, high-resolution aerial imaging systems for row and field crop phenotyping: A review. Eur. J. Agron. 2015, 70, 112–123. [Google Scholar] [CrossRef]
  26. Yang, G.; Liu, J.; Zhao, C.; Li, Z.; Huang, Y.; Yu, H.; Xu, B.; Yang, X.; Zhu, D.; Zhang, X.; et al. Unmanned aerial vehicle remote sensing for field-based crop phenotyping: Current status and perspectives. Front. Plant Sci. 2017, 8, 1111. [Google Scholar] [CrossRef] [PubMed]
  27. Wiesner-Hanks, T.; Stewart, E.L.; Kaczmar, N.; DeChant, C.; Wu, H.; Nelson, R.J.; Lipson, H.; Gore, M.A. Image set for deep learning: Field images of maize annotated with disease symptoms. BMC Res. Notes 2018, 11, 440. [Google Scholar] [CrossRef]
  28. Clark, A.; Murray, A.; Karpinsky, A.; Gohlke, C.; Crowell, B.; Schmidt, D.; Houghton, A.; Johnson, S.; Mani, S.; Ware, J.; et al. Pillow: 3.1.0. Zenodo 2016. [Google Scholar] [CrossRef]
  29. Schneider, C.A.; Rasband, W.S.; Eliceiri, K.W. NIH Image to ImageJ: 25 years of image analysis. Nat. Methods 2012, 9, 671. [Google Scholar] [CrossRef]
  30. van der Walt, S.; Colbert, S.C.; Varoquaux, G. The NumPy Array: A structure for efficient numerical computation. Comput. Sci. Eng. 2011, 13, 22–30. [Google Scholar] [CrossRef]
  31. Abdulla, W. Mask R-CNN for Object Detection and Instance Segmentation on Keras and TensorFlow. 2017. Available online: https://github.com/matterport/Mask_RCNN (accessed on 20 September 2019).
  32. Lin, T.; Maire, M.; Belongie, S.; Hays, J.; Perona, P.; Ramanan, D.; Dollár, P.; Zitnick, C.L. Microsoft COCO: Common objects in context. In Computer Vision–ECCV 2014; Fleet, D., Pajdla, T., Schiele, B., Tuytelaars, T., Eds.; Springer International Publishing: Cham, Switzerland, 2014; pp. 740–755. [Google Scholar]
  33. MSCOCO. Available online: http://cocodataset.org/#detection-eval (accessed on 30 September 2019).
  34. Karisto, P.; Hund, A.; Yu, K.; Anderegg, J.; Walter, A.; Mascher, F.; McDonald, B.A.; Mikaberidze, A. Ranking quantitative resistance to Septoria tritici blotch in elite wheat cultivars using automated image analysis. Phytopathology 2018, 108, 568–581. [Google Scholar] [CrossRef]
  35. Stewart, E.L.; Croll, D.; Lendenmann, M.H.; Sanchez-Vallet, A.; Hartmann, F.E.; Palma-Guerrero, J.; Ma, X.; McDonald, B.A. Quantitative trait locus mapping reveals complex genetic architecture of quantitative virulence in the wheat pathogen Zymoseptoria tritici. Mol. Plant Pathol. 2018, 19, 201–216. [Google Scholar] [CrossRef]
  36. Fordyce, R.F.; Soltis, N.E.; Caseys, C.; Gwinner, R.; Corwin, J.A.; Atwell, S.; Copeland, D.; Feusier, J.; Subedy, A.; Eshbaugh, R.; et al. Digital imaging combined with genome-wide association mapping links loci to plant-pathogen interaction traits. Plant Physiol. 2018, 178, 1406–1422. [Google Scholar] [CrossRef]
  37. Mohanty, S.P.; Hughes, D.P.; Salathé, M. Using deep learning for image-based plant disease detection. Front. Plant Sci. 2016, 7, 1419. [Google Scholar] [CrossRef]
  38. Lu, Y.; Yi, S.; Zeng, N.; Liu, Y.; Zhang, Y. Identification of rice diseases using deep convolutional neural networks. Neurocomputing 2017, 267, 378–384. [Google Scholar] [CrossRef]
  39. Ferentinos, K.P. Deep learning models for plant disease detection and diagnosis. Comput. Electron. Agric. 2018, 145, 311–318. [Google Scholar] [CrossRef]
  40. Fuentes, A.; Yoon, S.; Kim, S.C.; Park, D.S. A robust deep-learning-based detector for real-time tomato plant diseases and pests recognition. Sensors 2017, 17, 2022. [Google Scholar] [CrossRef]
  41. Wu, H.; Wiesner-Hanks, T.; Stewart, E.; DeChant, C.; Kaczmar, N.; Gore, M.; Nelson, R.; Lipson, H. Autonomous detection of plant disease symptoms directly from aerial imagery. Plant Phenome J. 2019. Accepted. [Google Scholar]
  42. Kamilaris, A.; Prenafeta-Boldú, F.X. Deep learning in agriculture: A survey. Comput. Electron. Agric. 2018, 147, 70–90. [Google Scholar] [CrossRef] [Green Version]
Figure 1. Metrics used to assess the accuracy of a Mask R-CNN model trained to detect northern leaf blight (NLB) lesions. (a) Distribution of intersection over union (IOU) values between predicted masks and ground truths. (b) Average precision at IOU thresholds of 0.50–0.95. (c) Size of lesions (pixels) predicted by the trained Mask R-CNN model.
Remotesensing 11 02209 g001
Figure 2. Ground truth (white) and predicted (magenta) lesion instances.
Remotesensing 11 02209 g002
Figure 3. False negatives (dashed green outline).
Remotesensing 11 02209 g003
Figure 4. Predicted instances with missing ground truth (dashed cyan outline).
Remotesensing 11 02209 g004
Figure 5. Examples of false positive instances (dashed yellow outline) caused by partially (a) occluded senescence, (b) patches of soil, and (c) senesced male flowers.
Remotesensing 11 02209 g005

