Article

Spatiotemporal Investigations of Multi-Sensor Air Pollution Data over Bangladesh during COVID-19 Lockdown

1
Lab of Environmental Remote Sensing (LERS), School of Marine Sciences (SMS), Nanjing University of Information Science and Technology (NUIST), Nanjing 210044, China
2
Department of Geography, School of Global Studies, University of Sussex, Brighton BN1 9RH, UK
3
Kathmandu Institute of Applied Sciences, Bagdol, Kathmandu 44600, Nepal
4
Collaborative Innovation Centre on Forecast and Evaluation of Meteorological Disasters, Key Laboratory of Meteorological Disaster, Ministry of Education (KLME), International Joint Laboratory on Climate and Environment Change (ILCEC), Key Laboratory for Aerosol-Cloud-Precipitation of China Meteorological Administration, School of Atmospheric Physics, Nanjing University of Information Science and Technology, Nanjing 210044, China
5
Department of Physics, Wollo University, Dessie P.O. Box 1145, Ethiopia
6
Center of Excellence for Climate Change Research, Department of Meteorology, King Abdulaziz University, Jeddah 21589, Saudi Arabia
7
Collaborative Innovation Center on Forecast and Evaluation of Meteorological Disaster, Institute for Disaster Risk Management, School of Geographical Science, Nanjing University of Information Science and Technology, Nanjing 210044, China
8
School of Remote Sensing and Geomatics Engineering, Nanjing University of Information Science and Technology, Nanjing 210044, China
9
School of Computer and Software, Nanjing University of Information Science and Technology, Nanjing 210044, China
10
Collaborative Innovation Center on Forecast and Evaluation of Meteorological Disasters, Key Laboratory for Aerosol-Cloud-Precipitation of China Meteorological Administration, Key Laboratory of Meteorological Disasters, Ministry of Education, Nanjing University of Information Science and Technology, Nanjing 210044, China
11
Weather and Climate Model Earth Science Technology and Policy Services Ltd. (ESTEPS), Dhaka 1000, Bangladesh
*
Author to whom correspondence should be addressed.
These authors with equal contributions.
Remote Sens. 2021, 13(5), 877; https://doi.org/10.3390/rs13050877
Submission received: 7 January 2021 / Revised: 21 February 2021 / Accepted: 23 February 2021 / Published: 26 February 2021

Abstract

:
This study investigates spatiotemporal changes in air pollution (particulate as well as gases) during the COVID-19 lockdown period over major cities of Bangladesh. The study investigated the aerosol optical depth (AOD) from the Moderate Resolution Imaging Spectroradiometer (MODIS) onboard Terra and Aqua satellites, PM2.5 and PM10 from Copernicus Atmosphere Monitoring Service (CAMS), and NO2 and O3 from TROPOMI-5P, from March to June 2019–2020. Additionally, aerosol subtypes from the Cloud-Aerosol Lidar and Infrared Pathfinder (CALIPSO) were used to explore the aerosol types. The strict lockdown (26 March–30 May 2020) led to a significant reduction in AOD (up to 47%) in all major cities, while the partial lockdown (June 2020) led to increased and decreased AOD over the study area. Significant reductions in PM2.5 (37–77%) and PM10 (33–70%) were also observed throughout the country during the strict lockdown and partial lockdown. The NO2 levels decreased by 3–25% in March 2020 in the cities of Rajshahi, Chattogram, Sylhet, Khulna, Barisal, and Mymensingh, in April by 3–43% in Dhaka, Chattogram, Khulna, Barisal, Bhola, and Mymensingh, and May by 12–42% in Rajshahi, Sylhet, Mymensingh, and Rangpur. During the partial lockdown in June, NO2 decreased (9–35%) in Dhaka, Chattogram, Sylhet, Khulna, Barisal, and Rangpur compared to 2019. On the other hand, increases were observed in ozone (O3) levels, with an average increase of 3–12% throughout the country during the strict lockdown and only a slight reduction of 1–3% in O3 during the partial lockdown. In terms of aerosol types, CALIPSO observed high levels of polluted dust followed by dust, smoke, polluted continental, and clean marine-type aerosols over the country in 2019, but all types were decreased during the lockdown. The study concludes that the strict lockdown measures were able to significantly improve air quality conditions over Bangladesh due to the shutdown of industries, vehicles, and movement of people.

Graphical Abstract

1. Introduction

The novel infectious disease Coronavirus, also known as COVID-19, is caused by the SARS-CoV-2 (severe acute respiratory syndrome coronavirus 2). It was first identified in December 2019 in Wuhan province, China [1]. The disease later spread to other parts of Asia, Europe, Africa, and the USA. The COVID-19 outbreak was declared a pandemic by the World Health Organization [2] on 12 March 2020. The global death toll was 2,116,714 and active corona cases were 25,683,638 (dated: 23 January 2021) [3]. South Asia, with almost a quarter of the world’s population, has been severely affected by the pandemic. The eight South Asian countries had 285,979 active cases and 177,276 deaths linked to COVID-19 up to 23 January 2021. The World Bank’s latest Global Economic prospects predict a decline in the gross domestic product (GDP) of 2.7% in 2020 across this region [4] as COVID mitigation measures impede consumer and service activities. Additionally, uncertainty about the course of the pandemic is bound to hamper health as well as the economy.
As the world’s eighth-most populous country, with nearly 2.2% of the global population, Bangladesh is a low–middle income nation struggling to fight transmission of the disease. On 7 March 2020, the Bangladesh government announced the first case of COVID-19 in the nation [5] and implemented aggressive actions to control the spread of the virus. The first strict lockdown was implemented from 26 March 2020, which was then further renewed until 30 May 2020 in many cases [6]. This lockdown prohibited all forms of transportation, be it by air, sea, and road, for regional as well as international travel [5]. The lockdown, implemented to control the spread, resulted in self-isolation, decreased outdoor activities, and suspension and closure of transportation and industrial sectors. Consequently, this strategy to combat the pandemic has influenced the pollution concentration and significantly contributed to reductions in several sources of pollution [7].
In recent decades, rapid growth in urbanization and industrialization have affected the environmental health of Bangladesh. Previous studies have reported the air quality index (AQI) to be severely impacted by fine particulate matter from vehicular emissions and construction activities [8,9,10,11]. The AQI values on several occasions have exceeded the national ambient standards in Dhaka and Chittagong, which are ranked among the world’s top ten most polluted cities during the dry season (i.e., November to April) [8,9]. This recession period in degrading global air pollution provides a great opportunity to study processes and implications of future policies to reduce air pollution.
Global studies from different scientific groups have reported improvement in the air quality during this pandemic period [7,12,13,14,15,16,17,18,19,20,21,22]. For example, a reduction of 8% and 42% in particulate matter (PM2.5 and PM10) was observed over Europe and Wuhan (China), respectively [23]. Sharma et al. [22] reported that lockdowns over 22 Indian cities reduced PM2.5 by 43% and PM10 by 31%. Substantial declines in PM2.5 levels were also observed during lockdowns in March 2020 in Dubai (11%), Delhi (35%), Mumbai (14%), Beijing (50%), Shanghai (50%), New York (32%), and Los Angeles (4%) [14]. Kumar et al. [7] also reported significant reductions in PM2.5 during lockdown periods in India from March to May 2020, for Chennai (19–43%), Delhi (41–53%), Hyderabad (26–54%), Kolkata (24–36%), and Mumbai (10–39%). In India, particulate pollution was also significantly reduced, with an approximately 43% decline in PM2.5 in March 2020 compared to the previous year. Sharma et al. [22], and Mahato et al. [21] reported declines of nearly 50% in PM2.5 and PM10.
However, to date, very few studies associated with COVID-19 and air quality over Bangladesh have been conducted. An attempt to study the response of air quality in Chittagong city during the early phase of lockdown has been presented in the work of Masum and Pal [9]. The study has reported a significant reduction in both gaseous as well as particulate pollutants. For example, a significant reduction of 40%, 32%, and 13% was observed in PM2.5, PM10, and NO2 respectively, during the COVID-19 lockdown compared to the mean concentrations of previous dry seasons. Additionally, the improvement (reduction) in the air quality index was found to have been 26% compared to the previous eight years (2012–2019) during the dry season. Reduction in particulate matter pollution is also reported in another study over Dhaka city; the results indicate that the mean PM2.5 concentration decreased by around 23% in 2020 compared to the mean concentration in 2019 [24]. Despite a limited number of studies to date, the results are indicating a significant improvement in the air quality during the COVID-19 shutdown in Bangladesh. Several studies have been conducted over Bangladesh to reveal the socioeconomic impacts of COVID-19 and assess the severity of COVID-19 to control the spread of the virus throughout the country [5,25,26,27]. Apart from these, Islam et al. [26] examined air pollutants (NO2, SO2, CO, and O3) in Bangladesh using data from February to May in 2019 and 2020. These studies showed the impacts of nationwide lockdown measures on air quality in Bangladesh.
This research intends to fill the gaps of previous studies in nine major cities (Dhaka, Rajshahi, Chattogram, Sylhet, Khulna, Barisal, Bhola, Mymensingh, and Rangpur) of Bangladesh during the period March to June in 2019 and 2020, providing a complete picture of air quality impacts across the country. The main objectives of the current study are, firstly, to examine the spatiotemporal changes of air pollution data (AOD, PM2.5, PM10, NO2, and O3) during the 2020 lockdown (26 March–30 May) and partial lockdown (June) in all major cities of Bangladesh, and thus across Bangladesh generally, and secondly, to discover aerosol types and their specific changes during the study period.

2. Materials and Methods
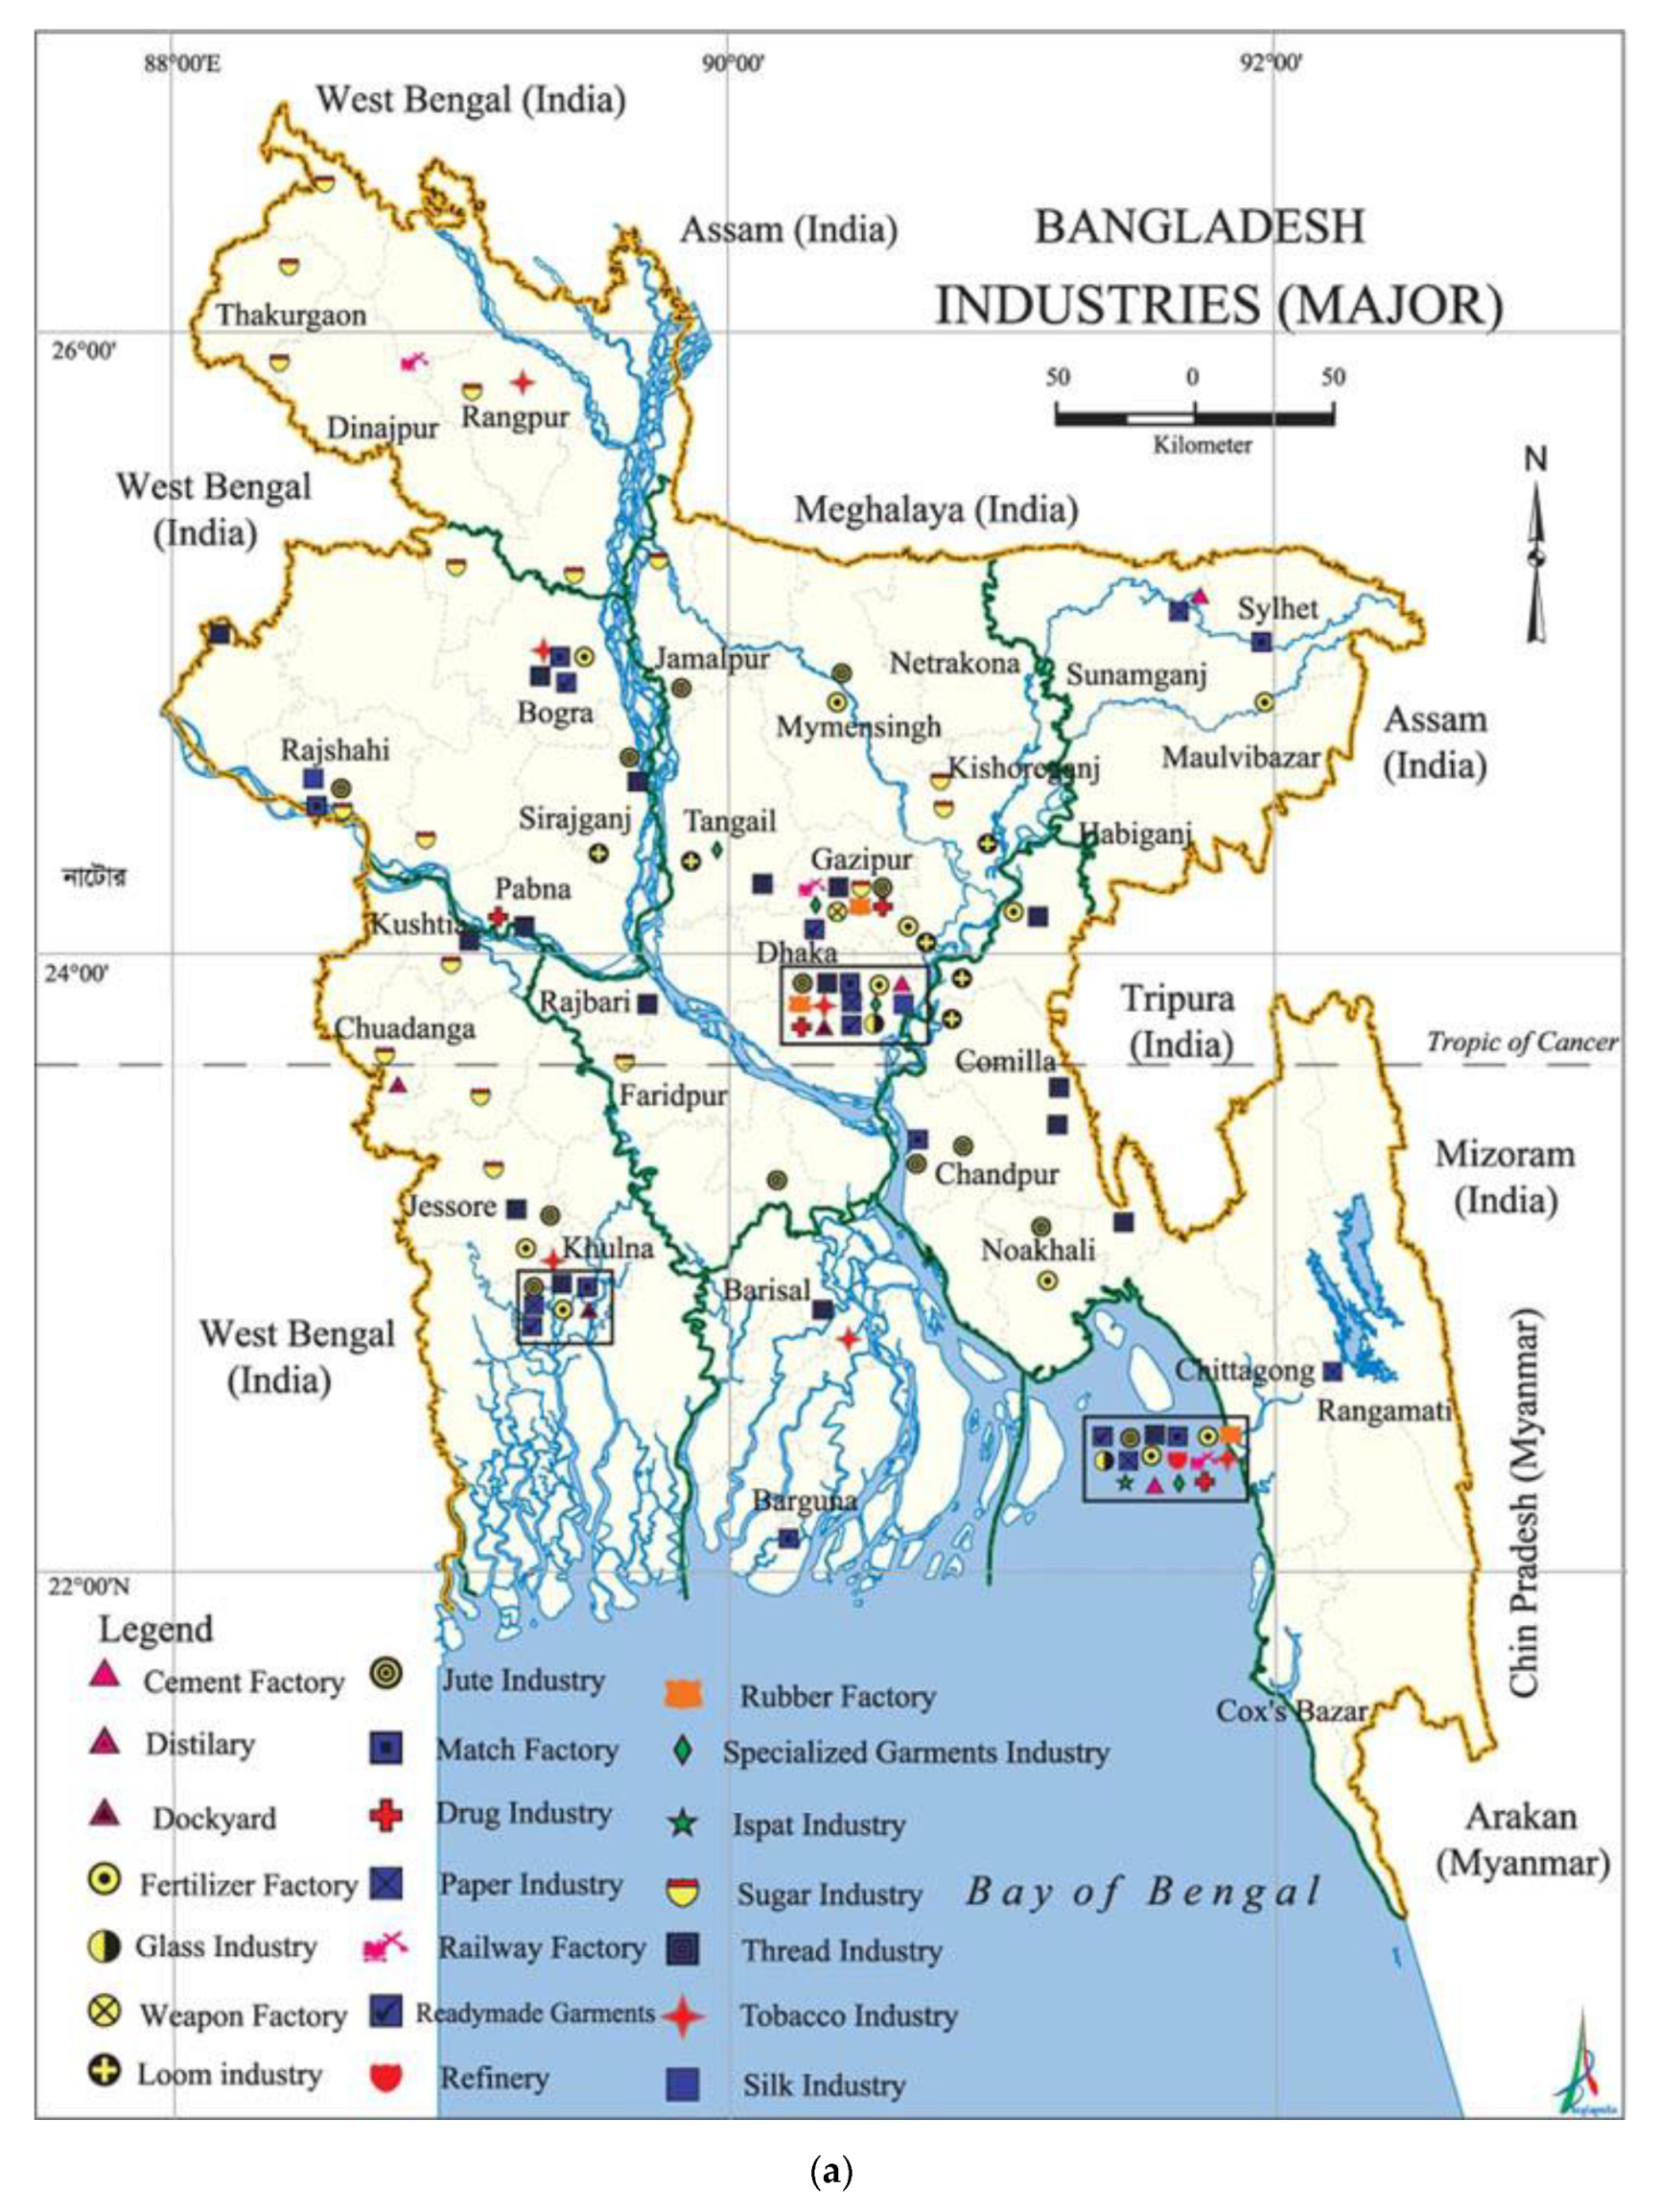
2.1. Study Area

The study focuses on Bangladesh, which is located in tropical Southeast Asia between 20°34′ and 26°38′ N and 88°01′ and 92°42′ E (Figure 1). Bangladesh is surrounded by India on three sides (west, north, and northeast), Myanmar to the southeast, and the Bay of Bengal to the south. It has eight distinct administrative divisions (Dhaka, Rajshahi, Chattogram, Sylhet, Khulna, Barisal, Mymensingh, and Rangpur). The climate of Bangladesh exhibits warm temperatures, high humidity, and subtropical monsoons with varying precipitation. Meteorologically, the country has four distinct seasons: pre-monsoon (March–May); summer or monsoon (June–September), post-monsoon (October–November), and dry winter (December–February). Its unique geographic location and the complex hydrogeologic setting make the country one of the most vulnerable to global climate change, with recurring floods, cyclones, droughts, tornadoes, and storm surges. Furthermore, due to its high population density, the country is recognized as an air pollution hotspot in the Indo-Gangetic Plains region [28]. Two major sources of air pollution in Bangladesh are vehicular and industrial emissions [29]. However, industrial expansion in Bangladesh is the key driver of economic growth, contributing more than 35% of GDP [30]. Apart from these, another emerging and major source of air pollution in Bangladesh is brick kilns, especially during the dry season [31]. Over the past decades, Bangladesh has been recognized as one of the world’s most polluted countries. The world air quality report (2019) by IQ Air confirmed that Bangladesh was the most polluted country in 2019, and Mamun et al. [32] reported some major sources of air quality deterioration in Bangladesh to be long-range transported pollutants from cities within Bangladesh including Dhaka, Narayanganj, Gazipur, Rajshahi, Chattogram, and Khulna (Figure 1).

2.2. Data

A combination of multi-sensor and reanalysis data were used to investigate the air pollution scenarios over Bangladesh from March to June in 2019 and 2020. The air pollution parameters used in this study included aerosol optical depth (AOD), aerosol subtypes, particulate matter concentrations (PM2.5 and PM10), tropospheric NO2, and total column O3.

2.2.1. Aerosol Optical Properties (AOD, Aerosol Subtypes)

The Moderate Resolution Imaging Spectroradiometer (MODIS) onboard the Terra (10:30 a.m. local time) and Aqua (01:30 p.m. local time) satellites measures aerosols and clouds properties with high accuracy. The MODIS Level 3 data have been widely used in past studies over China [33,34,35,36,37]. In this study, the Terra and Aqua MODIS DTB monthly AOD (550 nm) aerosol products were obtained from GIOVANNI (https://giovanni.gsfc.nasa.gov/giovanni/ accessed on 1 July 2020) to analyze the spatiotemporal variation in AOD over Bangladesh.
The Cloud-Aerosol Lidar and Infrared Pathfinder Satellite Observation (CALIPSO) satellite carry the Cloud-Aerosol Lidar with Orthogonal Polarization (CALIOP) instrument to measure aerosols’ vertical information and three-dimensional aerosol properties during both day and night over the globe. The aerosol lidar ratio is an important parameter of aerosol extinction retrieval, which can identify aerosol subtypes based on cluster analysis of a multiyear Aerosol Robotic Network (AERONET) dataset, [38,39]. Therefore, the CALIPSO aerosol subtypes profile has been documented as more accurate compared to other measurements [40]. In this study, the vertical distribution of aerosol subtypes was investigated using the CALIPSO level 1 lidar images [V3-30] (URL: https://www-calipso.larc.nasa.gov/products/lidar/browse_images/exp_index.php accessed on 20 July 2020). Spatial variations in the aerosol subtypes were also studied using the CALIPSO lidar level 3 tropospheric aerosol profiles, cloud-free data, and Standard V4-20 data (URL: https://search.earthdata.nasa.gov/ accessed on 20 July 2020). A detailed description of the level 3 product, aerosol classification, and the lidar ratio selection algorithm is given by Kim et al. [41].

2.2.2. PM2.5 and PM10

This study also used PM2.5 and PM10 data at a spatial resolution of 0.25° × 0.25° and an hourly time scale, from the Copernicus Atmosphere Monitoring Service (CAMS) model over Bangladesh, during the study period. The CAMS PM values have been shown to fit well with ground station measurements [42]. The most recent global reanalysis data collection of atmospheric composition and air quality is the CAMS near-real-time reanalysis [43], which demonstrates an unparalleled degree of accuracy and space-time resolution.

2.2.3. NO2 and O3 Pollutant Data

The TROPOspheric Monitoring Instrument (TROPOMI) aboard the Sentinel-5 Precursor satellite (also known as Sentinel-5P) was used for assessing the spatiotemporal evolution of tropospheric NO2 and the total ozone column (O3). The TROPOMI is a passive hyperspectral nadir-viewing imager [44]. Sentinel-5P is a near-polar orbiting sun-synchronous satellite with an equatorial crossing time of 13:30 LT and a repeat period of 17 days, at an altitude of 817 km in an ascending node. The Level 2 Sentinel-5P TROPOMI-based tropospheric NO2 and O3 at 1-Orbit with a resolution of 7 × 3.5 km (5.5 × 3.5 km since 30 April 2018) product was obtained. Only those measurements with a data quality value of QA > 0.75 were considered, to disqualify scenes with cloud fraction > 0.5, and other scenes flagged with errors or problematic retrieval [45].

2.3. Research Methodology

The study adopted the following step-by-step methodology: (i) monthly spatial distribution maps of NO2, O3, PM2.5, and PM10 were generated from the daily observations from March to June 2019 and 2020; (ii) temporal analysis was performed for nine major cities of Bangladesh (Dhaka, Rajshahi, Chattogram, Sylhet, Khulna, Barisal, Bhola, Mymensingh, and Rangpur) based on the monthly MODIS AOD, CAMS (PM2.5 and PM10), and TROPOMI-5P (NO2 and O3) datasets.
To report the differences in air quality conditions during the COVID lockdown and the previous year (2019) for the same months, the relative changes (RC) were calculated (Equation (1)) [33]:
Relative   Change =   ( par 2020   par 2019 par 2019 ) × 100
where par2020 is the parameter values in 2020 and par2019 is the parameter values in 2019. For RC, the year 2019 is considered as one in which air quality, especially in Bangladesh, where government measures to control pollution have operated in recent years [46], has improved recently. Therefore, it would be better to compare with the most recent year (2019) rather than the long-term average, which may represent considerably poorer air quality than in 2019 and 2020. While this may potentially overestimate any improvement effects of the COVID lockdown on air quality, the improvements were reported only for particulate pollution, and changes over a single year are considered to have a little impact [47].

3. Results

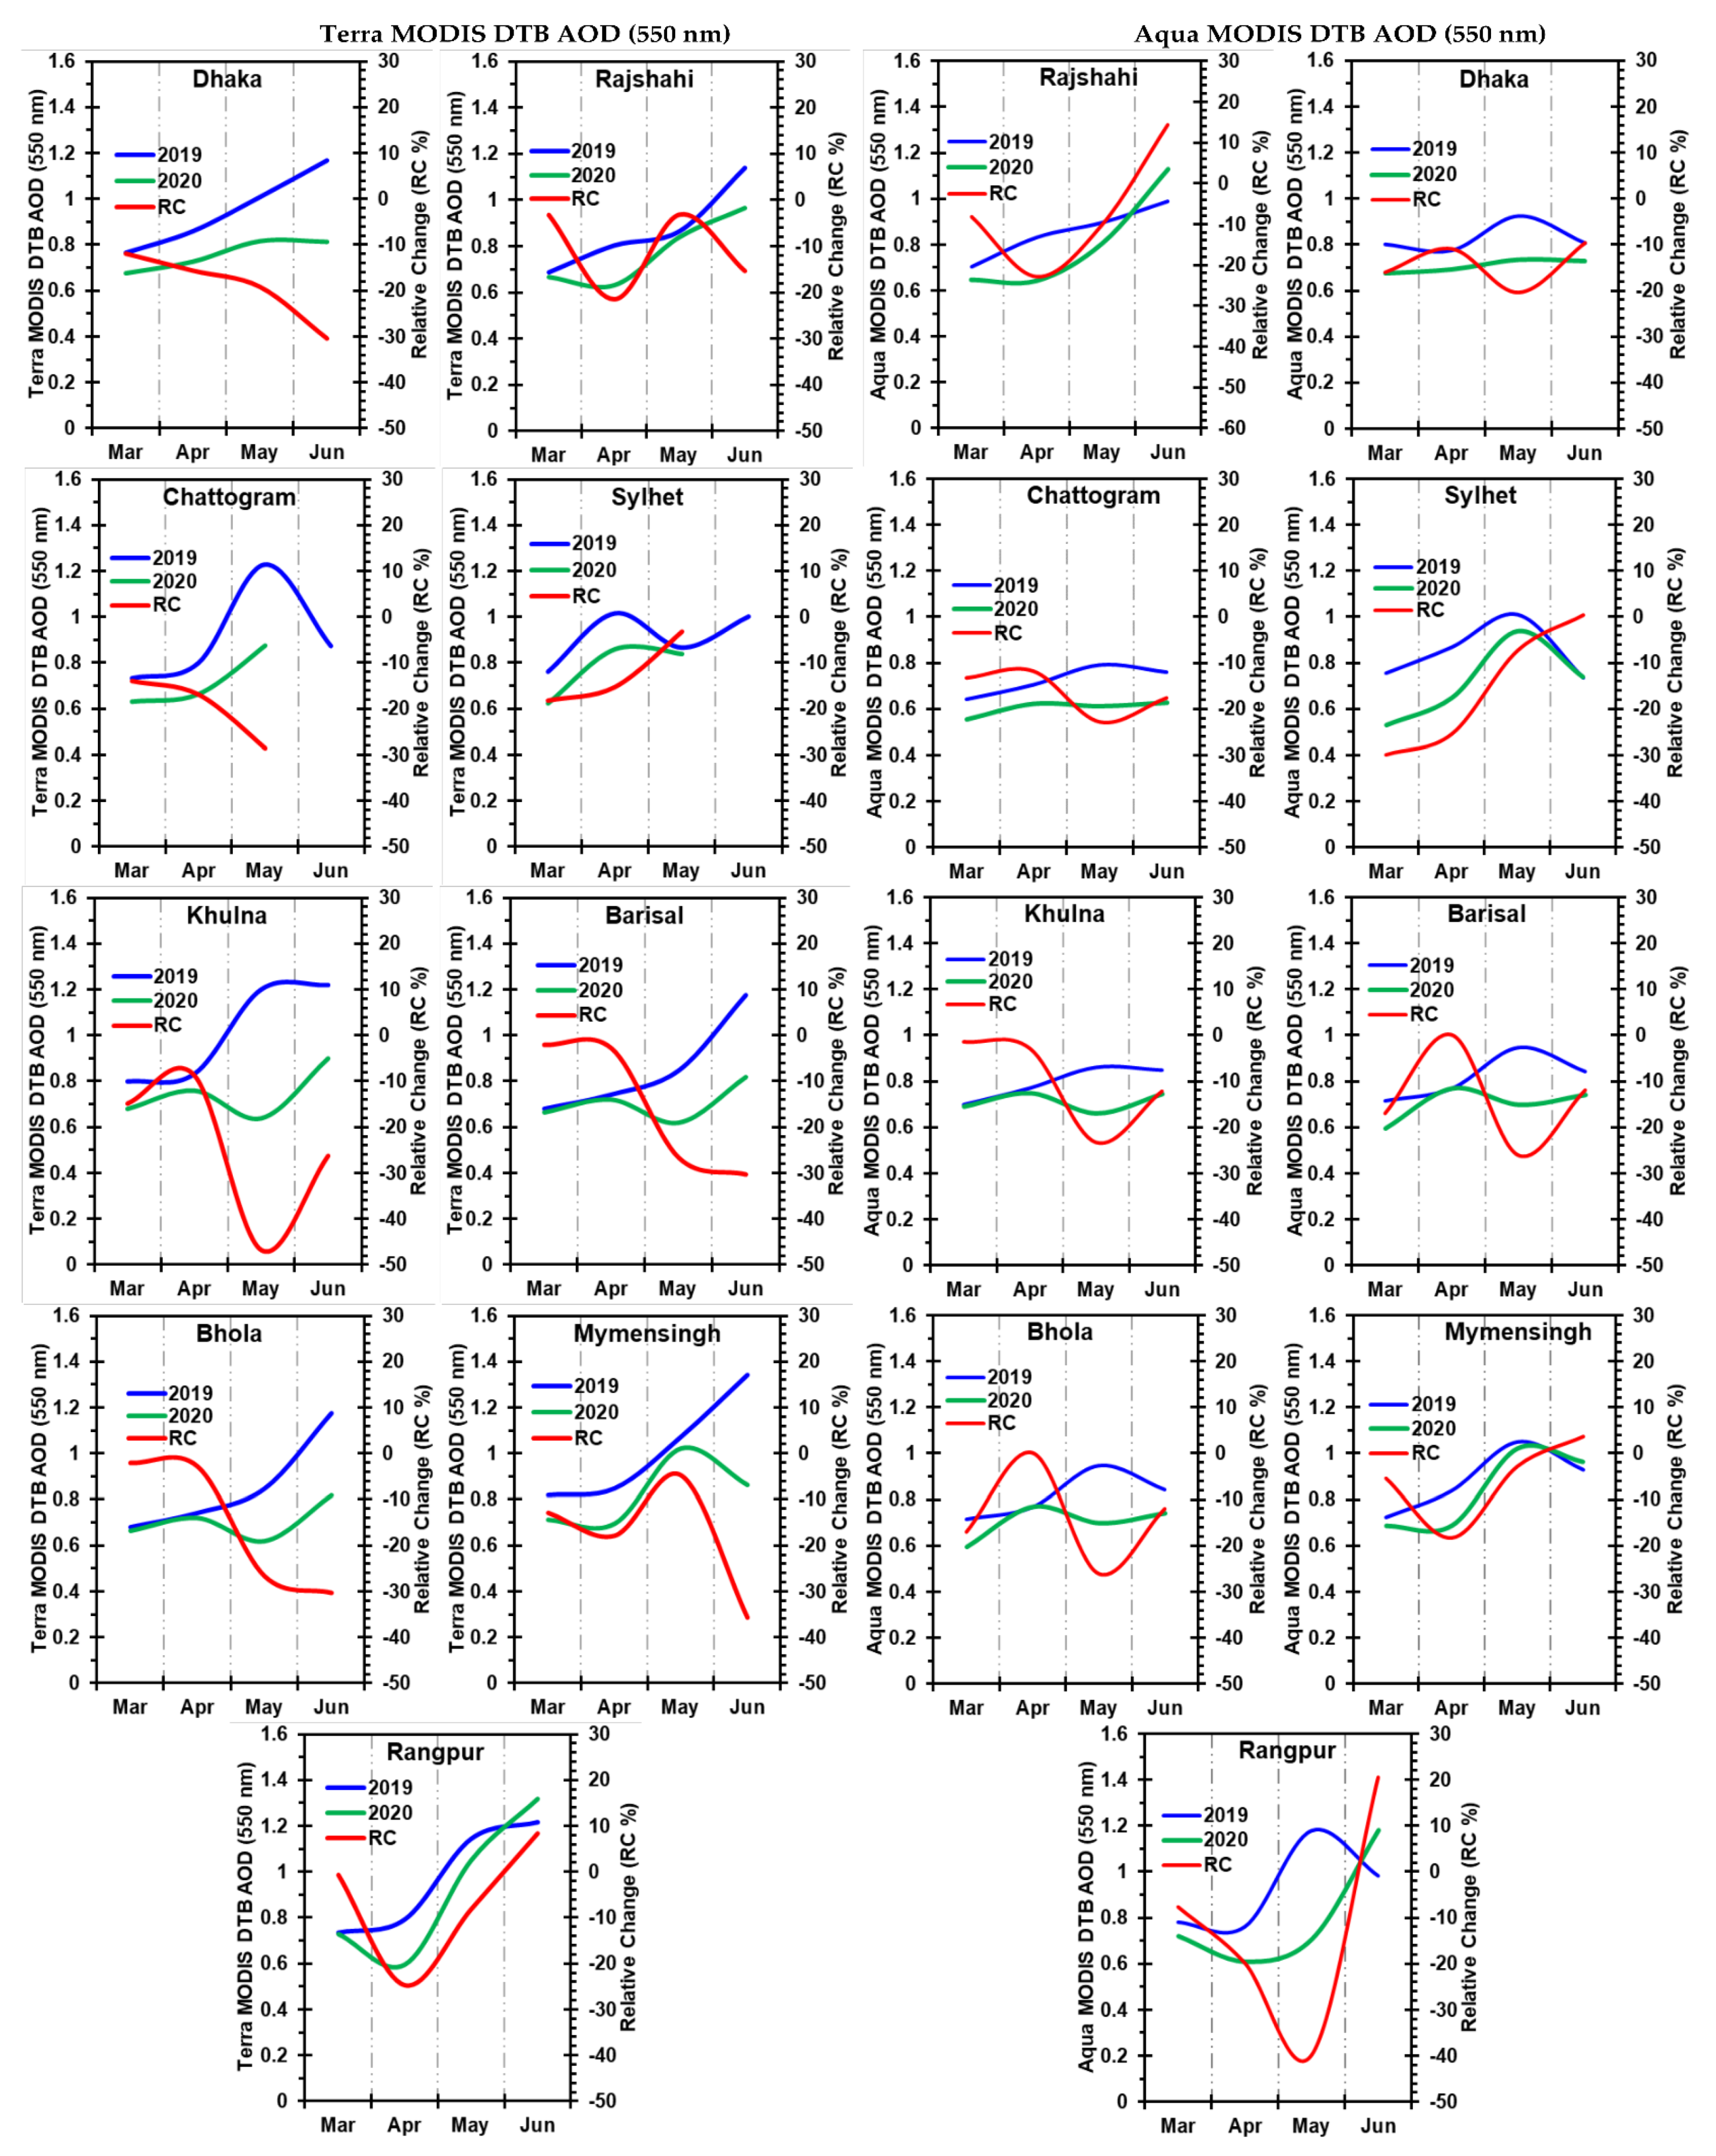
3.1. Spatiotemporal Distributions of AOD

Figure 2 and Figure 3 show the spatial and temporal scenarios of Terra (10:30 a.m., local time) and Aqua (01:30 p.m., local time) MODIS monthly DTB AOD, over Bangladesh during the COVID-19 lockdown. A substantial spatial contrast in AOD was observed during the 2020 strict lockdown period (26 March–30 May) and partial lockdown (June) in all the major cities of Bangladesh (Figure 2). Remarkably, over the three months (March–May 2020) strict lockdown restrictions led to a substantial decrease in AOD from both Terra and Aqua, which varied from 1% to 47% in the major cities (Figure 2 and Figure 3). However, during the partial lockdown in June, AOD generally decreased, but a few cities showed an increase (Figure 2 and Figure 3). Specifically, Terra-based AOD decreased by 15–36% in Dhaka, Rajshahi, Khulna, Barisal, Bhola, and Mymensingh, and increased by 8% in Rangpur, while Aqua AOD showed a decrease of 3–18% in Dhaka, Chattogram, Barisal, Bhola, and Khulna, and an increase of 0.041–20% in Mymensingh, Rajshahi, Rangpur, and Sylhet (Figure 2 and Figure 3). The increasing AOD during partial lockdown may be attributed to fewer restrictions on essential transportation, and less control of industrial activity during the partial lockdown. A drastic reduction in aerosol loadings during the strict lockdown over India due to the shutdown of non-essential industries and a decrease in road-vehicles [21,22,48] suggests a corresponding reduction in other pollutants (especially PM2.5 and PM10).

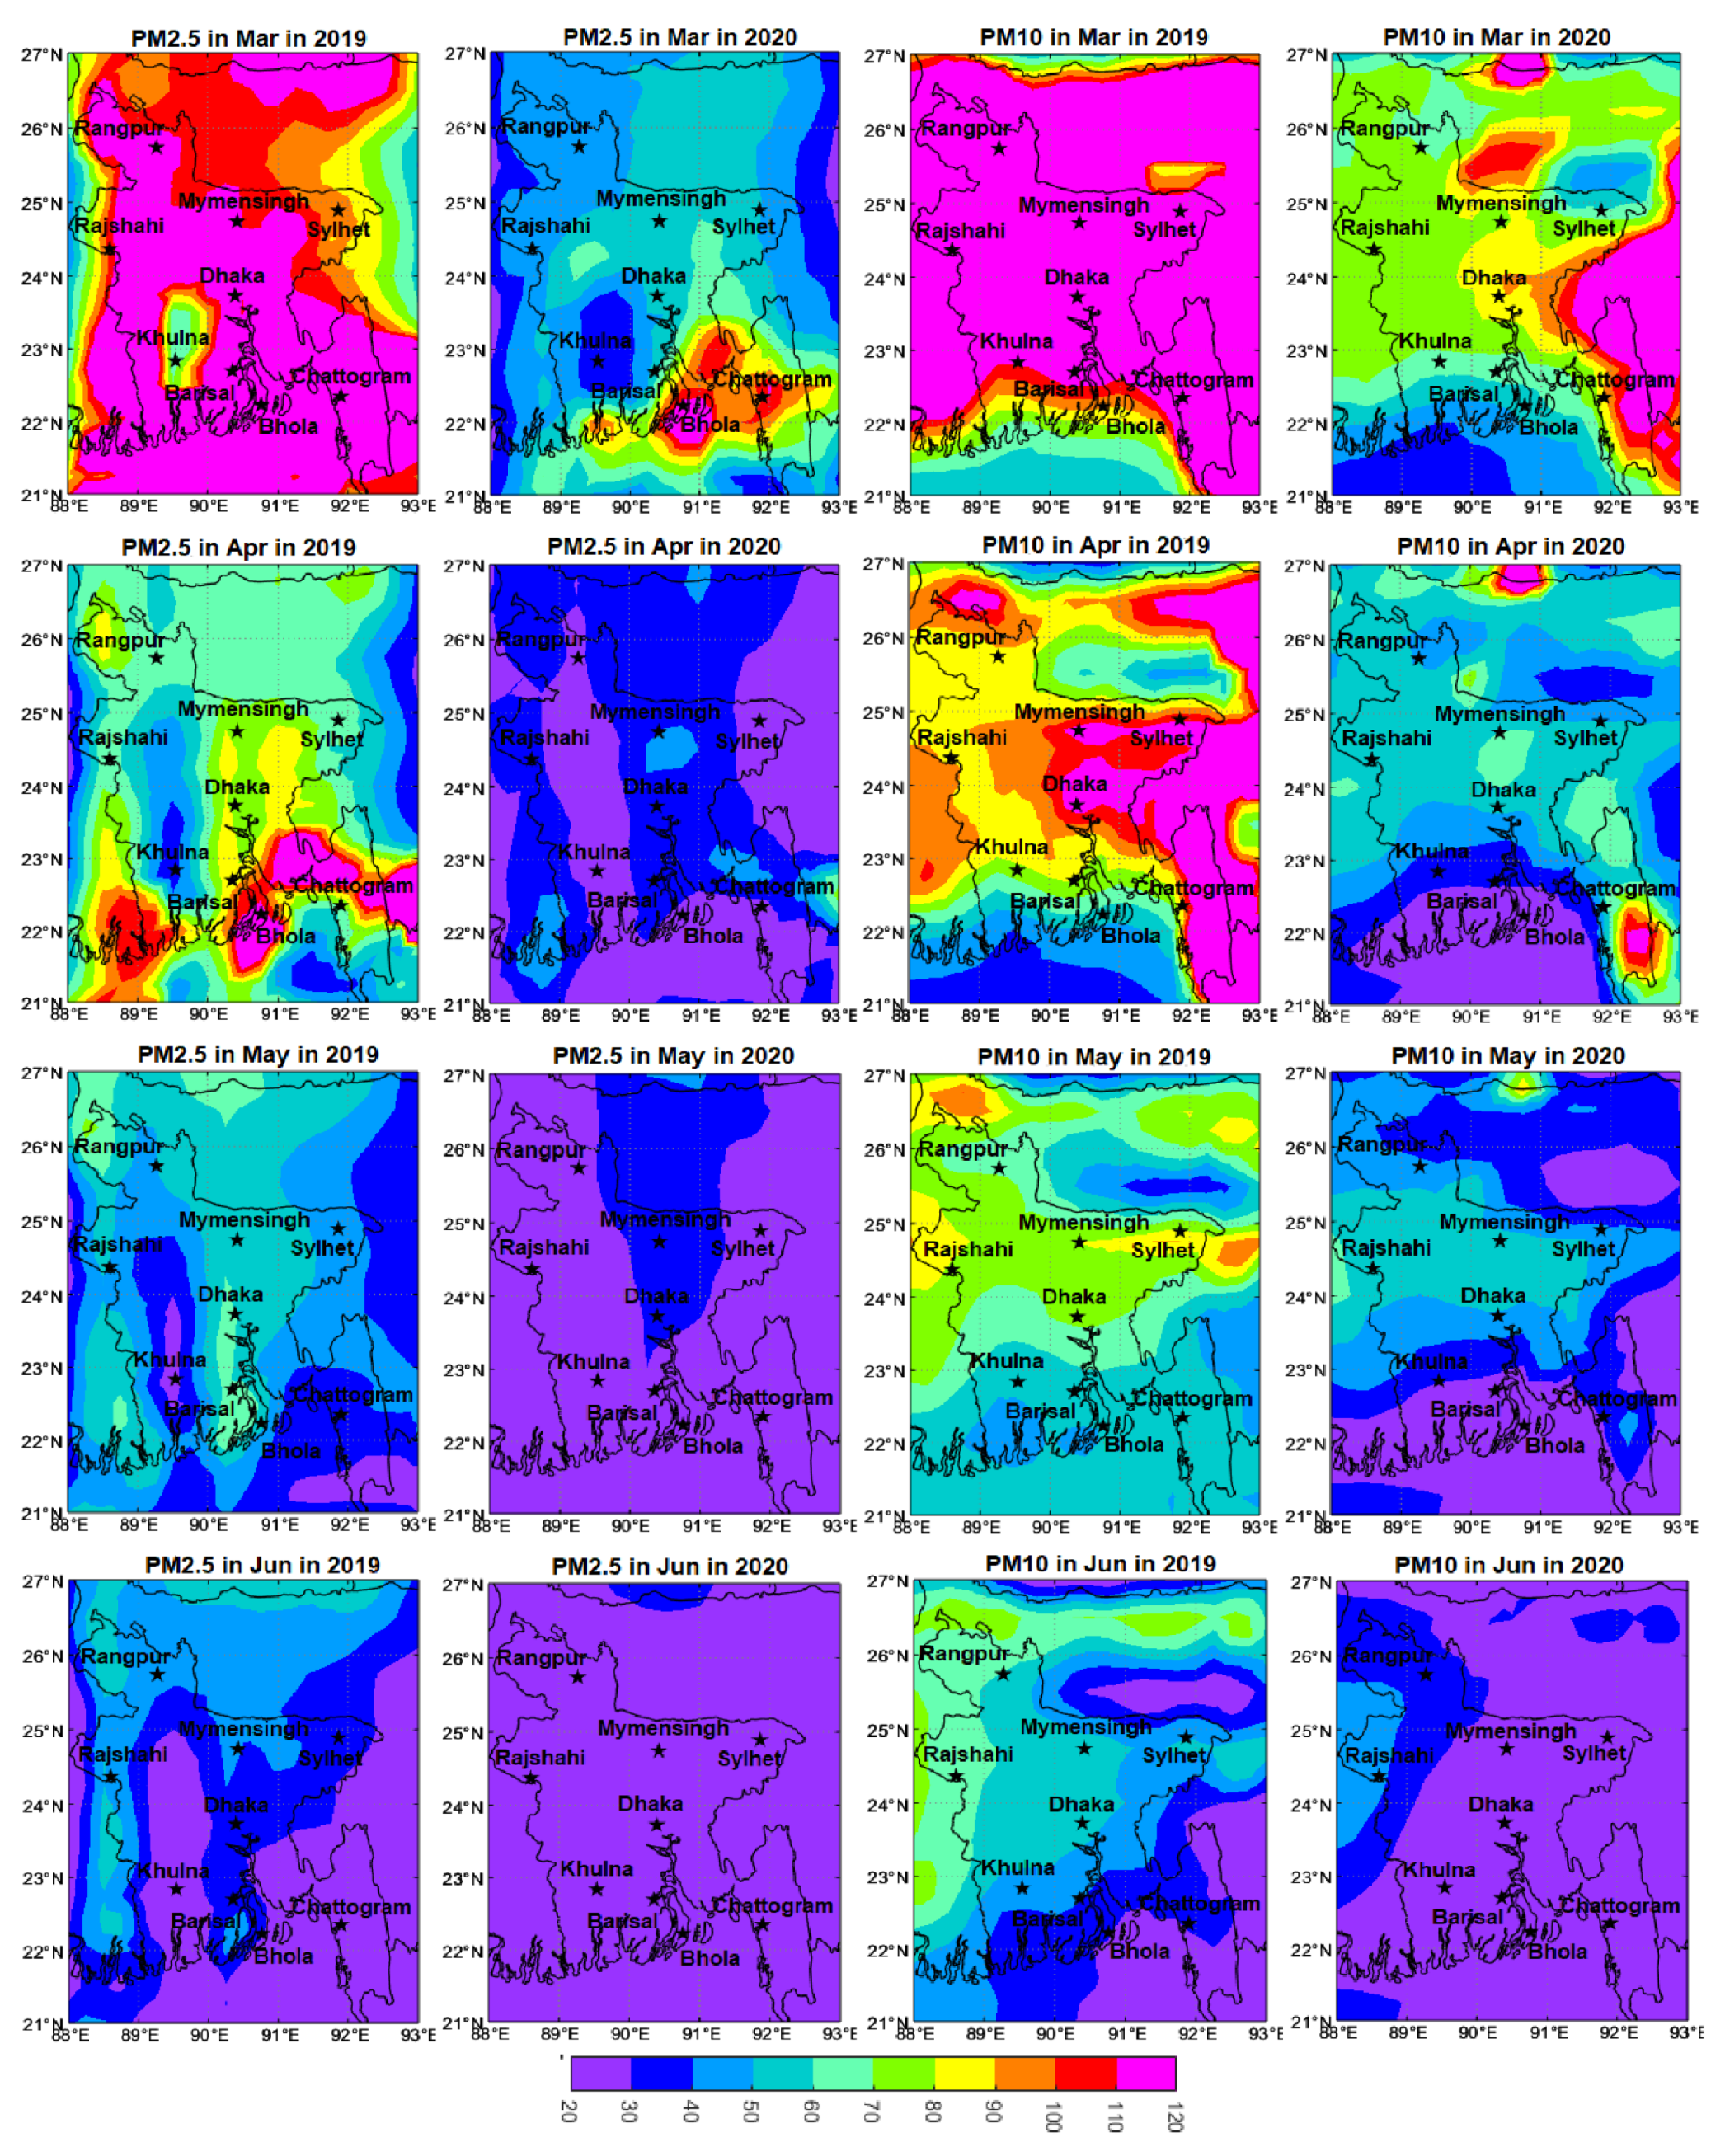
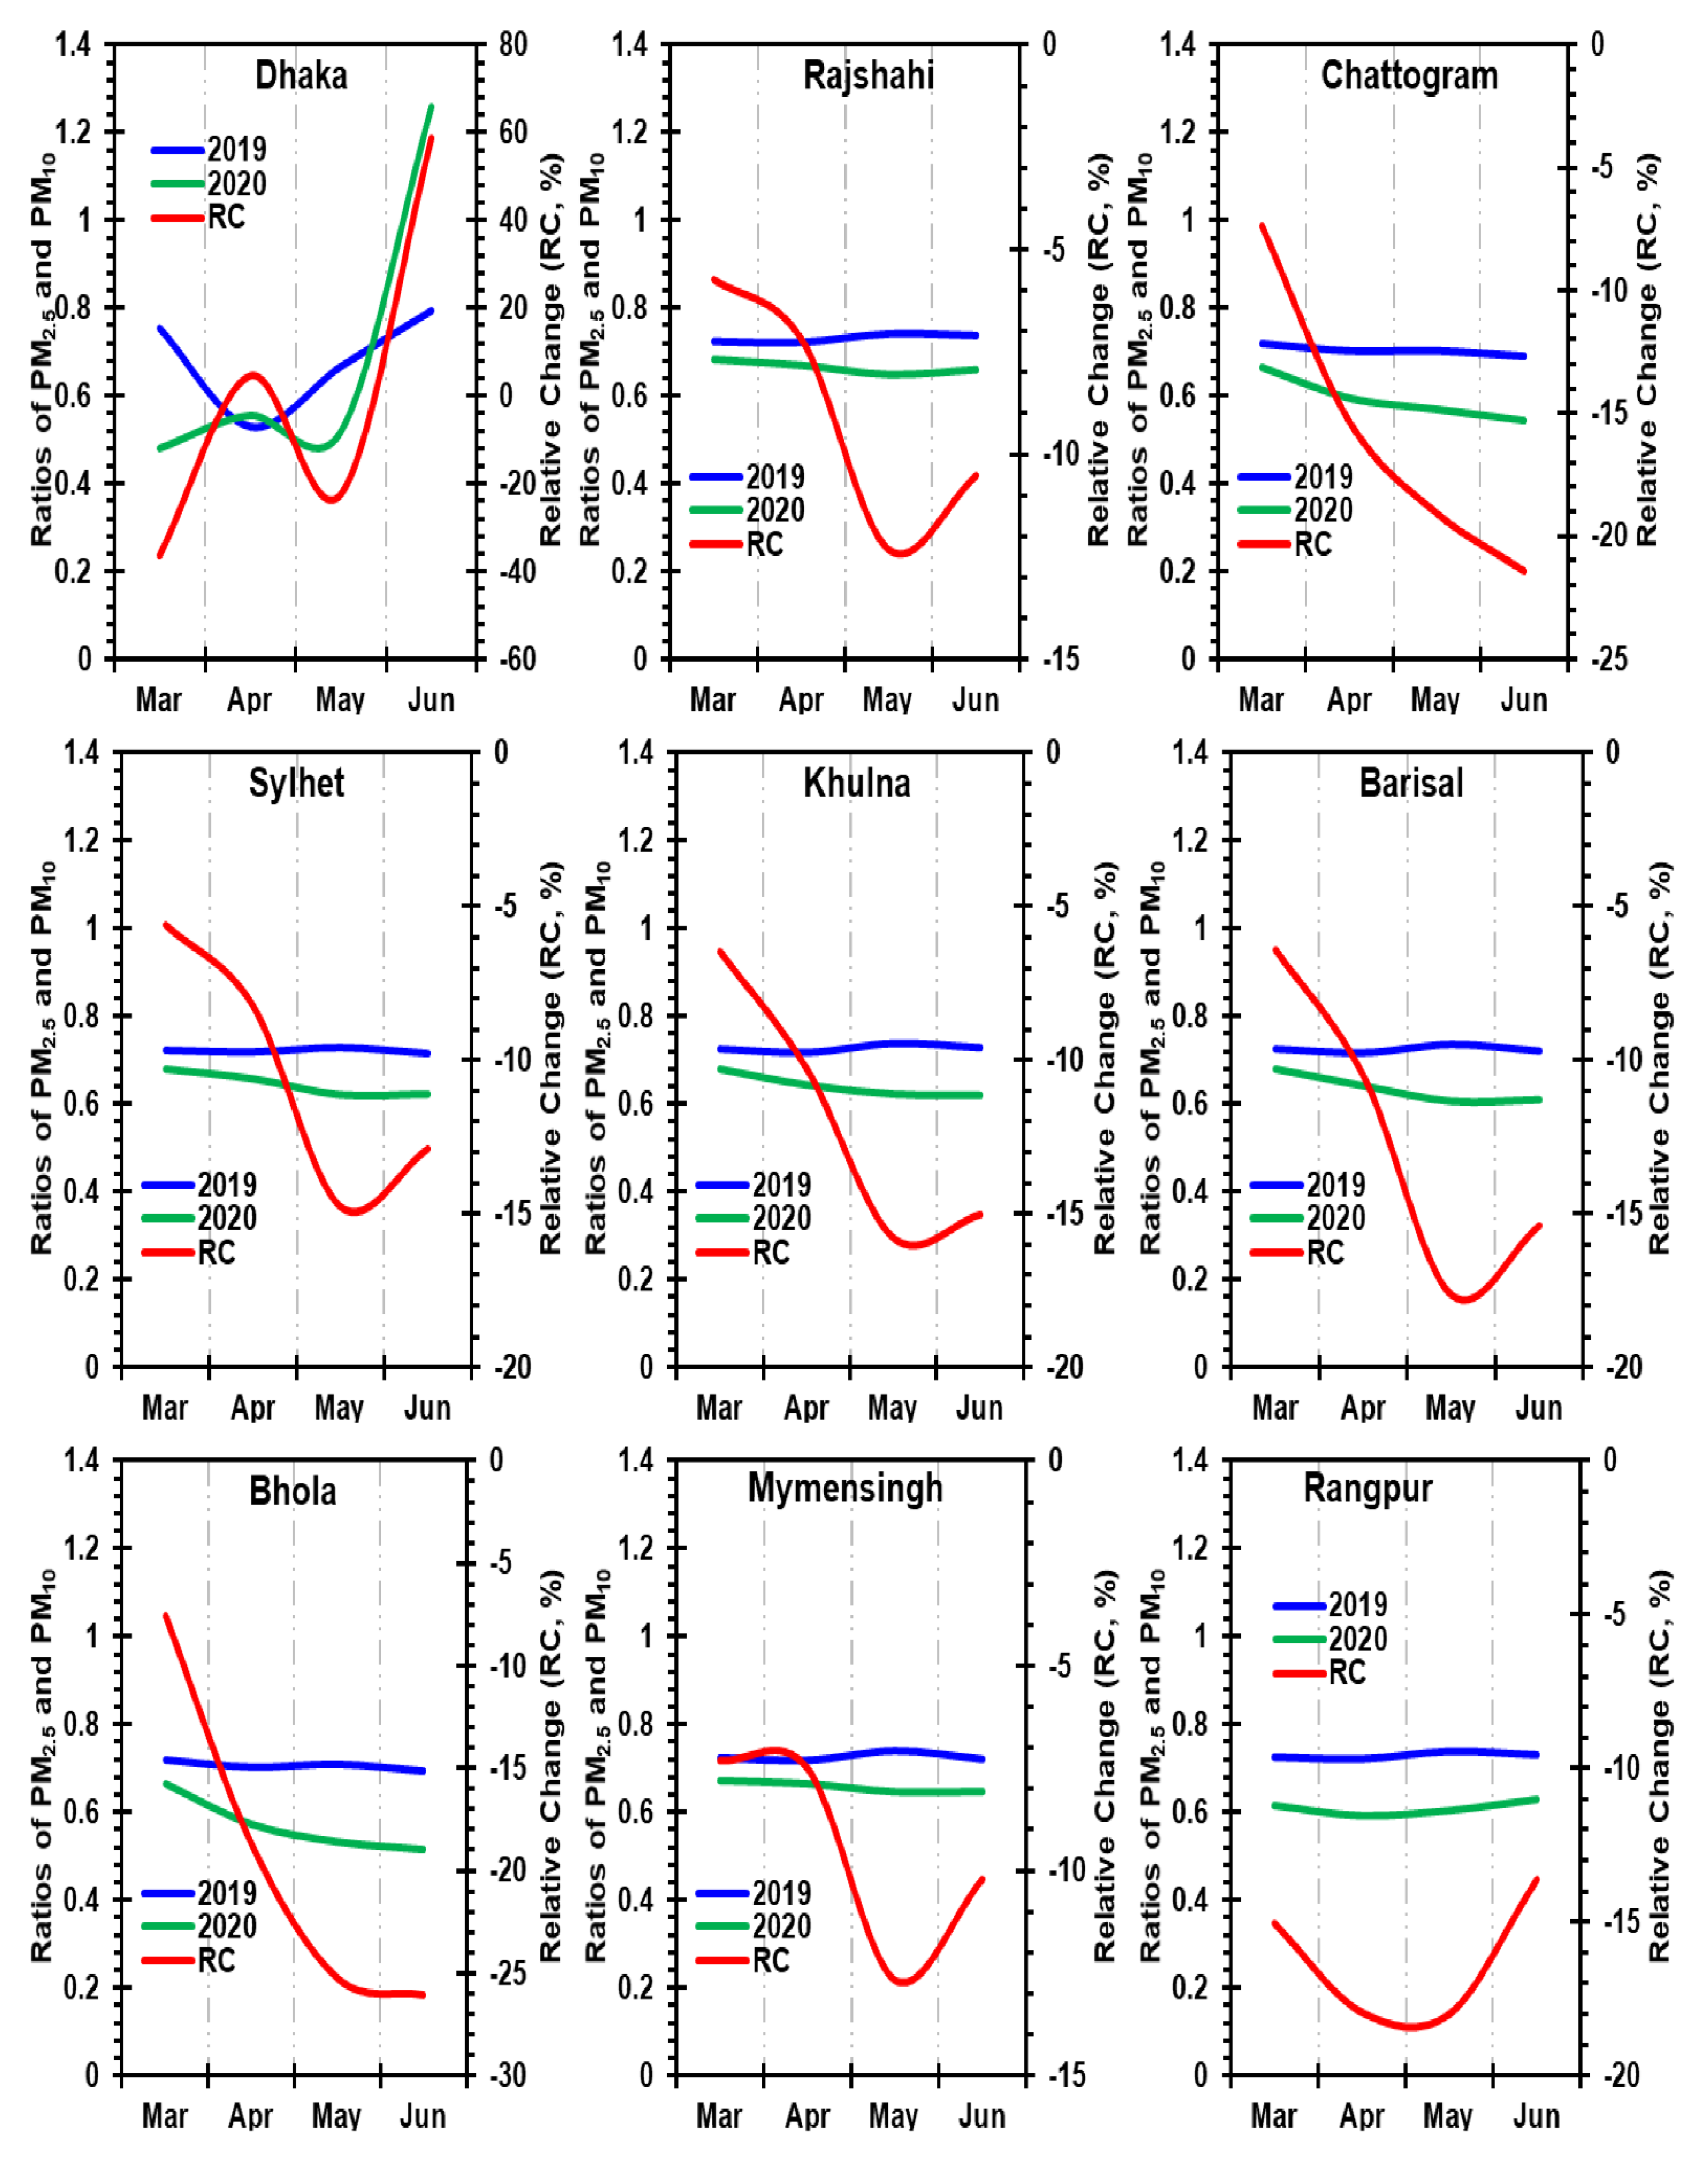
3.2. Spatiotemporal Distributions of PM2.5 and PM10

Figure 4 and Figure 5 show the spatial and temporal scenarios of CAMS-based monthly PMx (x = 2.5 and 10) and greater spatial variation in PMx was evident between the nine major cities of Bangladesh. As with AOD, significantly lower PM2.5 and PM10 were also evident in the major cities of Bangladesh during the 2020 strict lockdown (March–May) and partial lockdown (June) compared to 2019 (Figure 4). Notably, PM2.5 was reduced during both the 2020 strict lockdown (March–May) and partial lockdown (June), which varied between 37% and 77% among the cities, while the reduction in PM10 fluctuated substantially between 28% and 73% (Figure 4 and Figure 5). Besides, the PM2.5/PM10 ratio varied from 6% to 25% for major cities (Rajshahi, Chattogram, Sylhet, Khulna, Barisal, Bhola, Mymensingh, and Rangpur) during the 2020 strict lockdown and partial lockdown (Figure 6). This result revealed a substantial decrease in anthropogenic activities that are responsible for fine particulates pollution. However, Dhaka’s actually increased by 58% in June due to improper implementation of lockdown, with emissions from controlled industries and emergency vehicles (Figure 6).

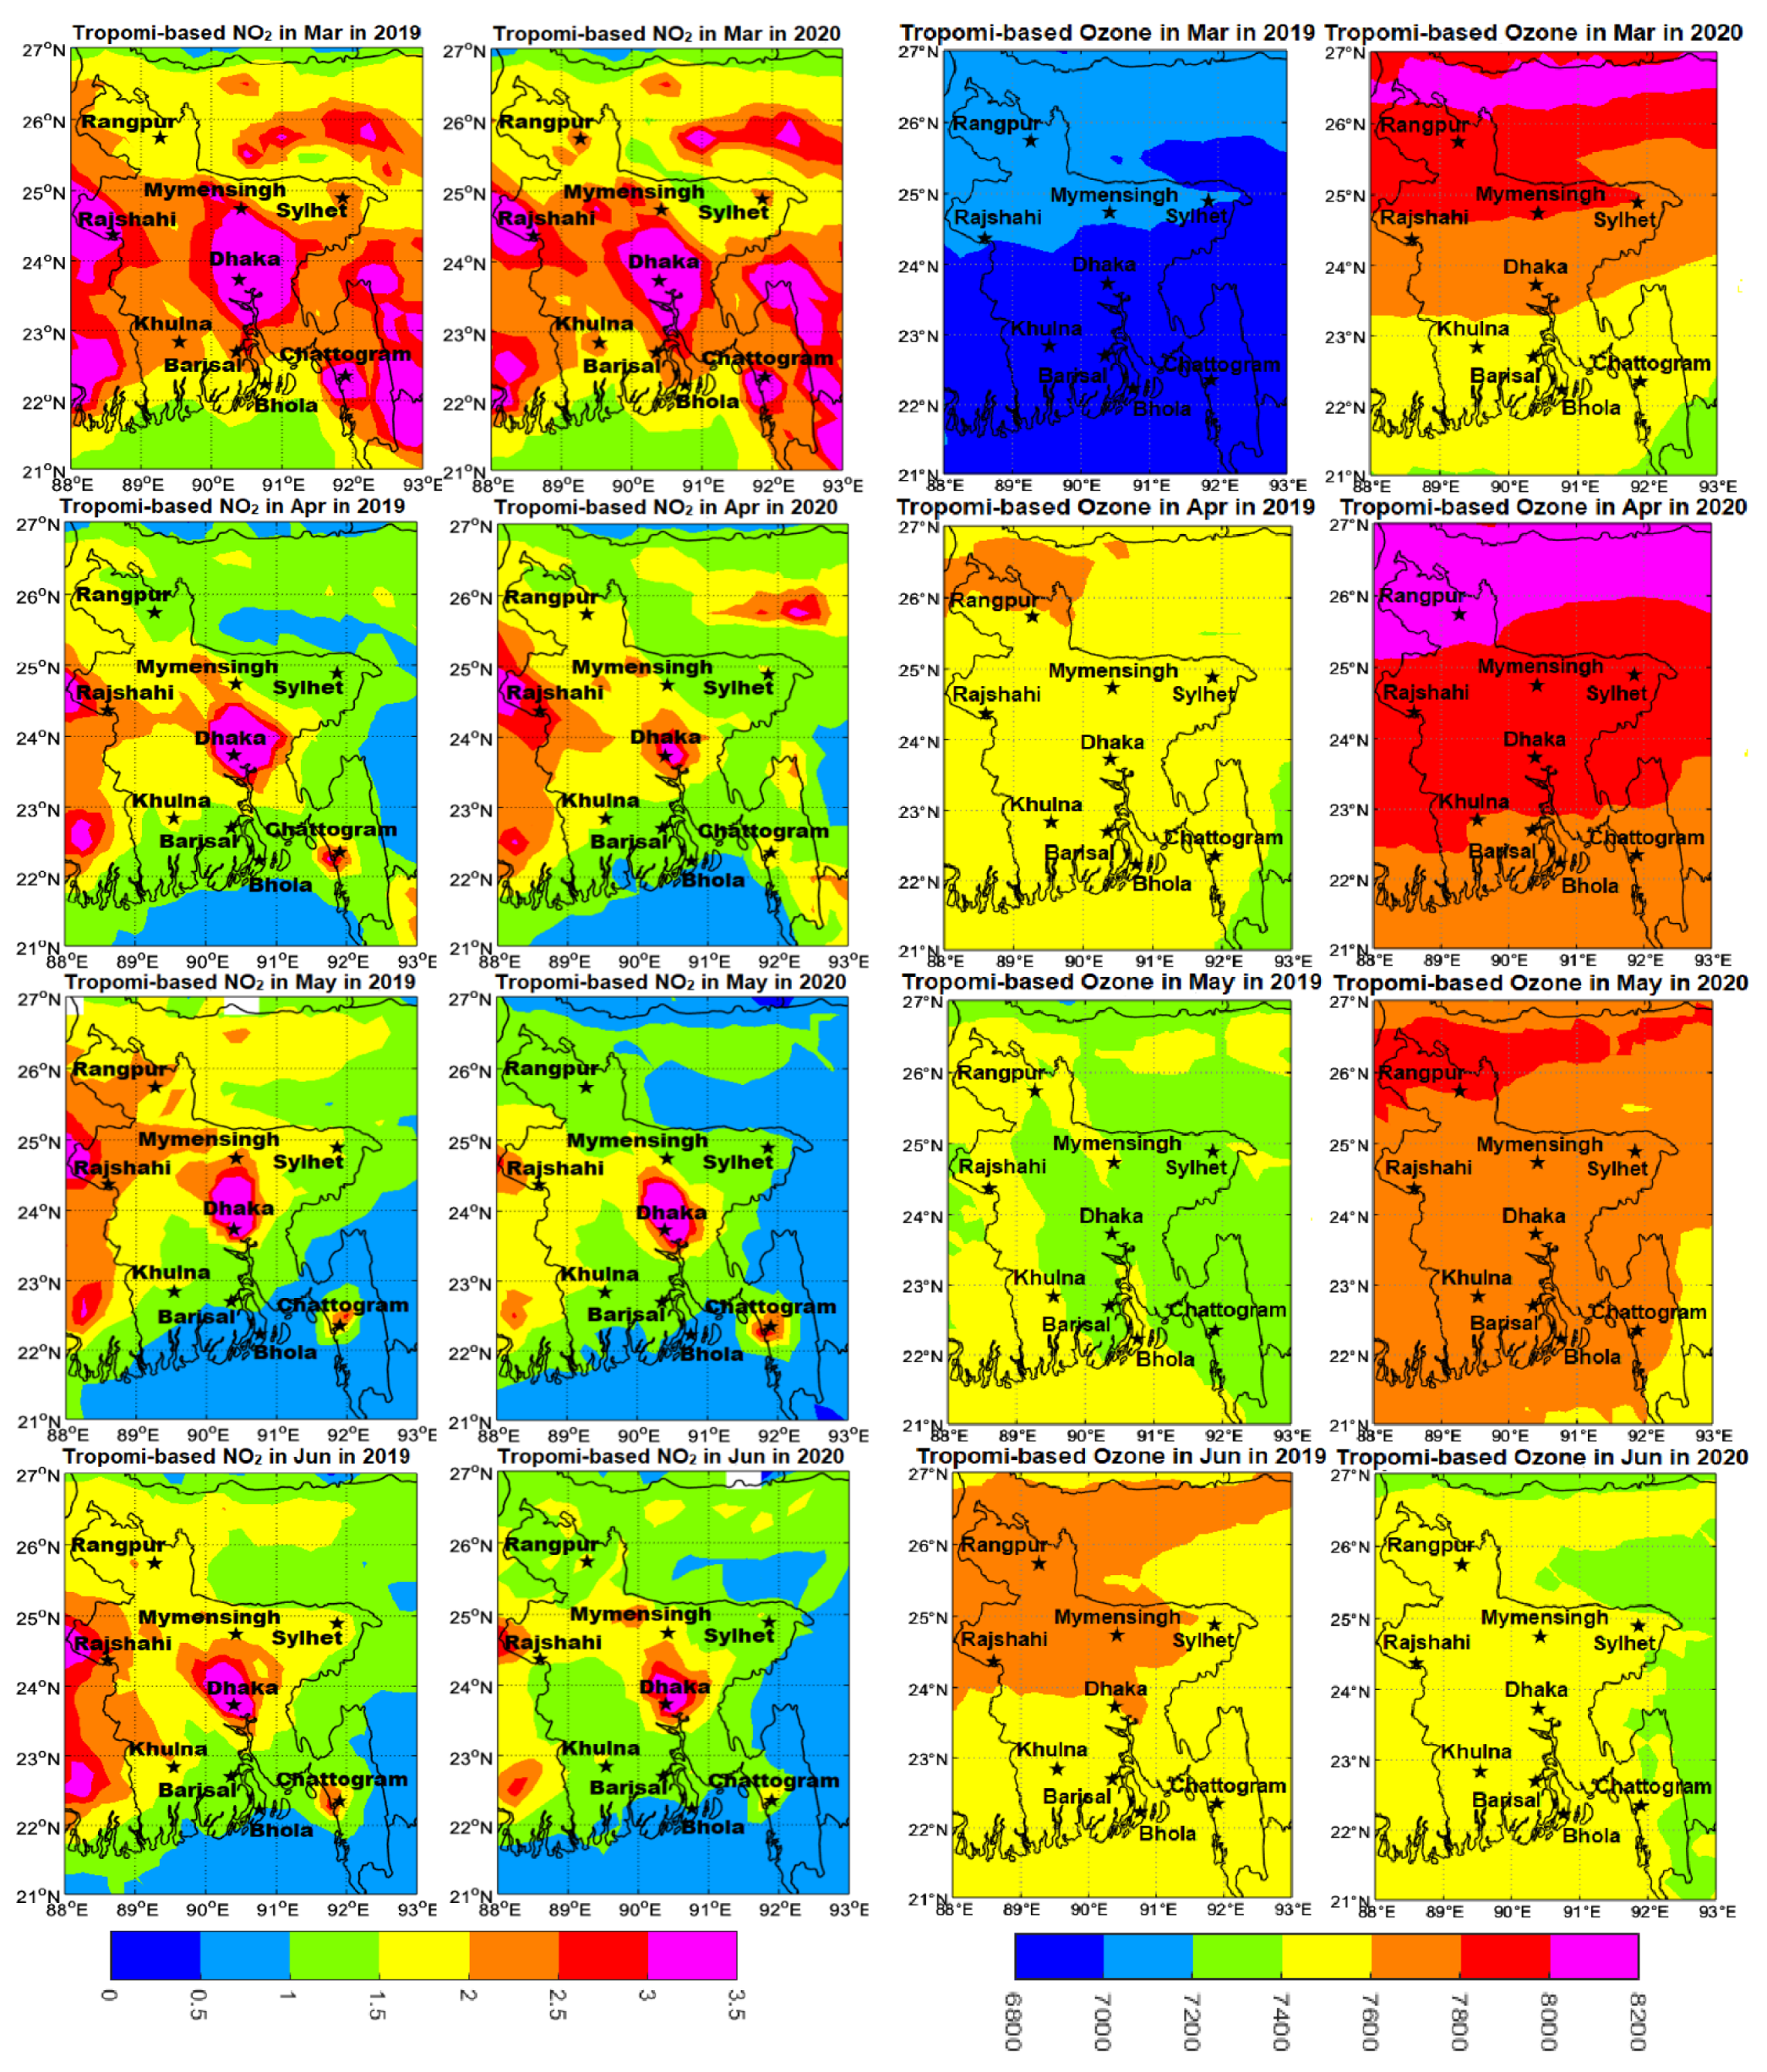
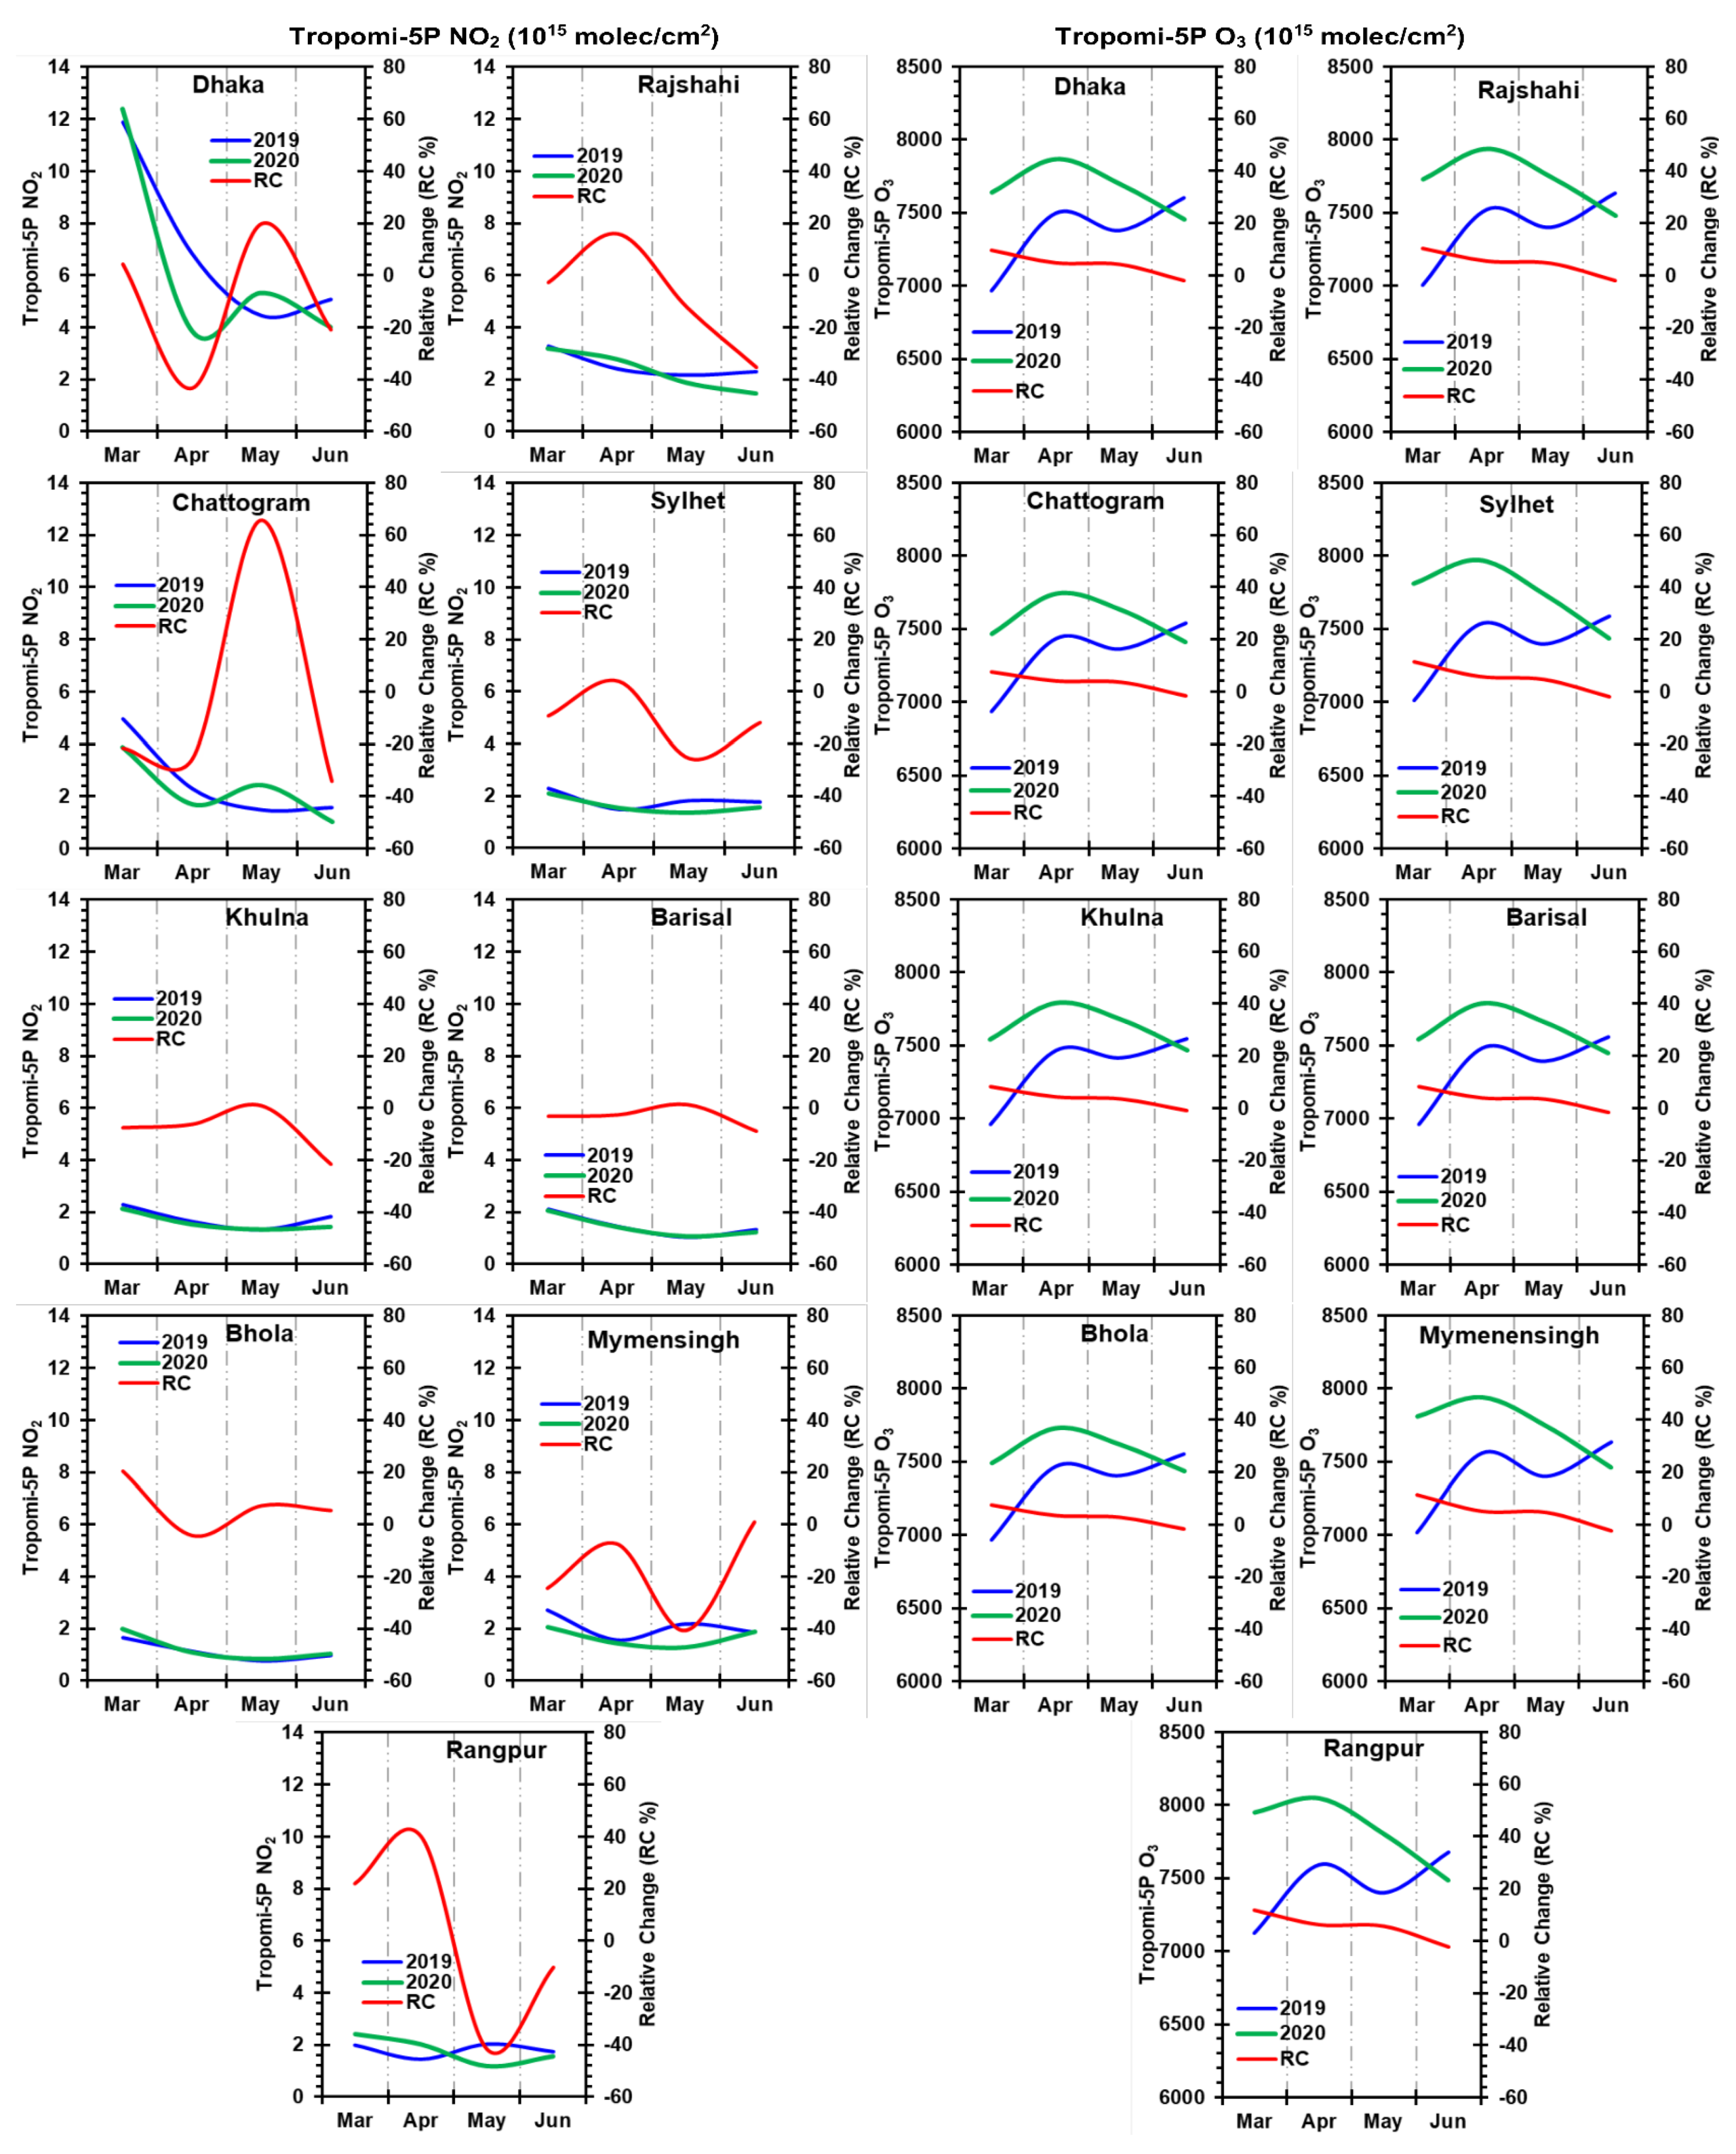
3.3. Spatiotemporal Distributions of NO2 and O3

Nitrogen oxides (NOx) are mainly released in the form of NO from industries, power plants, residential heating, and vehicle exhausts [49], and they then form NO2 through the oxidation process. NO2 is known as a tracer of anthropogenic combustion activities and precursor of nitrate aerosols and ozone [50]. NO2 can cause respiratory diseases and asthma [19], and damages the environment through the production of acid rain [50]. As expected, like AOD and PM2.5 (PM10), a substantial spatial contrast in NO2 and O3 (1015 molec/cm2) was observed in all the major cities of Bangladesh during the 2020 strict lockdown (March–May) and partial lockdown (June) compared to 2019 (Figure 7). Remarkably, NO2 decreased by 3–25% in Rajshahi, Chattogram, Sylhet, Khulna, Barisal, and Mymensingh, although in Dhaka, Bhola, and Rangpur it increased by 4–22% in March 2020 compared to 2019. On the other hand, ozone (O3) increased between 8% and 12% over the country (Figure 8). As expected, NO2 also decreased between 4% and 43% in Dhaka, Chattogram, Khulna, Barisal, Bhola, and Mymensingh and increased between 4% and 40% in Sylhet, Rajshahi, and Rangpur during April 2020 when compared to 2019, while O3 increased between 4% and 6% throughout the country. During the strict lockdown in May 2020, NO2 also decreased between 12% and 42% in Rajshahi, Sylhet, Mymensingh, and Rangpur, and increased by 1–66% in Dhaka, Chattogram, Khulna, Barisal, and Bhola, while O3 increased between 3% and 5% over the country. On the other hand, NO2, during the partial lockdown was also reduced between 9% and 35% in Dhaka, Chattogram, Sylhet, Khulna, Barisal, and Rangpur, and increased between 1% and 5% in Bhola and Mymensingh, while a slight reduction in O3 (1–3%) was observed over the country (Figure 8).
Section 3.1, Section 3.2, Section 3.3 and Section 3.4 have shown a substantial decrease in air pollution, indicated by a decrease in the aerosol optical properties AOD, as well as reduced PM and NO2 concentrations, in most of the major cities of Bangladesh during the lockdown period. However, concentrations of O3 increased in some parts of the country. Based on these findings, this study further investigates how these changes relate to changes in specific aerosol types, in order to demonstrate how the lockdown effect has influenced the general aerosol types over the region.

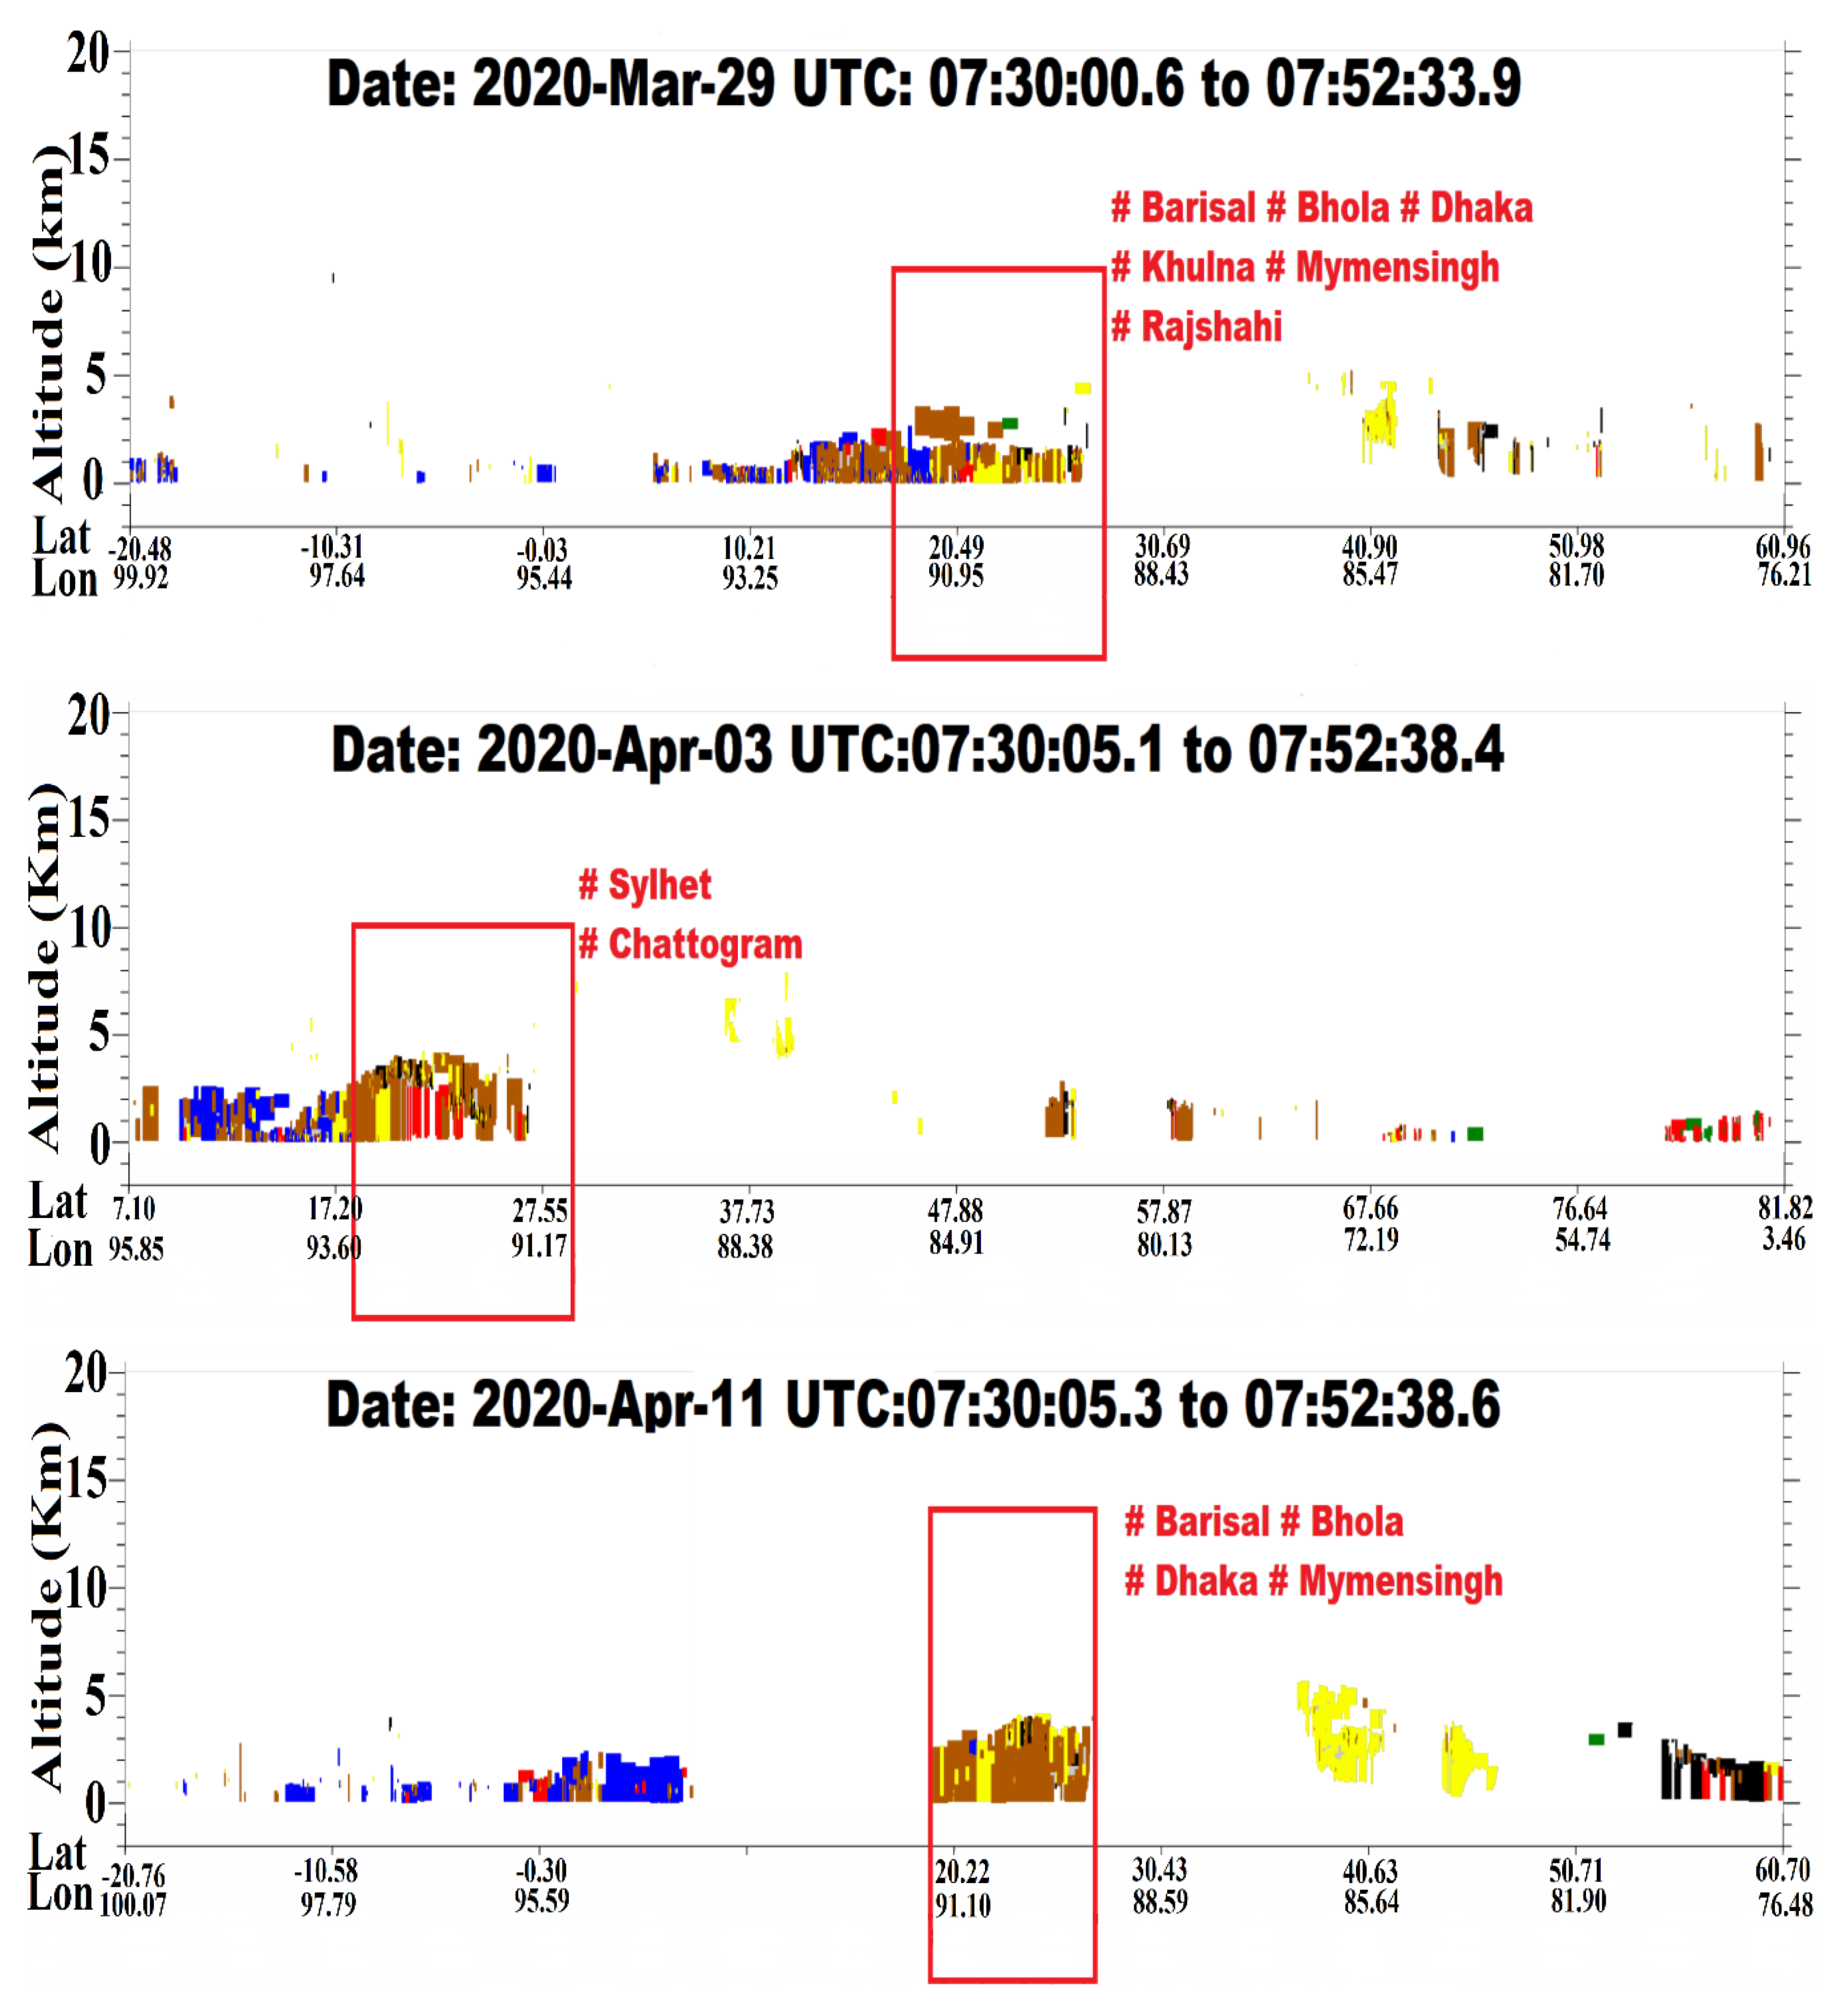
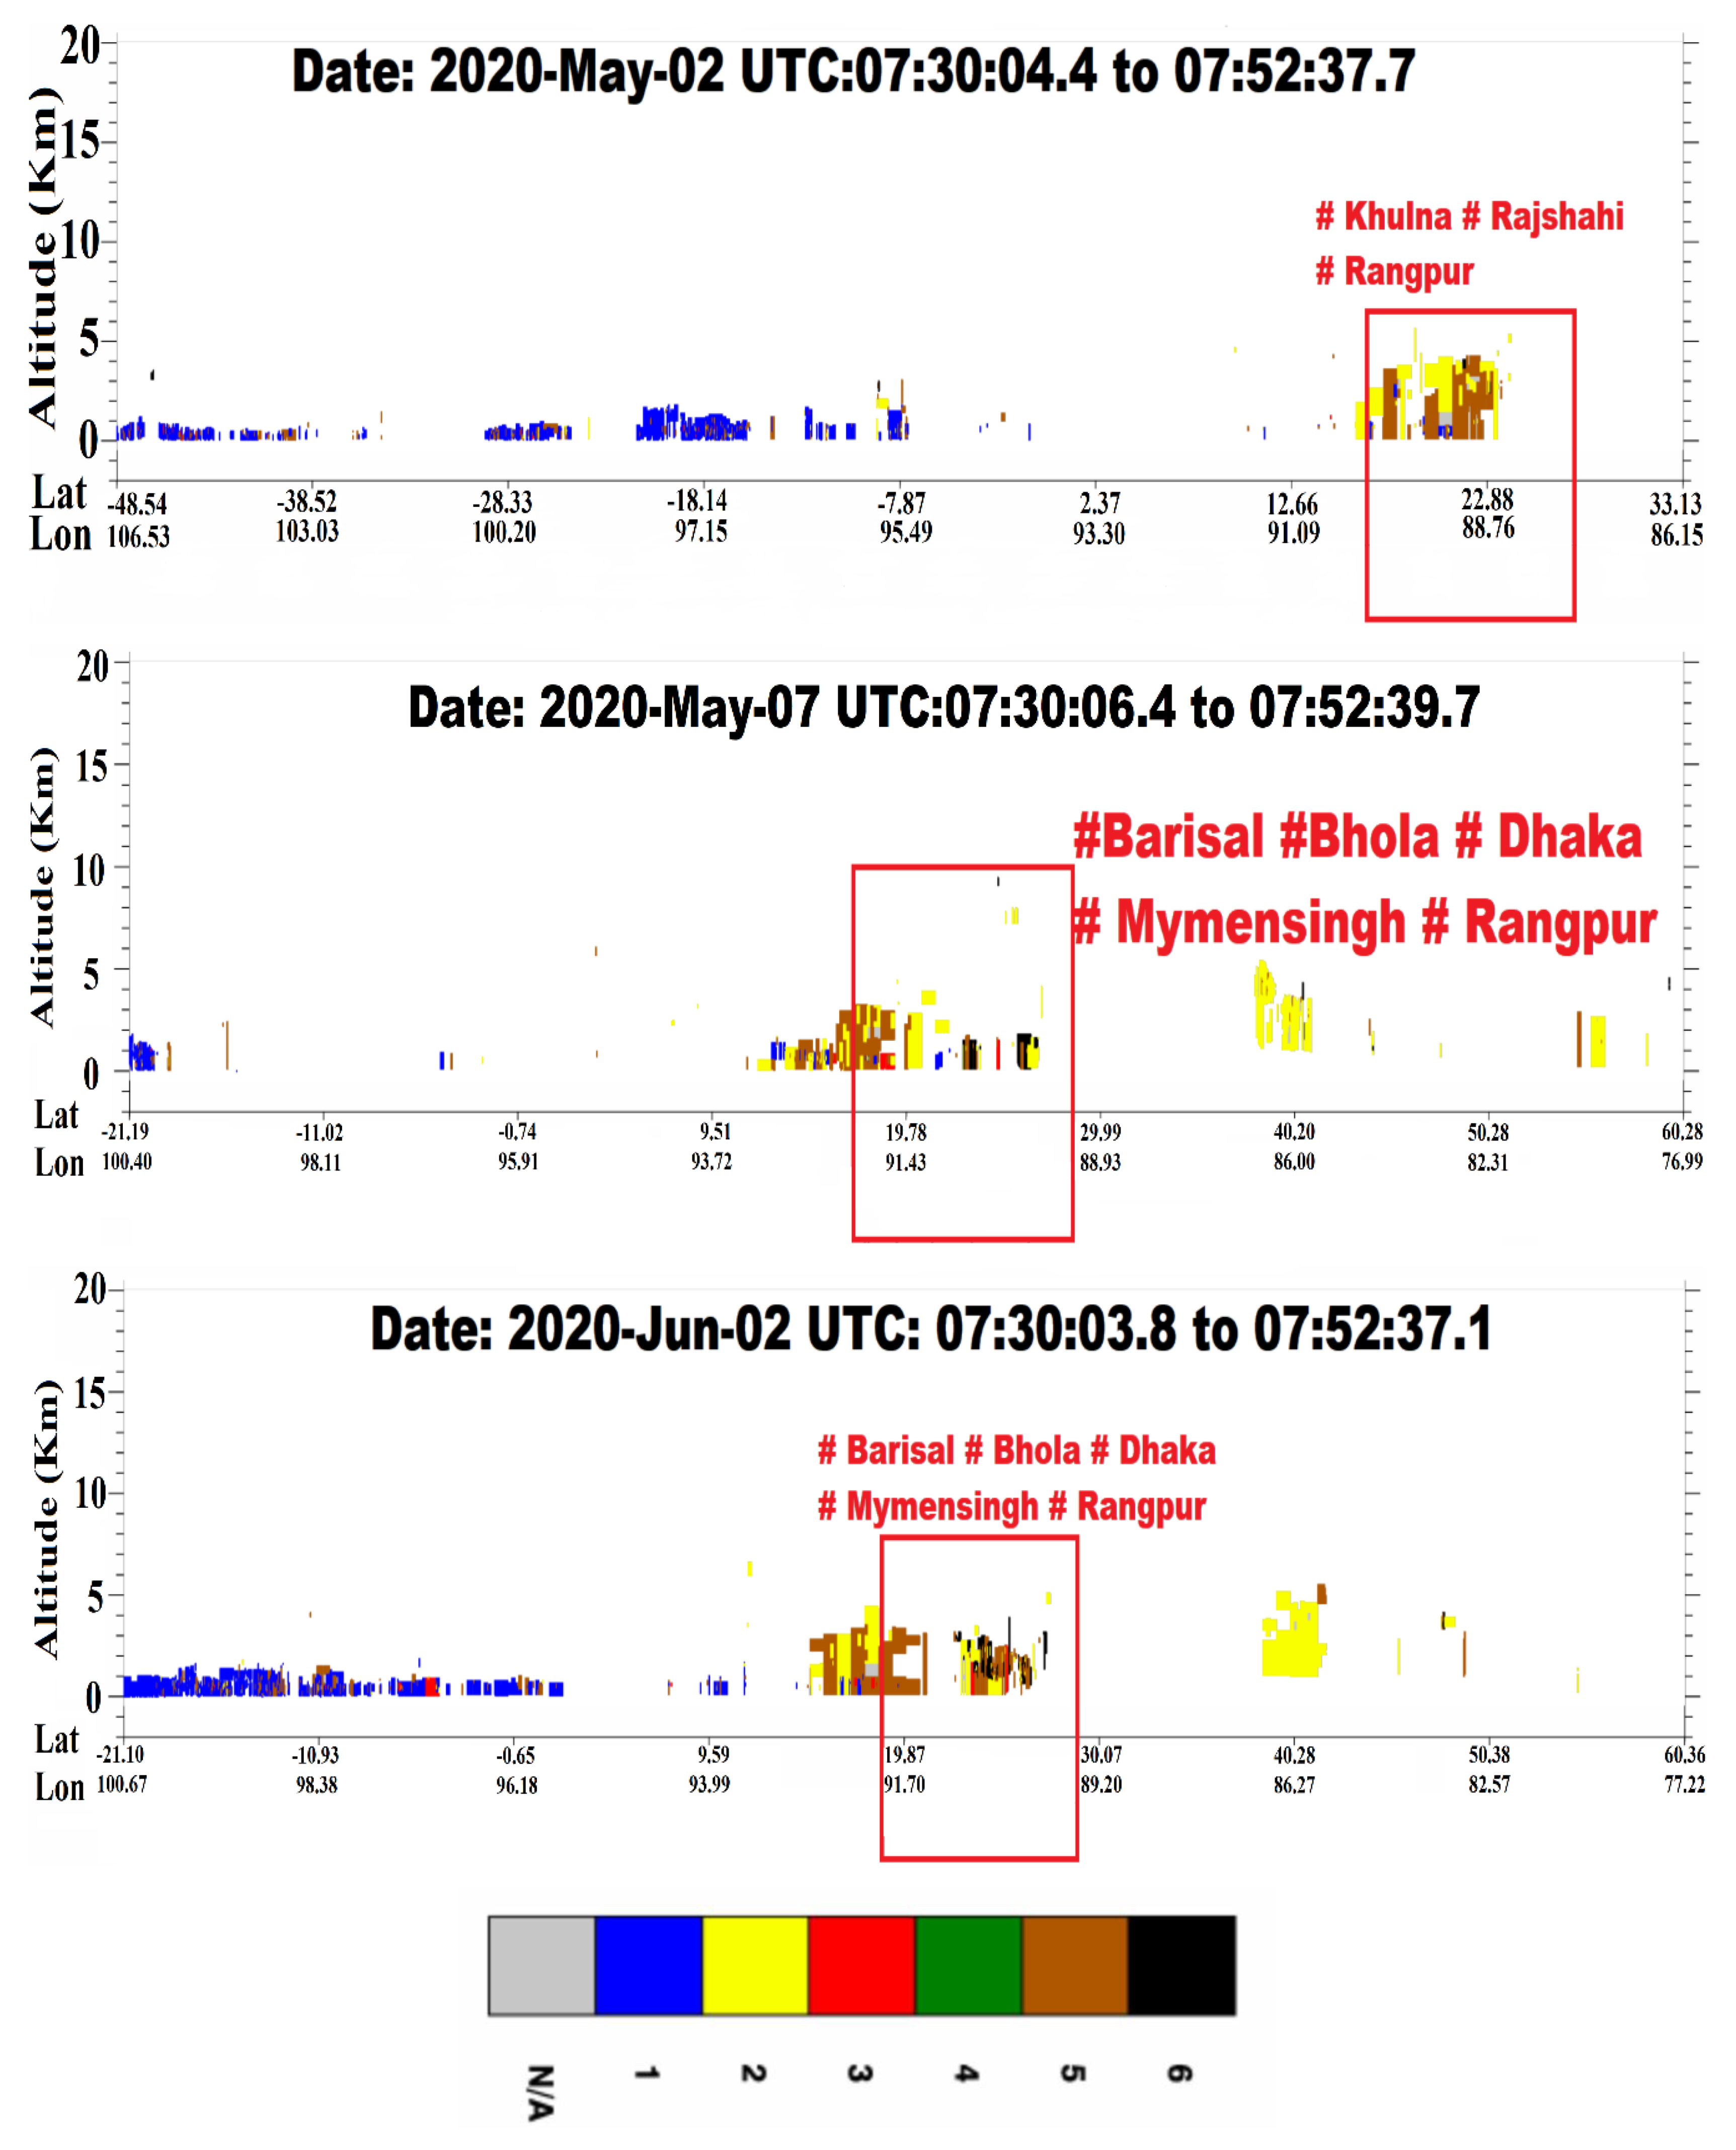
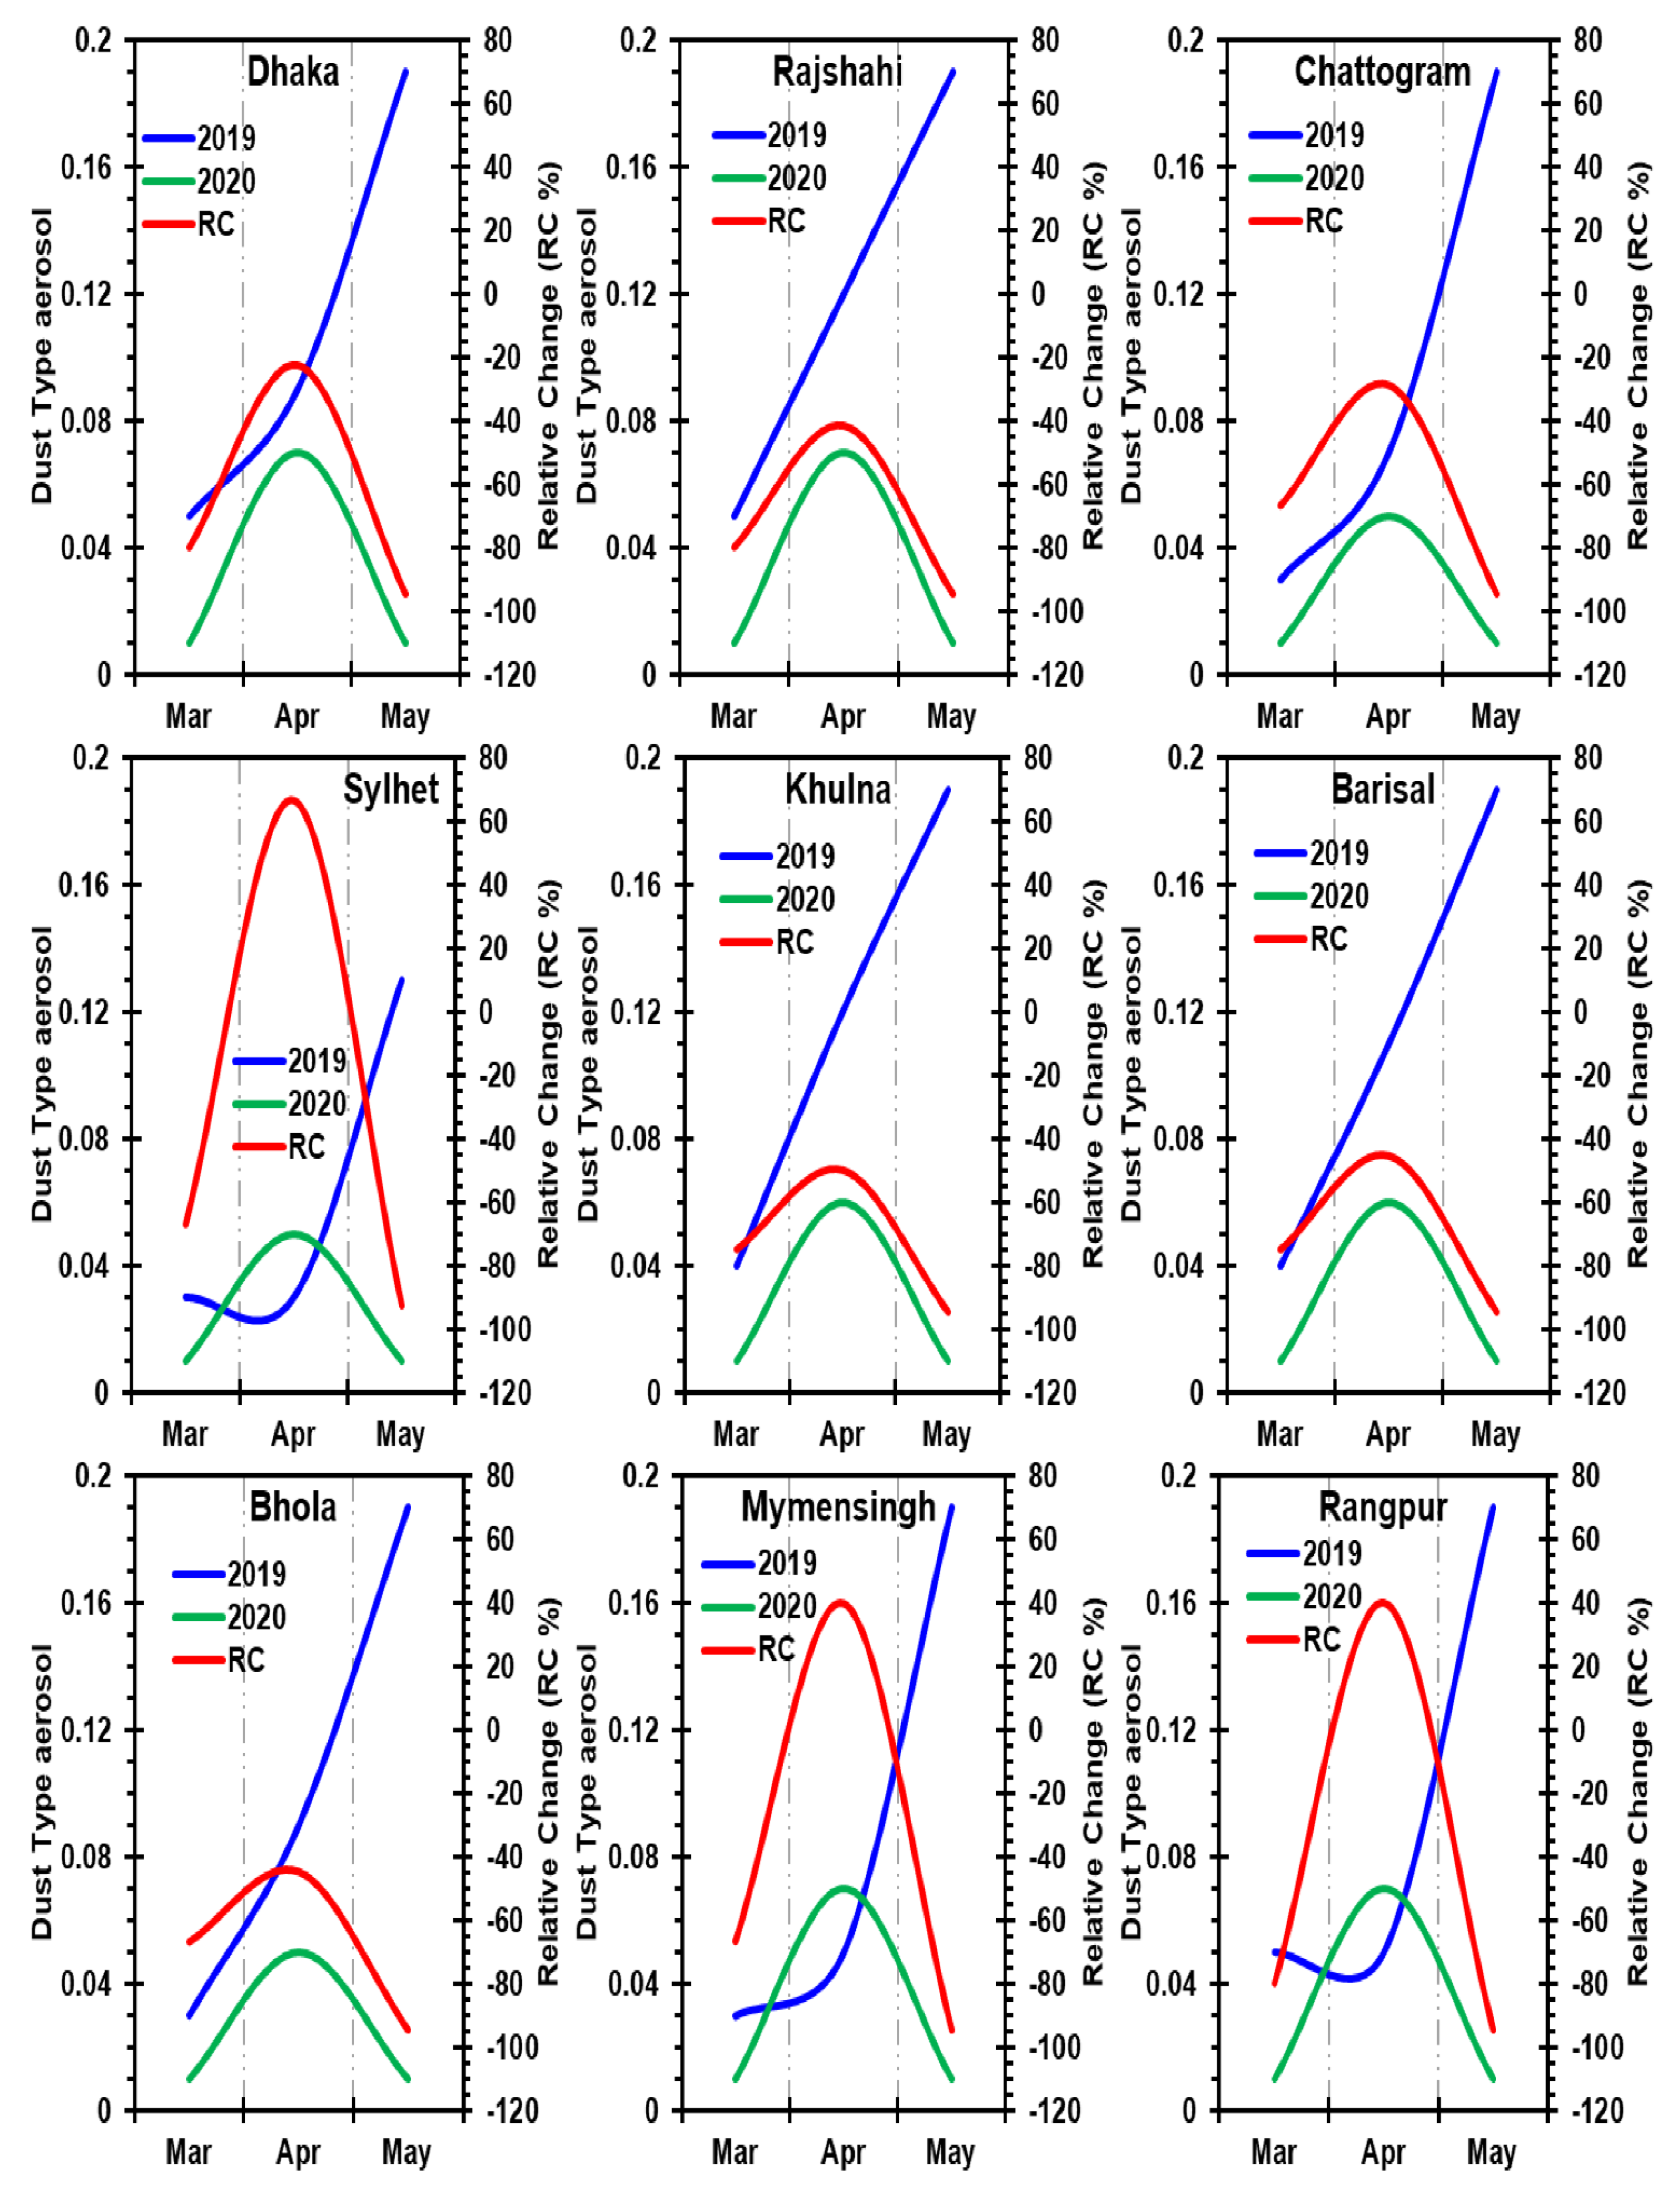
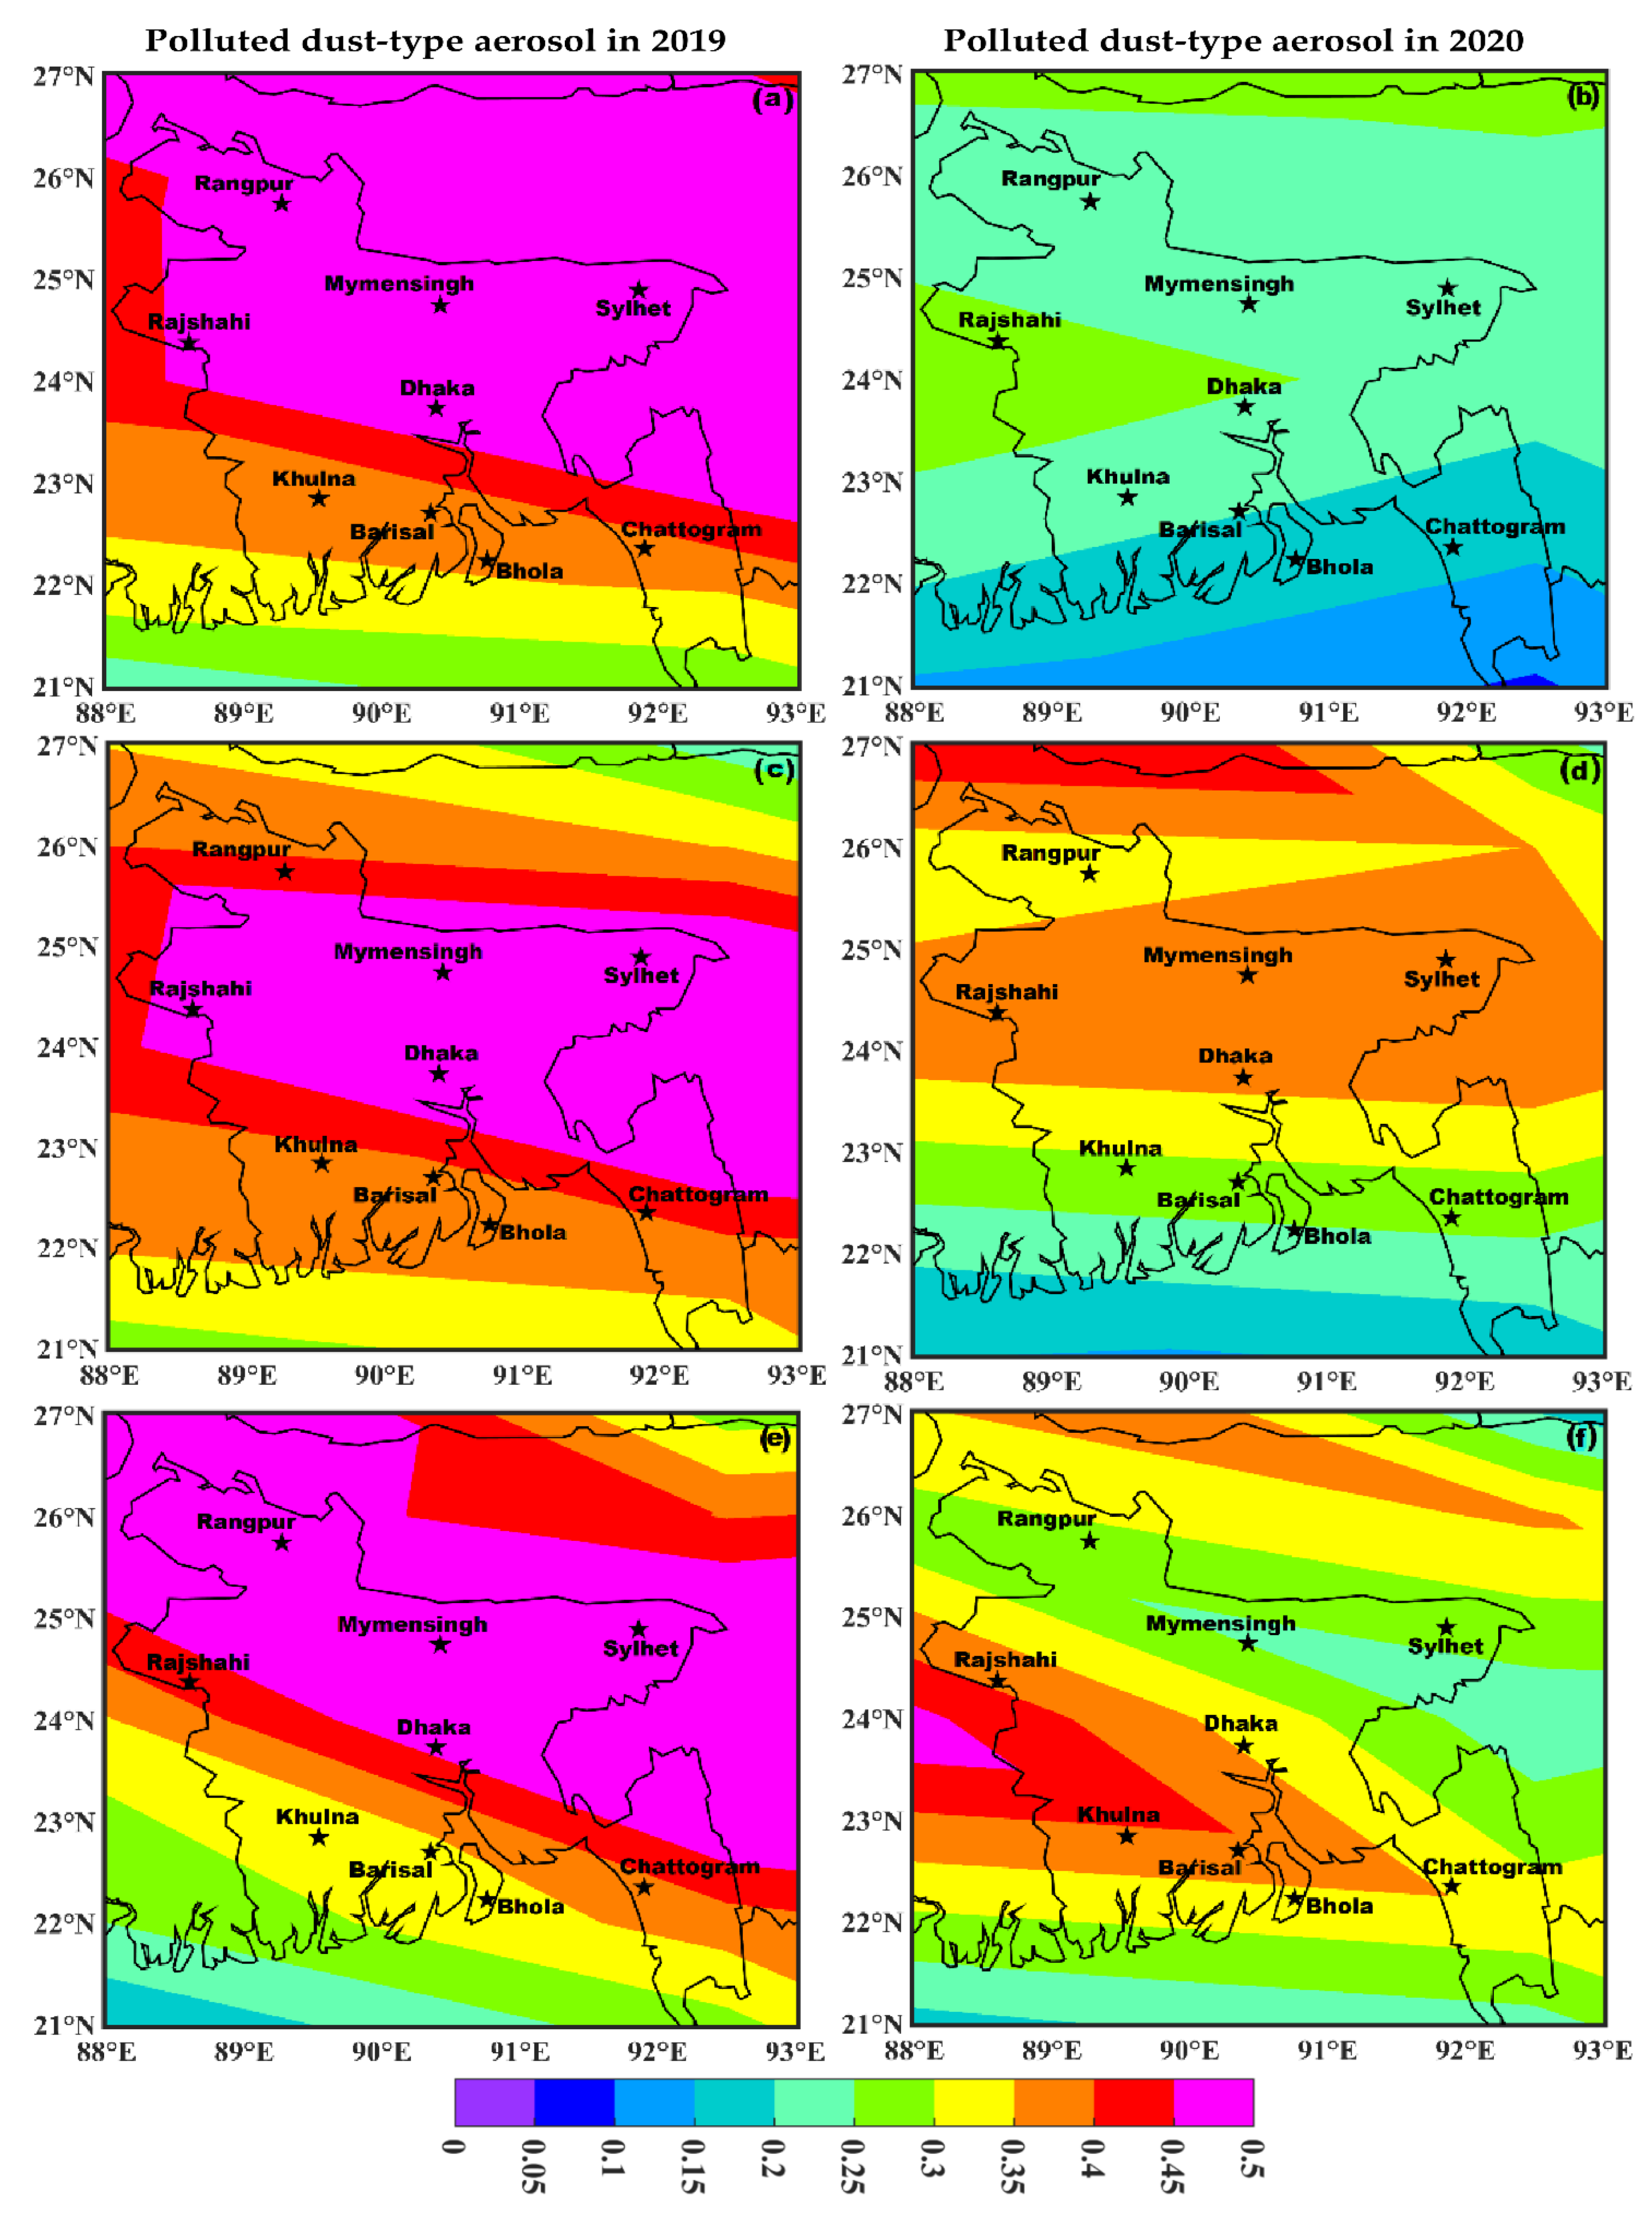
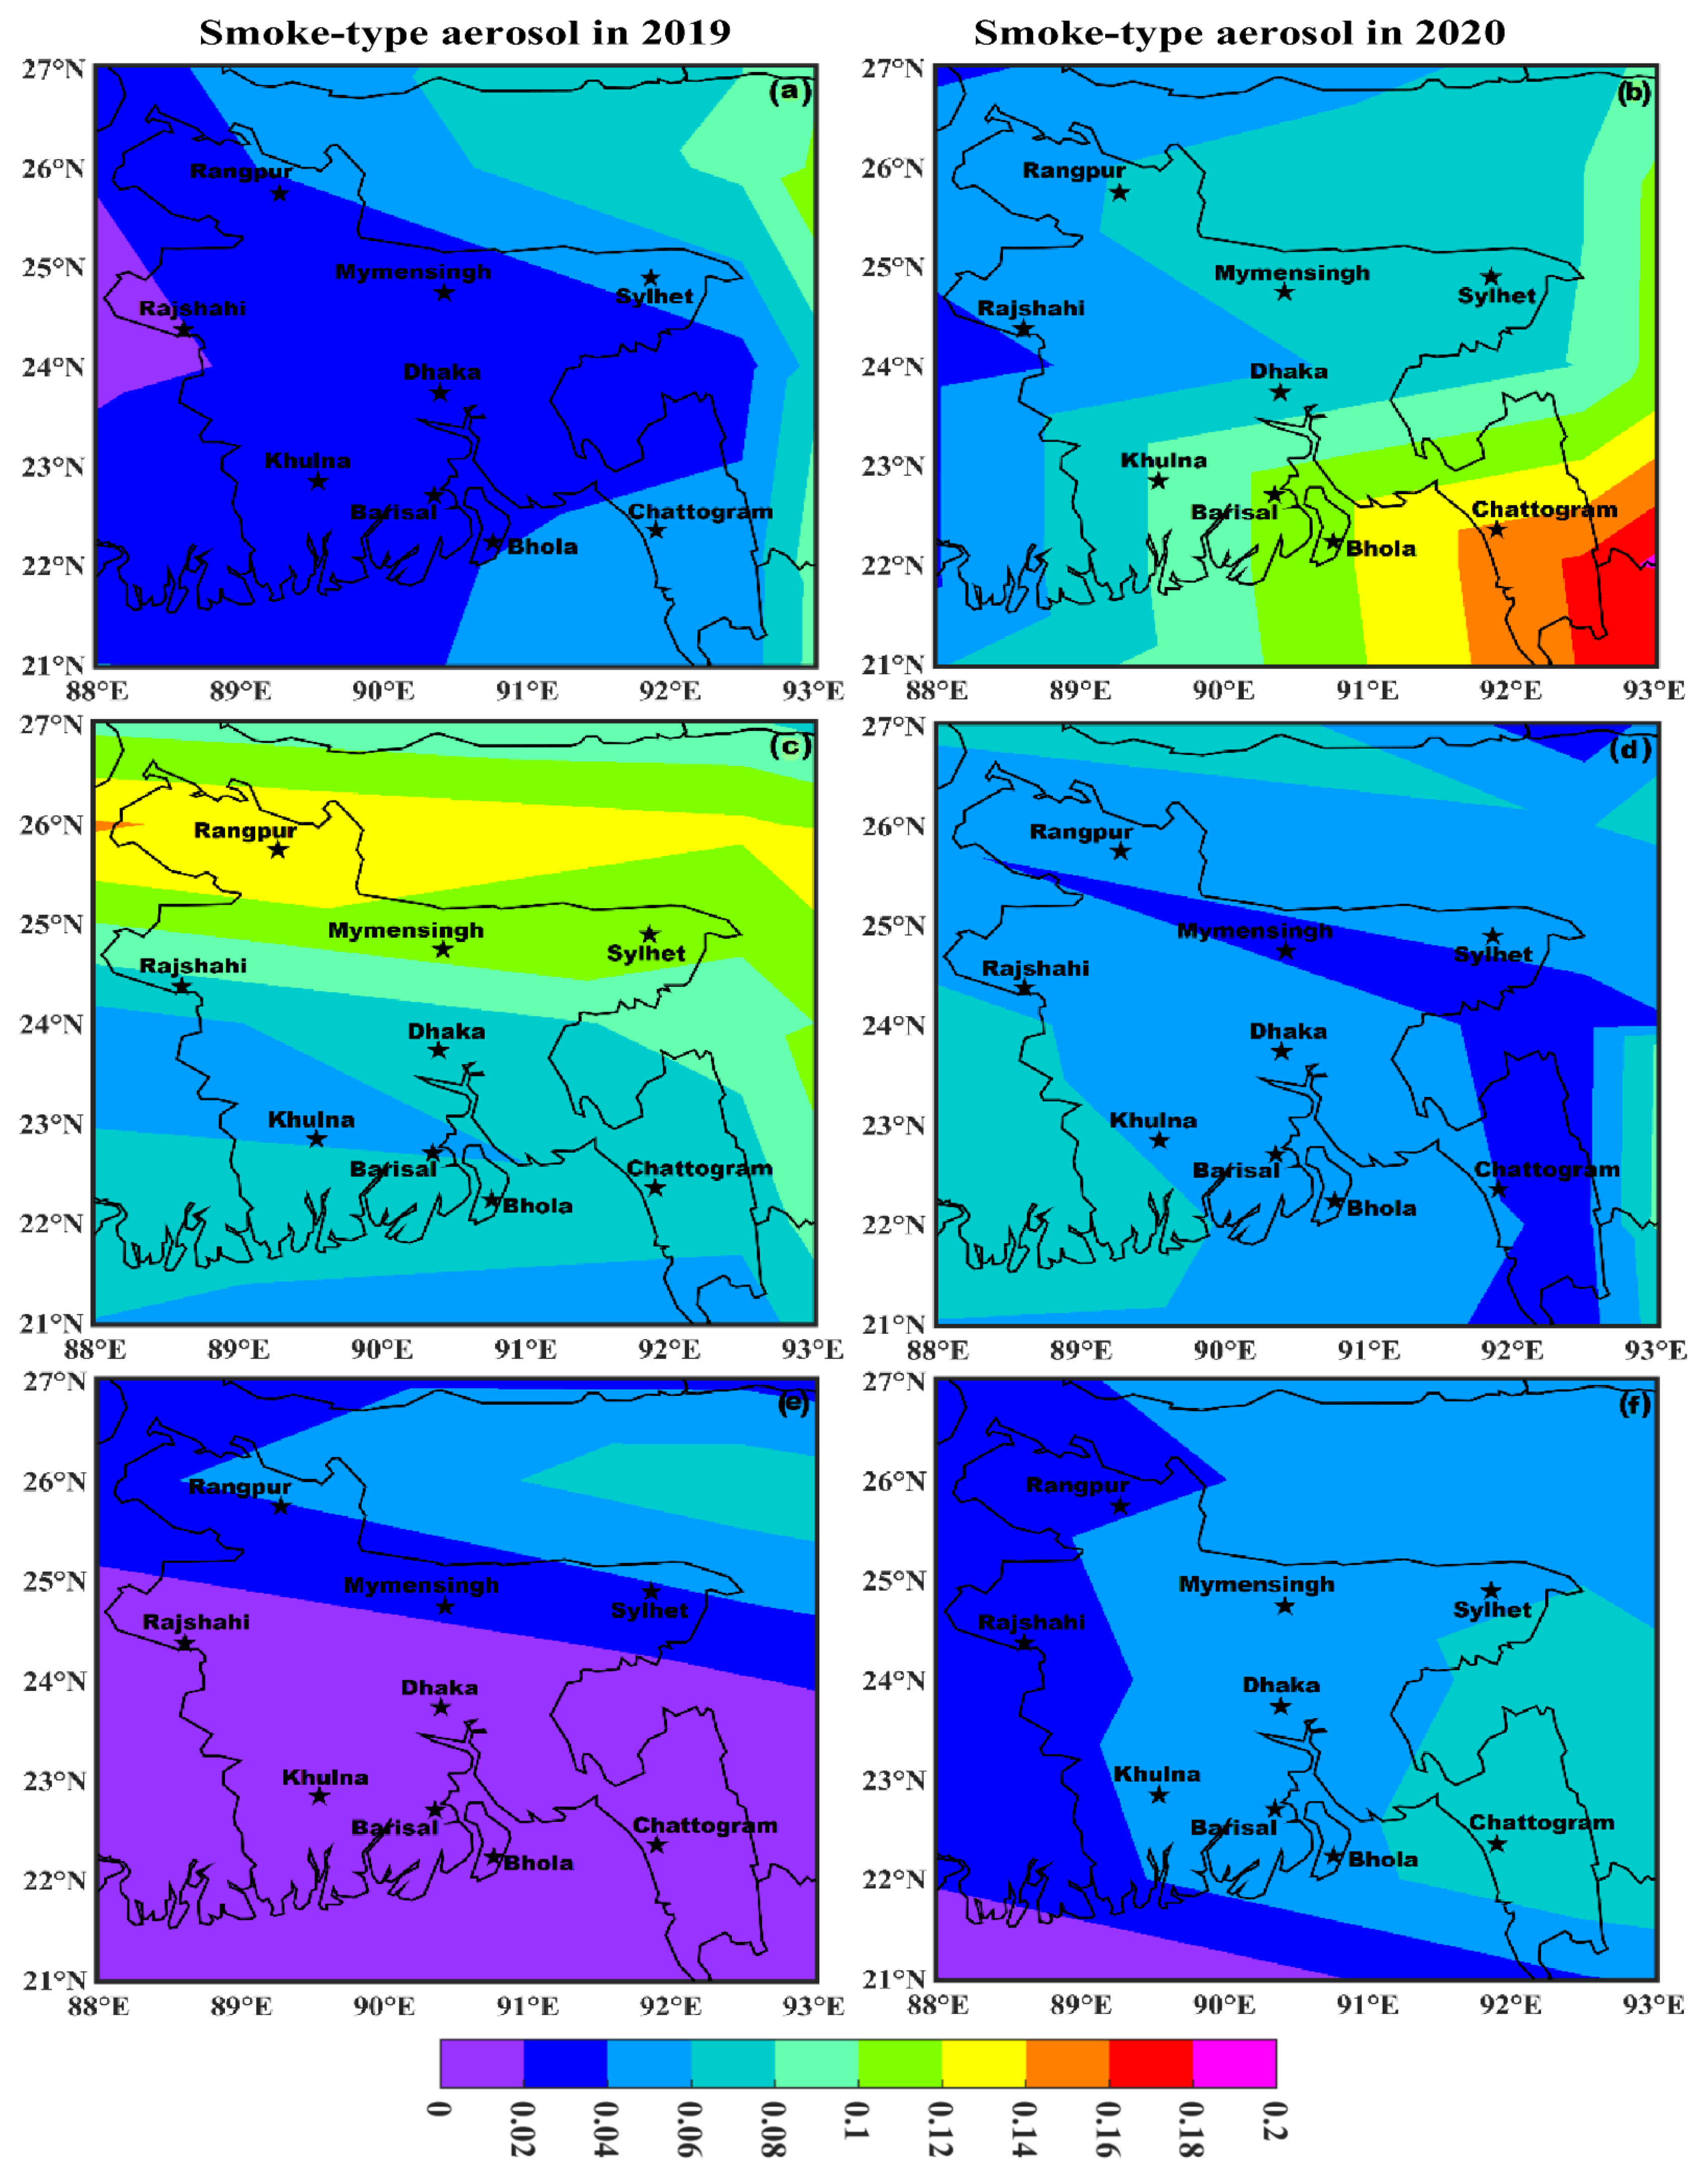
3.4. Changes of Aerosol Subtypes
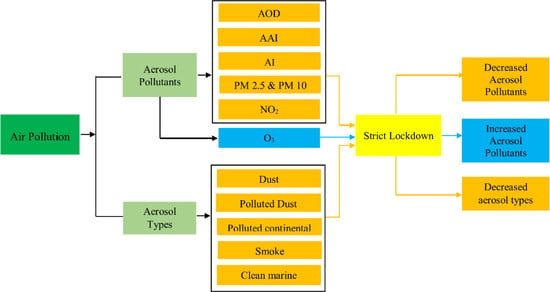
As the aerosol optical properties from the ground-located aerosol robotic network (AERONET) are not available in Bangladesh for classifying aerosol types, the present study used the CALIPSO (daytime) level 1 aerosol subtypes profile (vertical column distribution) to investigate the aerosol types over the study area. Therefore, the CALIPSO aerosol subtype profiles were obtained over different cities of Bangladesh for the available dates, 29 March 2020, 3 and 11 April 2020, 2 and 7 May 2020, and 2 June 2020, respectively. Besides, the study used level 3 CALIPSO-based spatial distribution of aerosol subtype profiles from March to May in 2019 and 2020 to investigate the changes in specific aerosol subtypes during the strict lockdown in major cities of Bangladesh. Results represent aerosol types such as dust, smoke (carbonaceous aerosols), polluted dust (a mixture of dust and smoke), polluted continental, and clean marine, for up to ~5 km from the surface over Bangladesh (Figure 9). Remarkably, the polluted dust-type aerosols were found to dominate throughout the country, compared to dust and smoke-type aerosols (Figure 10, Figure 11, Figure 12, Figure 13, Figure 14 and Figure 15). Similar to what was found for AOD, PM2.5, and PM10, significantly lower levels of dust-type aerosols were also observed in the major cities of Bangladesh during the 2020 strict lockdown (March–May) when compared to 2019 (Figure 10). As expected, the dust-type aerosols decreased by 67% to 95% over most parts of the country during the strict lockdown months of March to May 2020, except for April 2020. However, an increase of 40% to 67% was observed in Mymensingh, Rangpur, and Sylhet (Figure 11). In terms of polluted dust-type aerosols, a substantial decrease of between 8% and 67% was evident during the strict lockdown over most parts of Bangladesh during the strict lockdown months of March and April. A slight increase of 15% was noted in May (Figure 12 and Figure 13). On the other hand, smoke-type aerosols decreased between 17% and 73% over most parts of the country during the 2020 strict lockdown month of April when compared to 2019, but showed surprisingly large increases of 40% and 600% during the 2020 lockdown months of March and May, respectively (Figure 14 and Figure 15). Improper implementation of the strict lockdown allowed some random operation of brick kilns, open burning of solid waste, and agricultural residue, which may explain this increase in smoke-type aerosols. The above indicates that all types of aerosol decreased over the study area because of the effects of lockdown restrictions on local emissions (the low traffic of only emergency vehicles and people’s movements with their activities).

4. Discussion

Through the spatial analysis of air pollution (AOD, PM2.5, PM10, NO2, and O3), the study found that air pollution was impacted by COVID-19 policy interventions. Through time series analysis, the study observed that air pollution (AOD, PM2.5, PM10, and NO2) presented substantial decreases during the strict lockdown throughout the country, while the O3 increased. The observed increase in ozone during the lockdown and a slight decrease during the partial lockdown is thought to be due to a combination of factors. The weather in Bangladesh during the lockdown periods was mostly sunny, resulting in increased ozone formation, but was mostly cloudy during the partial lockdown, which can limit the oxidizing process, resulting in decreased ozone formation. Nichol et al. [33] reported that a combination of several factors might be responsible for the increased production of secondary pollutants (especially ozone). For example, a decrease in NOx results in increased ozone formation, thereby increasing the oxidizing capability of the atmosphere, and allowing the production of secondary pollutants (nitrates, sulfates, and organic compounds) or it could also be a result of the VOC/NOX ratio [51]. The production of secondary pollutants involves condensation around existing particles or new particles, and the resulting particulate compounds comprise mainly sulfates, nitrates, and organic compounds, which are less absorbing in nature. Besides, high relative humidity stimulates the formation of secondary particulates, which are always above 40% over the country (not shown). In addition, it is true that NOx contributes to O3 formation during the day, but this process is not so important in winter. Reduced traffic emissions lead to a decrease in NOx, thus leading to an increase in nighttime NO3 and O3 formation; i.e., the lower NOx concentrations allow O3 to remain in the atmosphere. This increase in atmospheric oxidizing capacity resulted in an increase in the formation of secondary organic and inorganic particulates [52,53].
In contrast, during the partial lockdown, the study found that patterns of air quality parameters (AOD, PM2.5, PM10, and NO2) resulted in both increases and decreases in air pollution levels throughout the country, while O3 showed a slight decrease. This accords with the findings of Zhang et al. [50], who reported that NOx levels were regained in some Chinese provinces due to relaxing of the COVID-19 intervention policies. Along with AOD, PM2.5, PM10, and NO2, the concentrations of CALIPSO-based aerosol types (dust, polluted dust, and smoke) were also reduced due to COVID-19 policy interventions throughout the country. It is therefore concluded that the COVID-19 policy interventions improved the air quality in Bangladesh by reducing the AOD, PM2.5, PM10, and NO2 concentrations, and increasing the O3 in the major cities.

5. Conclusions

The current paper investigated the spatiotemporal fluctuations in air pollution over major cities of Bangladesh from March to June 2019 and 2020, using data from MODIS (AOD), TROPOMI-5P (NO2, O3), and the CAMS model (PM2.5, PM10).
The monthly spatial distributions of AOD, PM2.5, PM10, NO2, and O3 showed significant differences throughout the country during both the 2020 lockdown (March–May) and partial lockdown (June) when compared to the previous year, 2019.
During the 2020 strict lockdown, the monthly time series of AOD and particulate matter (PM2.5, PM10) showed significant variations throughout the country, but overall a significant reduction in aerosol loadings was observed. Furthermore, the NO2 in March 2020 was found to have both decreased (in Rajshahi, Chattogram, Sylhet, Khulna, Barisal, Mymensingh) and increased (in Dhaka, Bhola, and Rangpur). In April it decreased (in Dhaka, Chattogram, Khulna, Barisal, Bhola, and Mymensingh) and increased (in Rajshahi, Rangpur, and Sylhet), while in May it decreased (in Rajshahi, Sylhet, Mymensingh, and Rangpur) and increased (in Dhaka, Chattogram, Khulna, Barisal, and Bhola). On average, O3 increased throughout the country. This decrease and increase in NO2 may be related to lack of implementation of the lockdown or the emissions from essential transportation, controlled industrial activity during the lockdown, natural sources, and meteorological factors, resulting in an increase in NO2 during the strict lockdown.
The 2020 partial lockdown led to a significant increase and decrease in AOD and NO2 except for PM2.5 and PM10 decreased, resulting in a slight reduction in O3 averaged over the country. CALIPSO satellite analysis indicates that the aerosol types in order of magnitude during the study period were polluted dust, dust, and smoke, polluted continental, and clean marine over Bangladesh. However, the strict lockdown led to a substantial decrease in their concentrations.

Author Contributions

Supervision, writing—review & editing, Z.Q.; conceptualization, data curation, methodology, formal analysis, investigation, validation, visualization, writing—original draft, M.A.A.; supervision, investigation, writing—review & editing, J.E.N.; conceptualization, Investigation, visualization, writing—review & editing, M.B.; data curation, formal analysis, investigation, validation, visualization, writing—original draft, P.T.; formal analysis & visualization, B.A.H.; data curation, M.A., S.K.M., U.M., Y.W., S.S., F.M., M.A.R. All authors have read and agreed to the published version of the manuscript.

Funding

This research is supported by the National Key Research and Development Program of China (2016YFC1400901), the Jiangsu Provincial Department of Education for the Special Project of Jiangsu Distinguished Professor (R2018T22), the National Natural Science Foundation of China (Grant No. 41976165), and the Startup Foundation for Introduction Talent of NUIST (2017r107).

Informed Consent Statement

Not Applicable.

Data Availability Statement

Data available on request.

Acknowledgments

The authors are grateful to NASA for providing satellite-based aerosol products, NO2 and O3. We would like to give special thanks to the European Centre for Medium-Range Weather Forecasts (ECWMF) for making CAMS-based particulate matter data available. The 2nd author (Arfan Ali) is highly grateful to the China Scholarship Council (CSC) and NUIST for granting the fellowship and providing the required supports.

Conflicts of Interest

All authors declare that there is not any personal or financial conflict of interest.

References

  1. Chen, H.; Guo, J.; Wang, C.; Luo, F.; Yu, X.; Zhang, W.; Li, J.; Zhao, D.; Xu, D.; Gong, Q.; et al. Clinical Characteristics and Intrauterine Vertical Transmission Potential of COVID-19 Infection in Nine Pregnant Women: A Retrospective Review of Medical Records. Lancet 2020, 395, 809–815. [Google Scholar] [CrossRef] [Green Version]
  2. World Health Organization (WHO). WHO Announces COVID-19 Outbreak a Pandemic. 2020. Available online: http://www.euro.who.int/en/health-topics/health-emergencies/coronavirus-covid-%0A19/news/news/2020/3/who-announces-covid-19-outbreak-a-pandemic (accessed on 15 August 2020).
  3. Worldometer. 2020. Available online: https://www.worldometers.info/coronavirus/?fbclid=IwAR2aGJAnE-24hnddFP2oTJh8ypDVRPEYtKWSmq5OZGpY_n8GseuuhGBUINg (accessed on 16 December 2020).
  4. World Bank. 2020 Global Economic Prospects: June 2020. In the Financial Crisis and the Global South (Issue June). 2020. Available online: https://www.jstor.org/stable/j.ctt183pb3w?turn_away=true (accessed on 15 August 2020).
  5. Anwar, S.; Nasrullah, M.; Hosen, M.J. COVID-19 and Bangladesh: Challenges and How to Address Them. Front. Public Health 2020, 8, 154. [Google Scholar] [CrossRef]
  6. Coronavirus: Bangladesh Declares Public Holiday from March 26 to April 4. Available online: https://www.dhakatribune.com/bangladesh/2020/03/23/govt-offices-to-remain-closed-till-april-4 (accessed on 7 January 2021).
  7. Kumar, P.; Hama, S.; Omidvarborna, H.; Sharma, A.; Sahani, J.; Abhijith, K.V.; Debele, S.E.; Zavala-Reyes, J.C.; Barwise, Y.; Tiwari, A. Temporary Reduction in Fine Particulate Matter Due to ‘Anthropogenic Emissions Switch-off’ during COVID-19 Lockdown in Indian Cities. Sustain. Cities Soc. 2020, 62, 102382. [Google Scholar] [CrossRef]
  8. Begum, B.A.; Hopke, P.K.; Markwitz, A. Air Pollution by Fine Particulate Matter in Bangladesh. Atmospheric Pollut. Res. 2013, 4, 75–86. [Google Scholar] [CrossRef] [Green Version]
  9. Masum, M.H.; Pal, S.K. Statistical Evaluation of Selected Air Quality Parameters Influenced by COVID-19 Lockdown. Glob. J. Environ. Sci. Manag. 2020, 6. [Google Scholar] [CrossRef]
  10. Bulbul, G.; Shahid, I.; Chishtie, F.; Shahid, M.Z.; Hundal, R.A.; Zahra, F.; Shahzad, M.I. PM10 Sampling and AOD Trends during 2016 Winter Fog Season in the Islamabad Region. Aerosol Air Qual. Res. 2018, 18, 188–199. [Google Scholar] [CrossRef] [Green Version]
  11. Shahid, I.; Alvi, M.U.; Shahid, M.Z.; Alam, K.; Chishtie, F. Source Apportionment of PM10 at an Urban Site of a South Asian Mega City. Aerosol Air Qual. Res. 2018, 18, 2498–2509. [Google Scholar] [CrossRef]
  12. Baldasano, J.M. COVID-19 Lockdown Effects on Air Quality by NO2 in the Cities of Barcelona and Madrid (Spain). Sci. Total Environ. 2020, 741, 140353. [Google Scholar] [CrossRef]
  13. Bashir, M.F.; Ma, B.J.; Bilal; Komal, B.; Bashir, M.A.; Farooq, T.H.; Iqbal, N.; Bashir, M. Correlation between Environmental Pollution Indicators and COVID-19 Pandemic: A Brief Study in Californian Context. Environ. Res. 2020, 187, 109652. [Google Scholar] [CrossRef]
  14. Chauhan, A.; Singh, R.P. Decline in PM2.5 Concentrations over Major Cities around the World Associated with COVID-19. Environ. Res. 2020, 187, 109634. [Google Scholar] [CrossRef]
  15. Chen, L.-W.A.; Chien, L.-C.; Li, Y.; Lin, G. Nonuniform Impacts of COVID-19 Lockdown on Air Quality over the United States. Sci. Total Environ. 2020, 745, 141105. [Google Scholar] [CrossRef]
  16. Chen, Q.-X.; Huang, C.-L.; Yuan, Y.; Tan, H.-P. Influence of COVID-19 Event on Air Quality and Their Association in Mainland China. Aerosol Air Qual. Res. 2020, 20, 1541–1551. [Google Scholar] [CrossRef]
  17. Navinya, C.; Patidar, G.; Phuleria, H.C. Examining Effects of the COVID-19 National Lockdown on Ambient Air Quality across Urban India. Aerosol Air Qual. Res. 2020, 20, 1759–1771. [Google Scholar] [CrossRef]
  18. Dantas, G.; Siciliano, B.; França, B.B.; da Silva, C.M.; Arbilla, G. The Impact of COVID-19 Partial Lockdown on the Air Quality of the City of Rio de Janeiro, Brazil. Sci. Total Environ. 2020, 729, 139085. [Google Scholar] [CrossRef] [PubMed]
  19. He, G.; Pan, Y.; Tanaka, T. The Short-Term Impacts of COVID-19 Lockdown on Urban Air Pollution in China. Nat. Sustain. 2020, 3, 1005–1011. [Google Scholar] [CrossRef]
  20. Li, H.; Xu, X.-L.; Dai, D.-W.; Huang, Z.-Y.; Ma, Z.; Guan, Y.-J. Air Pollution and Temperature Are Associated with Increased COVID-19 Incidence: A Time Series Study. Int. J. Infect. Dis. 2020, 97, 278–282. [Google Scholar] [CrossRef]
  21. Mahato, S.; Pal, S.; Ghosh, K.G. Effect of Lockdown amid COVID-19 Pandemic on Air Quality of the Megacity Delhi, India. Sci. Total Environ. 2020, 730, 139086. [Google Scholar] [CrossRef]
  22. Sharma, S.; Zhang, M.; Anshika; Gao, J.; Zhang, H.; Kota, S.H. Effect of Restricted Emissions during COVID-19 on Air Quality in India. Sci. Total Environ. 2020, 728, 138878. [Google Scholar] [CrossRef]
  23. Sicard, P.; De Marco, A.; Agathokleous, E.; Feng, Z.; Xu, X.; Paoletti, E.; Rodriguez, J.J.D.; Calatayud, V. Amplified Ozone Pollution in Cities during the COVID-19 Lockdown. Sci. Total Environ. 2020, 735, 139542. [Google Scholar] [CrossRef]
  24. Islam, M.d.S.; Chowdhury, T.A. Effect of COVID-19 Pandemic Induced Lockdown (General Holiday) on Air Quality of Dhaka City. Res. Sq. J. 2020. in Review. [Google Scholar]
  25. Alam, M.S.; Alam, M.Z.; Nazir, K.N.H.; Bhuiyan, M.A.B. The Emergence of Novel Coronavirus Disease (COVID-19) in Bangladesh: Present Status, Challenges, and Future Management. J. Adv. Vet. Anim. Res. 2020, 7, 198–208. [Google Scholar] [CrossRef]
  26. Islam, M.S.; Tusher, T.R.; Roy, S.; Rahman, M. Impacts of Nationwide Lockdown Due to COVID-19 Outbreak on Air Quality in Bangladesh: A Spatiotemporal Analysis. Air Qual. Atmos. Health 2020. [Google Scholar] [CrossRef]
  27. Shammi, M.; Bodrud-Doza, M.; Islam, A.R.M.T.; Rahman, M.M. COVID-19 Pandemic, Socioeconomic Crisis and Human Stress in Resource-Limited Settings: A Case from Bangladesh. Heliyon 2020, 6, e04063. [Google Scholar] [CrossRef] [PubMed]
  28. Emberson, L.D.; Büker, P.; Ashmore, M.R.; Mills, G.; Jackson, L.S.; Agrawal, M.; Atikuzzaman, M.D.; Cinderby, S.; Engardt, M.; Jamir, C.; et al. A Comparison of North American and Asian Exposure–Response Data for Ozone Effects on Crop Yields. Atmos. Environ. 2009, 43, 1945–1953. [Google Scholar] [CrossRef]
  29. Mahmood, S.A.I. Air Pollution Kills 15,000 Bangladeshis Each Year: The Role of Public Administration and Governments In-tegrity. J. Public Adm. Policy Res. 2011, 3, 129–140. [Google Scholar]
  30. Ahaduzzaman; Sarkar, P.; Anjum, A.; Khan, E.A. Overview of Major Industries in Bangladesh. J. Chem. Eng. 2017, 30, 51–58. [Google Scholar] [CrossRef] [Green Version]
  31. Tusher, T.R.; Akter, S.; Ashraf, Z.; Kabir, M.H.; Siddiqui, M.N. Phytomonitoring of brick kiln induced air pollution at konabari of bangladesh. Malays. J. Sci. 2018, 37, 50–69. [Google Scholar] [CrossRef] [Green Version]
  32. Mamun, M.I. The Seasonal Variability of Aerosol Optical Depth over Bangladesh Based on Satellite Data and HYSPLIT Model. Am. J. Remote Sens. 2014, 2, 20. [Google Scholar] [CrossRef] [Green Version]
  33. Nichol, J.E.; Bilal, M.; Ali, A.M.; Qiu, Z. Air Pollution Scenario over China during COVID-19. Remote Sens. 2020, 12, 2100. [Google Scholar] [CrossRef]
  34. Ali, M.A.; Islam, M.M.; Islam, M.N.; Almazroui, M. Investigations of MODIS AOD and Cloud Properties with CERES Sensor Based Net Cloud Radiative Effect and a NOAA HYSPLIT Model over Bangladesh for the Period 2001–2016. Atmos. Res. 2019, 215, 268–283. [Google Scholar] [CrossRef]
  35. Ali, M.A.; Nichol, J.E.; Bilal, M.; Qiu, Z.; Mazhar, U.; Wahiduzzaman, M.; Almazroui, M.; Islam, M.N. Classification of Aerosols over Saudi Arabia from 2004–2016. Atmos. Environ. 2020, 241, 117785. [Google Scholar] [CrossRef]
  36. Ali, M.A.; Assiri, M. Analysis of AOD from MODIS-Merged DT–DB Products Over the Arabian Peninsula. Earth Syst. Environ. 2019, 3, 625–636. [Google Scholar] [CrossRef]
  37. Islam, M.N.; Ali, M.A.; Islam, M.M. Spatiotemporal Investigations of Aerosol Optical Properties Over Bangladesh for the Period 2002–2016. Earth Syst. Environ. 2019, 3, 563–573. [Google Scholar] [CrossRef]
  38. Omar, A.H. Development of Global Aerosol Models Using Cluster Analysis of Aerosol Robotic Network (AERONET) Meas-urements. J. Geophys. Res. 2005, 110, D10S14. [Google Scholar] [CrossRef]
  39. Omar, A.H.; Winker, D.M.; Vaughan, M.A.; Hu, Y.; Trepte, C.R.; Ferrare, R.A.; Lee, K.-P.; Hostetler, C.A.; Kittaka, C.; Rogers, R.R.; et al. The CALIPSO Automated Aerosol Classification and Lidar Ratio Selection Algorithm. J. Atmos. Ocean. Technol. 2009, 26, 1994–2014. [Google Scholar] [CrossRef]
  40. Su, B.; Li, H.; Zhang, M.; Bilal, M.; Wang, M.; Atique, L.; Zhang, Z.; Zhang, C.; Han, G.; Qiu, Z.; et al. Optical and Physical Characteristics of Aerosol Vertical Layers over Northeastern China. Atmosphere 2020, 11, 501. [Google Scholar] [CrossRef]
  41. Kim, M.-H.; Omar, A.H.; Tackett, J.L.; Vaughan, M.A.; Winker, D.M.; Trepte, C.R.; Hu, Y.; Liu, Z.; Poole, L.R.; Pitts, M.C.; et al. The CALIPSO Version 4 Automated Aerosol Classification and Lidar Ratio Selection Algorithm. Atmos. Meas. Tech. 2018, 11, 6107–6135. [Google Scholar] [CrossRef] [Green Version]
  42. Borro, M.; Di Girolamo, P.; Gentile, G.; De Luca, O.; Preissner, R.; Marcolongo, A.; Ferracuti, S.; Simmaco, M. Evidence-Based Considerations Exploring Relations between SARS-CoV-2 Pandemic and Air Pollution: Involvement of PM2.5-Mediated Up-Regulation of the Viral Receptor ACE-2. Int. J. Environ. Res. Public. Health 2020, 17, 5573. [Google Scholar] [CrossRef] [PubMed]
  43. Inness, A.; Ades, M.; Agustí-Panareda, A.; Barré, J.; Benedictow, A.; Blechschmidt, A.-M.; Dominguez, J.J.; Engelen, R.; Eskes, H.; Flemming, J.; et al. The CAMS Reanalysis of Atmospheric Composition. Atmospheric Chem. Phys. 2019, 19, 3515–3556. [Google Scholar] [CrossRef] [Green Version]
  44. Veefkind, J.P.; Aben, I.; McMullan, K.; Förster, H.; de Vries, J.; Otter, G.; Claas, J.; Eskes, H.J.; de Haan, J.F.; Kleipool, Q.; et al. TROPOMI on the ESA Sentinel-5 Precursor: A GMES Mission for Global Observations of the Atmospheric Composition for Climate, Air Quality and Ozone Layer Applications. Remote Sens. Environ. 2012, 120, 70–83. [Google Scholar] [CrossRef]
  45. Ialongo, I.; Virta, H.; Eskes, H.; Hovila, J.; Douros, J. Comparison of TROPOMI/Sentinel-5 Precursor NO2 Observations with Ground-Based Measurements in Helsinki. Atmos. Meas. Tech. 2020, 13, 205–218. [Google Scholar] [CrossRef] [Green Version]
  46. Rahman, M.O.; Roksana, K.; Mukit, M.; Rahaman, M.M. Spatial and temporal trends of air quality around Dhaka city: A GIS approach. Adv. Appl. Sci. Res. 2020, 4, 1–6. [Google Scholar]
  47. Fan, C.; Li, Z.; Li, Y.; Dong, J.; van der A, R.; de Leeuw, G. Does reduction of emissions imply improved air quality? Atmos. Chem. Phys. Discuss 2020. in review. [Google Scholar] [CrossRef]
  48. Ranjan, A.K.; Patra, A.K.; Gorai, A.K. Effect of Lockdown Due to SARS COVID-19 on Aerosol Optical Depth (AOD) over Urban and Mining Regions in India. Sci. Total Environ. 2020, 745, 141024. [Google Scholar] [CrossRef] [PubMed]
  49. Dumka, U.C.; Tiwari, S.; Kaskaoutis, D.G.; Soni, V.K.; Safai, P.D.; Attri, S.D. Aerosol and Pollutant Characteristics in Delhi during a Winter Research Campaign. Environ. Sci. Pollut. Res. 2019, 26, 3771–3794. [Google Scholar] [CrossRef] [PubMed]
  50. Zhang, R.; Zhang, Y.; Lin, H.; Feng, X.; Fu, T.-M.; Wang, Y. NOx Emission Reduction and Recovery during COVID-19 in East China. Atmosphere 2020, 11, 433. [Google Scholar] [CrossRef] [Green Version]
  51. Sillman, S.; Logan, J.; and Wofsy, S. The Sensitivity of Ozone to Nitrogen oxides and Hydrocarbons in Regional Ozone Episodes. J. Geophys. Res. 1990, 95, 1837–1851. [Google Scholar] [CrossRef]
  52. Huang, X.; Ding, A.; Gao, J.; Zheng, B.; Zhou, D.; Qi, X.; Tang, R.; Wang, J.; Ren, C.; Nie, W.; et al. Enhanced secondary pollution offset reduction of primary emissions during COVID-19 lockdown in China. Natl. Sci. Rev. 2021, 8, nwaa137. [Google Scholar] [CrossRef]
  53. Lee, J.D.; Drysdale, W.S.; Finch, D.P.; Wilde, S.E.; Palmer, P.I. UK surface NO2 levels dropped by 42% during the Covid 19 lockdown: Impact on surface O3. Atmos. Chem. Phys. 2020, 20, 15743–15759. [Google Scholar] [CrossRef]
Figure 1. Map of Bangladesh with major industries located in different cities (adapted from Banglapedia, URL: http://en.banglapedia.org/index.php/Industrialisation#/media/File:Industry.jpg; accessed on 25 February 2021); (a) is a map of major industries and (b) a map of Bangladesh with major divisions with red circles showing the major cities or divisional cities in Bangladesh, with industries. Boxes indicate major industries located in Dhaka, Chattogram, Rajshahi, Khulna, Barisal, and Sylhet.
Remotesensing 13 00877 g001aRemotesensing 13 00877 g001b
Figure 2. Terra (Column 1–2) and Aqua (Column 3–4) Moderate Resolution Imaging Spectroradiometer (MODIS) DTB monthly AOD at 550 nm in major cities of Bangladesh from March–June in 2019 and 2020. Monthly averages were obtained from all available pixels over the month and blank areas represent no data.
Remotesensing 13 00877 g002
Figure 3. Temporal changes in MODIS DTB-based monthly AOD (550 nm) obtained from Terra (Column 1–2) and Aqua (Column 3–4) in major cities of Bangladesh from March–June in 2019 and 2020.
Remotesensing 13 00877 g003
Figure 4. CAMS monthly PM2.5 (Column 1–2) and PM10 (Column 3–4) in major cities of Bangladesh from March–June 2019 and 2020. Monthly averages as obtained from all available pixels over the month. Unit of PM2.5 and PM10 is μg/m3.
Remotesensing 13 00877 g004
Figure 5. Temporal changes in monthly CAMS-based PM2.5 (Column 1–2) and PM10 (Column 3–4) in major cities of Bangladesh from March–June 2019 and 2020.
Remotesensing 13 00877 g005
Figure 6. Temporal changes in monthly ratios of PM2.5/PM10 in major cities of Bangladesh from March–June 2019 and 2020.
Remotesensing 13 00877 g006
Figure 7. Sentinel-5P onboard TROPOMI-based monthly NO2 (Column 1–2) and O3 (Column 3–4) in major cities of Bangladesh from March–June 2019 and 2020. Monthly averages as obtained from all available pixels over the month. The unit of NO2 and O3 is 1015 molec/cm2.
Remotesensing 13 00877 g007
Figure 8. Temporal changes in monthly NO2 (Column 1–2) and O3 (Column 3–4) from TROPOMI-5P in major cities of Bangladesh from March–June 2019 and 2020.
Remotesensing 13 00877 g008
Figure 9. CALIPSO-derived aerosol subtypes over the major cities of Bangladesh from March to June 2020. N/A = not applicable, 1 = clean marine, 2 = dust, 3 = polluted continental, 4 = clean continental, 5 = polluted dust, 6 = smoke.
Remotesensing 13 00877 g009aRemotesensing 13 00877 g009b
Figure 10. CALIPSO-derived Dust-type aerosol over major cities of Bangladesh from March to May in 2019 and 2020.
Remotesensing 13 00877 g010
Figure 11. Temporal changes of CALIPSO-derived dust-type aerosol over major cities of Bangladesh from March to May in 2019 and 2020.
Remotesensing 13 00877 g011
Figure 12. CALIPSO-derived polluted dust-type aerosol over major cities of Bangladesh from March to May in 2019 and 2020.
Remotesensing 13 00877 g012
Figure 13. Temporal changes of CALIPSO-derived polluted dust-type aerosol over major cities of Bangladesh from March to May in 2019 and 2020.
Remotesensing 13 00877 g013
Figure 14. CALIPSO-derived smoke-type aerosol over major cities of Bangladesh from March to May 2019 and 2020.
Remotesensing 13 00877 g014
Figure 15. Temporal changes of CALIPSO-derived smoke-type aerosol over major cities of Bangladesh from March to May 2019 and 2020.
Remotesensing 13 00877 g015
Publisher’s Note: MDPI stays neutral with regard to jurisdictional claims in published maps and institutional affiliations.

