Article

Spatiotemporal Evolution of Fractional Vegetation Cover and Its Response to Climate Change Based on MODIS Data in the Subtropical Region of China

1
State Key Laboratory of Subtropical Silviculture, Zhejiang A & F University, Hangzhou 311300, China
2
Key Laboratory of Carbon Cycling in Forest Ecosystems and Carbon Sequestration of Zhejiang Province, Zhejiang A & F University, Hangzhou 311300, China
3
School of Environmental and Resources Science, Zhejiang A & F University, Hangzhou 311300, China
4
The College of Forestry, Beijing Forestry University, Beijing 100083, China
*
Author to whom correspondence should be addressed.
Remote Sens. 2021, 13(5), 913; https://doi.org/10.3390/rs13050913
Submission received: 29 January 2021 / Revised: 23 February 2021 / Accepted: 25 February 2021 / Published: 28 February 2021

Abstract

:
The subtropical vegetation plays an important role in maintaining the structure and function of global ecosystems, and its contribution to the global carbon balance are receiving increasing attention. The fractional vegetation cover (FVC) as an important indicator for monitoring environment change, is widely used to analyze the spatiotemporal pattern of regional and even global vegetation. China is an important distribution area of subtropical vegetation. Therefore, we first used the dimidiate pixel model to extract the subtropical FVC of China during 2001–2018 based on MODIS land surface reflectance data, and then used the linear regression analysis and the variation coefficient to explore its spatiotemporal variations characteristics. Finally, the partial correlation analysis and the partial derivative model were used to analyze the influences and contributions of climate factors on FVC, respectively. The results showed that (1) the subtropical FVC had obvious spatiotemporal heterogeneity; the FVC high-coverage and medium-coverage zones were concentratedly and their combined area accounted for more than 70% of the total study area. (2) The interannual variation in the average subtropical FVC from 2001 to 2018 showed a significant growth trend. (3) In 76.28% of the study area, the regional FVC showed an increasing trend, and the remaining regional FVC showed a decreasing trend. However, the overall fluctuations in the FVC (increasing or decreasing) in the region were relatively stable. (4) The influences of climate factors to the FVC exhibited obvious spatial differences. More than half of all pixels exhibited the influence of the average annual minimum temperature and the annual precipitation had positive on FVC, while the average annual maximum temperature had negative on FVC. (5) The contributions of climate changes to FVC had obvious heterogeneity, and the average annual minimum temperature was the main contribution factor affecting the dynamic variations of FVC.

1. Introduction

The fractional vegetation cover (FVC) refers to the ratio of the vertical projection area of vegetation (including leaves, stems and branches) on the ground to the entire study area [1,2]; it is not only an important parameter reflecting the growth and distribution characteristics of surface vegetation [3] but also an important basic data describing the condition of the ecosystem [4]. As an important part of the ecosystem [1,5], vegetation plays a crucial role in ecosystem energy and material exchange processes. Climate change, the main feature of which is global warming, has now become an internationally recognized fact [6,7]. Climate change has triggered a series of global-scale environmental problems, such as global warming, ecosystem degradation, and desertification, which have had a great impact on the growth, distribution, and succession patterns of vegetation [8,9,10] and are also a major challenge to global sustainable development [11,12]. The total amount of net ecosystem productivity (NEP) in subtropical forests in the East Asian monsoon region is approximately 720 million tons of carbon per year, accounting for approximately 8% of the global NEP; this statistic challenges the traditional belief that temperate forests in Europe and America are the main carbon sink functional areas in the past [13,14,15]. The total carbon storage of forest vegetation in the subtropical evergreen broad-leaved forest and mixed broadleaf-conifer forest operating areas in southern China is 2.527 billion tons, accounting for approximately 30% of the total carbon storage of forest vegetation in the country. The vegetation in the region plays an important role in maintaining the structure and function of the regional ecosystem. Therefore, studying and analyzing the characteristics of the temporal and spatial dynamic variations in FVC in this subtropical region and exploring the correlations between FVC and climate factors are of great scientific significance for revealing the temporal and spatial evolution patterns of subtropical vegetation in China and evaluating the ability of vegetation to adapt and respond to climate change.
Remote sensing technology provides accurate real-time data, wide coverage, high continuity, comprehensiveness, and other beneficial features. Based on remote sensing technology to monitor spatiotemporal variations and phenological of vegetation in a large area, as well as vegetation productivity estimation has now become the main trend in the FVC research field [16]. Using vegetation index (VI), such as the normalized difference vegetation index (NDVI), the enhanced vegetation index (EVI), the difference vegetation index (DVI), the ratio vegetation index (RVI), etc., to estimate FVC is one of the more practical methods among the many remote sensing estimation methods [17]. For example, Zhao et al. [18] used NDVI to estimate the FVC of the Qinling Mountains from 2000 to 2016; Zhang et al. [19] used EVI to obtain the FVC in the mountain area of Longnan from 2000 to 2010. NDVI proposed by Rouse et al. [20] is very sensitive to the growth state and spatial distribution characteristics of vegetation [21], can to a great extent eliminate interference from instruments, topography, atmosphere, etc., and has a significant linear correlation with FVC [3,22,23,24]. NDVI has obvious advantages in large-scale vegetation dynamic monitoring and other aspects [25], which is currently the most widely used VI [22,26,27,28]. The dimidiate pixel model based on NDVI is insensitive to the effects of image radiometric correction, does not require actual FVC data modeling, requires only simple calculations and is easy to interpret [4,29,30,31]. It is currently commonly used to effectively estimate the FVC at large and even global scales. For example, Dong et al. [32] used the dimidiate pixel model based on NDVI to calculate and analyze the FVC of the Hotan Oasis, as well as its temporal and spatial variation characteristics. Li et al. [33] used Moderate Resolution Imaging Spectroradiometer (MODIS)-NDVI remote sensing data in combination with the dimidiate pixel model to calculate the FVC from 2001 to 2015 on the northern slope of the Tianshan Mountains and analyzed its response to climatic drought at different scales. Based on NDVI, Gan et al. [34] estimated the FVC of the Lian jiang River watershed over the past 18 years by using the dimidiate pixel model and analyzed its relationship with climate, geological structure, and other factors.
Climate factors are the dominant factors affecting surface vegetation coverage situation [35,36]; especially changes in temperature and precipitation [37,38,39,40] which will directly affect vegetative photosynthesis, respiration and soil organic carbon decomposition etc., and then affect the growth distribution and evolution patterns of vegetation [41,42]. There are currently many studies on the relationship between climate change and FVC; for example, Sheng et al. [43] discussed the temporal and spatial variation patterns and correlations of FVC under the influence of different climate factors and their mutations in the Wuyi Mountains National Nature Reserve from 1975 to 2016; Zhang et al. [44] analyzed the relationship between FVC and temperature and precipitation at different time scales by using regression analysis methods in Guangxi from 2006 to 2016; Zhou et al. [45] analyzed the impact of climate factors on FVC in the Beijing–Tianjin–Hebei region from 2001 to 2011 and showed that precipitation had the greatest impact on FVC in the core area of Beijing–Tianjin–Hebei. Previous studies have shown that there is a strong correlation between FVC variation and climate factors, and the response of FVC variation to climate change has obvious spatial differences. Precipitation is abundant in the subtropical region of China, but the distribution of annual precipitation has obvious internal differences within the region, and the annual precipitation decreases from the southeast coast to the northwest inland. The annual temperature spatial difference in the subtropical region is large, and the temperature rises from high latitude to low latitude. However, few studies have described the mechanism by which climate change impacts FVC in the subtropical region.
The role of subtropical vegetation in regional ecosystems has been increasingly emphasized. The subtropical region of China has complex, diverse, and widely distributed vegetation that grows year-round, and it is China’s main agricultural and forestry production base. At the same time, there are also prominent problems in the region, such as poor forest quality and low forest productivity and yield rates. Moreover, subtropical forest vegetation and its ecological functions are very sensitive to global climate change. Therefore, we first calculated the FVC in the subtropical region of China using the dimidiate pixel model base on MODIS land surface reflectance data from 2001 to 2018, and then the spatiotemporal evolution characteristics of FVC and the influence and contribution of climate factors to the FVC were analyzed. The objectives of this study include (1) to reveal the spatiotemporal variation characteristics of subtropical FVC in the past 20 years; (2) to explore the driving influence and relative contribution of climate change on FVC in the subtropical region. The results of this study will provide a theoretical and temporal reference for the evaluation of ecological functions such as the sustainable management of subtropical vegetation and productivity.

2. Materials and Methods
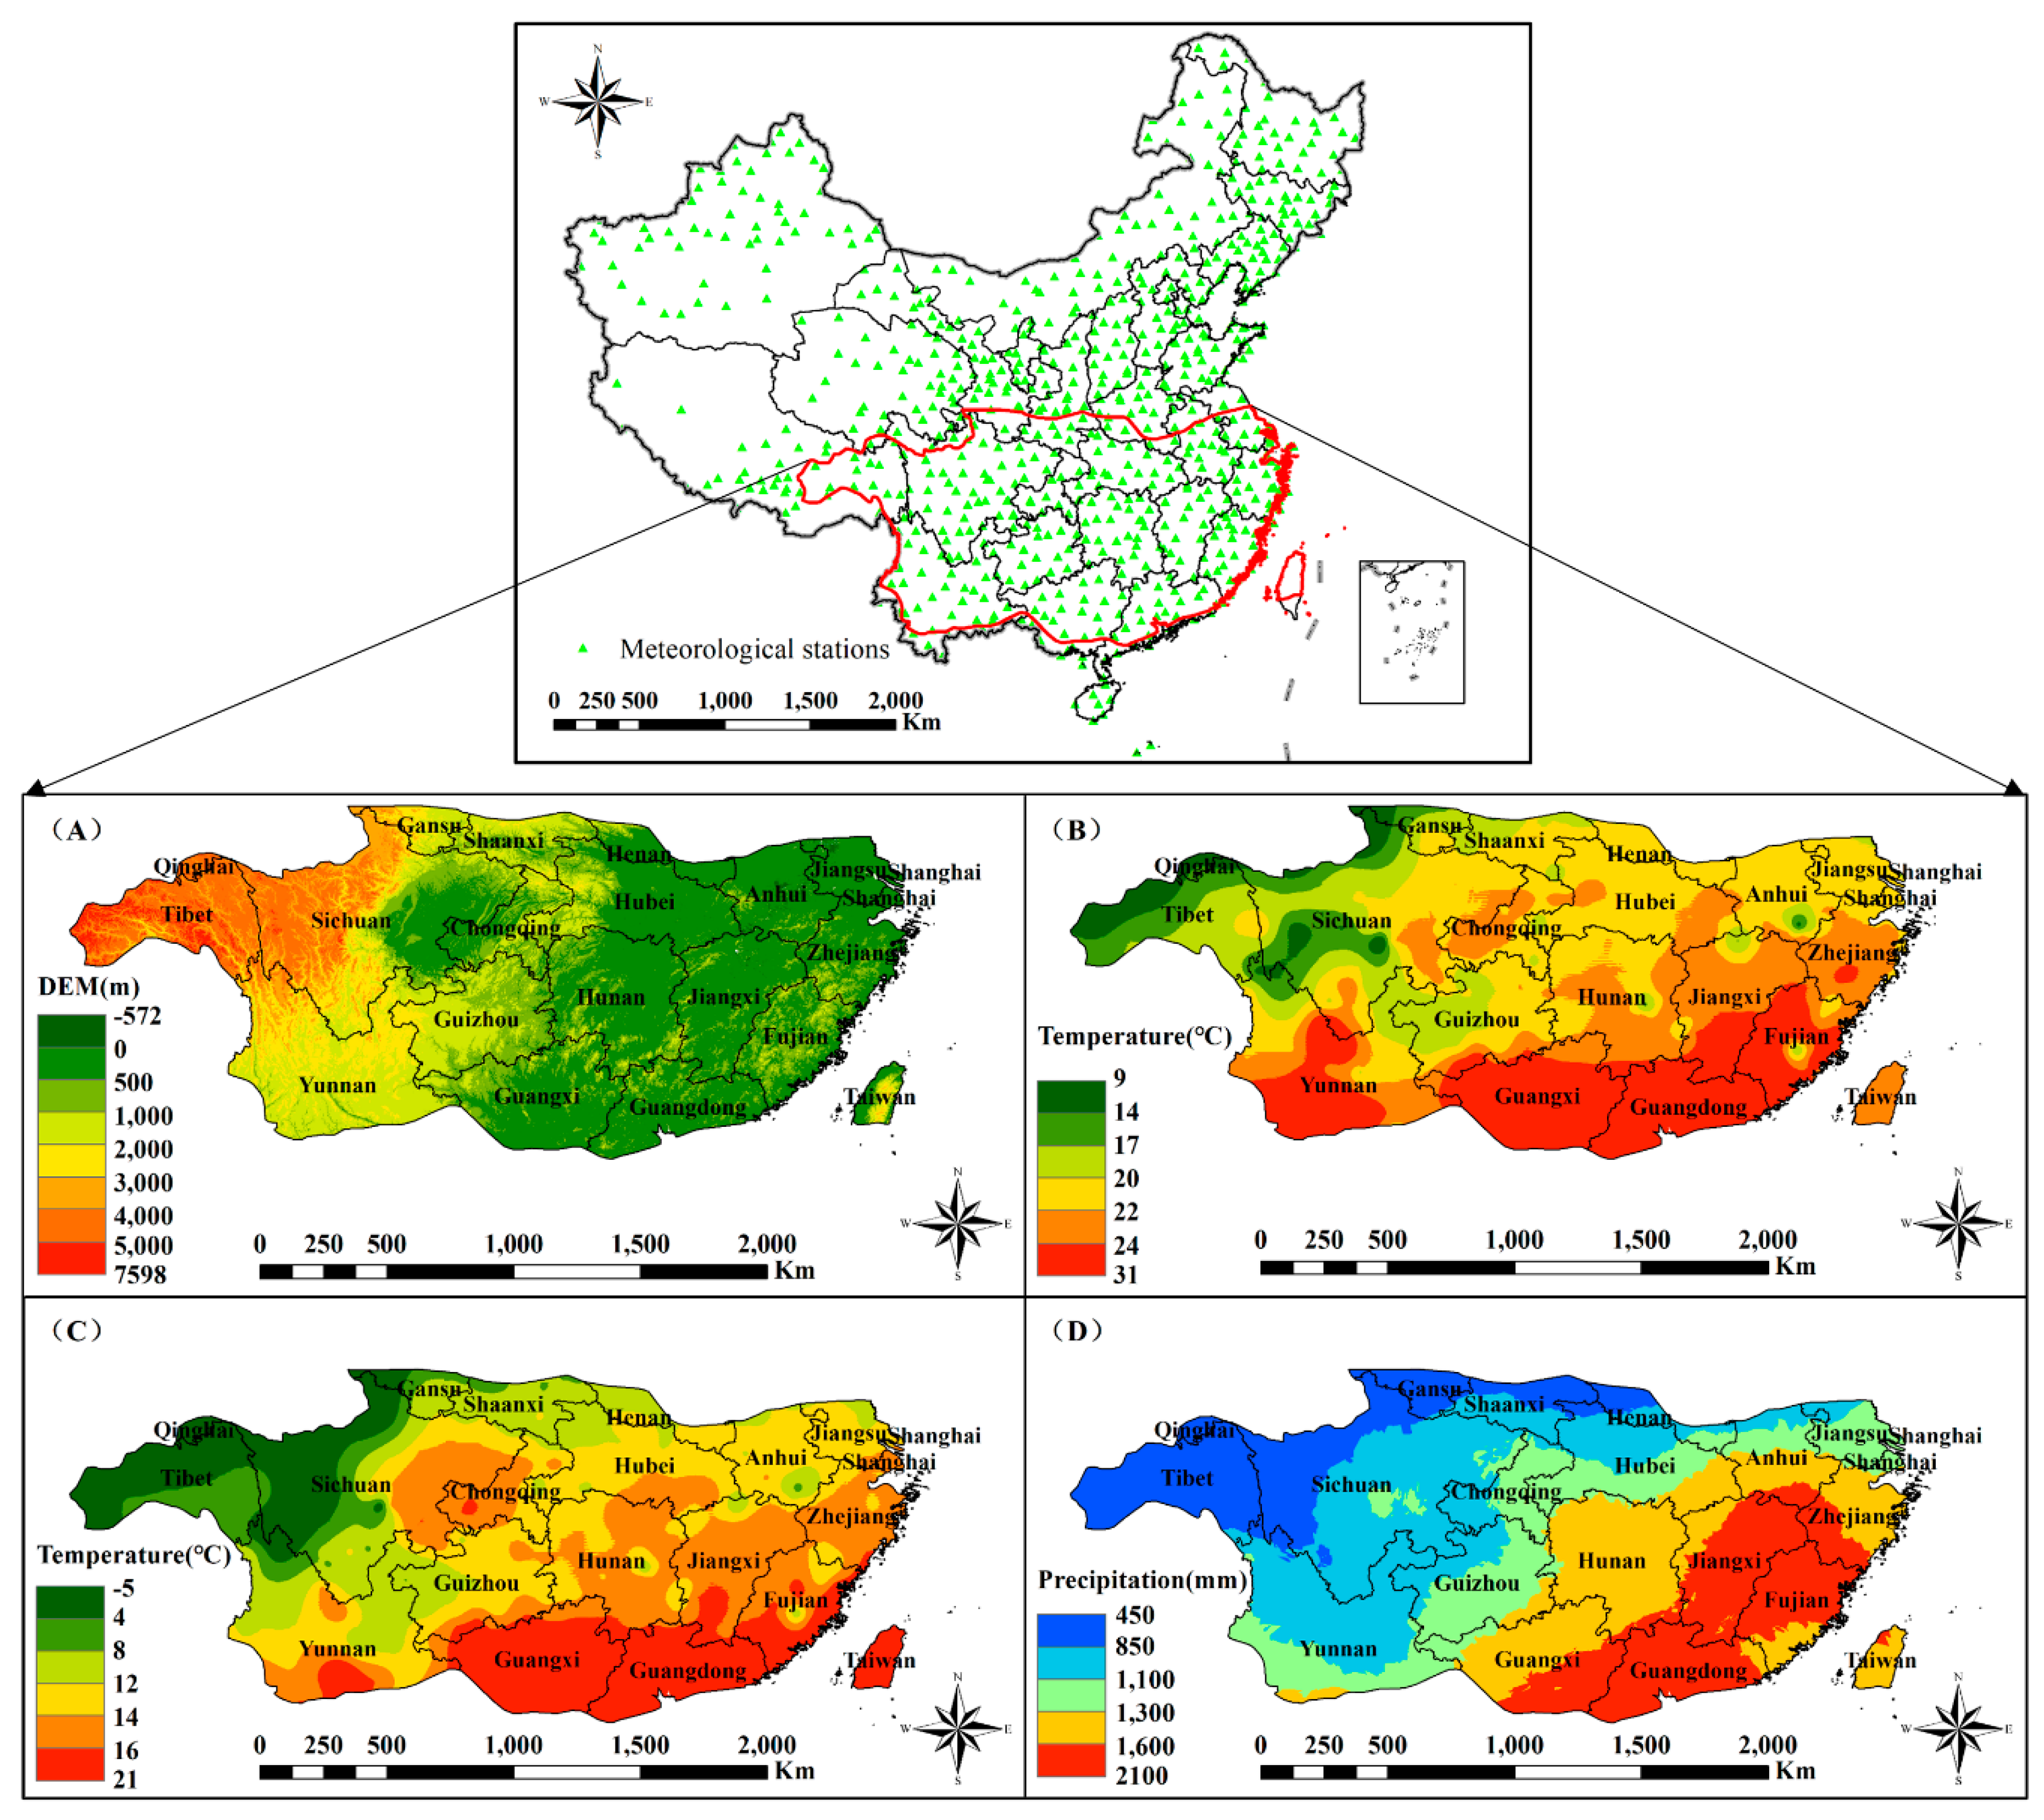
2.1. Study Area

The subtropical region of China is located between 25° N–35° N latitude and includes a vast area that makes up approximately a quarter of the total area of China. The subtropical region includes the large area south of the Qinling Mountains and the Huai River, north of the Leizhou Peninsula and east of the Hengduan Mountains and includes 20 provinces and cities (Figure 1). This region has rolling mountains and vertical and horizontal gullies. It is part of the east coast humid monsoon area and experiences high temperatures and rain in summer and low temperatures and little rain in winter. From 2001 to 2018, the average annual maximum temperature (Tmax) was between 20.29 °C and 21.53 °C, and the average annual minimum temperature (Tmin) was between 11.19 °C and 12.09 °C in the region; in terms of spatial distribution the temperature in the southeast is higher than that in the northwest (Figure 1B,C). The annual precipitation (Pre) in the subtropical region from 2001 to 2018 was in the range of 804.77 mm–1236.27 mm, with an average precipitation of 1015.47 mm, and showed an overall distribution pattern decreasing from the southeast to the northwest (Figure 1D). Light, heat, and water resources are plentiful in the subtropical region of China, which is rich in species and includes many diverse vegetation types [46], and evergreen broad-leaved forests are the main body of forest biodiversity [47].

2.2. Data Acquisition and Preprocessing

The 2001–2018 MODIS land surface reflectance data used in this study came from the Terra satellite of the United States Earth Observation System (EOS) and have a temporal resolution of 8 days and a spatial resolution of 500 m. Applied MODIS Reprojection Tools (MRT) software was used to process the downloaded original MOD09A1 data products through batch image stitching, projection transformation, data format conversion, and other processes.
The near-infrared band (Band2) and visible light band (Band1) in the MODIS land surface reflectance data were used to calculate the NDVI values in the subtropical region for each year from 2001 to 2018. Because reflectance data are affected by the atmosphere, ice/snow, the sensor and other factors, problems such as outliers in the NDVI time series data are likely to occur [4]. Therefore, Savitzky-Golay (S-G) filtering method [4,48,49] was adopted in this study to smooth the NDVI time series data and eliminate outliers in the NDVI time series data. To more reasonably reflect the vegetation cover situation in the subtropical region with in a year and to calculate the FVC, this study used maximum value composites (MVC) to synthesize the NDVI at 46 temporal per year to further eliminate interference from clouds, the atmosphere, the solar elevation angle, phenology, and other factors [16,37,50].
Meteorological data for the study area from 2001 to 2018, including the daily maximum temperature, daily minimum temperature and daily precipitation, were obtained from the land surface daily meteorological data from relevant provinces and cities provided by the National Meteorological Center of the China Meteorological Administration (http://data.cma.cn/ (accessed on 29 January 2021)). There are 824 meteorological stations in China (Figure 1). Firstly, we used the inverse distance weighted method with a spatial resolution of 500 m × 500 m to interpolate these meteorological data among the 824 meteorological stations, so as to match MODIS NDVI. Secondly, the temperature was corrected using Digital Elevation Model (DEM) data and assumed to decrease at a lapse rate of 6.5 °C km−1 [51]. Then, the values of the annual meteorological factors were calculated based on the averages or sums of the daily meteorological data. Finally, the spatial distribution of the meteorological data in the subtropical region was obtained by clipping, as shown in Figure 1B–D.

2.3. FVC Estimation Method

In this study, the dimidiate pixel model was used to calculate the FVC in the study area. The model assumes that the ground object information included in each mixed pixel contains only vegetation information and soil information [52,53,54], and the NDVI value of the j-th pixel in the i-th year is:
N D V I i j = F V C i j N D V I v e g i + ( 1 F V C i j ) N D V I s o i l i
In Formula (1), i is the year, and j is the pixel; N D V I v e g i is the NDVI value of only the vegetation part of the mixed pixel in the i-th year, and N D V I s o i l i is the NDVI value of only the soil part of the mixed pixel in the i-th year. From Formula (1), we can obtain the FVC value of the j-th pixel in the i-th year:
F V C i j = ( N D V I i j N D V I s o i l i ) / ( N D V I v e g i N D V I s o i l i )
Due to the influence of many factors, such as atmosphere, land surface, and vegetation phenology, N D V I s o i l i and N D V I v e g i are not theoretical fixed values of 0 and 1 [55,56,57]. Therefore, in this study, on the basis of the vegetation conditions in the subtropical region and the quality of the remote sensing images, the upper and lower thresholds of NDVI were calculated with 95% confidence intervals to approximate the values of N D V I v e g i and N D V I s o i l i in the study area, respectively. Through statistical analysis, we found that the NDVI values of each year in the subtropical region approximately obeys the normal distribution. Therefore, in the present study, we used the z-distribution for our test statistics, the N D V I v e g i and N D V I s o i l i were calculated as follows:
N D V I v e g i = A v g i + Z 0.025 S t d i
N D V I s o i l i = A v g i Z 0.025 S t d i
In Formulas (3) and (4), i is the year; A v g i and S t d i are the average value and the standard deviation of NDVI in the i-th year, respectively; the value of Z 0.025 is 1.96.
According to the “Standards for classification and gradation of soil erosion” promulgated by the Ministry of Water Resources in 2008, this study divided the subtropical FVC into 5 levels: bare land (<10%), low coverage (10–30%), low-to-medium coverage (30–45%), medium coverage (45–60%), and high coverage (>60%).

2.4. FVC Spatiotemporal Evolution Analysis Method

2.4.1. Determination of the FVC Evolution Trend and Analysis of Its Significance

Linear regression analysis was performed on the estimation results for the subtropical FVC from 2001 to 2018 at the pixel scale to simulate the trend and characteristics of subtropical FVC over time; the linear regression was performed as follows [4,58]:
θ = n i = 1 n i F V C i i = 1 n i i = 1 n F V C i n i = 1 n i 2 ( i = 1 n i ) 2
In Formula (5), θ is the trend slope (when θ > 0 it means that FVC is increasing, and when θ < 0 it means that FVC is decreasing); n is the number of monitoring years; i is the year ( i = 1, 2, …, n ); and F V C i is the fractional vegetation cover in the i-th year.
To analyze whether the variation trend of FVC was significant, the F-test was further used to test the significance of the variation trend of FVC in this study as follows:
F = U ( n 2 ) Q
In Formula (6), the sum of the squared errors is U = i = 1 n ( F V C i ^ F V C ¯ ) 2 , the explained sum of squares is Q = i = 1 n ( F V C i F V C i ^ ) 2 , F V C ¯ and F V C i ^ are the average value and regression value of FVC, respectively. n is the number of monitoring years, i is the year ( i = 1, 2, …, n ). Based on the consideration of both the trend slope θ and the F-test results, this study divided the significance of the FVC spatiotemporal evolution into 5 levels: significantly reduced ( θ < 0 ,   P < 0.01 ) , reduced ( θ < 0 ,   0.01 < P < 0.05 ) , basically stable ( P > 0.05 ) , increased ( θ > 0 ,   0.01 < P < 0.05 ) and significantly increased ( θ > 0 ,   P < 0.01 ) [4,59].

2.4.2. FVC Spatial Fluctuation Characteristics

The ratio of the standard deviation to the average is called the variation coefficient ( C v ), and its value is often used to reflect the stability of a set of data. The lower the value of C v , the more stable the data are, and vice versa [16,60]. This study used the C v of each pixel to simulate and analyze the fluctuation characteristics of the subtropical FVC in the past 20 years as follows:
C v = 1 n 1 i = 1 n ( F V C i F V C ¯ ) 2 F V C ¯
In Formula (7), n is the number of monitoring years, i is the year ( i = 1, 2, …, n ); F V C i is the fractional vegetation cover in the i-th year and F V C ¯ is the average value of FVC. By performing Jenks natural breaks classification in ArcGIS software [29], the C v results obtained were divided into 5 levels: low fluctuation ( C v 0.144 ), lower fluctuation ( 0.144 < C v 0.297 ), medium fluctuation ( 0.297 < C v 0.527 ), higher fluctuation ( 0.527 < C v 0.872 ), and high fluctuation ( C v > 0.872 ) .

2.5. Analysis of Temporal and Spatial Responses of FVC to Climate Change

This study mainly analyzed the partial correlations between the three climatic variable indicators, Tmax, Tmin, and Pre from 2001 to 2018, and the subtropical FVC; the t-test was used to test the significance of the partial correlation analysis results [59] to reveal the temporal and spatial response of FVC to climate change. The calculation of the partial correlation coefficient (PCC) is shown in Formula (8):
R a b c d = R a b d R a c d × R b c d ( 1 R a c d 2 ) × ( 1 R b c d 2 )
In Formula (8), R a b c d is the PCC between variables a and b when variables c and d are fixed; R a b , R a c , and R b c represent the correlation coefficients between variables a and b , variables a and c , and variables b and c , respectively. Compared with simple linear correlation analysis, the partial correlation analysis can more accurately reflect the correlation between two variables; the higher the PCC is, the greater the influence of the variable on the FVC, and otherwise the lesser the influence of the variable on the FVC [60].

2.6. Analysis of the Contribution of Climate Factors to FVC Variations

In order to quantitatively analyze the contribution of each climate factor to FVC variations, the partial derivative model was used to calculate the relative contributions of Tmax, Tmin, and Pre to FVC in this study, and then analyze the main driving factors of FVC variations. The relative contributions of the climate factors to FVC variations can be expressed as [45]:
C ( f i ) = S f i × K f i
S f i = F V C f i
R c ( f i ) = | C ( f i ) | i = 1 n | C ( f i ) | × 100 %
In Formulas (9)–(11), n represents the number of climate factors (i = 1, 2, …, n). f i is the i-th climate factor; C ( f i ) represents the contribution of the i-th climate factor to the FVC variations; K f i represents the interannual variation of the i-th climate factor; S f i represents the sensitivity of FVC to the i-th climate factor variation. R c ( f i ) represents the relative contribution of the i-th climate factor to FVC variation.

3. Results

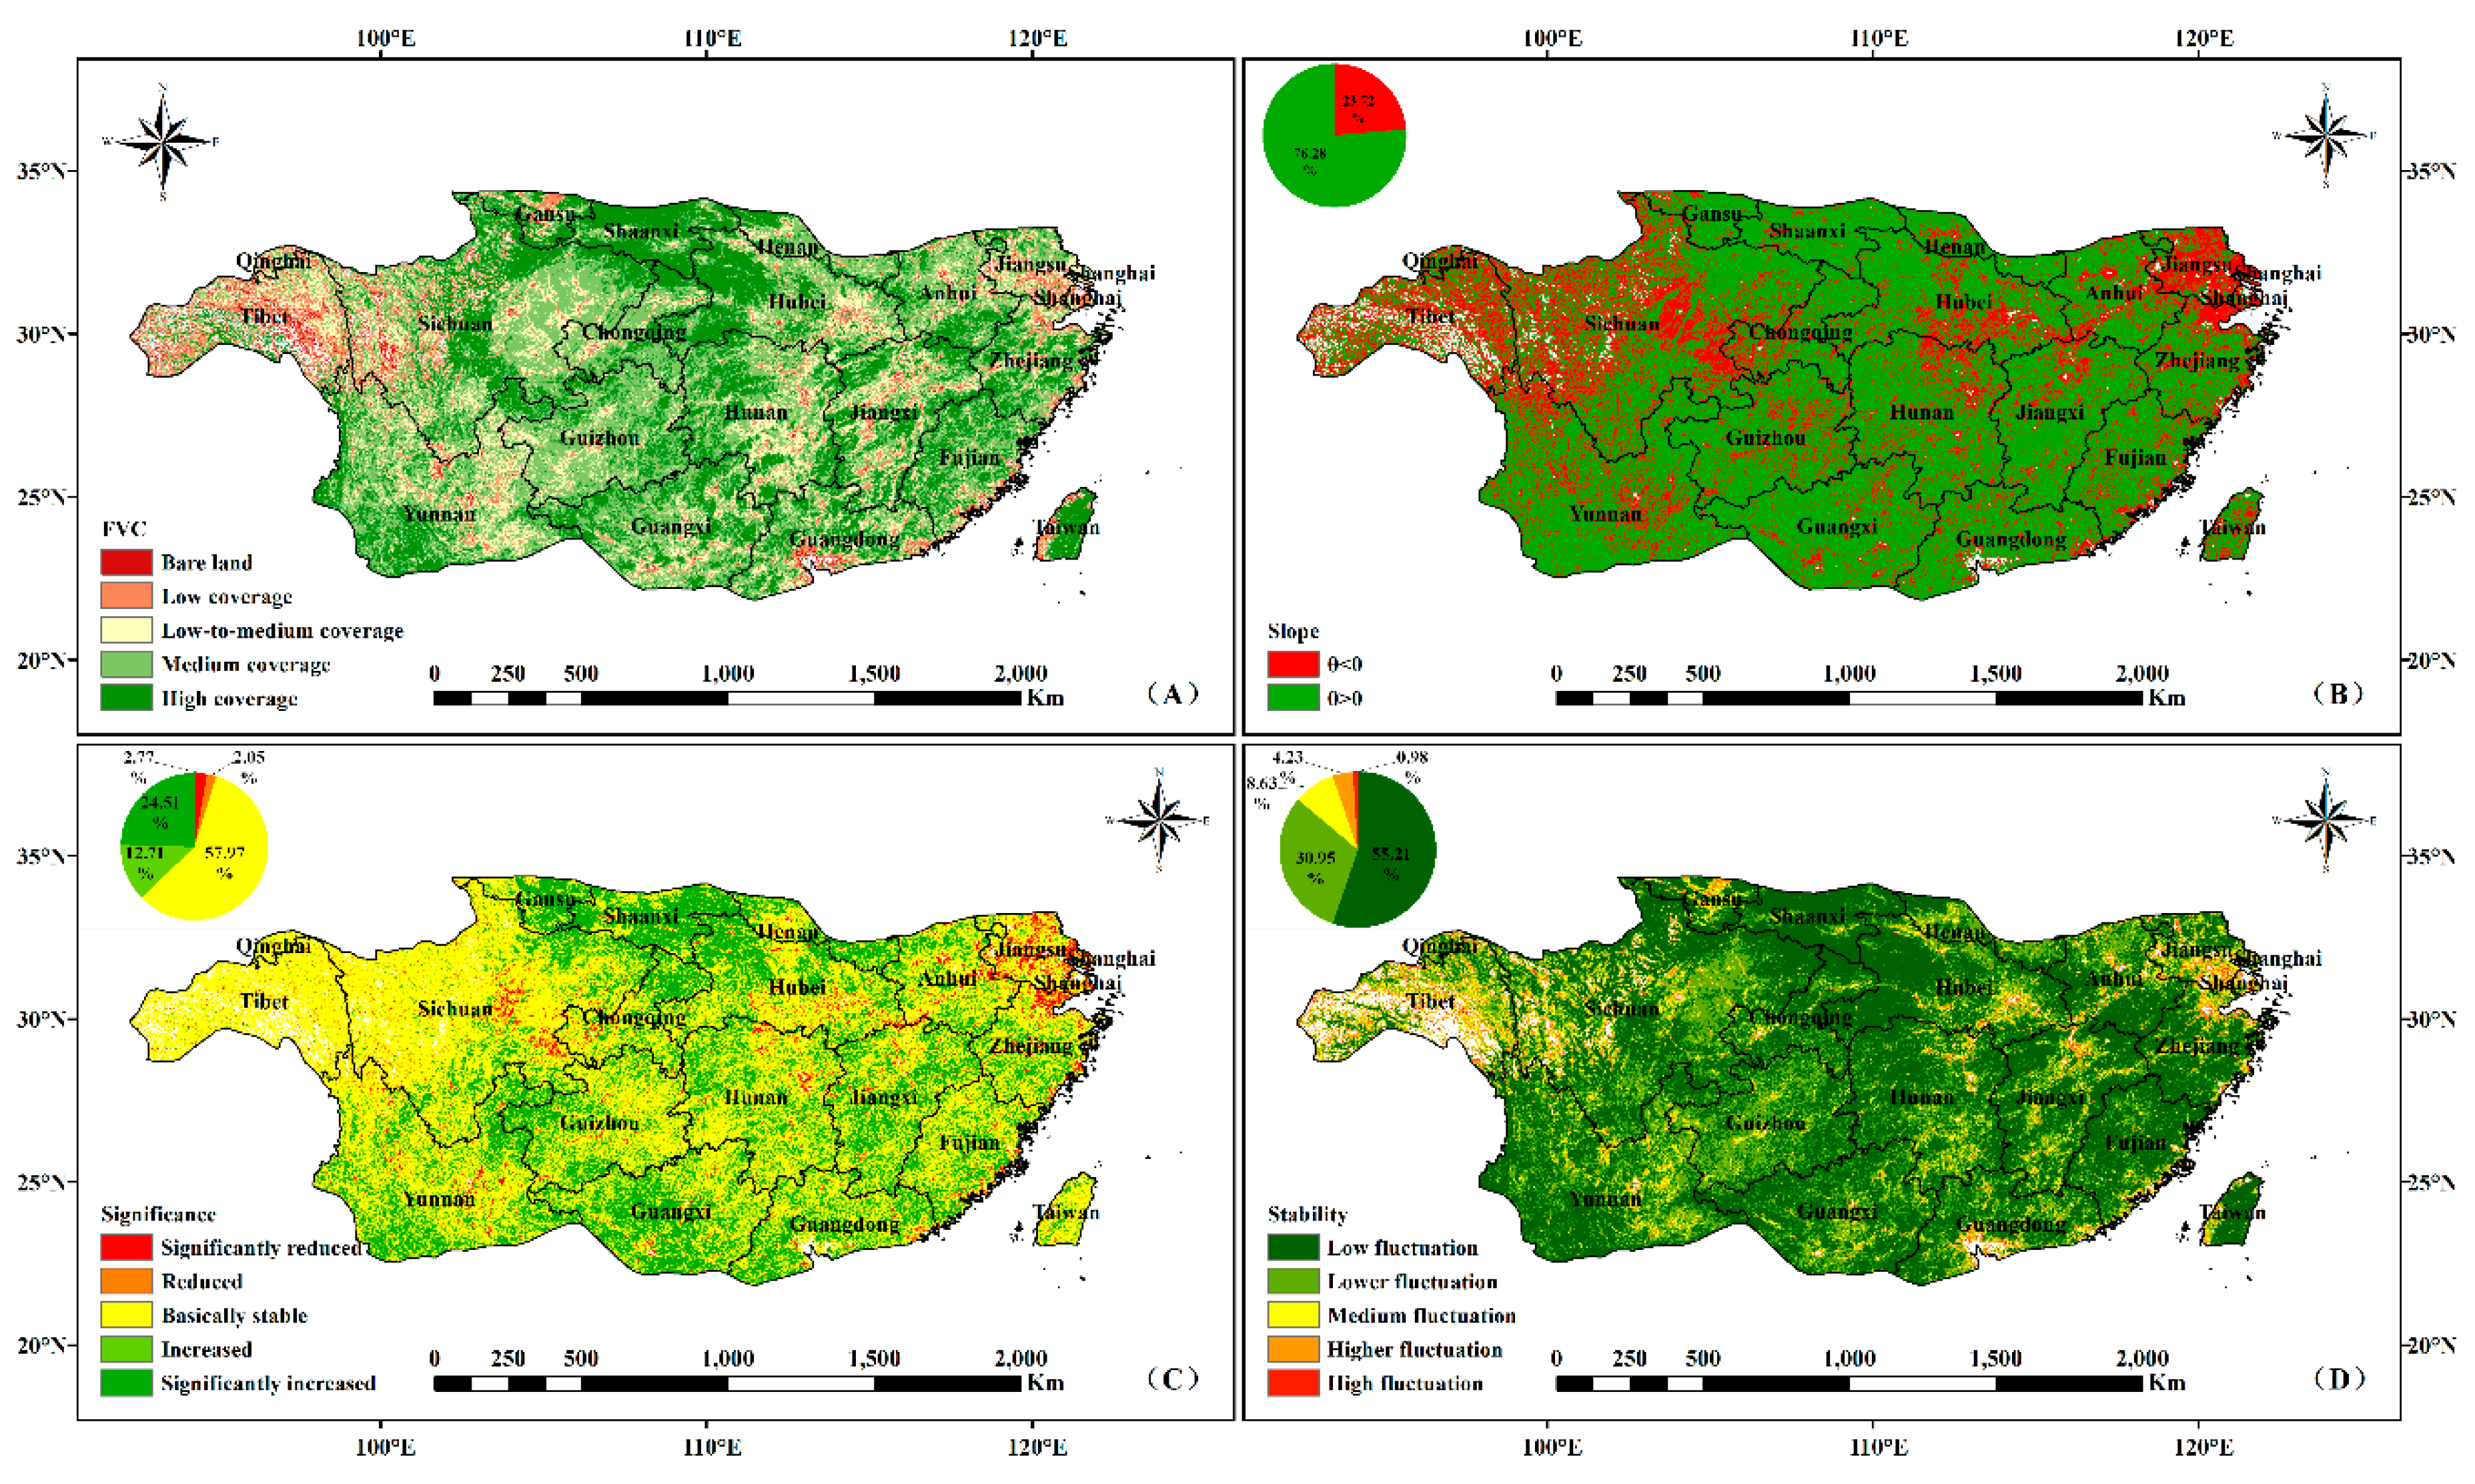
3.1. Spatial Distribution Characteristics of the FVC

The temporal and spatial distribution of the FVC in the subtropical region from 2001 to 2018 is shown in Figure 2. There was obvious temporal and spatial heterogeneity in the subtropical FVC from 2001 to 2018, and the vegetation coverage level in the eastern region was higher than that in the western region in all 18 years. This is consistent with the physical and geographical characteristics of the subtropical region (Figure 1A) and the climatic conditions such as water and heat (Figure 1B–D).
The areal ratios of the FVC high-coverage zone, medium-coverage zone, low-to-medium-coverage zone, low-coverage zone, and bare-land zone from 2001 to 2018 in the subtropical region are shown in Figure 3; combining Figure 3 with Figure 2 highlights that the temporal and spatial evolution characteristics of the FVC levels were significantly different, as follows:
(1)
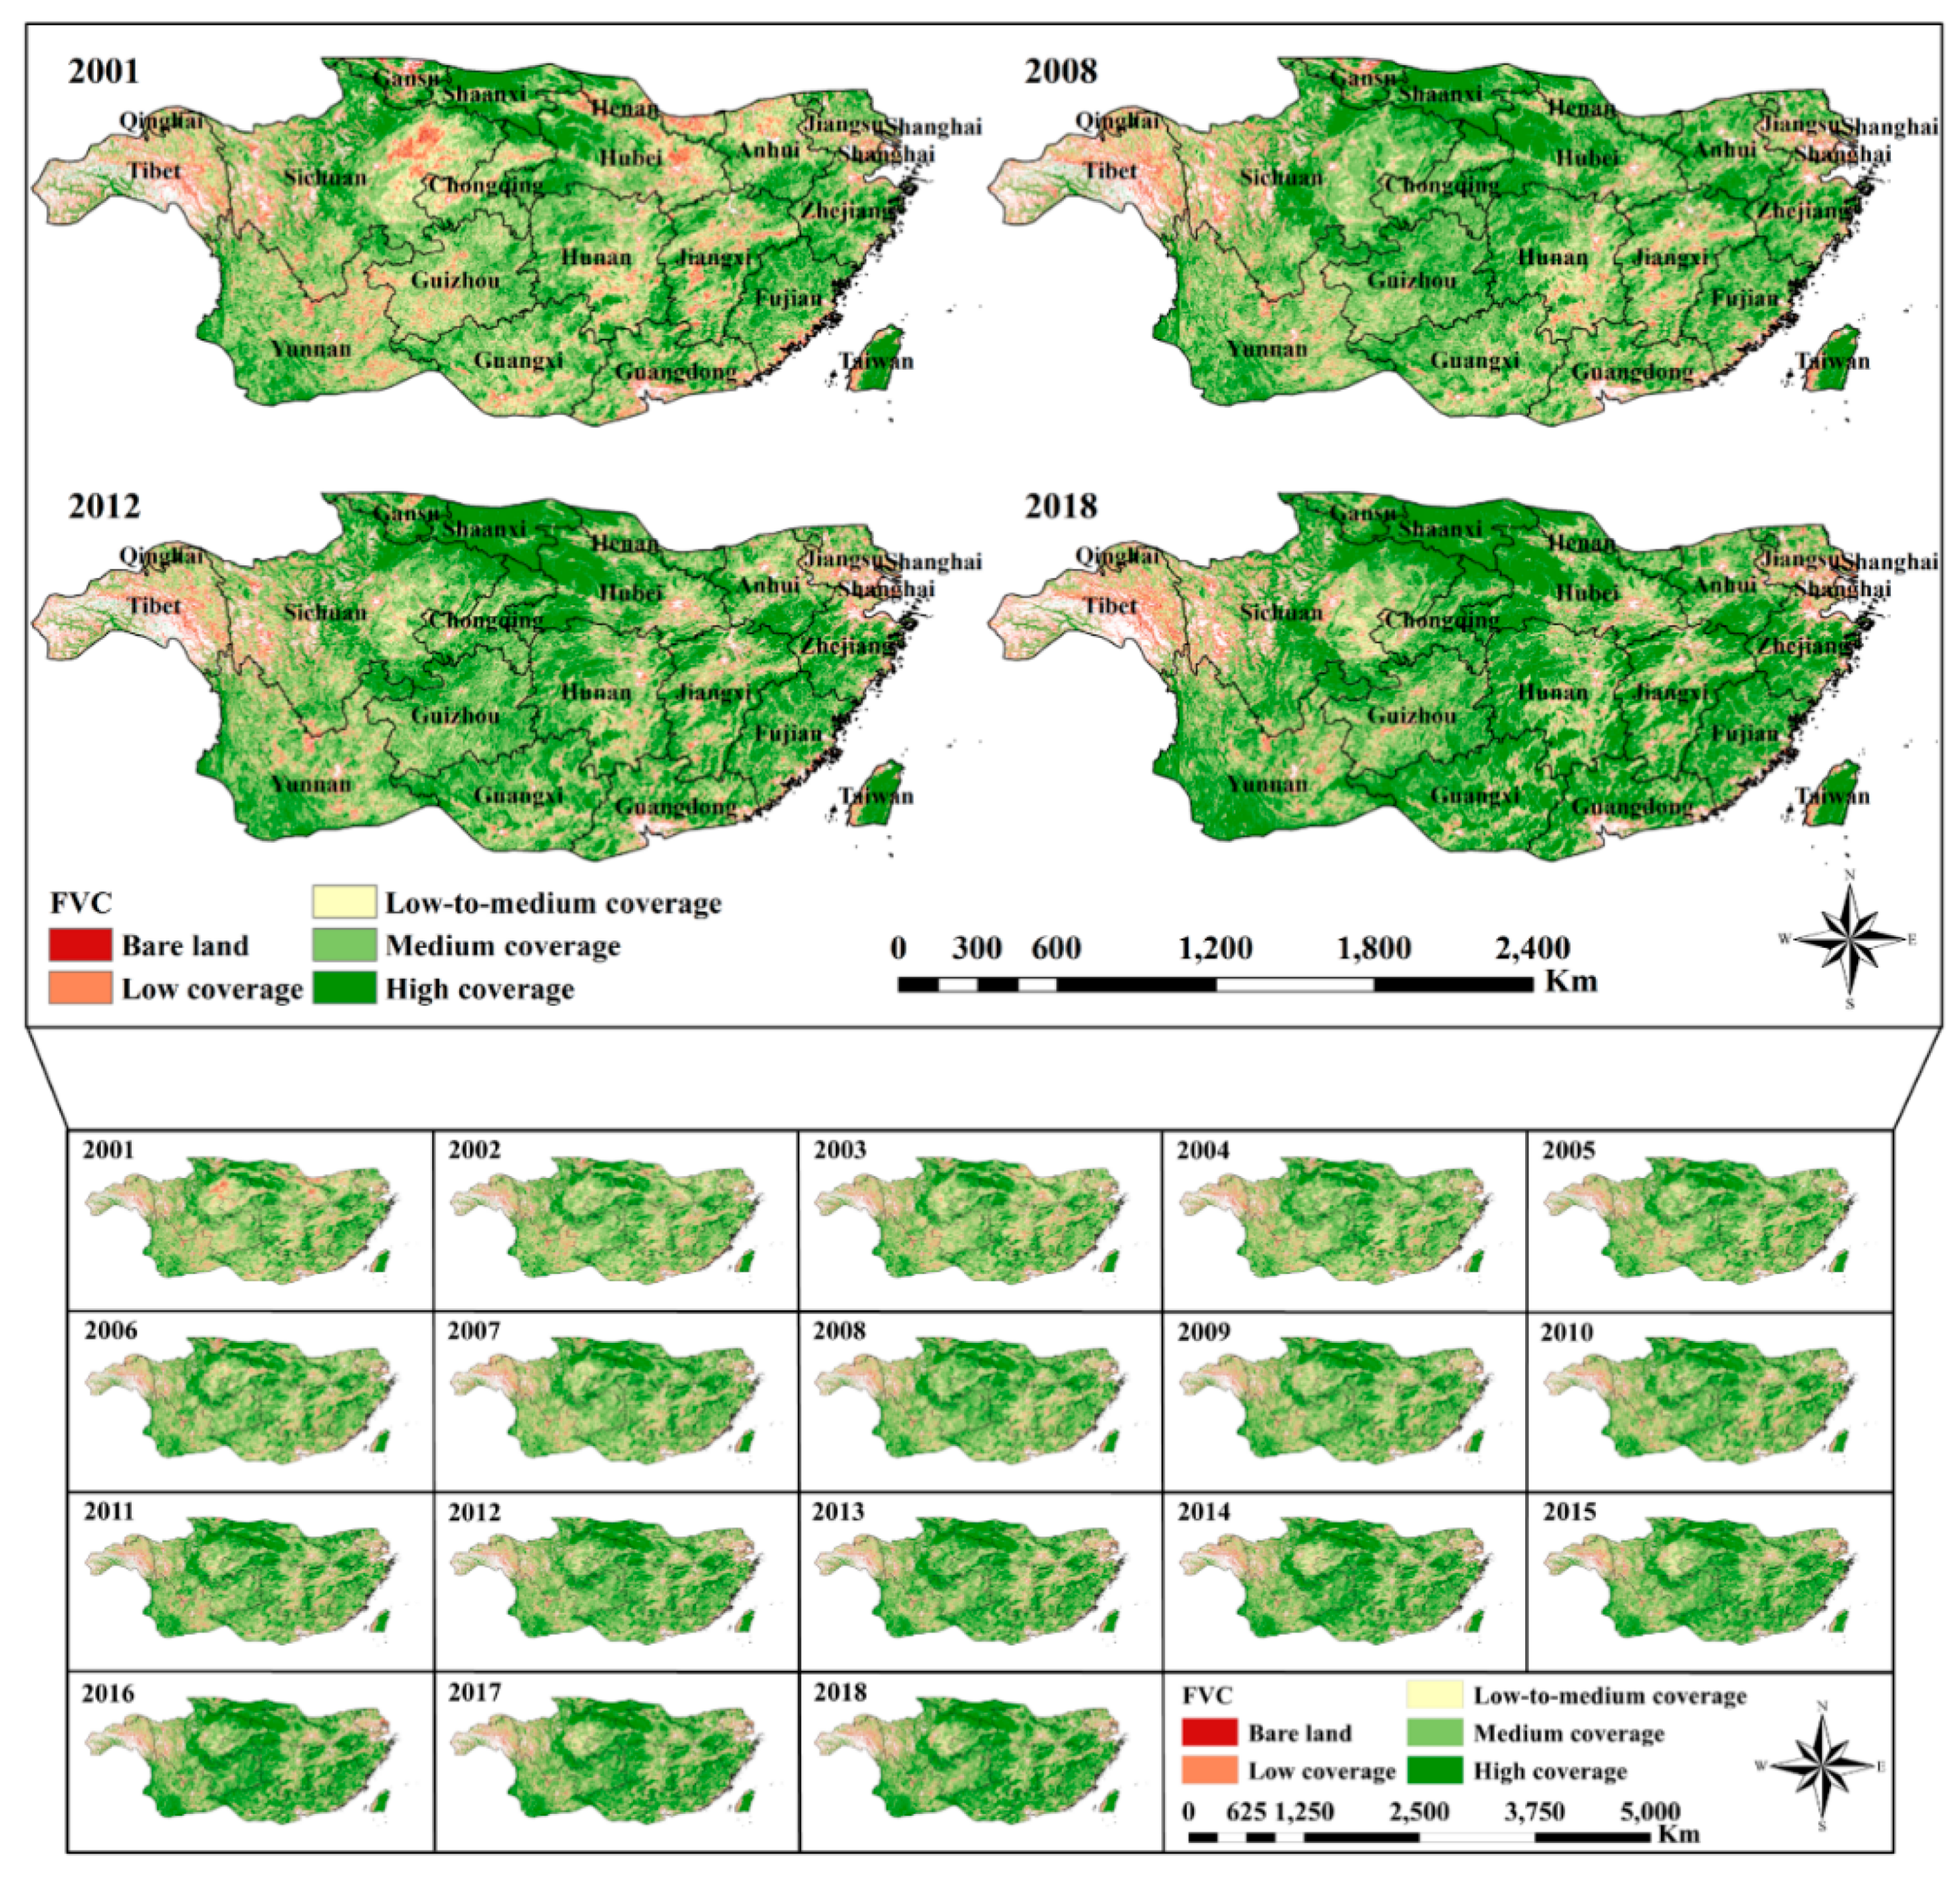
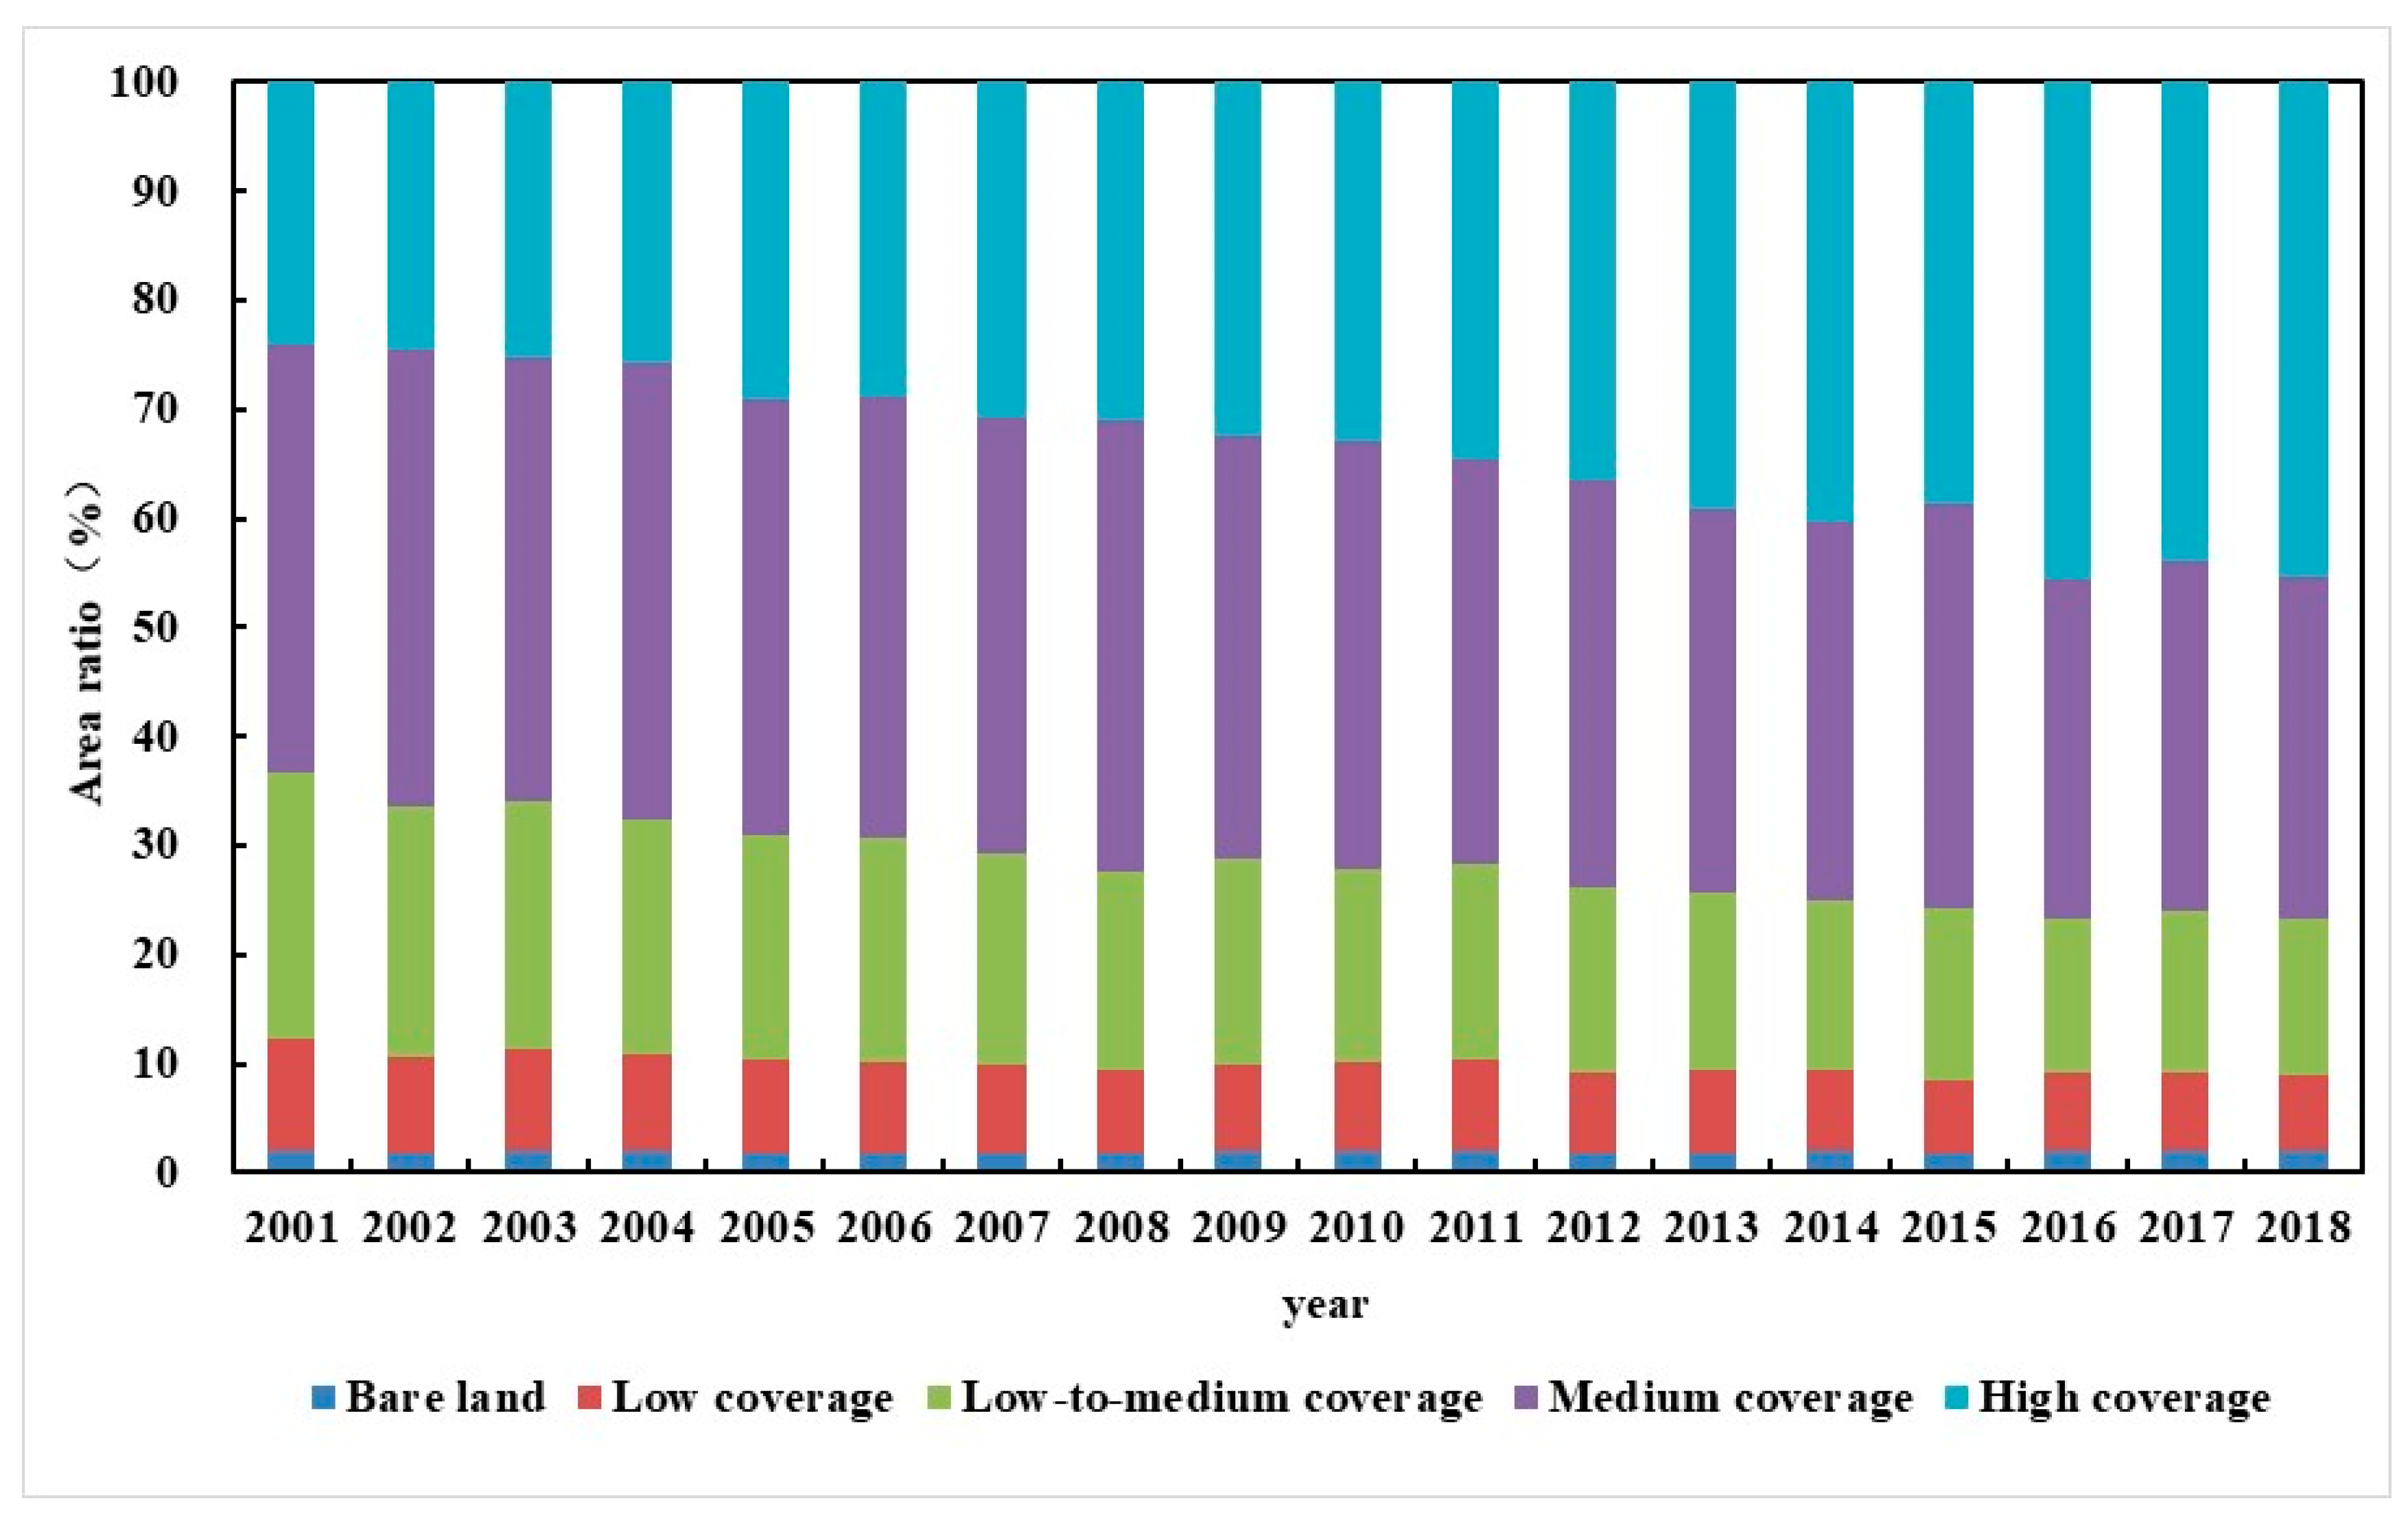
The distributions of the FVC high-coverage zone and medium-coverage zone were relatively concentrated and broad, and their combined area accounted for more than 70% of the study area. From 2001 to 2018, the overall area of the high-coverage zone showed a significant upward trend, and its areal proportion reached a maximum in 2016 (45.07%). However, the area of the medium-coverage zone showed a significant declining trend, with its areal proportion decreasing from 39.34% in 2001 to 31.28% in 2018 and reaching its minimum in 2016 (31.08%). The variation trends of the medium-coverage zone and high-coverage zone exhibited a certain degree of symmetry. The area of the medium-coverage zone was larger than that of the high-coverage zone from 2001 to 2012, while the area of the high-coverage zone was larger than that of the medium-coverage zone from 2013 to 2018.
(2)
The area of the low-to-medium-coverage zone also showed a significant downward trend during the study period, and its areal proportion decreased from 24.37% in 2001 to 14.28% in 2018. The low-to-medium-coverage zone was distributed in strips and blocks around areas of human activity, such as eastern Sichuan Province, eastern Hubei Province, northern and central Hunan Province, eastern Yunnan Province, and northern Jiangxi Province. In terms of the vegetation types in the region, a large proportion of the low-to-medium-coverage zone was cultivated land.
(3)
As a whole, the area of the low-coverage zone showed a slight downward trend, and its areal proportion decreased from 10.39% in 2001 to 7.05% in 2018. This zone was mainly distributed around coastal and water areas, unused lands, plateaus, cities and towns with intense human activities and other areas, such as southern Jiangsu Province, northeastern Shanghai, eastern Tibet Autonomous Region, western Sichuan Province, the southeast coast, the Pearl River Delta, western Taiwan Province, and other regions. Due to the strong influence of man-made and topographical factors in this zone, the type, growth structure and characteristics of vegetation in the low-coverage zone were highly variable, and dense vegetation areas tended not easy to form. Therefore, the low-coverage areas within the whole study area were small and dispersed.
(4)
The bare-land zone was dispersed within the study area, and its area accounted for only approximately 1.86% of the study area; this zone had the smallest distribution area and no obvious variation trend.

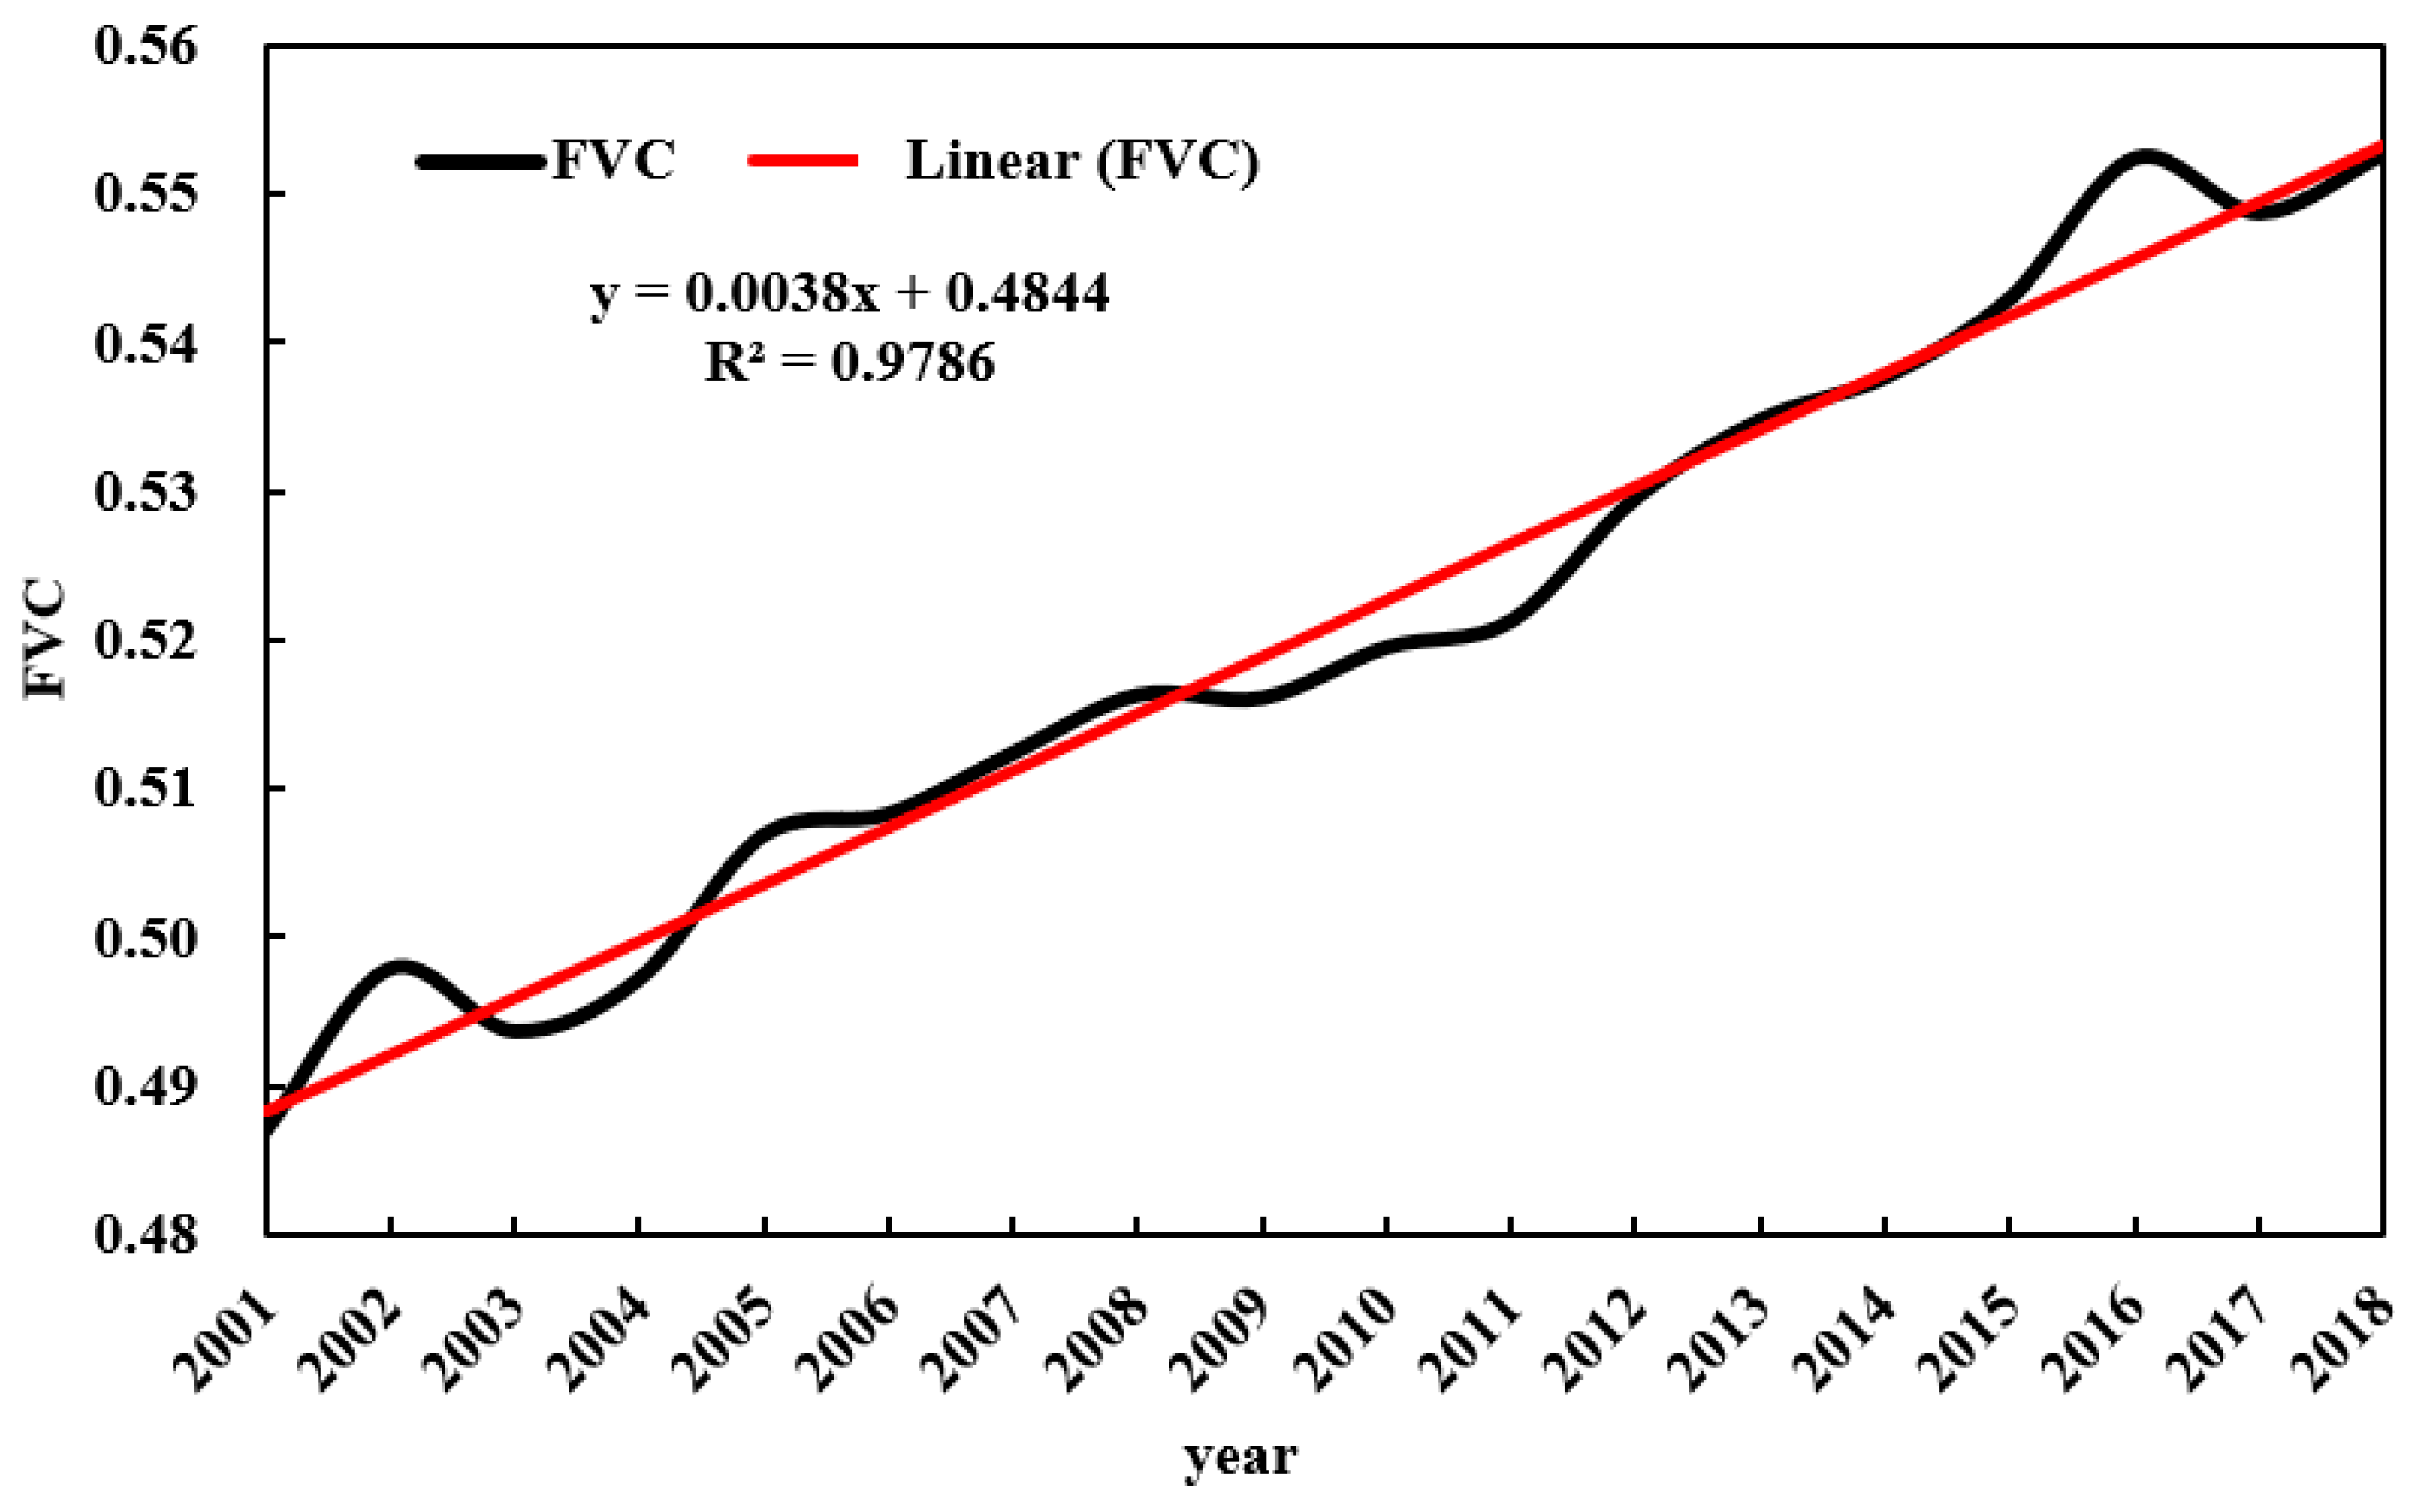
3.2. Temporal Variation Trend of the FVC

Based on the statistics shown in Figure 2, the overall variation trend of the average annual FVC in the subtropical region from 2001 to 2018 was obtained, as shown in Figure 4. Figure 4 shows that the interannual variation in the annual average subtropical FVC from 2001 to 2018 showed a significant growth trend, and FVC increased at an annual rate of 0.37%; FVC reached a maximum in 2018 (0.55), which was 12.24% higher than that in 2001 (0.49) FVC. This result indicates that the growth status of subtropical vegetation shows a good development trend.

3.3. Spatiotemporal Variability of FVC

The spatial distribution of the subtropical FVC trend slope θ from 2001 to 2018 is shown in Figure 5B. Figure 5B shows that the regional FVC exhibited an increasing trend ( θ > 0 ) in 76.28% of the study area and that the areas of increase were widely distributed in Gansu, Shaanxi, Hunan, Guangdong, Guangxi, Fujian and other regions. In addition, the regional FVC showed a decreasing trend ( θ < 0 ) in 23.72% of the study area; the areas of decrease were mainly distributed in a few areas, such as Jiangsu, Shanghai, Sichuan, and Tibet.
Figure 5C shows the spatial distribution of the significance of FVC variation from 2001 to 2018. Figure 5C shows that (1) the areas where FVC was significantly reduced and reduced were very small, accounting for only 2.77% and 2.05% of the study area, respectively. These areas were mainly distributed in the northeast of the subtropical region and in parts of Sichuan Province. (2) The area of the basically stable zone accounted for approximately 57.97% of the study area. Its areal proportion was the largest of those of all significance classes. In the subtropical region, various provinces and cities exhibited a certain area of distribution of the basically stable zone, which was mainly concentrated in the western and central parts of the subtropical region as well as in Taiwan Province. (3) The FVC in the increased and significantly increased zones was mostly high coverage and medium coverage (Figure 5A), and their areal proportions were 12.71% and 24.51%, respectively. The significantly increased zone was widely distributed and relatively concentrated, mainly concentrated in the northern and southern of the subtropical region. The increased zone was relatively dispersed throughout the study area.
To further analyze the variations and fluctuations in FVC in the subtropical region from 2001 to 2018, this study drew a spatial distribution diagram of the stability of FVC based on the results of the C v classification, as shown in Figure 5D. Figure 5D shows that the FVC in the subtropical region from 2001 to 2018 was relatively stable overall. Except for Gansu, Tibet, Jiangsu, Shanghai, Hubei, Guangdong, etc., where the FVC variations were medium- and high-fluctuation zones, the FVC in most other regions showed the low fluctuation or lower fluctuation. Among them, (1) the low-fluctuation zone had the largest coverage area, accounting for approximately 55% of the study area, and was distributed in Shaanxi Province, western Hubei Province, Fujian Province, Taiwan Province and other regions. The lower-fluctuation zone accounted for approximately 30% of the study area and was mainly distributed in Guizhou Province, eastern Sichuan Province, Henan Province, northern Anhui Province, and other regions. Comparing A and C in Figure 5 shows that the low-fluctuation zone and the lower-fluctuation zone corresponded to the high-coverage and medium-coverage zone, and the significance in these areas was expressed as increased or significantly increased; these findings indicate that the higher the FVC in the area was, the greater the stability of FVC. (2) The medium-, higher-, and high-fluctuation zones had a certain spatial consistency with the reduced zone and the significantly reduced zone (Figure 5C). The medium-, higher-, and high-fluctuation zones covered a small area, their combined area accounting for only approximately 15% of the study area, and they were mainly distributed in Tibet, Qinghai, etc., where there is less vegetation coverage, or in Shanghai, Southern Jiangsu, etc., where human activity levels are high.

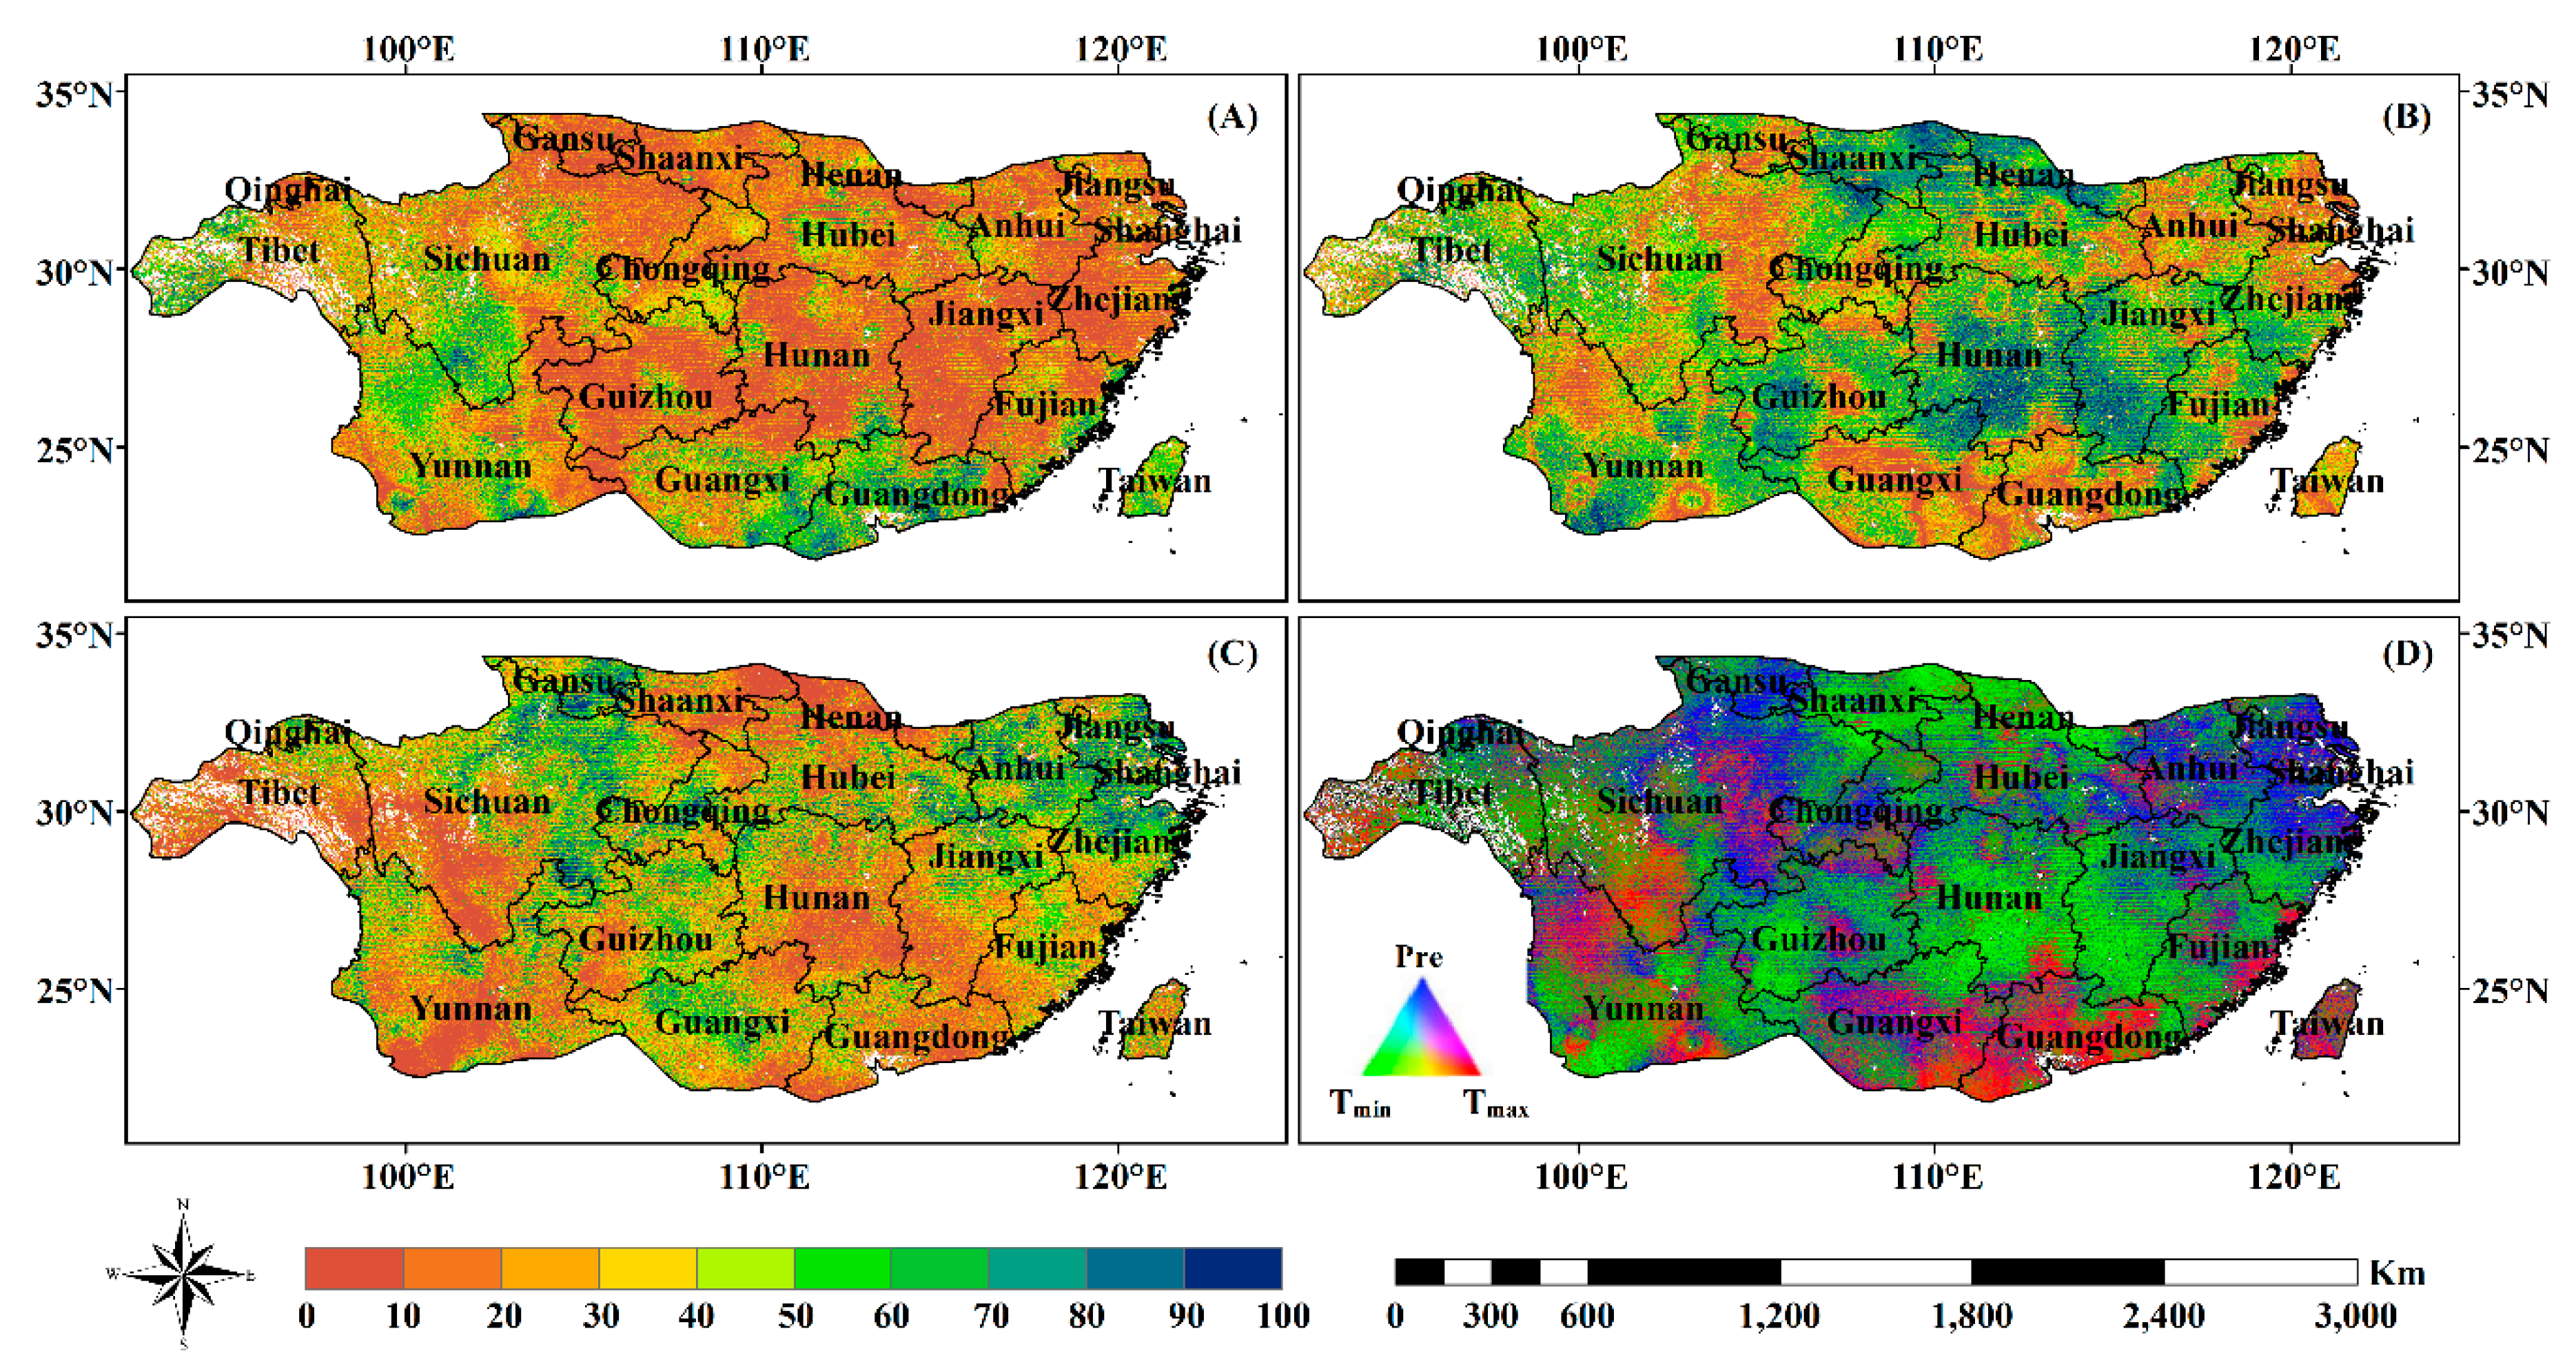
3.4. Analysis of Climate Drivers of FVC Spatiotemporal Evolution

From 2001 to 2018, there were significant differences in the spatial distribution patterns of the partial correlations between the subtropical FVC and Tmax, Tmin, and Pre (Figure 6 and Figure 7).

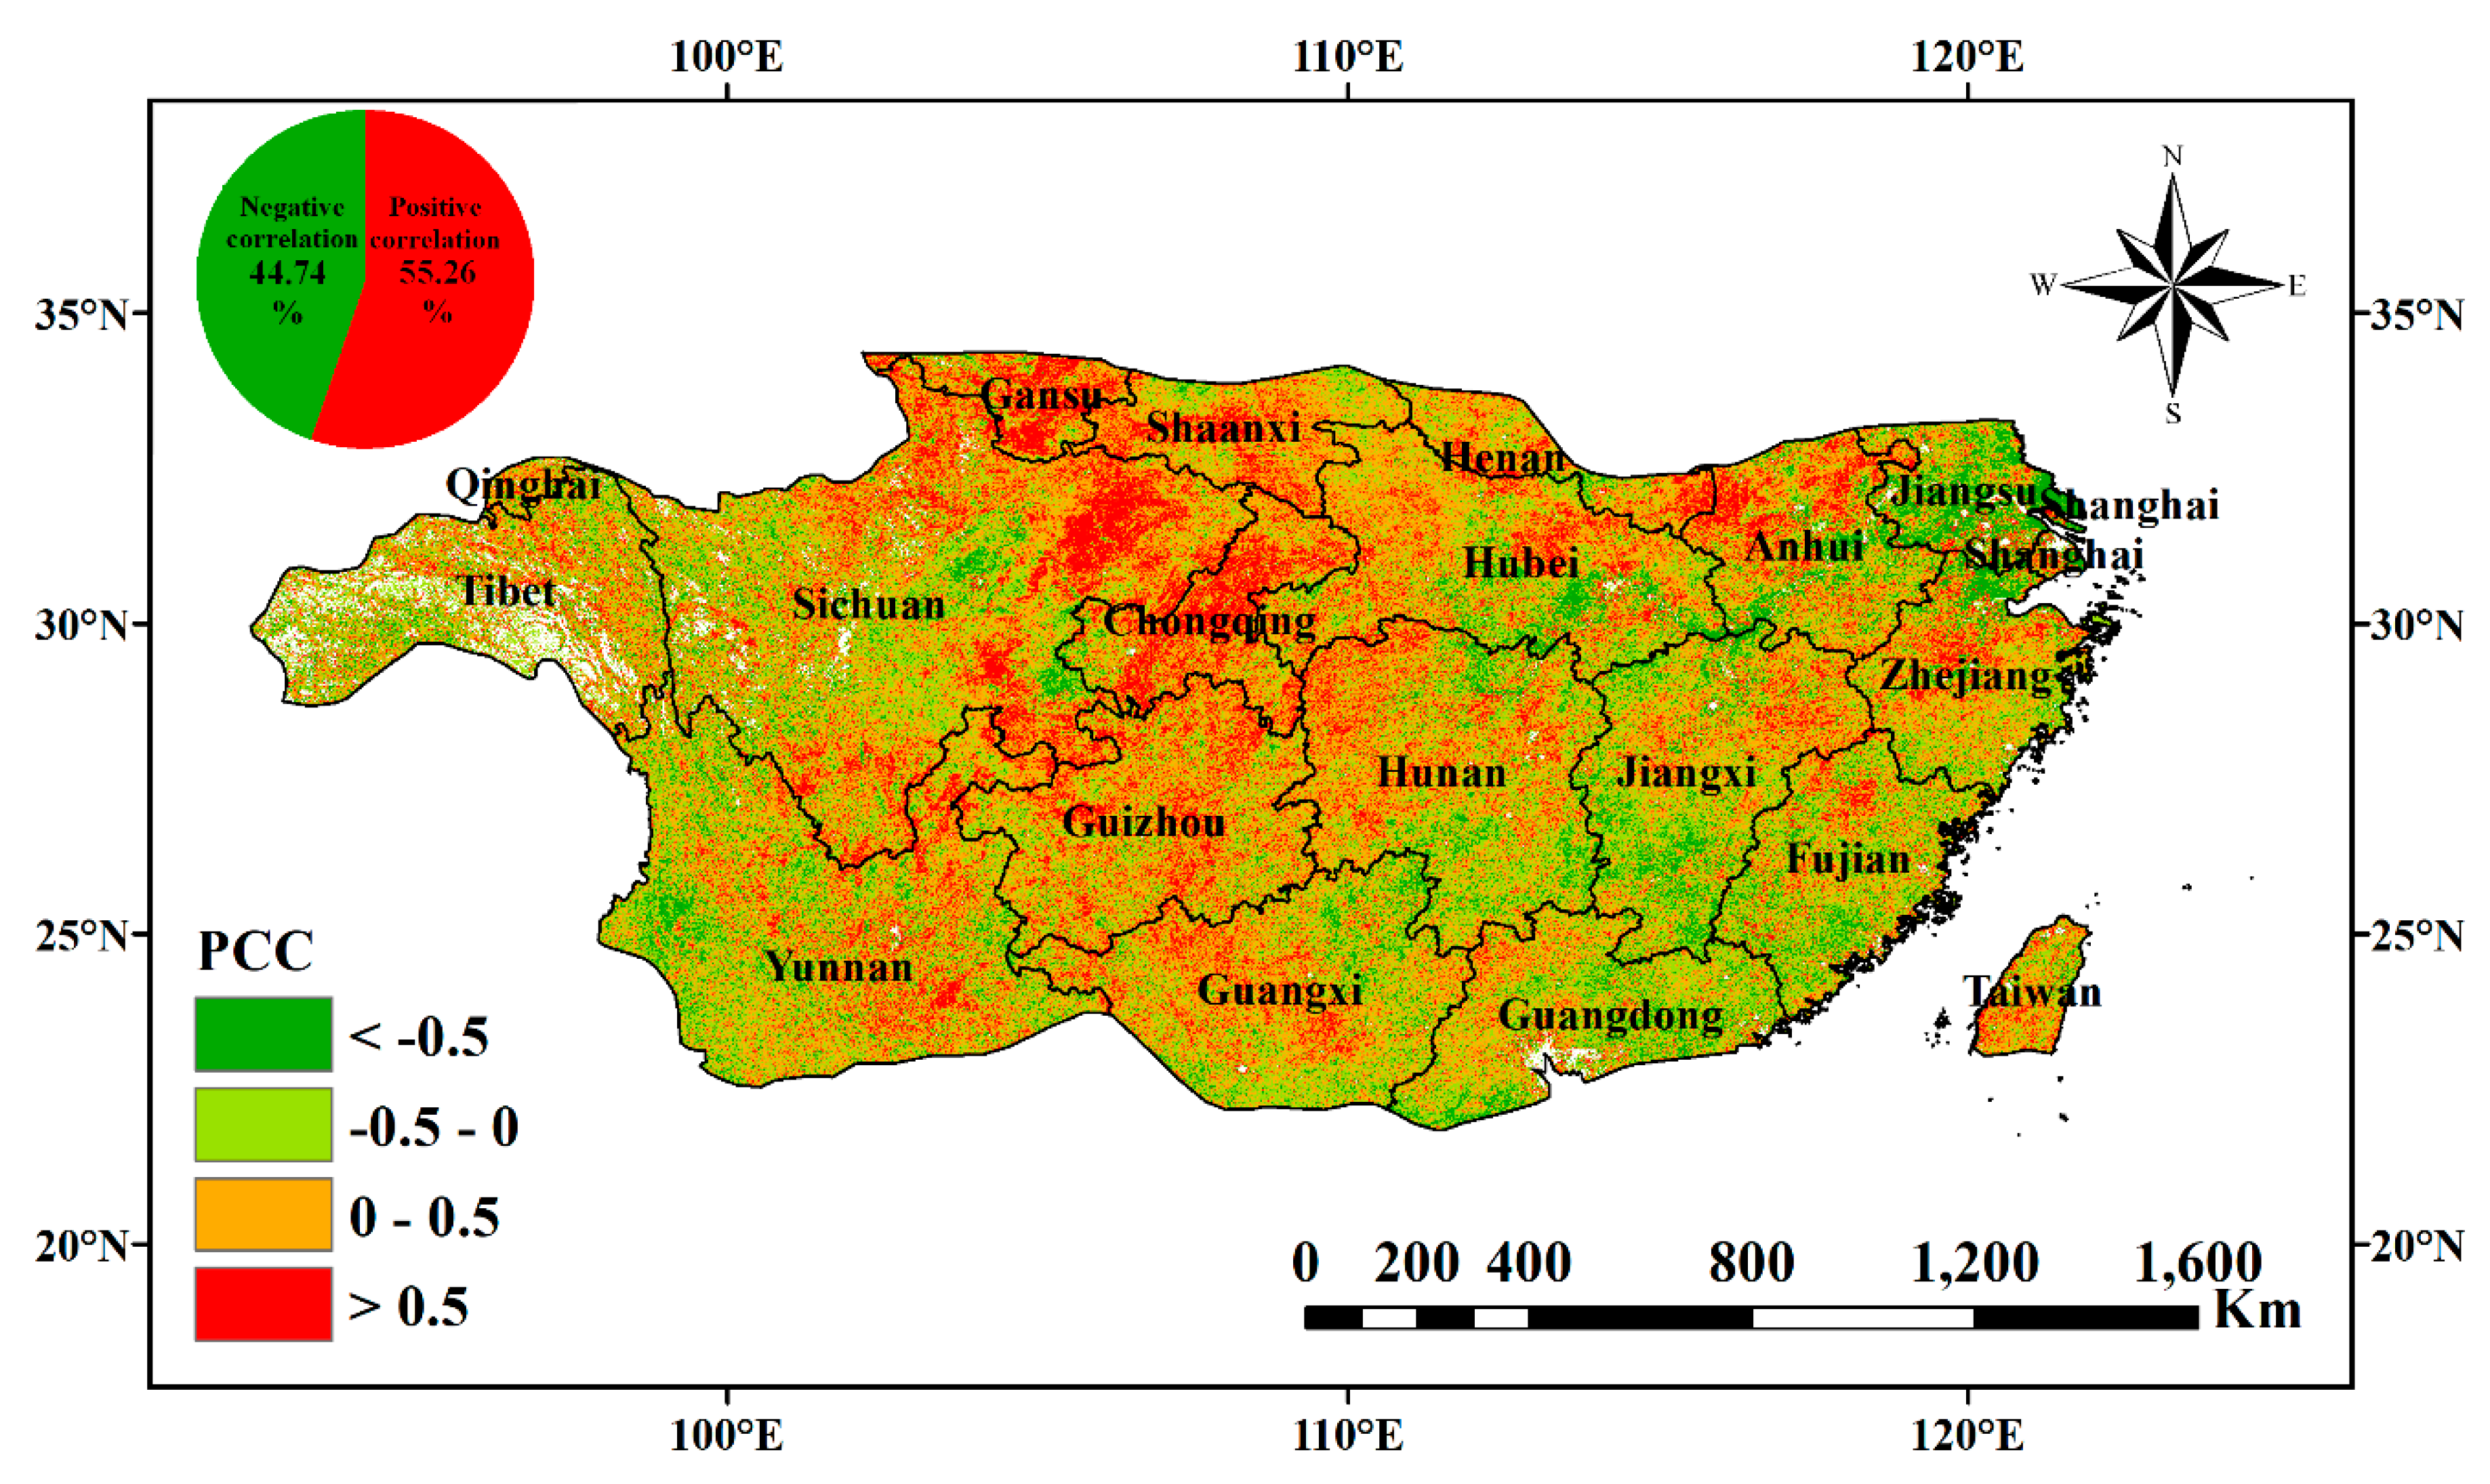
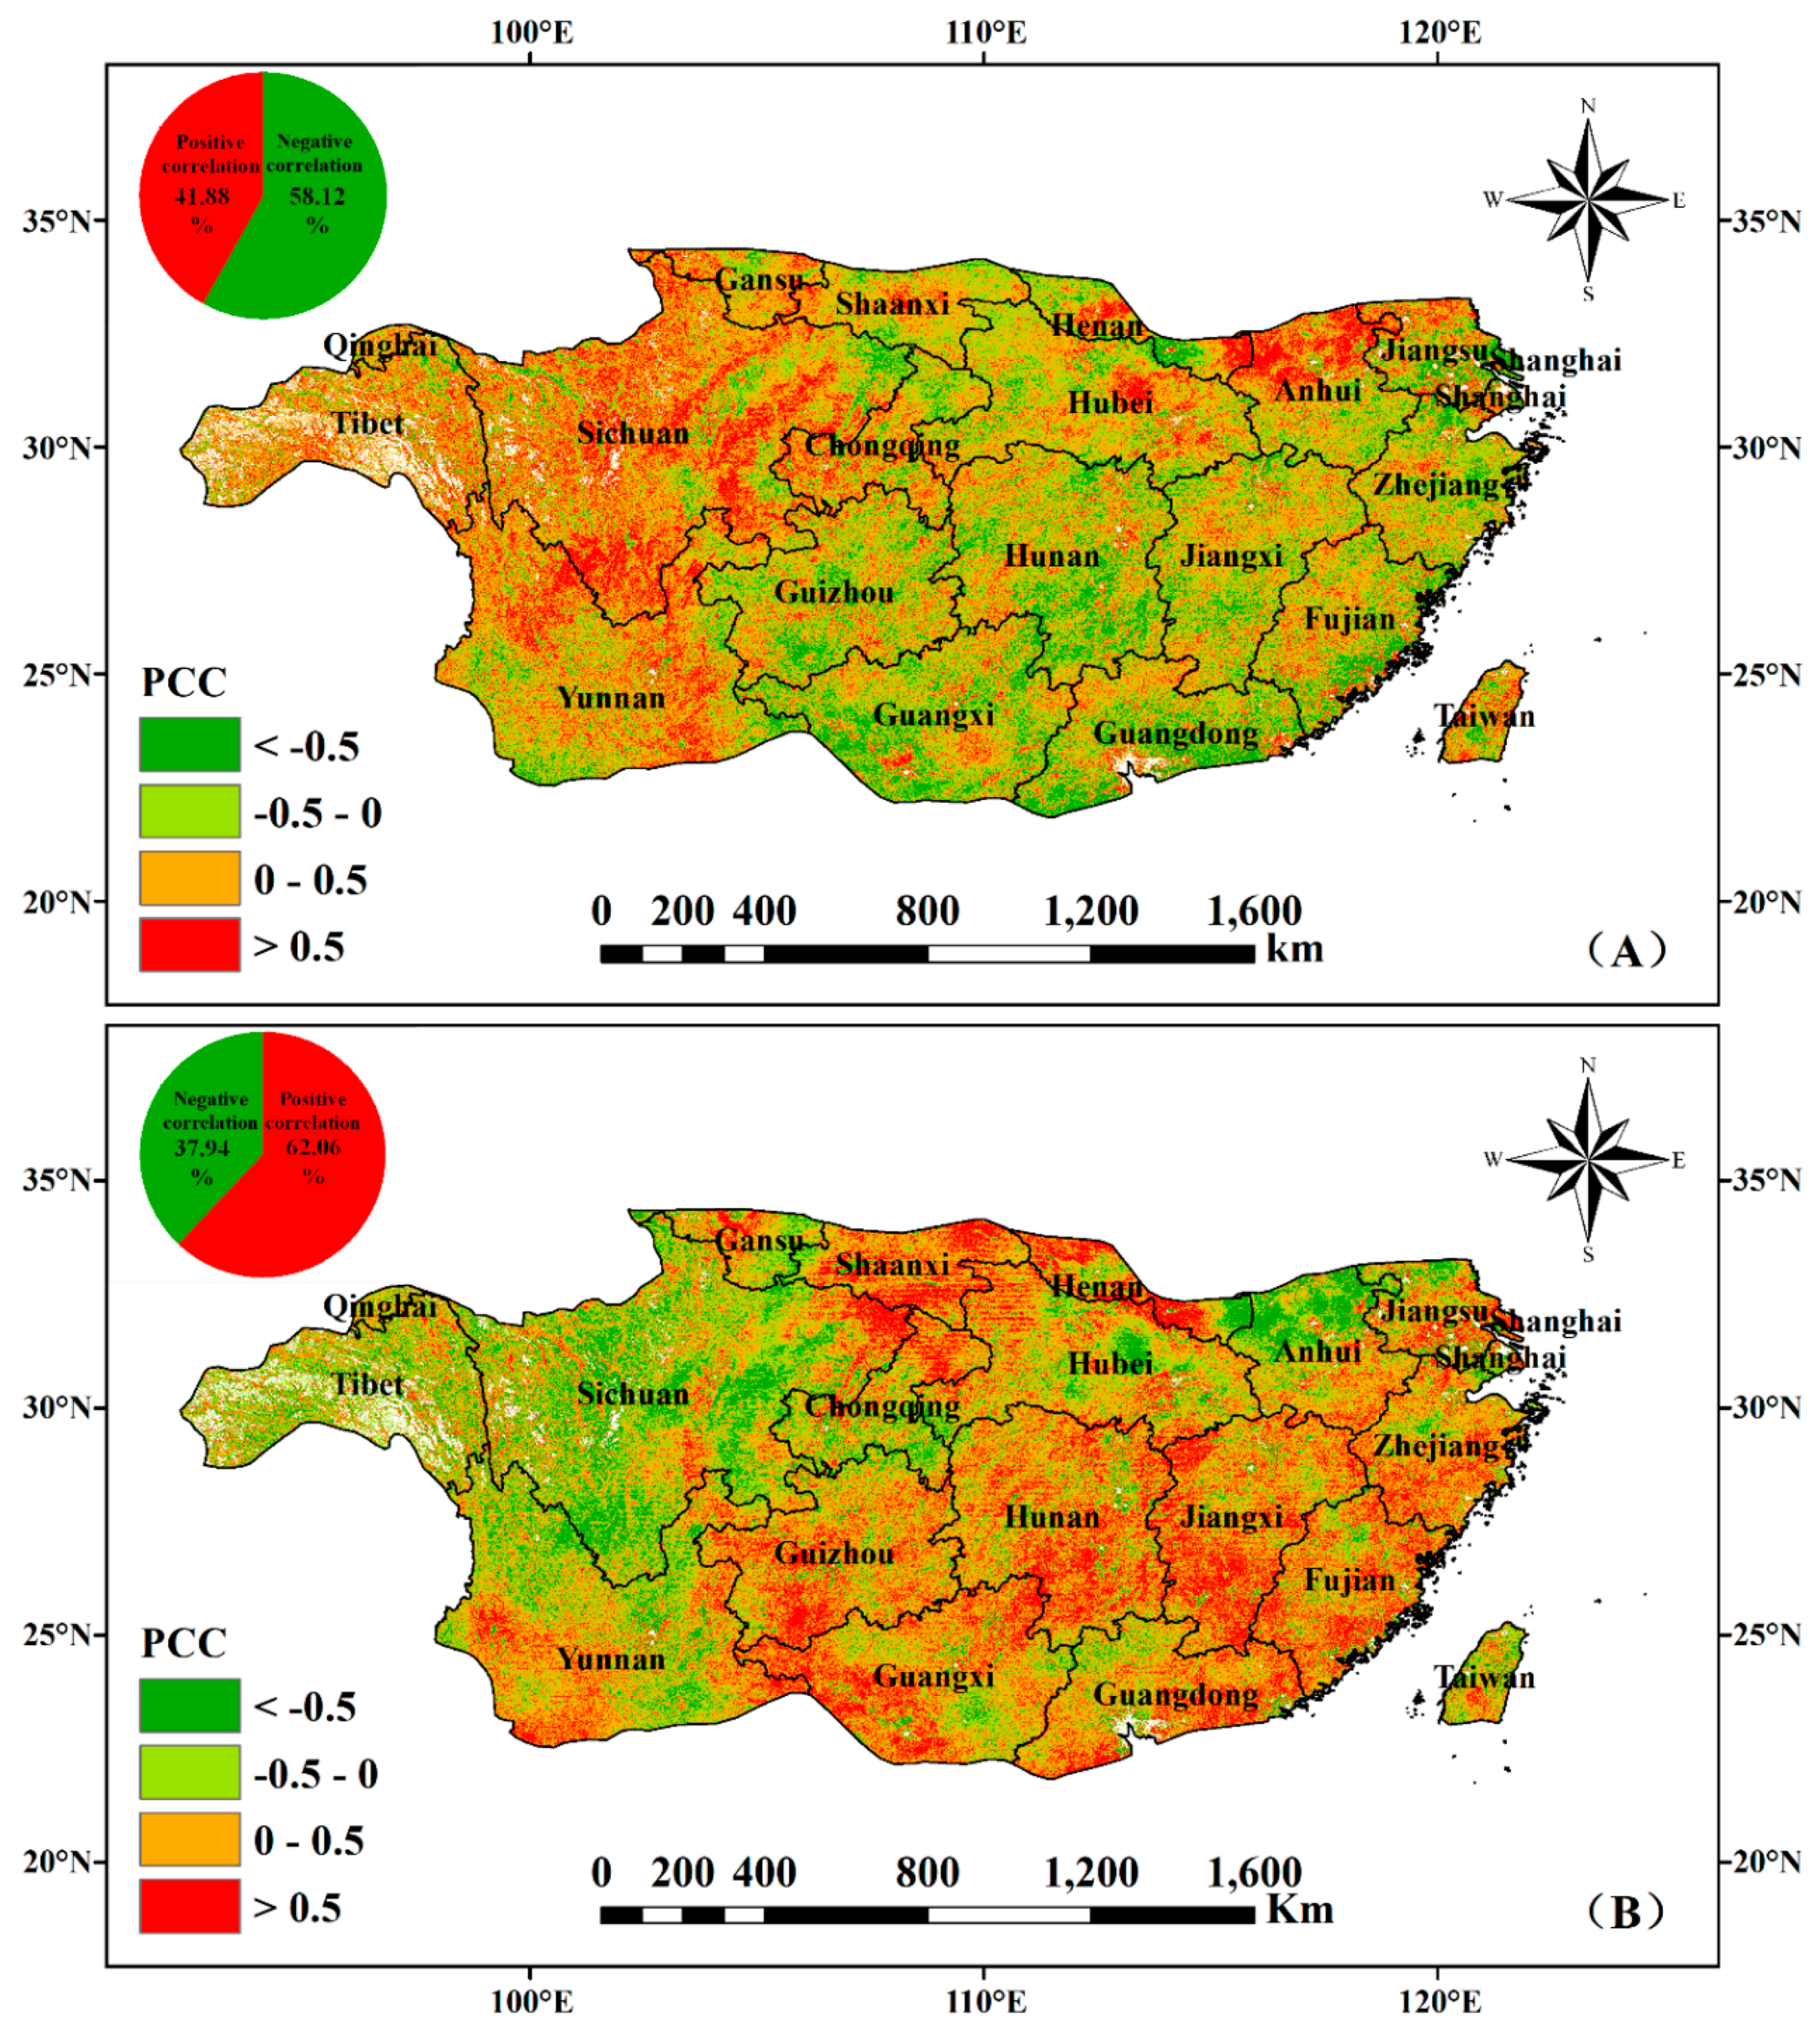
3.4.1. Partial Correlation between FVC and Temperature

Figure 6A shows the spatial distribution of the PCC between the subtropical FVC and Tmax. From 2001 to 2018, the PCC between the subtropical FVC and Tmax ranged mostly from −0.50 to 0.39, and the average PCC was −0.05; the overall relationship was a nonsignificant negative correlation, which indicated that high temperature somewhat inhibited the growth and development of vegetation in the subtropical region. The area where the subtropical FVC was positively correlated with Tmax made up 41.88% of the study area, while 58.12% of the FVC in the area showed a negative correlation with Tmax. Areas of significant (P < 0.05) positive correlation and significant (P < 0.05) negative correlation accounted for only 2.31% and 4.21% of the study area, respectively.
Figure 6A shows that the partial correlation between FVC and Tmax in the central and eastern of the subtropical region was mostly negative, while the partial correlation in the western region was mostly positive. The statistical analysis of the PCC between the FVC and Tmax in 20 provinces and cities in the subtropical region showed that the FVC in Guangdong, Guangxi, Hunan, Zhejiang, Shanghai, Guizhou, and other regions had a high partial correlation with Tmax during the study period; among them, the FVC in Anhui, Gansu, Sichuan, Tibet, and Yunnan generally showed a weak positive correlation with Tmax, while the FVC in the rest of the subtropical region showed an overall negative correlation with Tmax.
The spatial distribution of the PCC between the subtropical FVC and Tmin from 2001 to 2018 is shown in Figure 6B. Figure 6B shows that the PCC between the FVC and Tmin was distributed mostly between -0.30 and 0.52, with an average PCC of 0.09. The proportion of the study area with a positive correlation between the FVC and Tmin was 62.06%, the proportion with a significant (P < 0.05) positive correlation was 8.46%; the proportion with a negative correlation was 37.94%, and proportion with a significant (P < 0.05) negative correlation was only 2.34%. This indicated that the influence of Tmin on the FVC in the subtropical region was mainly a positive correlation; this is, an increase in Tmin promotes vegetative growth and development in most areas of the subtropical region, resulting in an increase in the FVC.
Comparing and analyzing Figure 6A,B reveals that the partial correlations between the subtropical FVC and Tmin and Tmax showed opposite spatial distribution patterns. Among them, the partial correlation between the FVC and Tmin in the central and eastern regions was greater than that in the western region, and the partial correlation in the central and eastern regions was mostly positive. The area of negative correlation was mainly distributed in Sichuan Province, northern Anhui Province, Tibet Autonomous Region, Yunnan Province, and other regions. The statistical analysis of the PCC values in the various provinces and cities showed that, except for the partial correlation of Anhui, Tibet, and Sichuan, which was negative overall, the partial correlation between FVC and Tmin in the rest of the subtropical provinces and cities was positive.

3.4.2. Partial Correlation between FVC and Precipitation

The spatial distribution of the PCC of the FVC and Pre is shown in Figure 7. Figure 7 shows that the PCC of the subtropical FVC and Pre from 2001 to 2018 was mostly in the range of −0.37 to 0.44, and the average PCC was 0.04. The areas with positive correlations and negative correlations accounted for 55.26% and 44.74% of the entire study area, respectively, while the areas with significant (P < 0.05) positive correlations and significant (P < 0.05) negative correlations accounted for 3.93% and 2.40%, respectively.
Figure 7 shows that the partial correlation between the subtropical FVC and Pre varied within the study area and presented an overall spatial distribution pattern of "high in the middle and low at both ends". The FVC in the central of the subtropical region was mostly positively correlated with Pre, while negative correlation areas were mainly distributed in the southeast of the subtropical region. According to the statistical results for the PCC in various provinces and cities, the partial correlation between the FVC and Pre in Jiangsu, Guangdong, Fujian, Jiangxi, and Shanghai was negative overall. Except for these five regions, the FVC of other provinces and cities in the subtropical region was positively correlated with Pre.

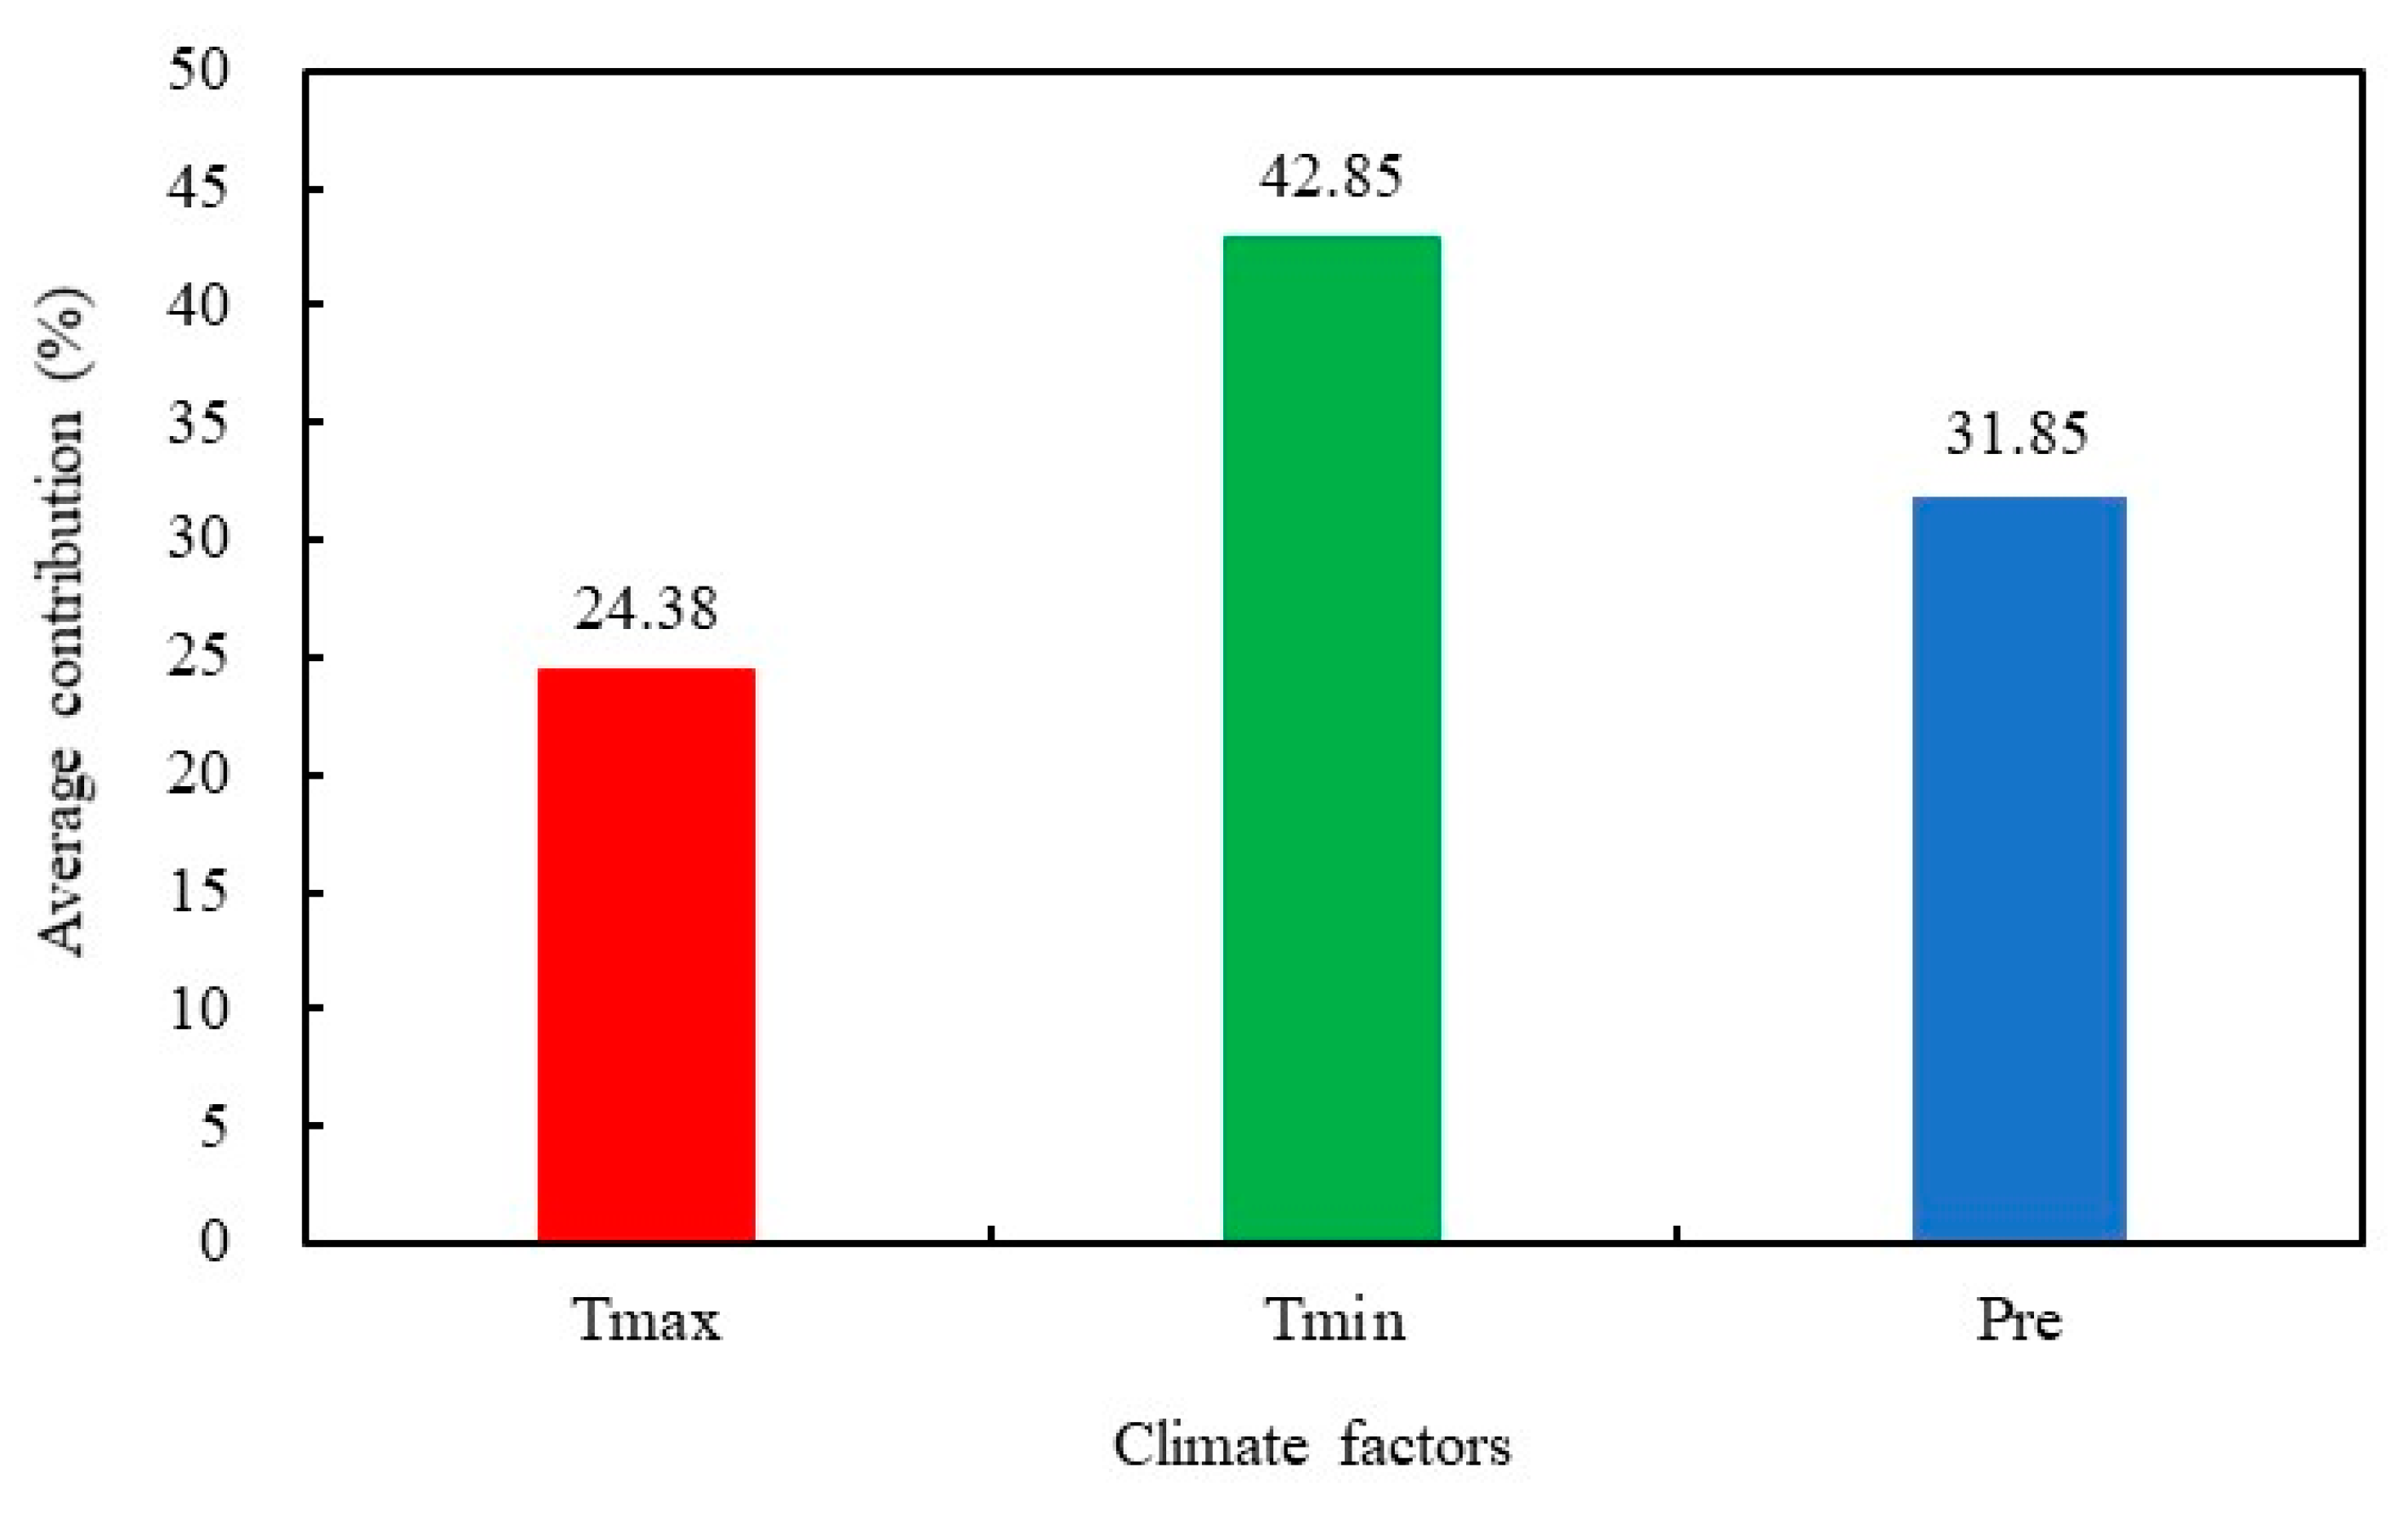
3.4.3. The Contributions of Climate Factors to the Subtropical FVC Variations

In order to further analyze the spatial differences in the contributions of climate factors to FVC variations in subtropical regions, the relative contributions of climate factors (Tmax, Tmin, and Pre) to FVC variations were calculated using the partial derivative model, respectively, as shown in Figure 8A–C. The relative contributions of different climate factors to FVC variations in various subtropical regions has significant differences. The value of the relative contribution was linearly stretched to 0–255 based on Figure 8A–C, and RGB synthesis was performed on the stretched the relative contribution values of Tmax, Tmin, and Pre to FVC variations. In this way, the main climate contributing factor of FVC variations in each subtropical region were obtained, as shown in Figure 8D. Pre was the main contribution factor of FVC variation in Shanghai, northern Zhejiang, central Anhui and eastern Sichuan; Tmax was the main contribution factor of FVC variation in Guangdong, eastern Guangxi, northern Yunnan; Tmin was the main contribution factor of FVC variation in the central, southeast and southwest of the subtropical region. In addition, the variation of FVC in some regions was affected by the synthesis of multiple climate factors. for example, the variation of FVC in Taiwan province was jointly affected by the Tmax and Pre; FVC variation in southern Sichuan was affected comprehensively by Tmax, Tmin, and Pre.
The average relative contributions of climate factors to FVC variations were further calculated based on Figure 8A–C, and the result was shown in Figure 9. Tmin had the highest contribution to the subtropical FVC variations with 42.85%, while the average relative contributions of Pre and Tmax were 31.85% and 24.38%, respectively. This indicated that Tmin played a leading role in FVC variations of the subtropical region, which is also consistent with the results of partial correlation analysis.

4. Discussion

Used the dimidiate pixel model based on NDVI can simply and effectively estimate the FVC in the subtropical region and realize the dynamic monitoring of FVC variations. In this study, the interannual variation in the annual average subtropical FVC showed a significant growth trend from 2001 to 2018. This growth is related to the forestry engineering initiatives that were successively implemented in China at the beginning of this century, such as the Natural Forest Protection Project, the Grain for Green Project, and Constructing Shelterbelt System, etc. [61]. The implementation of relevant policies effectively protected forest vegetation; shifted land use in the subtropical region to forestland, cultivated land and grassland; and increased the area of forest vegetation [61,62,63], thus promoting the growth of FVC in the subtropical region. Of course, as shown in Figure 4, there were also certain fluctuations in the annual average FVC. The growth rate of the subtropical FVC from 2008 to 2012 was lower than the average level, which may be related to the natural large-scale low-temperature, rain, snow, and ice disaster in southern China in January 2008. Extreme climate change such as this low-temperature rain, snow, and ice disaster seriously affected FVC in the subtropical region [64]. For example, accounted for 23.87% (0.0453 billion hm2) of the total forestry area was affected in Hunan Province [65]; the forest coverage rate decreased by 0.81% in Guizhou Province [66]; approximately 77.07% of bamboo forests were damaged in Zhejiang Province; and more than 80% of moso bamboo and 70% of Pinus elliottii were essentially destroyed in Jiangxi Province, which is consistent with reports by our results.
In this study, the overall degree of FVC fluctuation in the subtropical region was relatively stable in the past 20 years. On the one hand, this is because forestland and cultivated land take up more area than the various other vegetation types in the subtropical region. Of these, forestland mostly grow in mountainous and hilly areas with higher elevations and less human disturbance, and the planting density and structure of cultivated land are generally the same every year. Therefore, the interannual variation in subtropical FVC from 2001 to 2018 exhibited small fluctuations, mostly low- and lower fluctuations. On the other hand, the FVC in some regions, such as Qinghai, was so low that the variations and fluctuations throughout the research period were not significant, and the overall performance of FVC was relatively stable. The average value of FVC in Qinghai Province was 0.38, and the areas of low- and lower fluctuations in the region made up more than 70% of the total area, while the area of high fluctuation accounted for only 2.57%.
So far, there have been several studies on quantitatively analyzing the influence of climate factors on FVC based on the partial correlation analysis method and the partial derivative model at the pixel scale [4,45,59], and their studies showed that variations of FVC were affected by many factors (e.g. temperature, precipitation, vegetation species, and urbanization, etc.). In our study, the influences and contributions of climate factors (Tmax, Tmin, and Pre) on FVC in the subtropical region were quantitatively calculated, and presented obvious spatial heterogeneity (Figure 6, Figure 7 and Figure 8). There were differences in the impact of Tmin on the FVC within the western of the subtropical region. Tmin had a positive effect on FVC in Gansu and southwest Yunnan Province, while Tmin had a negative effect on FVC in Tibet and west Sichuan Province (Figure 6B). Tmin and the altitude are lower and higher in Tibet and west Sichuan Province than those in Gansu and southwest Yunnan Province, respectively (Figure 1). Therefore, lower Tmin inhibits the growth and development of vegetation in high altitude regions.
At the same time, the impact of Pre on the FVC within the eastern of the subtropical region also exhibited significant differences. The economic development in the eastern part of the subtropical region is strong, but the level of urbanization and industrialization varies from region to region. Intense human activities trigger problems such as urban micro-climates and land use changes etc. [67], which will cause an obvious difference in the impact of FVC. In addition, the eastern coastal areas are affected by typhoons and other natural disasters. For example, Shobairi et al. [68] found that the FVC in Guangdong Province was negatively correlated with the annual precipitation from 2000 to 2010, and the research results of He et al. [69] showed that the FVC in Zhejiang Province was significantly positively correlated with precipitation, which was basically consistent with our research results.
In this study, we analyzed only the influence of temperature and precipitation to subtropical FVC variations but failed to consider the impact of human activities, topography, social economy and other factors on FVC. In addition, vegetation type, soils and other factors will also have an impact on the results of the partial correlation between the FVC and temperature and precipitation [58,59,70]. The mechanisms by which the driving factors influence FVC are complex, and FVC variation also exhibits a certain time-lag effect. Therefore, we can combine more complete and detailed data to comprehensively analyze the FVC response mechanism to each driving factor on a longer time scale, which makes the results more practical and convincing in the future.

5. Conclusions

In this paper, the temporal and spatial variations of FVC were inverted in the subtropical region of China from 2001 to 2018 based on MODIS land surface reflectance data, and analyzed the influences and relative contributions of Tmax, Tmin, and Pre to FVC variations. The study showed that the overall vegetation growth coverage in the subtropical region of China from 2001 to 2018 was relatively high. The FVC high-coverage and medium-coverage zones had a wide distribution and their total area accounted for approximately 70% of the study area. The interannual variations and fluctuations in the subtropical FVC were relatively small overall, and the FVC generally maintained a relatively stable state and showed an obvious growth trend. Due to the influence of climate, topography, economic development and other factors, there were regional differences in the level of FVC as well as in its variation trend and fluctuation range. In some regions with greater economic development and more human activity, the FVC showed a downward trend, while the FVC in the rest of the region showed an increasing trend. The result also showed that climate change was a driver of the temporal and spatial dynamic evolutions of FVC in the subtropical region, and there were obvious regional differences in the driving effects. 62.06% and 55.26% of the region exhibited Tmin and Pre had positive effect on FVC, while more than half of the areas (58.12%) presented Tmax had negative effect on FVC. The contributions of climate changes to FVC had obvious heterogeneity, and Tmin played a leading role in the dynamic variations of FVC, which is consistent with the results of partial correlation analysis.
Therefore, the impacts of various driving factors on the growth and development of vegetation in the various subtropical regions of China should be comprehensively considered in the future to reasonably plan urban development and land resource utilization based on the local climate, topography, and economic development status, etc. At the same time, the structure of forestry and agriculture in each region should be adjusted in accordance with local conditions, and ecological environmental engineering should be correctly carried out to promote sustainable development and productivity improvement in the subtropical region and even global vegetation.

Author Contributions

Conceptualization, H.D.; Data curation, H.L., X.L. and F.M.; Formal analysis, H.L. and X.L.; Funding acquisition, H.D.; Investigation, H.L., M.Z., D.Z., S.H. and Z.H.; Methodology, H.L.; Project administration, H.D.; Resources, X.L. and F.M.; Writing—original draft, H.L.; Writing—review & editing, H.D. and X.L. All authors have read and agreed to the published version of the manuscript.

Funding

This research was funded by the National Natural Science Foundation (No. U1809208, 31670644, 31901310), the State Key Laboratory of Subtropical Silviculture (No. ZY20180201), and the Zhejiang Provincial Collaborative Innovation Center for Bamboo Resources and High-efficiency Utilization (No. S2017011).

Acknowledgments

The authors gratefully acknowledge the supports of various foundations. The authors are grateful to the Editor and anonymous reviewers whose comments have contributed to improving the quality.

Conflicts of Interest

The authors declare that they have no competing interests.

References

  1. Zhu, C.; Peng, W.F.; Zhang, L.F.; Luo, Y.; Dong, Y.B.; Wang, M.F. Study of temporal and spatial variation and driving force of fractional vegetation cover in upper reaches of Minjiang River from 2006 to 2016. Acta Ecol. Sin. 2019, 39, 1583–1594. [Google Scholar]
  2. Zhang, X.; Liao, C.; Li, J.; Sun, Q. Fractional vegetation cover estimation in arid and semi-arid environments using HJ-1 satellite hyperspectral data. Int. J. Appl. Earth Obs. Geoinf. 2013, 21, 506–512. [Google Scholar] [CrossRef]
  3. Zhang, X.L.; Zhang, Y.; Niu, D.K. Spatial-temporal dynamics of upland meadow coverage on Wugong Mountain based on TM NDVI. Acta Ecol. Sin. 2018, 38, 2414–2424. [Google Scholar]
  4. Mu, S.J.; Li, J.L.; Chen, Y.Z.; Gang, C.; Zhou, W.; Ju, W.M. Spatial Differences of Variations of Vegetation Coverage in Inner Mongolia during 2001–2010. Acta Geogr. Sin. 2012, 67, 1255–1268. [Google Scholar]
  5. Wang, Q.; Zhang, Q.P.; Zhou, W. Grassland Coverage Changes and Analysis of the Driving Forces in Maqu County. Phys. Procedia 2012, 33, 1292–1297. [Google Scholar] [CrossRef] [Green Version]
  6. Shen, Y.P.; Wang, G.Y. Key Findings and Assessment Results of IPCC WGI Fifth Assessment Report. J. Glaciol. Geocryol. 2013, 35, 1068–1076. [Google Scholar]
  7. Kang, M.C.; Zhu, L.P.; Xu, H.; Zha, T.G.; Zhang, Z.Q. Modelling the responses of carbon and water fluxes with climate change for a poplar plantation in northern China based on the Biome-BGC model. Acta Ecol. Sin. 2019, 39, 2378–2390. [Google Scholar]
  8. Rong, Z.L. Effects of Climate Change on Distribution of Dominant Species and Pattern of Vegetation in Qilian Mountains. Ph.D. Thesis, Lanzhou University, Lanzhou, China, 2019. [Google Scholar]
  9. Wu, Y.Z. Analysis of vegetation pattern change under the background of global climate change. China South. Agric. Mach. 2020, 51, 85. [Google Scholar]
  10. Jin, K. Spatio-Temporal Variations of Vegetation Cover and Its Relationships between Climate Change and Human Activities over China. Ph.D. Thesis, Northwest A & F University, Yangling, China, 2019. [Google Scholar]
  11. Dai, S.W.; Ni, Y. Analysis of Climate Change and Sustainable Development Based on the Fifth IPCC Assessment Report. J. Jiangsu Second Norm. Univ. Nat. Sci. 2014, 30, 12–14. [Google Scholar]
  12. Ye, D.Z.; Yan, Z.W.; Ma, Z.G. Addressing Climate Change for Sustainable Development. Bull. Chin. Acad. Sci. 2012, 27, 332–336. [Google Scholar]
  13. Yan, J.; Wang, Y.; Zhou, G.; Zhang, D. Estimates of soil respiration and net primary production of three forests at different succession stages in South China. Glob. Chang. Biol. 2006, 12, 810–821. [Google Scholar] [CrossRef]
  14. Piao, S.; Fang, J.; Ciais, P.; Peylin, P.; Huang, Y.; Sitch, S.; Wang, T. The carbon balance of terrestrial ecosystems in China. Nature 2009, 458, 1009–1013. [Google Scholar] [CrossRef]
  15. Fang, J.Y.; Yu, G.R.; Ren, X.B.; Liu, G.H.; Zhao, X.Q. Carbon Sequestration in China’s Terrestrial Ecosystems under Climate Change–Progress on Ecosystem Carbon Sequestration from the CAS Strategic Priority Research Program. Bull. Chin. Acad. Sci. 2015, 30, 848–857. [Google Scholar]
  16. Li, J.; Zhang, J.; Liu, C.L.; Yang, X.C. Spatiotemporal Variation of Vegetation Coverage in Recent 16 Years in the Border Region of China, Laos, and Myanmar Based on MODIS-NDVI. Sci. Silvae Sin. 2019, 55, 9–18. [Google Scholar]
  17. Barati, S.; Rayegani, B.; Saati, M.; Sharifi, A.; Nasri, M. Comparison the accuracies of different spectral indices for estimation of vegetation cover fraction in sparse vegetated areas. Egypt. J. Remote Sens. Space Sci. 2011, 14, 49–56. [Google Scholar] [CrossRef] [Green Version]
  18. Zhao, T.; Bai, H.Y.; Deng, C.H.; Meng, Q.; Guo, S.Z.; Qi, G.Z. Topographic differentiation effect on vegetation cover in the Qinling Mountains from 2000 to 2016. Acta Ecol. Sin. 2019, 39, 4499–4509. [Google Scholar]
  19. Zhang, B.; Mou, J.X.; Xu, L.; Ma, X.G. Spatial and Temporal Variation of Vegetation Coverage in Mountain Area of Longnan: Based on MODIS EVI. Chin. Agric. Sci. Bull. 2017, 33, 70–77. [Google Scholar]
  20. Bannari, A.; Morin, D.; Bonn, F.; Huete, A.R. A review of vegetation indices. Remote Sens. Rev. 1995, 13, 95–120. [Google Scholar] [CrossRef]
  21. Tucker, C.J. Red and photographic infrared linear combinations for monitoring vegetation. Remote Sens. Environ. 1979, 8, 127–150. [Google Scholar] [CrossRef] [Green Version]
  22. Lamchin, M.; Park, T.; Lee, J.Y.; Lee, W.K. Monitoring of Vegetation Dynamics in the Mongolia Using MODIS NDVIs and their Relationship to Rainfall by Natural Zone. J. Indian Soc. Remote Sens. 2015, 43, 325–337. [Google Scholar] [CrossRef]
  23. Liu, X.; Pan, Y.; Zhu, X.; Li, S. Spatiotemporal variation of vegetation coverage in Qinling-Daba Mountains in relation to environmental factors. Acta Geogr. Sin. 2015, 70, 705–716. [Google Scholar]
  24. Yuan, L.H.; Jiang, W.G.; Shen, W.M.; Liu, Y.H.; Wang, W.J.; Tao, L.L.; Zheng, H.; Liu, X.F. The spatio-temporal variations of vegetation cover in the Yellow River Basin from 2000 to 2010. Acta Ecol. Sin. 2013, 33, 7798–7806. [Google Scholar]
  25. Chen, X.; Wang, H. Spatial and Temporal Variations of Vegetation Belts and Vegetation Cover Degrees in Inner Mongolia from 1982 to 2003. Acta Geogr. Sin. 2009, 64, 84–94. [Google Scholar]
  26. Li, H.W. Study on the Spatial-Temporal Change of Vegetation in Zhejiang Province. Master’s Thesis, Zhejiang Normal University, Jinhua, China, 2010. [Google Scholar]
  27. Imukova, K.; Ingwersen, J.; Streck, T. Determining the spatial and temporal dynamics of the green vegetation fraction of croplands using high-resolution RapidEye satellite images. Agric. For. Meteorol. 2015, 206, 113–123. [Google Scholar] [CrossRef]
  28. Chen, Y.L.; Luo, Y.M.; Mo, W.H.; Mo, J.F.; Huang, Y.L.; Ding, M.H. Differences between MODIS NDVI and MODIS EVI in Response to Climatic Factors. J. Nat. Resour. 2014, 29, 1802–1812. [Google Scholar]
  29. Li, Z.; Sun, R.; Zhang, J.C.; Zhang, C. Temporal-spatial analysis of vegetation coverage dynamics in Beijing-Tianjin-Hebei metropolitan regions. Acta Ecol. Sin. 2017, 37, 7418–7426. [Google Scholar]
  30. Peng, W.; Wang, G.J.; Zhou, J.M.; Xu, X.; Luo, H.; Zhao, J.; Yang, C. Dynamic monitoring of fractional vegetation cover along Minjiang River from Wenchuan County to Dujiangyan City using multi-temporal landsat 5 and 8 images. Acta Ecol. Sin. 2016, 36, 1975–1988. [Google Scholar]
  31. Li, D.K.; Fan, J.Z.; Wang, J. Change characteristics and their causes of fractional vegetation coverage (FVC) in Shaanxi Province. Chin. J. Appl. Ecol. 2010, 21, 2896–2903. [Google Scholar]
  32. Dong, D.W.; Halik, A.; Wang, D.W.; Tian, S.Y. Spatio-temporal variations in vegetation cover in Hotan Oasis from 1994 to 2016. Acta Ecol. Sin. 2019, 39, 3710–3719. [Google Scholar]
  33. Li, Y.; Ding, J.; Zhang, J.; Wu, P. Response of vegetation cover to drought in the northern slope of the Tianshan Mountains during 2001–2015 based on the land-use and land-cover change. Acta Ecol. Sin. 2019, 39, 6206–6217. [Google Scholar]
  34. Gan, C.Y.; Wang, X.Z.; Li, B.S.; Liang, Z.X.; Li, Z.W.; Wen, X.H. Changes of Vegetation Coverage During Recent 18 Years in Lianjiang River Watershed. Sci. Geogr. Sin. 2011, 31, 1019–1024. [Google Scholar]
  35. Jing, X.; Yao, W.Q.; Wang, J.H.; Song, X.Y. A study on the relationship between dynamic change of vegetation coverage and precipitation in Beijing’s mountainous areas during the last 20 years. Math. Comput. Model. 2011, 54, 1079–1085. [Google Scholar] [CrossRef]
  36. Piao, S.; Mohammat, A.; Fang, J.; Cai, Q.; Feng, J. NDVI-based increase in growth of temperate grasslands and its responses to climate changes in China. Glob. Environ. Chang. 2006, 16, 340–348. [Google Scholar] [CrossRef]
  37. Xin, Z.B.; Xu, J.X.; Zheng, W. Spatiotemporal variations of vegetation cover on the Chinese Loess Plateau (1981–2006): Impacts of climate changes and human activities. Sci. China Ser. D Earth Sci. 2008, 51, 67–78. [Google Scholar] [CrossRef]
  38. Zhou, W.; Gang, C.C.; Li, J.L.; Zhang, C.B.; Mu, S.J.; Sun, Z.G. Spatial-temporal dynamics of grassland coverage and its response to climate change in China during 1982–2010. Acta Geogr. Sin. 2014, 69, 15–30. [Google Scholar]
  39. Wang, H.; Yao, F.; Zhu, H.; Zhao, Y. Spatiotemporal Variation of Vegetation Coverage and Its Response to Climate Factors and Human Activities in Arid and Semi-Arid Areas: Case Study of the Otindag Sandy Land in China. Sustainability 2020, 12, 5214. [Google Scholar] [CrossRef]
  40. Chuai, X.W.; Huang, X.J.; Wang, W.J.; Bao, G. NDVI, temperature and precipitation changes and their relationships with different vegetation types during 1998–2007 in Inner Mongolia, China. Int. J. Climatol. 2013, 33, 1696–1706. [Google Scholar] [CrossRef]
  41. Guo, L.; Wu, S.; Zhao, D.; Yin, Y.; Leng, G.; Zhang, Q. NDVI-Based Vegetation Change in Inner Mongolia from 1982 to 2006 and Its Relationship to Climate at the Biome Scale. Adv. Meteorol. 2014, 2014, 692068. [Google Scholar] [CrossRef]
  42. Liu, J.H.; Gao, J.X. Effects of climate and land use change on the changes of vegetation coverage in farming-pastoral ecotone of Northern China. Chin. J. Appl. Ecol. 2008, 19, 2016–2022. [Google Scholar]
  43. Sheng, R.; Wan, L.H. Evolution of vegetation coverage and its response to abrupt climate change in the Wuyi Mountains National Nature Reserve. Acta Ecol. Sin. 2019, 39, 3243–3256. [Google Scholar]
  44. Zhang, M.; Cao, C.X.; Chen, W. Remotely Sensed Diagnosing Temporal and Spatial Variation of Vegetation Coverage in Guangxi Based on MODIS NDVI Data. Sci. Silvae Sin. 2019, 55, 27–37. [Google Scholar]
  45. Zhou, Q.; Zhao, X.; Wu, D.; Tang, R.; Du, X.; Wang, H.; Zhao, J.; Xu, P.; Peng, Y. Impact of Urbanization and Climate on Vegetation Coverage in the Beijing–Tianjin–Hebei Region of China. Remote Sens. 2019, 11, 2452. [Google Scholar] [CrossRef] [Green Version]
  46. Li, S.Y.; Fang, X.; Chen, J.L.; Li, L.D.; Gu, X.; Liu, Z.D.; Zhang, S.J. Effects of different degrees of anthropogenic disturbance on biomass and spatial distribution in Subtropical forests in Central Southern China. Acta Ecol. Sin. 2018, 38, 6111–6124. [Google Scholar]
  47. Li, L.; Wei, S.; Lian, J.; Cao, H. Distributional regularity of species diversity in plant community at different latitudes in subtropics. Acta Ecol. Sin. 2020, 40, 1249–1257. [Google Scholar]
  48. Jonas, L.; Jean-Philippe, D.; Jan, V.; Gérard, B.; Véronique, C. Detecting clear-cuts and decreases in forest vitality using MODIS NDVI time series. Remote Sens. 2015, 7, 3588–3612. [Google Scholar]
  49. Bian, J.H.; Li, A.; Song, M.; Ma, L.; Jiang, J. Reconstruction of NDVI time-series datasets of MODIS based on Savitzky-Golay filter. J. Remote Sens. 2010, 14, 725–741. [Google Scholar]
  50. Zhang, C. Study on the Spatial-Temporal Change of Vegetation in Zhejiang Province and the Landscape Regeneration Design of Forest. Master’s Thesis, Zhejiang A & F University, Hangzhou, China, 2011. [Google Scholar]
  51. Cao, B.; Gruber, S.; Zhang, T. REDCAPP (v1.0): Parameterizing valley inversions in air temperature data downscaled from reanalyses. Geosci. Model Dev. 2017, 10, 2905–2923. [Google Scholar] [CrossRef] [Green Version]
  52. Gong, Z.; Zhao, S.; Gu, J. Correlation analysis between vegetation coverage and climate drought conditions in North China during 2001–2013. Acta Geogr. Sin. 2015, 70, 717–729. [Google Scholar] [CrossRef]
  53. Wang, Y.; Liu, Y.; Jin, J. Contrast Effects of Vegetation Cover Change on Evapotranspiration during a Revegetation Period in the Poyang Lake Basin, China. Forests 2018, 9, 217. [Google Scholar] [CrossRef] [Green Version]
  54. Purevdorj, T.; Tateishi, R.; Ishiyama, T.; Honda, Y. Relationships between percent vegetation cover and vegetation indices. Int. J. Remote Sens. 1998, 19, 3519–3535. [Google Scholar] [CrossRef]
  55. Ma, N.; Hu, Y.F.; Zhuang, D.F.; Zhang, X.L. Vegetation Coverage Distribution and Its Changes in Plan Blue Banner Based on Remote Sensing Data and Dimidiate Pixel Model. Sci. Geogr. Sin. 2012, 32, 251–256. [Google Scholar]
  56. Zhao, J.; Li, J.; Liu, Q.; Xu, B.; Yu, W.; Lin, S.; Hu, Z. Estimating fractional vegetation cover from leaf area index and clumping index based on the gap probability theory. Int. J. Appl. Earth Obs. Geoinf. 2020, 90, 102112. [Google Scholar] [CrossRef]
  57. Montandon, L.M.; Small, E.E. The impact of soil reflectance on the quantification of the green vegetation fraction from NDVI. Remote Sens. Environ. 2008, 112, 1835–1845. [Google Scholar] [CrossRef]
  58. Yang, R.R. Spatio-Temporal Variation of Vegetation Coverage and Its Response to Climate Change in the Source Region of the Yellow River from 2000 to 2017. Master’s Thesis, Chengdu University of Technology, Chengdu, China, 2019. [Google Scholar]
  59. Duo, A.; Zhao, W.J.; Gong, Z.N.; Zhang, M.; Fan, Y.B. Temporal analysis of climate change and its relationship with vegetation cover on the north China plain from 1981 to 2013. Acta Ecol. Sin. 2017, 37, 576–592. [Google Scholar]
  60. Xu, Y. Study on Dynamics of Vegetation Cover and Its Spatial-temporal Characteristics in Response to Climate Factors. Master’s Thesis, China University of Mining and Technology, Xuzhou, China, 2015. [Google Scholar]
  61. Yang, F. Assessment on the Suitability of Geographical Zone Feature for Six Forestry Programs in China. Master’s Thesis, Lanzhou Jiaotong University, Lanzhou, China, 2015. [Google Scholar]
  62. Deng, Y.J.; Hou, M.Y.; Xie, Y.F.; Gao, Q.; Yao, S.B.; Gong, Z.W.; Lu, Y.N.; Jia, L.; Li, Y.Y. Impact of the Grain for Green Project on the temporal and spatial evolution of ecosystem service value in northern Shaanxi. Acta Ecol. Sin. 2020, 40, 6597–6612. [Google Scholar]
  63. Deng, Y.J.; Yao, S.B.; Hou, M.Y.; Zhang, T.Y.; Lu, Y.N.; Gong, Z.W.; Wang, Y.F. Assessing the effects of the Green for Grain Program on ecosystem carbon storage service by linking the InVEST and FLUS models: A case study of Zichang county in hilly and gully region of Loess Plateau. J. Nat. Resour. 2020, 35, 826–844. [Google Scholar]
  64. Lieke, Z. Impact of Serious Disaster on Forestry and Ideas of Restoration and Reconstruction. For. Econ. 2008, 3, 3–7. [Google Scholar]
  65. Liu, L.F.; Xiao, Z.C.; Liu, P.L.; Tan, Q.S.; He, H.B. Assessment about Loss Caused by Frozen Disaster and Measures of Disaster Prevention and mitigation on Forestry—A Case Study of Hunan Province in 2008. Res. Agric. Mod. 2009, 30, 195–198. [Google Scholar]
  66. Nie, C.J. A Study on Forestry Disaster Caused by Low-temperature & Sleet and Countermeasures in Guizhou Province. Guizhou For. Sci. Technol. 2008, 36. Available online: https://xueshu.baidu.com/usercenter/paper/show?paperid=8ed2be6a438b4706c89f2f8a5b2b7825 (accessed on 29 January 2021).
  67. Zhang, B.B. Research on the Impact of Urban Construction of Jinan on Urban Climate and Countermeasures. In Proceedings of the Annual National Planning Conference 2016, Shenyang, China, 24–26 September 2016. [Google Scholar]
  68. Shobairi, S.O.; Rong, Y.; Li, M.Y.; Yang, X.X.; Sun, X. Analysis of Spatial-temporal Dynamics and Driving Factors of Vegetation Fractional Coverage in Guangdong Province. J. Southwest For. Univ. 2017, 37. Available online: https://xueshu.baidu.com/usercenter/paper/show?paperid=a0c8cda51a2c2b2984458a5da6d59fea (accessed on 29 January 2021).
  69. He, Y.; Fan, G.; Zhang, X.; Liu, M.; Gao, D. Variation of vegetation NDVI and its response to climate change in Zhejiang Province. Acta Ecol. Sin. 2012, 32, 4352–4362. [Google Scholar] [CrossRef]
  70. Pang, G.W.; Shan, L.X.; Yang, Q.K.; Tu, X. Spatial and temporal variation characteristics of vegetation coverage and its influencing factor in different landforms of Shaanxi province. J. Yangtze River Sci. Res. Inst. 2021, 1–12. [Google Scholar]
Figure 1. Location of study area: (A) digital elevation model (DEM), the spatial distribution of (B) Tmax, (C) Tmin, and (D) Pre in the subtropical region from 2001 to 2018.
Remotesensing 13 00913 g001
Figure 2. Spatial distribution of the subtropical fractional vegetation cover (FVC) from 2001 to 2018.
Remotesensing 13 00913 g002
Figure 3. The variation trends of various FVC classes in the subtropical region from 2001 to 2018.
Remotesensing 13 00913 g003
Figure 4. The variation trend of subtropical FVC from 2001 to 2018.
Remotesensing 13 00913 g004
Figure 5. Spatial distribution of (A) the mean value, (B) trend slope, (C) significant changes, and (D) stability of the subtropical FVC from 2001 to 2018.
Remotesensing 13 00913 g005
Figure 6. Spatial distribution of partial correlation coefficient (PCC) values between the subtropical FVC and (A) Tmax and (B) Tmin from 2001 to 2018.
Remotesensing 13 00913 g006
Figure 7. Spatial distribution of PCC values between the subtropical FVC and Pre from 2001 to 2018.
Remotesensing 13 00913 g007
Figure 8. The spatial distribution of the relative contributions of (A) Tmax, (B) Tmin, and (C) Pre to the dynamic variations of subtropical FVC from 2001 to 2018, and (D) the spatial distribution of the main contribution factors of climate factors to FVC.
Remotesensing 13 00913 g008
Figure 9. The average relative contributions of Tmax, Tmin, and Pre to FVC variations in the subtropical region.
Remotesensing 13 00913 g009
Publisher’s Note: MDPI stays neutral with regard to jurisdictional claims in published maps and institutional affiliations.

