3.1. Correlation between Hybrid Classes, Backscatter and Slope
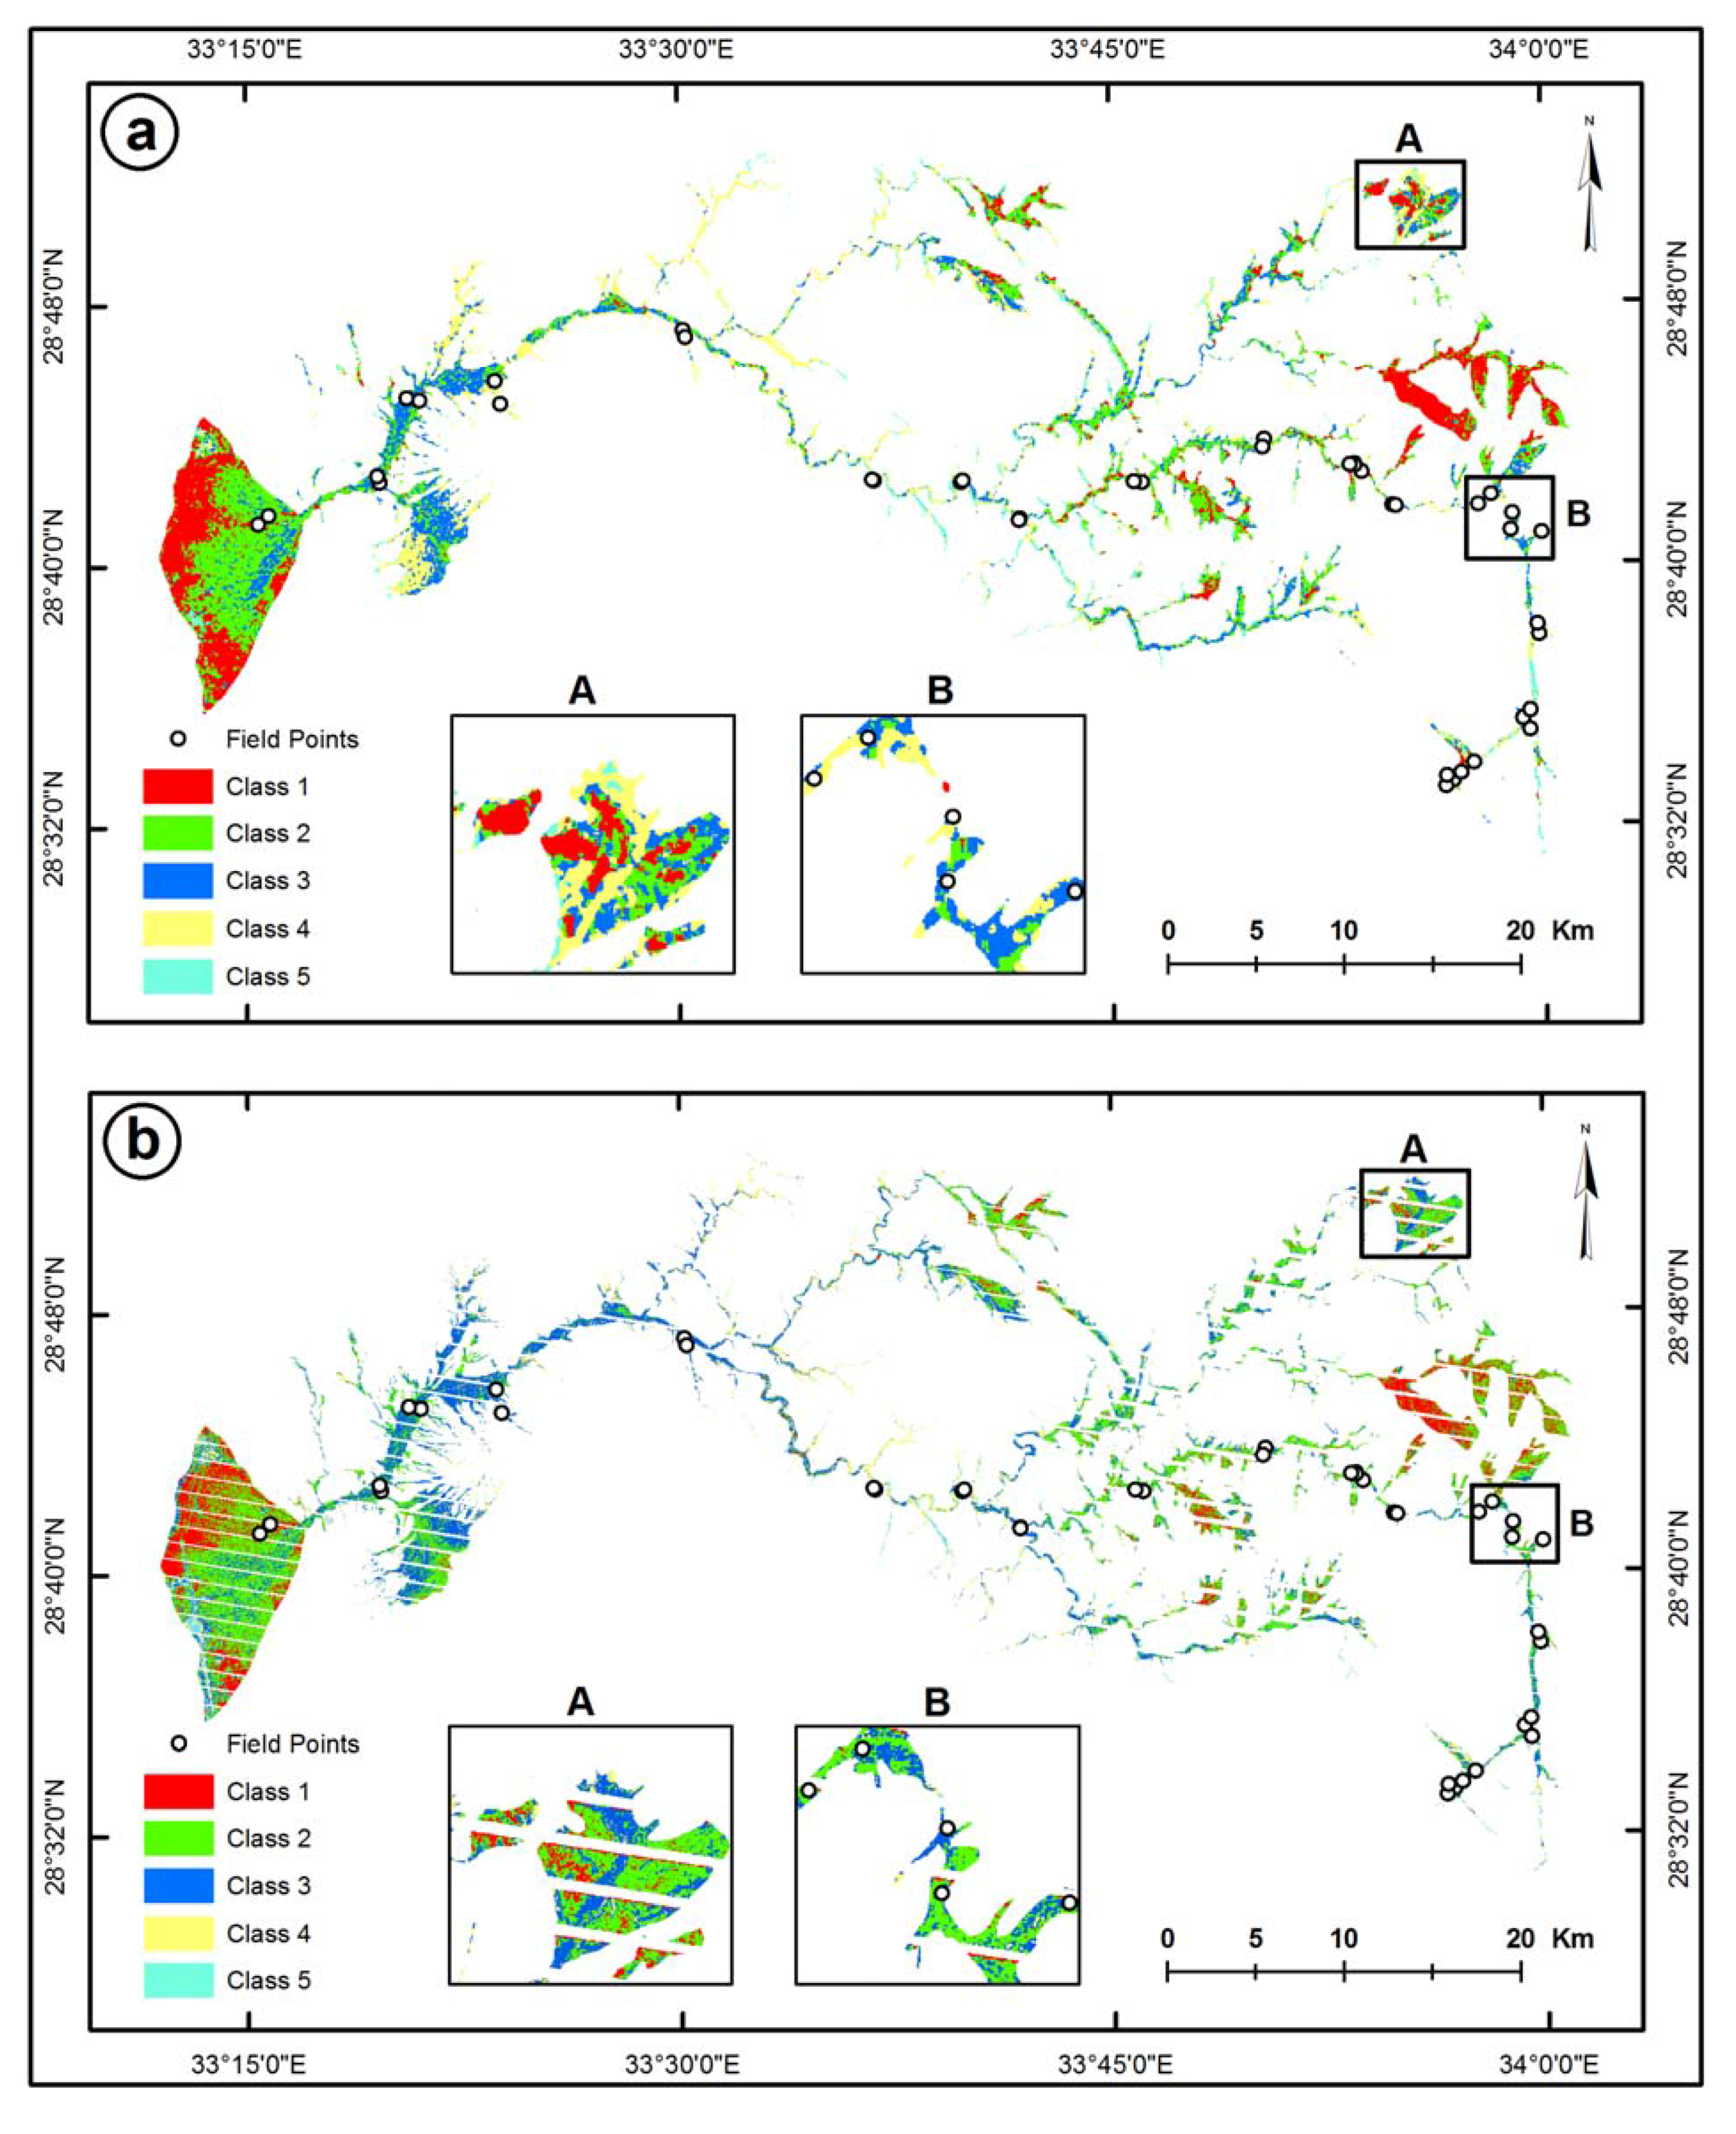
The five resulting classes of the ETM+/Radarsat-1 and ETM+/PALSAR fused images were checked in the field in order to determine their nature (
Figure 3). It was concluded that the clusters in the classified hybrid image respond primarily to the amount of backscatter (due to the SAR component) and to a lesser extent to variations in hue and saturation (due to the ETM+ component). The colors assigned to the individual classes in
Figure 3 are: class 1 (red), class 2 (green), class 3 (blue), class 4 (yellow) and class 5 (cyan). Each of the classes was overlain on previously geocoded and calibrated Radarsat-1 and PALSAR data and used to determine the range of backscatter coefficient values (sigma expressed in decibels (dB)) and their respective range/mean/standard deviation corresponding to each class (
Table 1). The SAR calibration was performed using commercial software [
9] for the Radarsat-1 data and a public domain software [
19] for the PALSAR data. In both cases the original 16-bit raw data was converted to radar backscatter coefficient sigma nought (σ0) using the SRTM DEM for calculating the local incidence angle. Calibration followed by geocoding of the raw SAR data was a necessary step in this part of the analysis since both data sets were to be compared to each other and correlated with field information.
Table 1 shows that the median σ0 values of Radarsat-1 and PALSAR increase from class 1(red) to class 5 (cyan); however, their values differ as PALSAR shows consistently lower (weaker) backscatter values than Radarsat-1 (
Table 2). In addition, the five classes from the unsupervised classification fall within well-defined data ranges that show overlapping class boundaries but have very distinct mean values. The data range overlap is mainly due to the fact that classes represent not only textural but also spectral information, and are, thus, hybrid classes.
Figure 6.
Correlation between the output classes of ETM+/Radarsat-1 hybrid image and slope (a), and fraction maps of image endmembers (b, c, d, e, and f).
Figure 6.
Correlation between the output classes of ETM+/Radarsat-1 hybrid image and slope (a), and fraction maps of image endmembers (b, c, d, e, and f).
The results in
Table 1 and
Table 2 suggest that class 5 (cyan) represents surface types with the highest surface roughness and thus the strongest backscatter signal (
i.e., wadi deposits with very coarse grains and rock fragments) than any of the other four classes. On the other hand, class1 (red) represents the smoothest surface type (very fine grains) within the alluvial areas of Wadi Feiran basin and shows generally weak backscatter signals (low σ0 values) in both radar data sets. Class 2 (green), class 3 (blue) and class 4 (yellow) represent surfaces with gradually increasing roughness or backscatter coefficient values and are situated between the smoothest class 1 and the roughest class 5 (
Table 2). Spatially, the distribution of the five classes does not show any significant correlation with elevation, meaning no clear spatial pattern can be recognized along the basin from its upstream portion in Saint Katrine (east) to its downstream outlet in Gulf of Suez (west), except for class 5 which is persistently found along short, steep tributaries and urban areas. However, there seems to be some spatial correlation between the hybrid image classes (
Figure 3) and slope (
Figure 5) with higher class numbers tending to occur at steeper slopes (further explored later in the text).
Table 1.
Backscatter statistics (in dB) of Radarsat-1 (C-band) and PALSAR (L-band) data for each of the classes produced by unsupervised classification of the respective hybrid images.
Table 1.
Backscatter statistics (in dB) of Radarsat-1 (C-band) and PALSAR (L-band) data for each of the classes produced by unsupervised classification of the respective hybrid images.
| CLASSES | RADARSAT-1 | PALSAR |
|---|
| | Range | Mean | STD | Range | Mean | STD |
| Class1 (red) | −16.2 to −10.2 | −13.11 | 2.68 | −22.0 to −17.6 | −19.81 | 1.40 |
| Class2 (green) | −13.9 to −8.2 | −10.95 | 2.46 | −19.6 to −15.2 | −17.32 | 1.38 |
| Class3 (blue) | −12.3 to −6.4 | −9.25 | 2.50 | −16.3 to −11.4 | −13.87 | 1.50 |
| Class4 (yellow) | −11.2 to −4.1 | −7.46 | 2.94 | −12.38 to −5.77 | −9.30 | 2.04 |
| Class5 (cyan) | −10.9 to 0.8 | −5.52 | 4.52 | −6.14 to 6.37 | −4.04 | 3.90 |
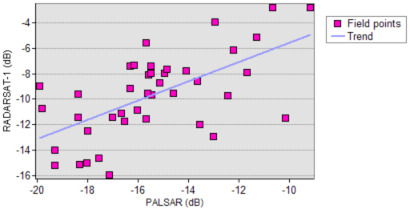
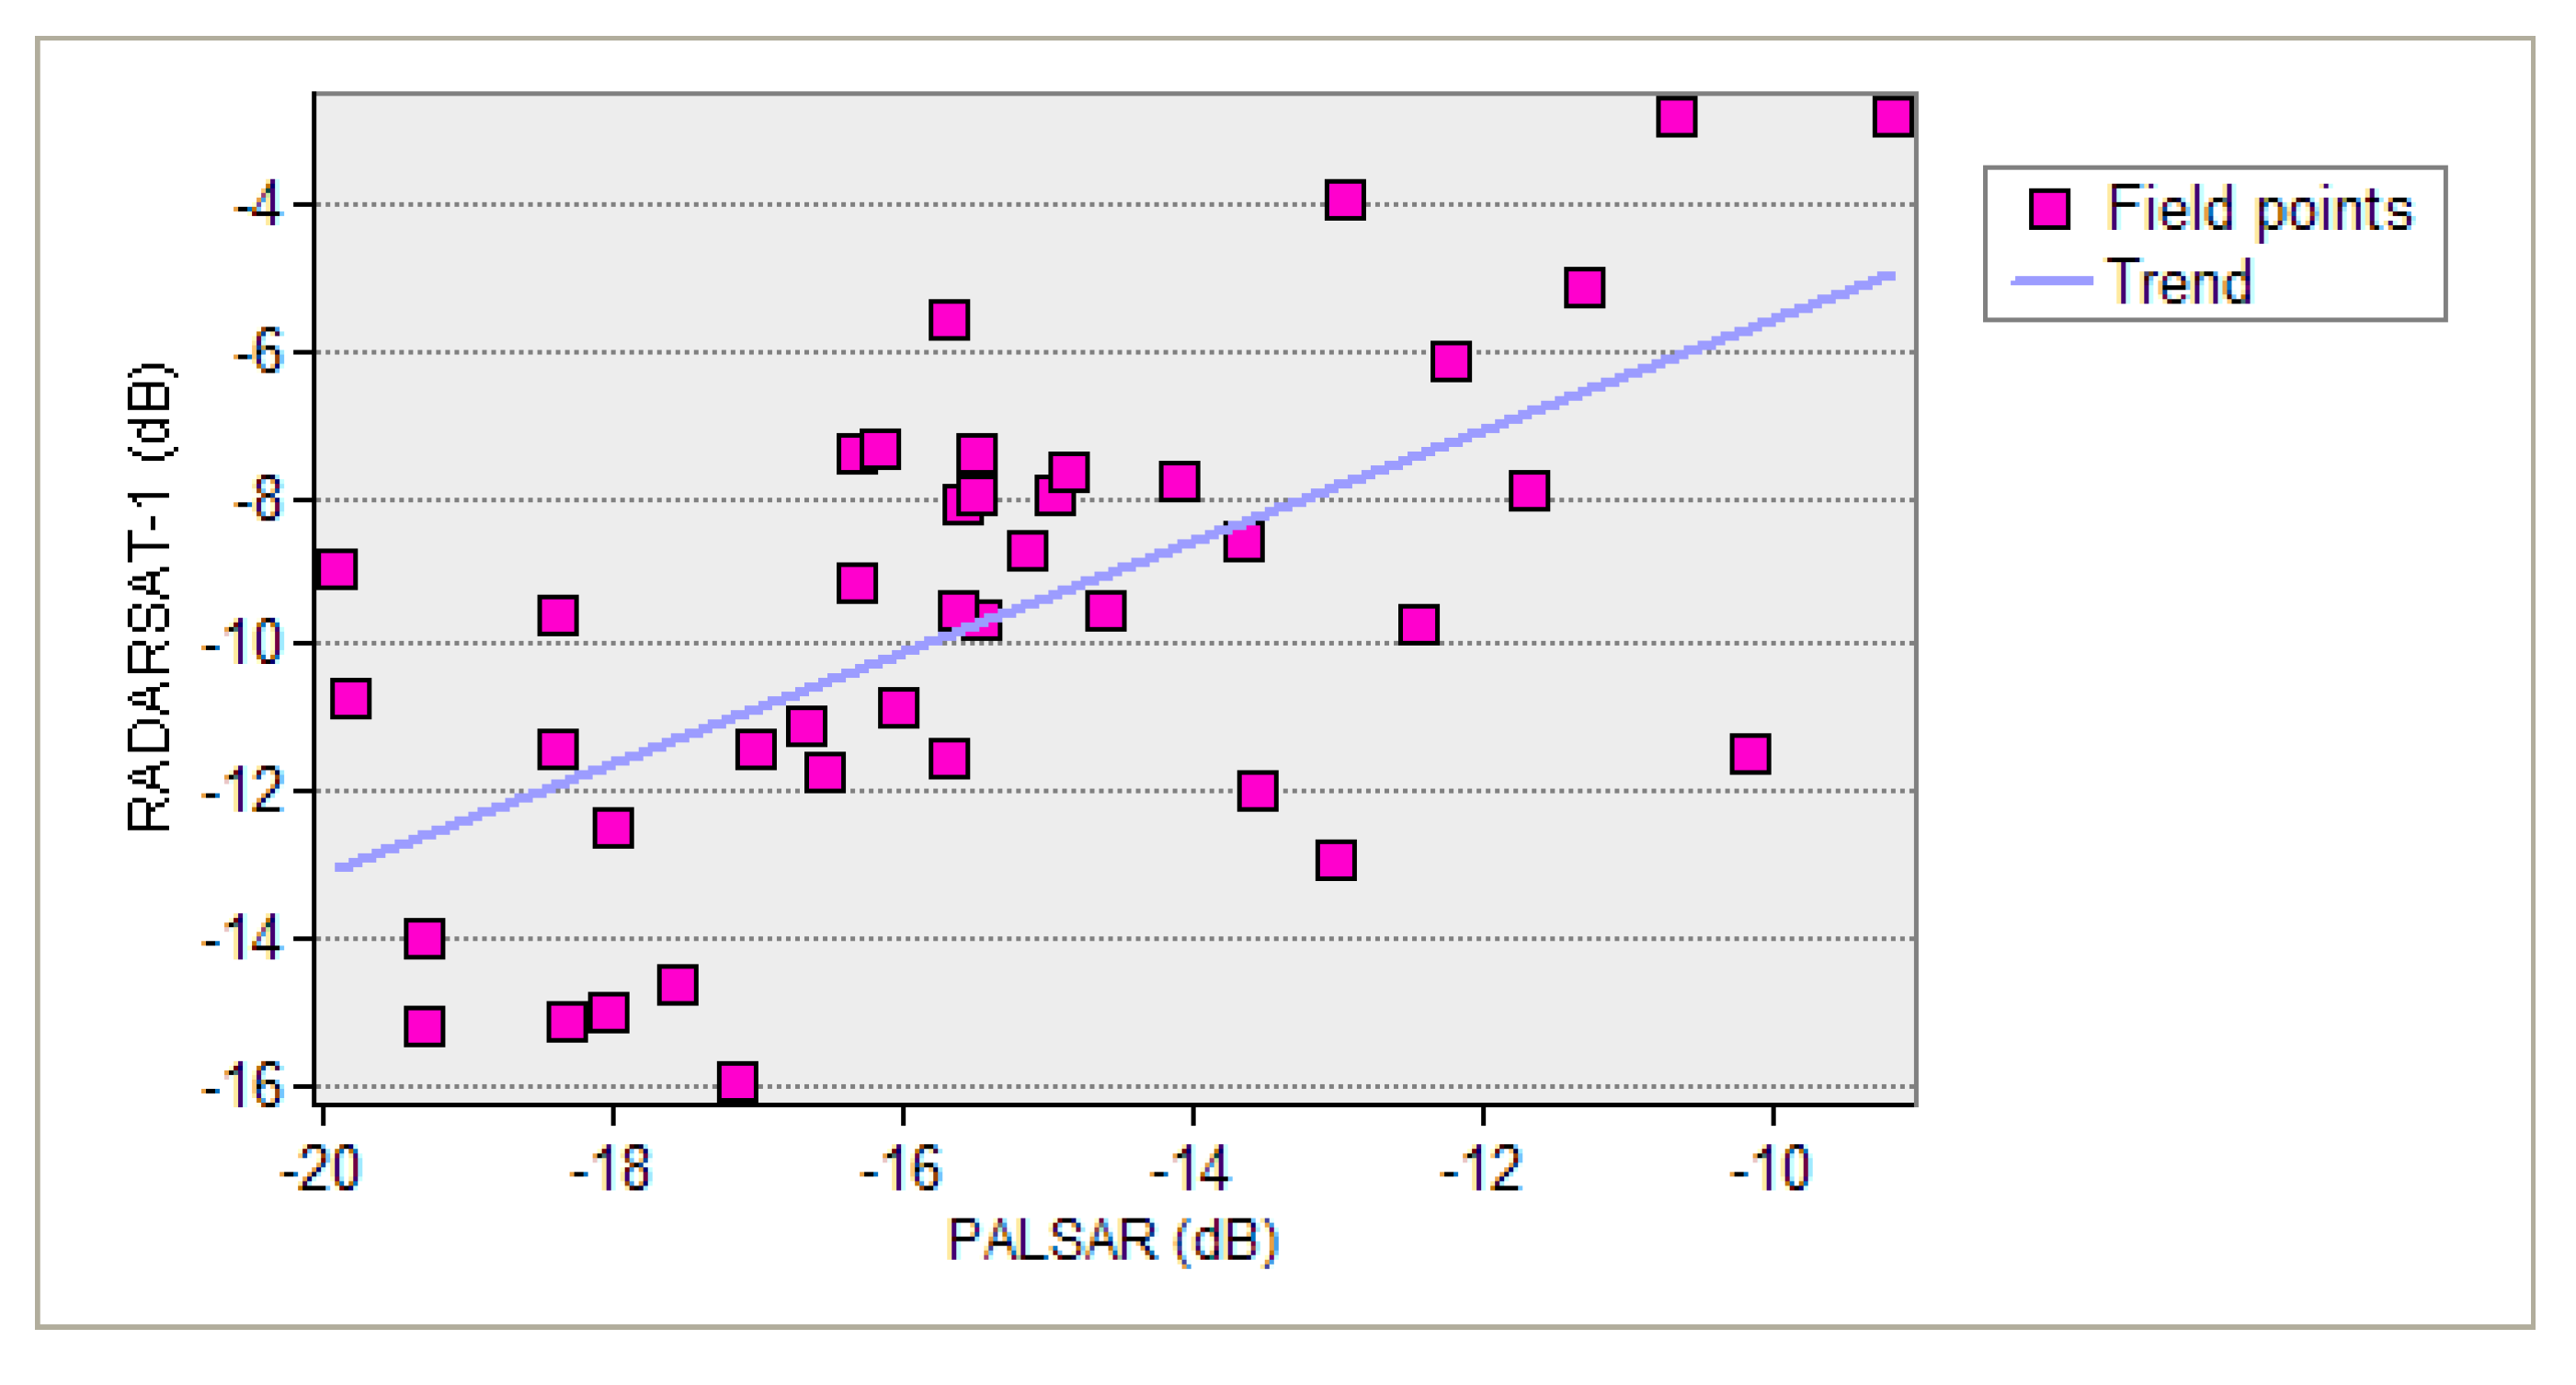
Results of this first correlation analysis confirm that the unsupervised classifications of both hybrid images are largely influenced by the contribution of the microwave component and to a lesser degree by the optical component. Moreover, the ranges of backscatter coefficient values of Radarsat-1 and PALSAR are positively correlated as shown in
Figure 7 where mean values where extracted at 41 selected sites visited in the field (
Figure 3 and
Figure 8). This means that both microwave images of Radarsat-1 and PALSAR produced classification results where the individual classes do correspond to significant changes in grain sizes of wadi deposits as corroborated by field investigation (
Figure 8).
Table 2.
Mean backscatter coefficient values (in dB) of Radarsat-1 and PALSAR data for each of the classes with corresponding roughness/grain size as observed in the field.
Table 2.
Mean backscatter coefficient values (in dB) of Radarsat-1 and PALSAR data for each of the classes with corresponding roughness/grain size as observed in the field.
| Class (color) | Backscatter (mean) | Roughness and grain size |
|---|
| | RSAT-1 | PALSAR | |
|---|
| Class 1 (Red) | −13.11 | −19.81 | Smooth (sand, pebble) |
| Class 2 (Green) | −10.95 | −17.32 | To | ![Remotesensing 02 00052 i001]() |
| Class 3 (Blue) | −9.25 | −13.87 |
| Class 4 (Yellow) | −7.46 | −9.30 |
| Class 5 (Cyan) | −5.52 | −4.04 | Rough (cobble, boulder) |
Furthermore, the consistently stronger backscatter signal (higher σ0 values) of Radarsat-1 with respect to PALSAR are primarily attributed to differences in backscatter amount. In arid environments, the backscatter values are mainly a function of surface roughness, wavelength of the radar pulse, and dimensions of the target in relation to the radar pulse [
20]. Whether one and the same surface feature is seen as smooth, intermediate or rough in a radar image depends on the radar beam depression angle and radar wavelength [
10]. Therefore, Radarsat-1 data produce higher backscatter values than PALSAR for the same target as both have similar depression angles but different wavelengths with the shorter C-band being more sensitive to surface micro-relieve than the longer L-band [
21]. Comparison of the backscatter statistics of individual classes produced by the two sets of hybrid images with field observations confirms that Radarsat-1 data show higher median values than PALSAR data for equivalent classes (
Table 2 and
Figure 8). This suggests that the differences in data ranges between the calibrated Radarsat-1 and PALSAR data had little effect on the outputs of the classifier, which nevertheless produced comparable classes in terms of grain/fragment sizes as checked in the field.
Figure 7.
Correlation of mean backscatter coefficient values (in dB) of Radasat-1 and PALSAR at surveyed field locations along Wadi Feiran.
Figure 7.
Correlation of mean backscatter coefficient values (in dB) of Radasat-1 and PALSAR at surveyed field locations along Wadi Feiran.
However, it was found that the ETM+/Radarsat-1 classification performed better in discriminating subtle textural differences throughout the alluvial area of Wadi Feiran than the ETM+/PALSAR classification. Two examples are shown in
Figure 3 were selected wadi segments (A and B) are blown up to show differences in spatial class distribution and class categories as depicted in ETM+/Radarsat-1 (
Figure 3a) and ETM+/PALSAR classifications (
Figure 3b). They show that textural surface variability are better discriminated by Radarsat’s shorter wavelengths (C-band) than PALSAR’s longer wavelengths (L-band), which tends to show more homogenous areas with less contrasting class categories. PALSAR’s greater spatial resolution, however, is able to pick up smaller spatial features and delineate sharper class boundaries.
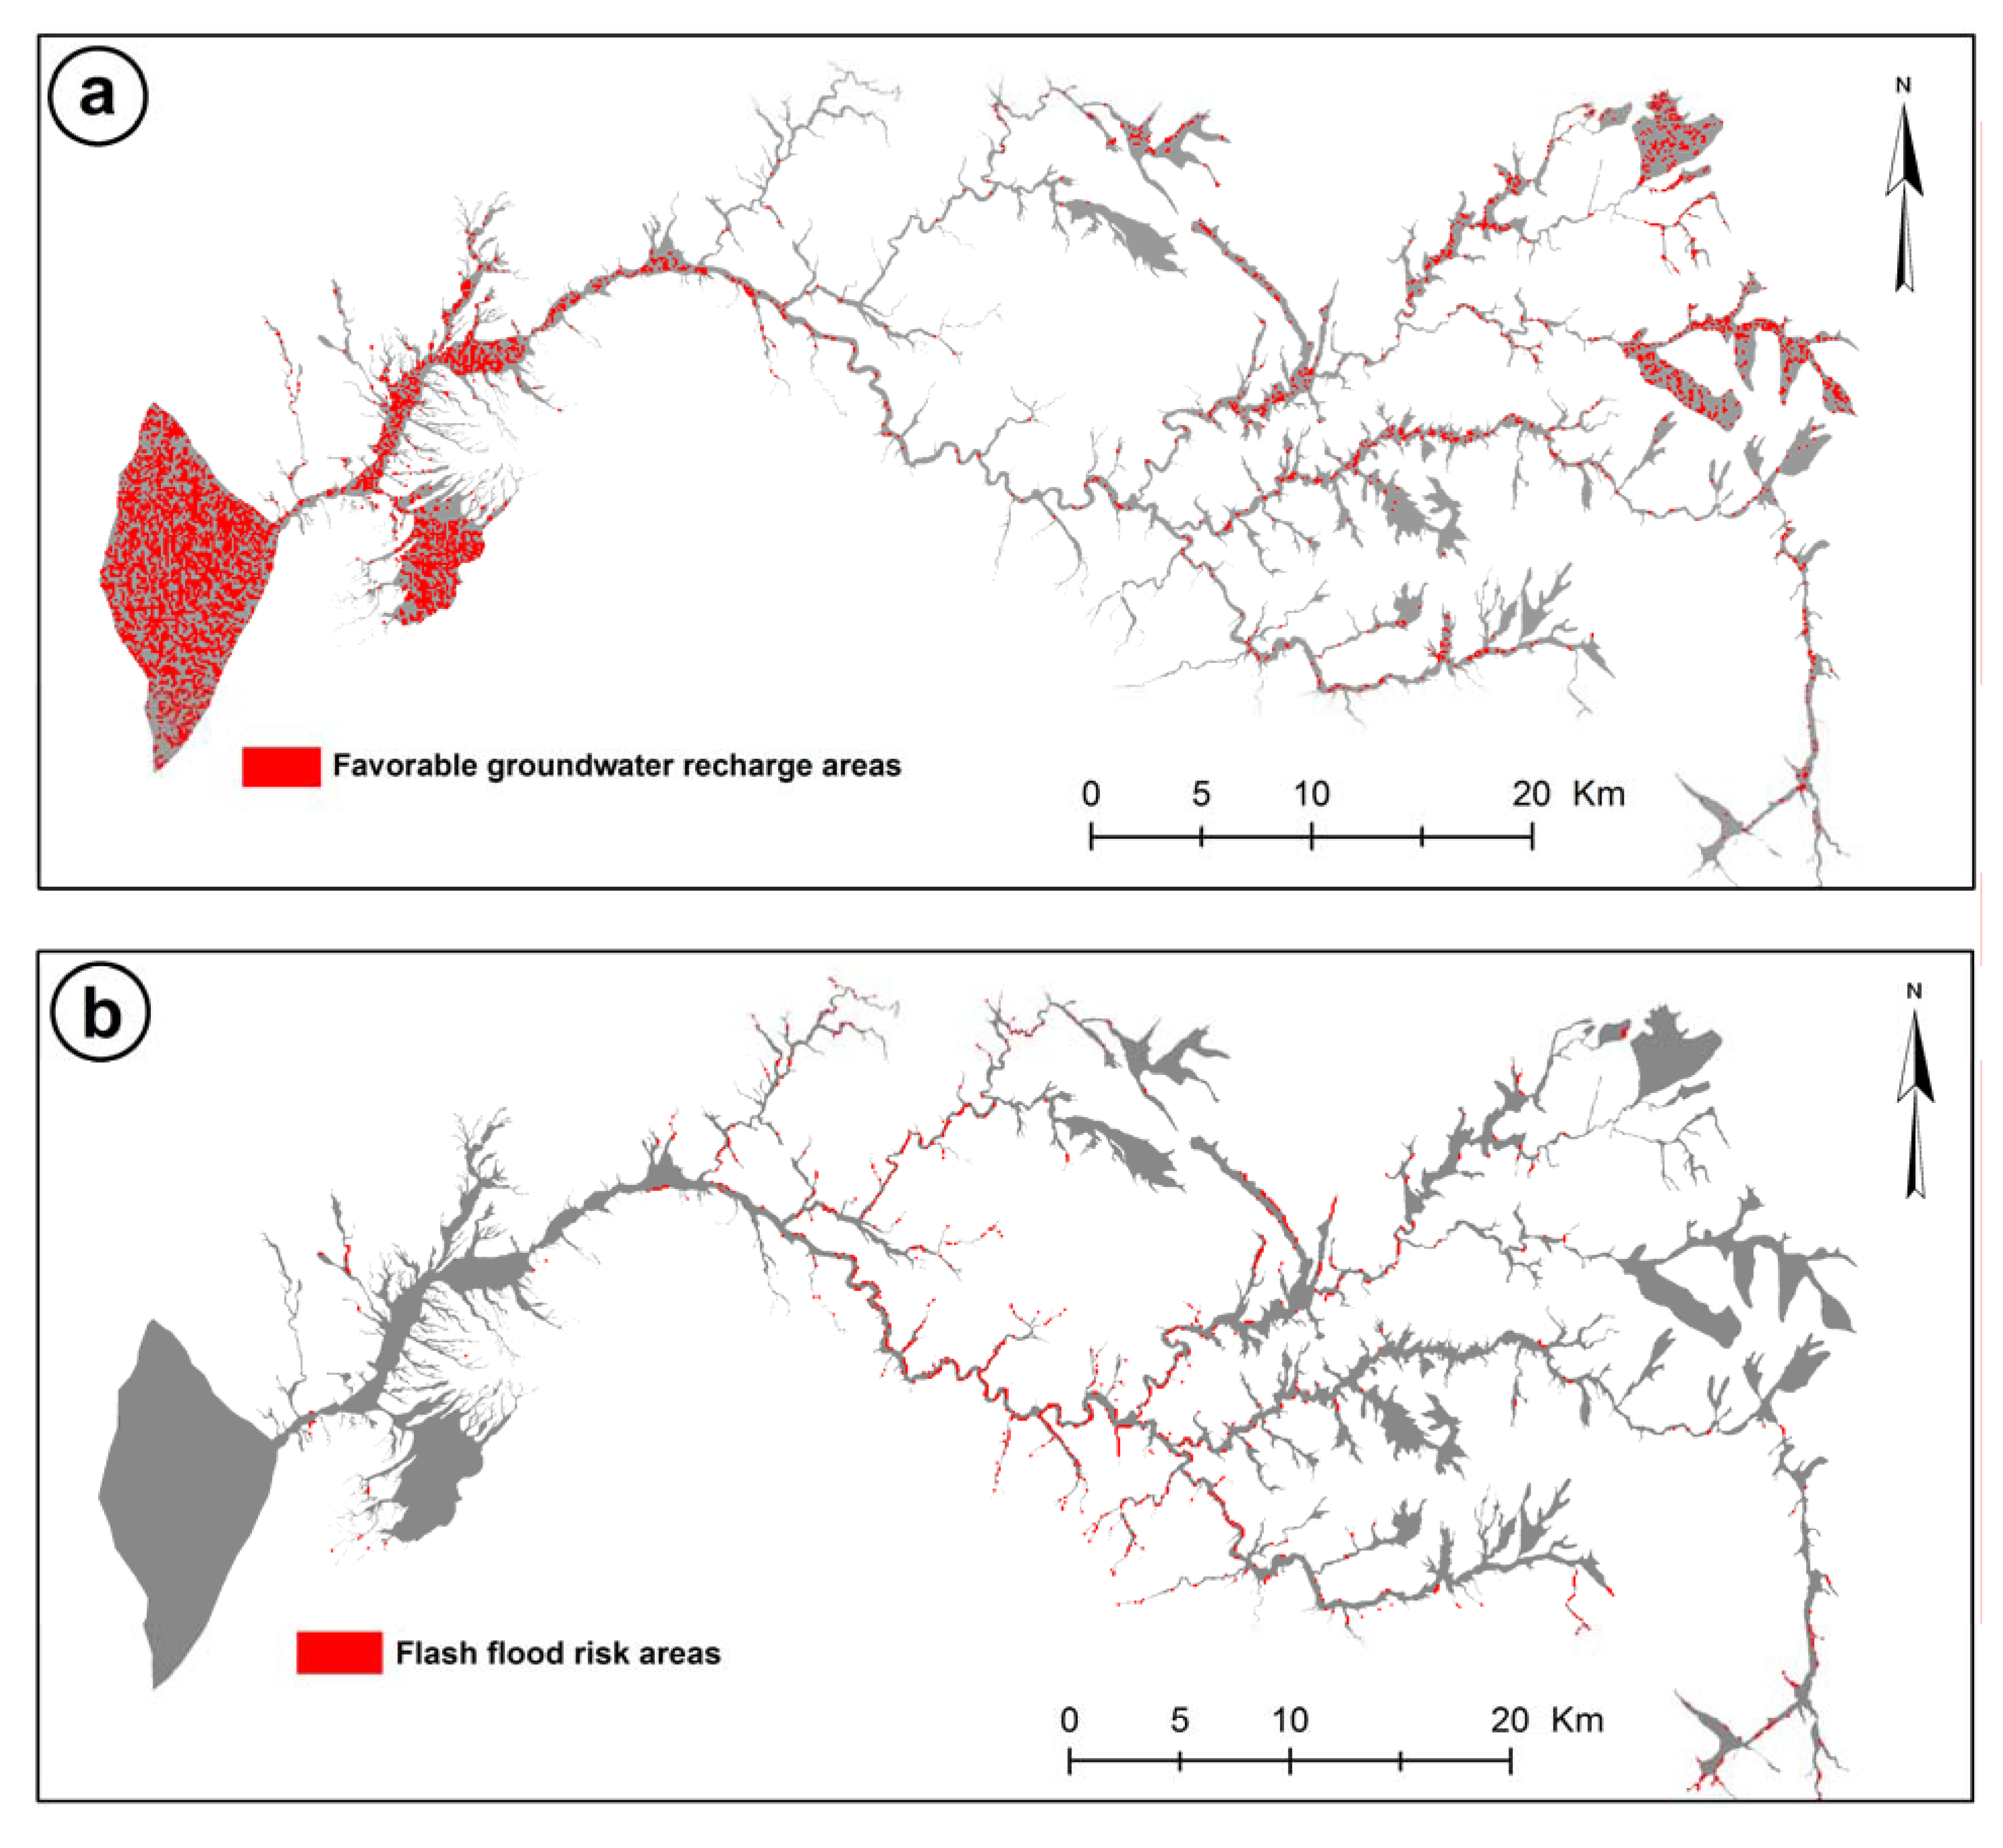
An SRTM DEM of the study area was used to determine the slope as percent within the wadi channels to correlate this information with the classified hybrid images. The slope was classified into four classes based on which areas are favorable for water recharge (extremely flat areas) and which areas show high risks of flash floods (extremely steep areas) in the event of a rainstorm. The four classes are (
Figure 5): flat terrain (0–1%), gentle terrain (1–5%), moderate terrain (5–15%) and steep terrain (> 15%). The correlation results (
Figure 6a) show that the smoothest surfaces with relatively small rock-fragment/sediment-grain sizes (classes 1, 2 and 3) mainly occur along gently sloping areas, whereas the roughest surfaces with large rock fragments and coarse grain sizes (classes 4 and 5) occur along the steepest sloping areas. This means that the most favorable areas for groundwater recharge are those covered with wadi deposits of fine to moderate grain sizes (fine sand to pebble; classes 1, 2 and 3) and are located along relatively flat terrains (0–1%), while areas with high risks of rock falls (erosion) and prone to flash floods are those wadi segments covered with very coarse-grained alluvial deposits (cobble to boulder; classes 4 and 5) and are located along moderate to steep terrains (> 10%) (
Figure 9).
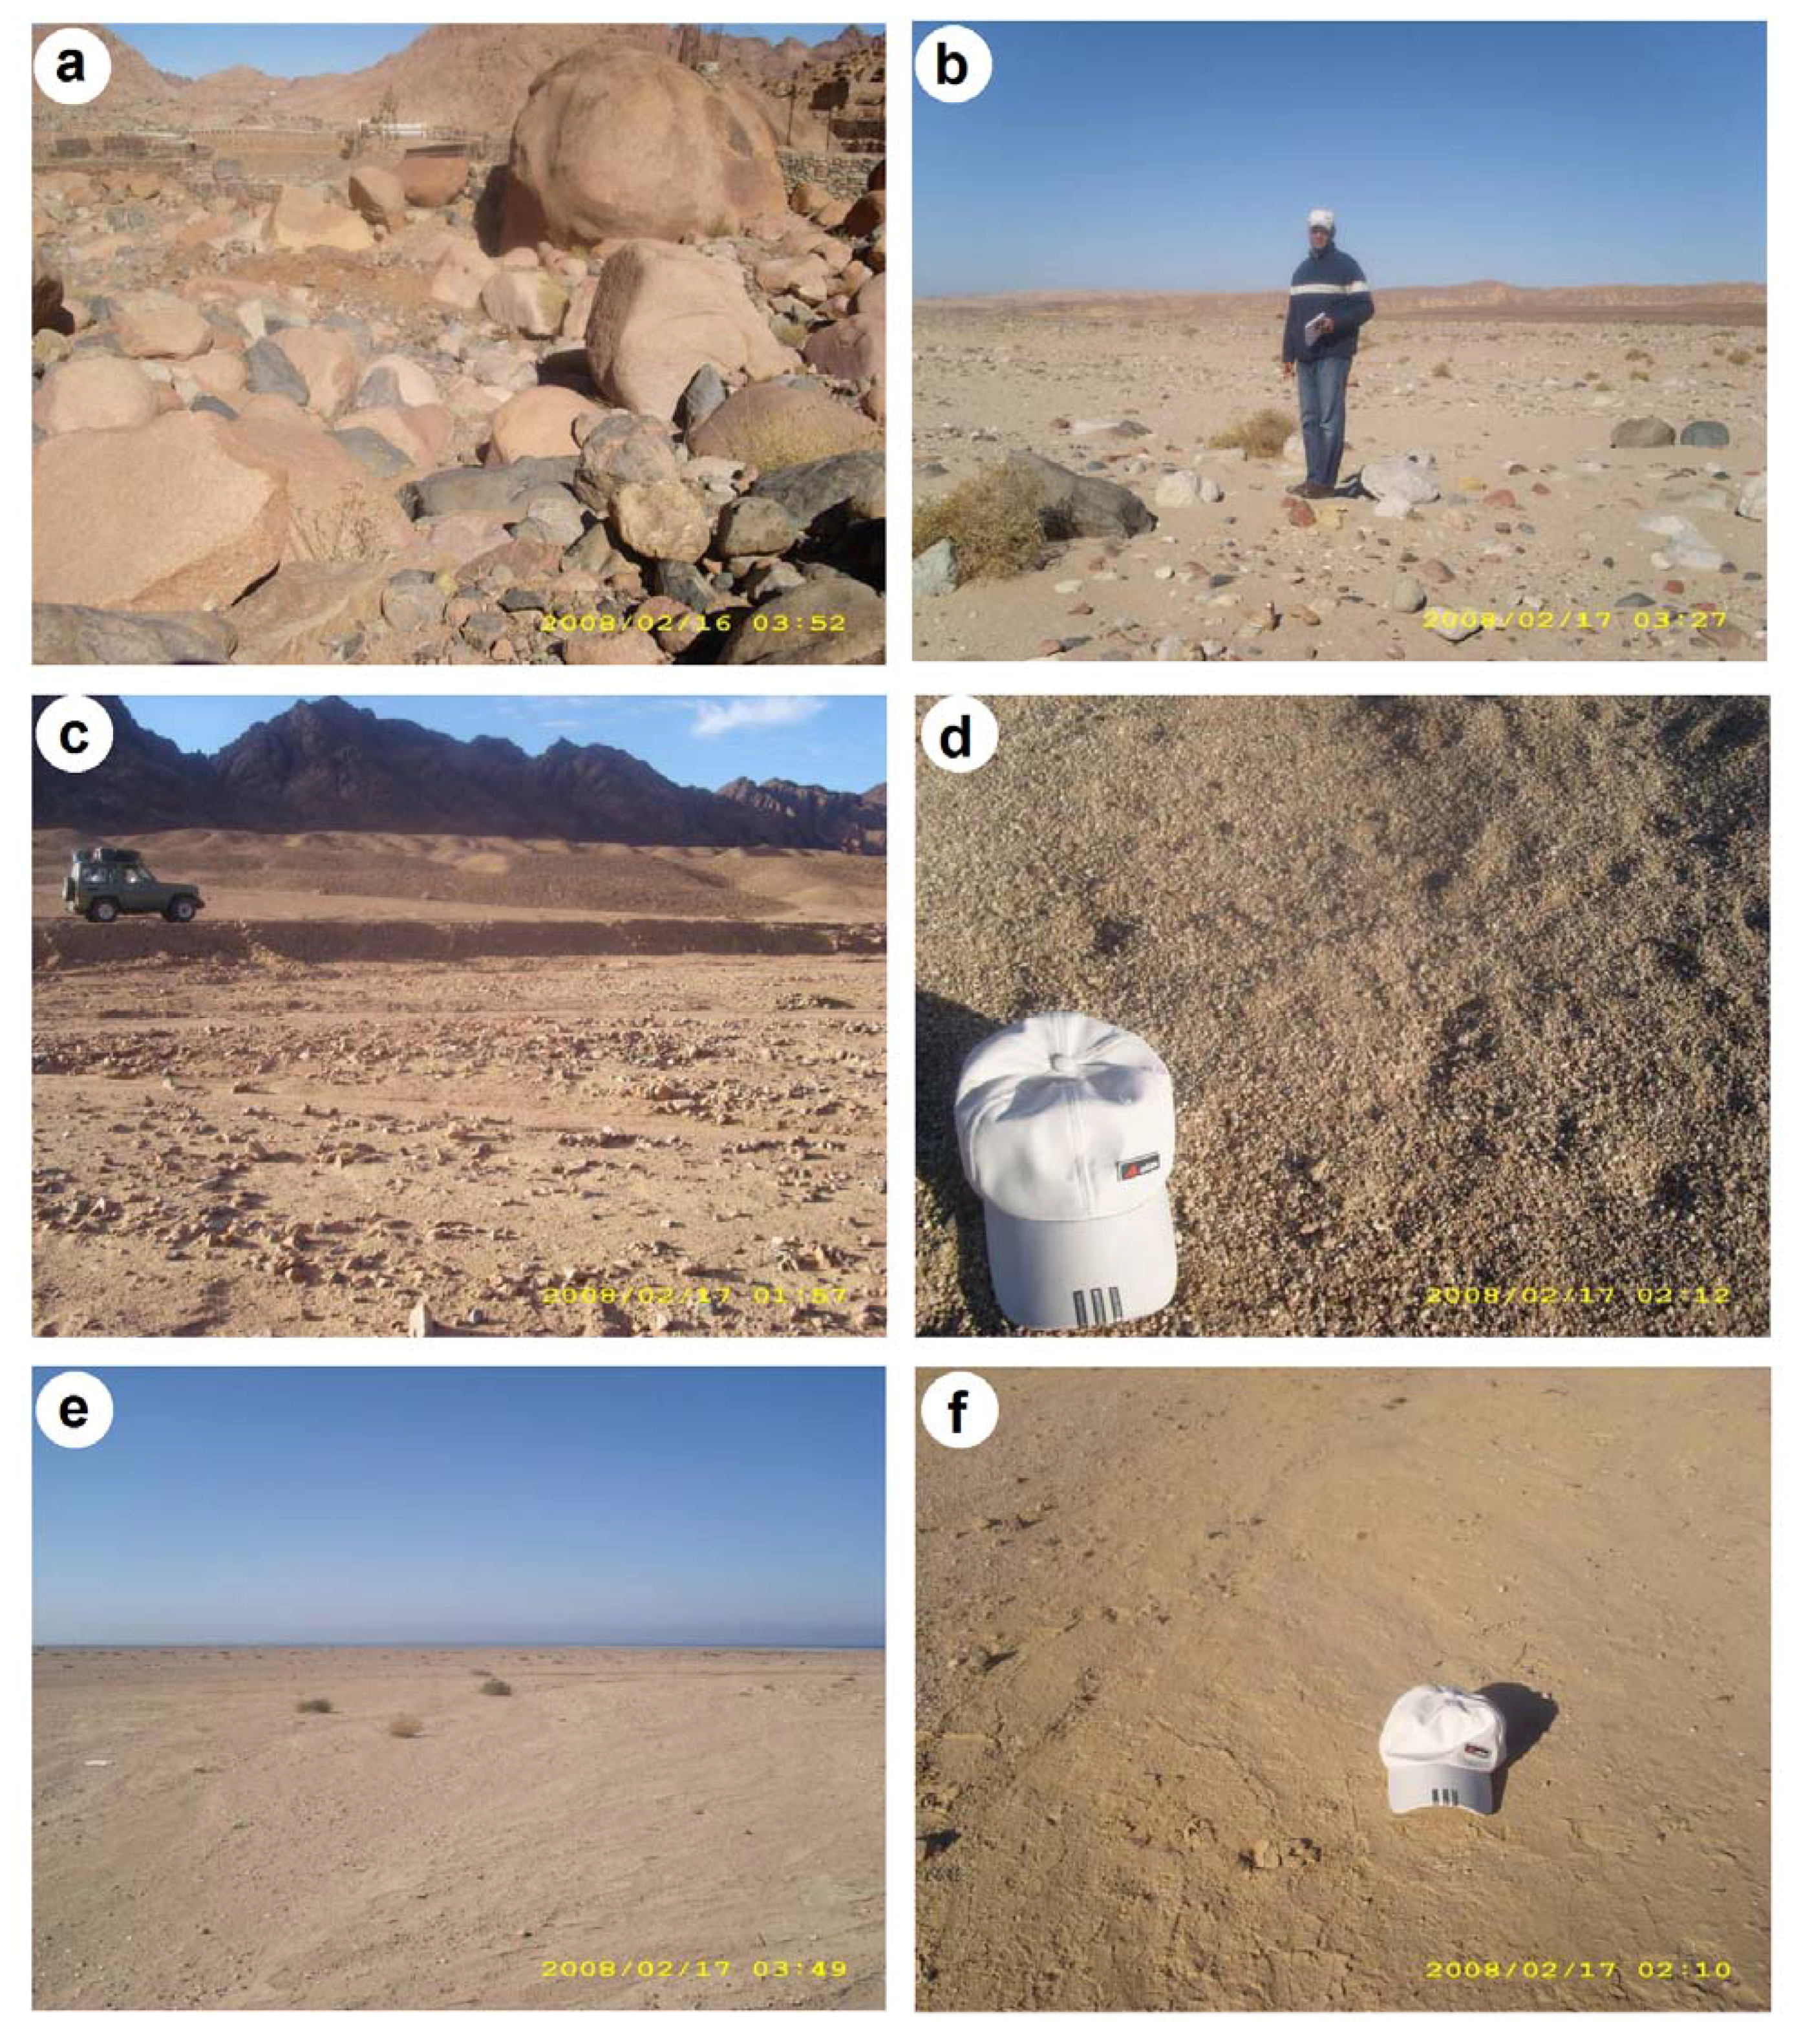
Figure 8.
Field photographs displaying the typical grain/fragment size of each hybrid image class from coarse to fine: (a) class 5–boulders, (b) class 4–boulders & cobbles, (c) class 3–cobbles & pebbles, (d) class 2–pebbles and sand, and (e & f) class 1–sand and clay.
Figure 8.
Field photographs displaying the typical grain/fragment size of each hybrid image class from coarse to fine: (a) class 5–boulders, (b) class 4–boulders & cobbles, (c) class 3–cobbles & pebbles, (d) class 2–pebbles and sand, and (e & f) class 1–sand and clay.
Figure 9.
Promising areas along Wadi Feiran basin for (a) groundwater recharge, and (b) risky areas in the event of flash floods.
Figure 9.
Promising areas along Wadi Feiran basin for (a) groundwater recharge, and (b) risky areas in the event of flash floods.
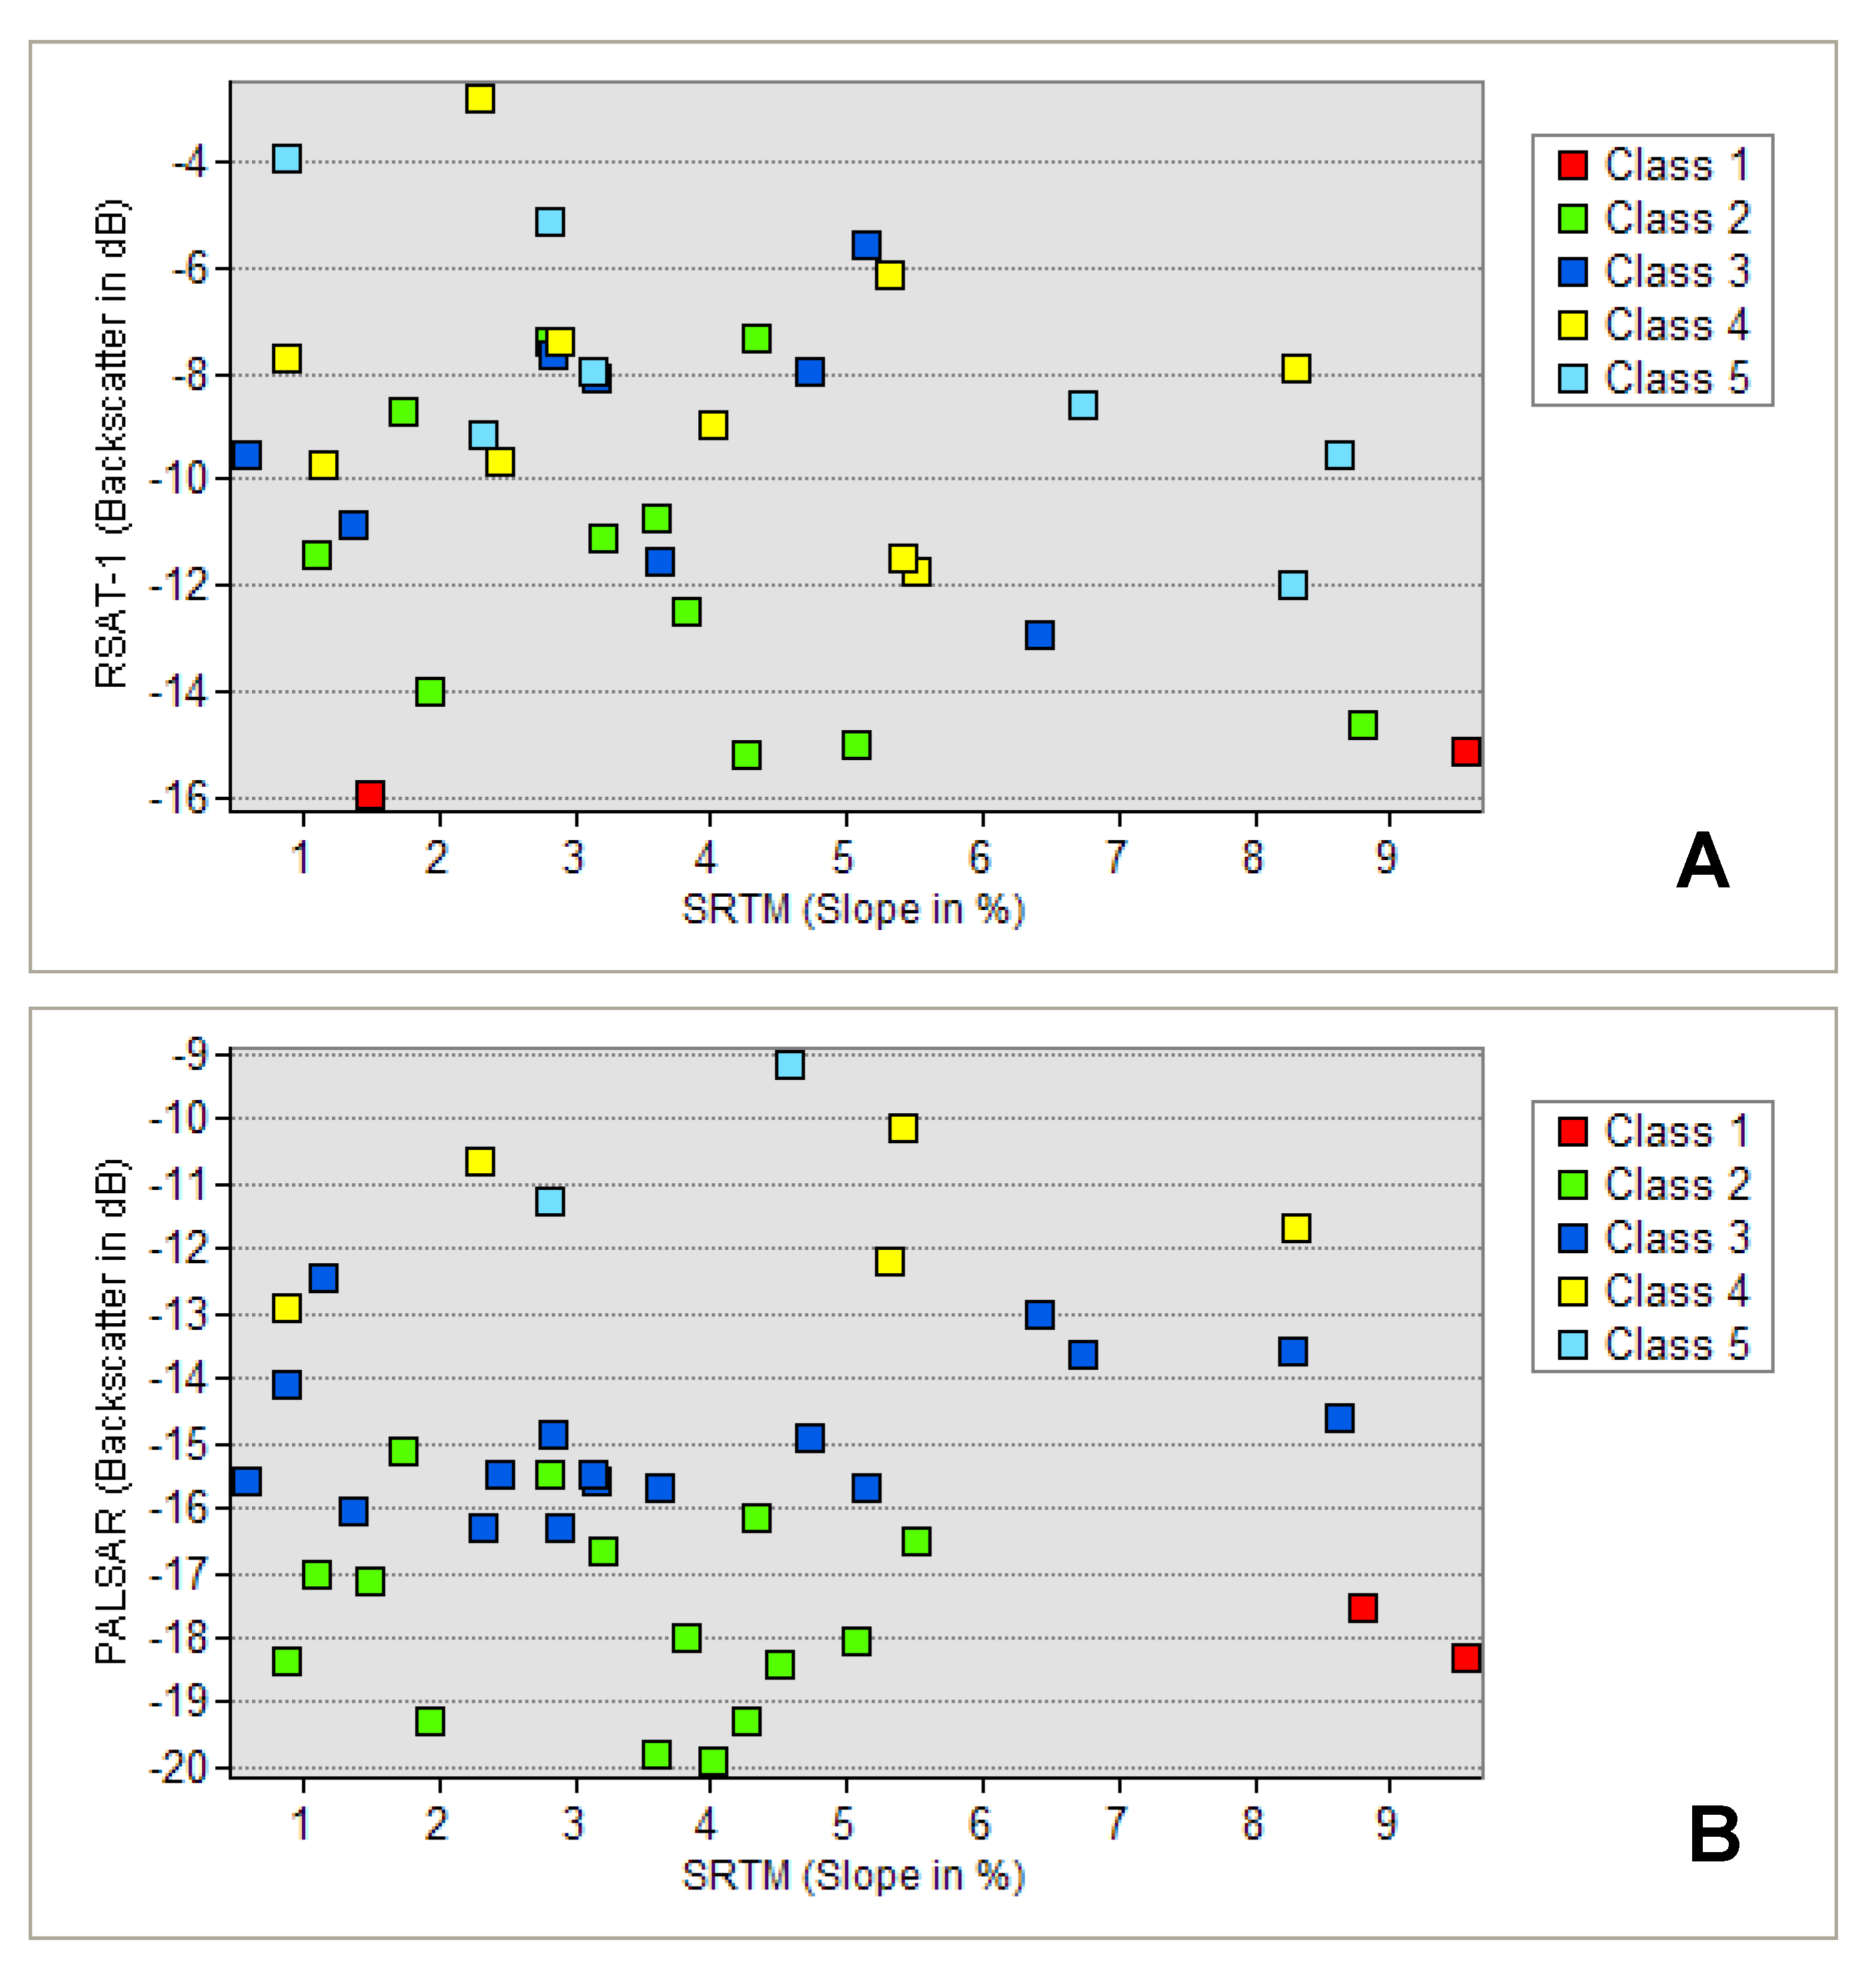
Results of this second correlation confirm that microwave surface measurements can be used as a proxy for slope measurements. This latter point was investigated in the field. In
Figure 10 the mean backscatter coefficient values of Radarsat-1 (top) and PALSAR (bottom) at 41 sites surveyed in the field are plotted against SRTM slope values. All sites are located in relatively flat sections of the wadis away from the bedrock edges, which explains why the slope values range only from 0 to 10% (and not greater than 10%). Wadi edges and smaller, narrower (and steeper) tributaries were excluded because of the layover effect that would have prevented obtaining reliable readings of backscatter coefficient values from the images. Both graphs show that with increasing backscatter and slope values, field points tend to be associated with higher class numbers of the respective hybrid image. This means that surface roughness increases even in less steep sections of the wadis. Another interesting observation in
Figure 10 is that field points with higher backscatter values tend to be associated with higher class numbers, but in the case of Radarsat-1 even more so than in PALSAR. There are more field points marked as class 4 or 5 in the top graph (Radarsat-1) than in the bottom graph (PALSAR). The bottom graph shows that two thirds of the field points are classified in the ETM+/PALSAR data as classes 2 and 3. In other words Radarsat-1 seems to be more effective in differentiating smooth, intermediate and rough surfaces than PALSAR, and has therefore more discriminating power than the latter one.
Figure 10.
Correlation of mean backscatter values (in dB) of Radarsat-1 (A) and PALSAR (B) versus SRTM slope values (in %) at selected sites visited in the field. Field locations are color coded according to their class membership. Note that the corresponding Radarsat-1 or PALSAR hybrid classification was used to assign class colors.
Thus, based on the above analysis, classes 1 to 5 of both hybrid images can be interpreted as representing decreased groundwater recharge potential and increased erosive stream power (
Table 3). However, the Radarsat-1 hybrid image does a better job in discriminating micro-relief surfaces than the PALSAR hybrid image, which tends to assign smaller class numbers (smoother surface roughness classes) to wadi surfaces, missing, thus, to detect much of the micro-surface variations caused by stream erosion and deposition.
Table 3.
Relationships between radar backscatter, surface roughness, and slope, and its implication in terms of groundwater-recharge potential.
3.2. Interpretation of Unmixing Results
The output of the spectral unmixing procedure includes six fraction maps (one for each endmember) and an error image. The fraction maps show the spatial distribution of endmember abundances, and the error image is a measure of how well the endmember proportions fit the mixing model. If the error image does not show any systematic patterns, and mainly contains random noise, then the model fits perfectly. This is the case with the results obtained in this work. Moreover, the resulting fraction maps should have a value range from 0 to 1, where 0 means no matching between the endmember spectra and the derived spectra from pixel unmixing and 1 means a complete match. Sometimes, the values range from <0 and >1, especially for the unconstrained unmixing, due to fraction overflow and residual increase [
22].
Table 4 displays the statistics of the five endmember-fraction and error images.
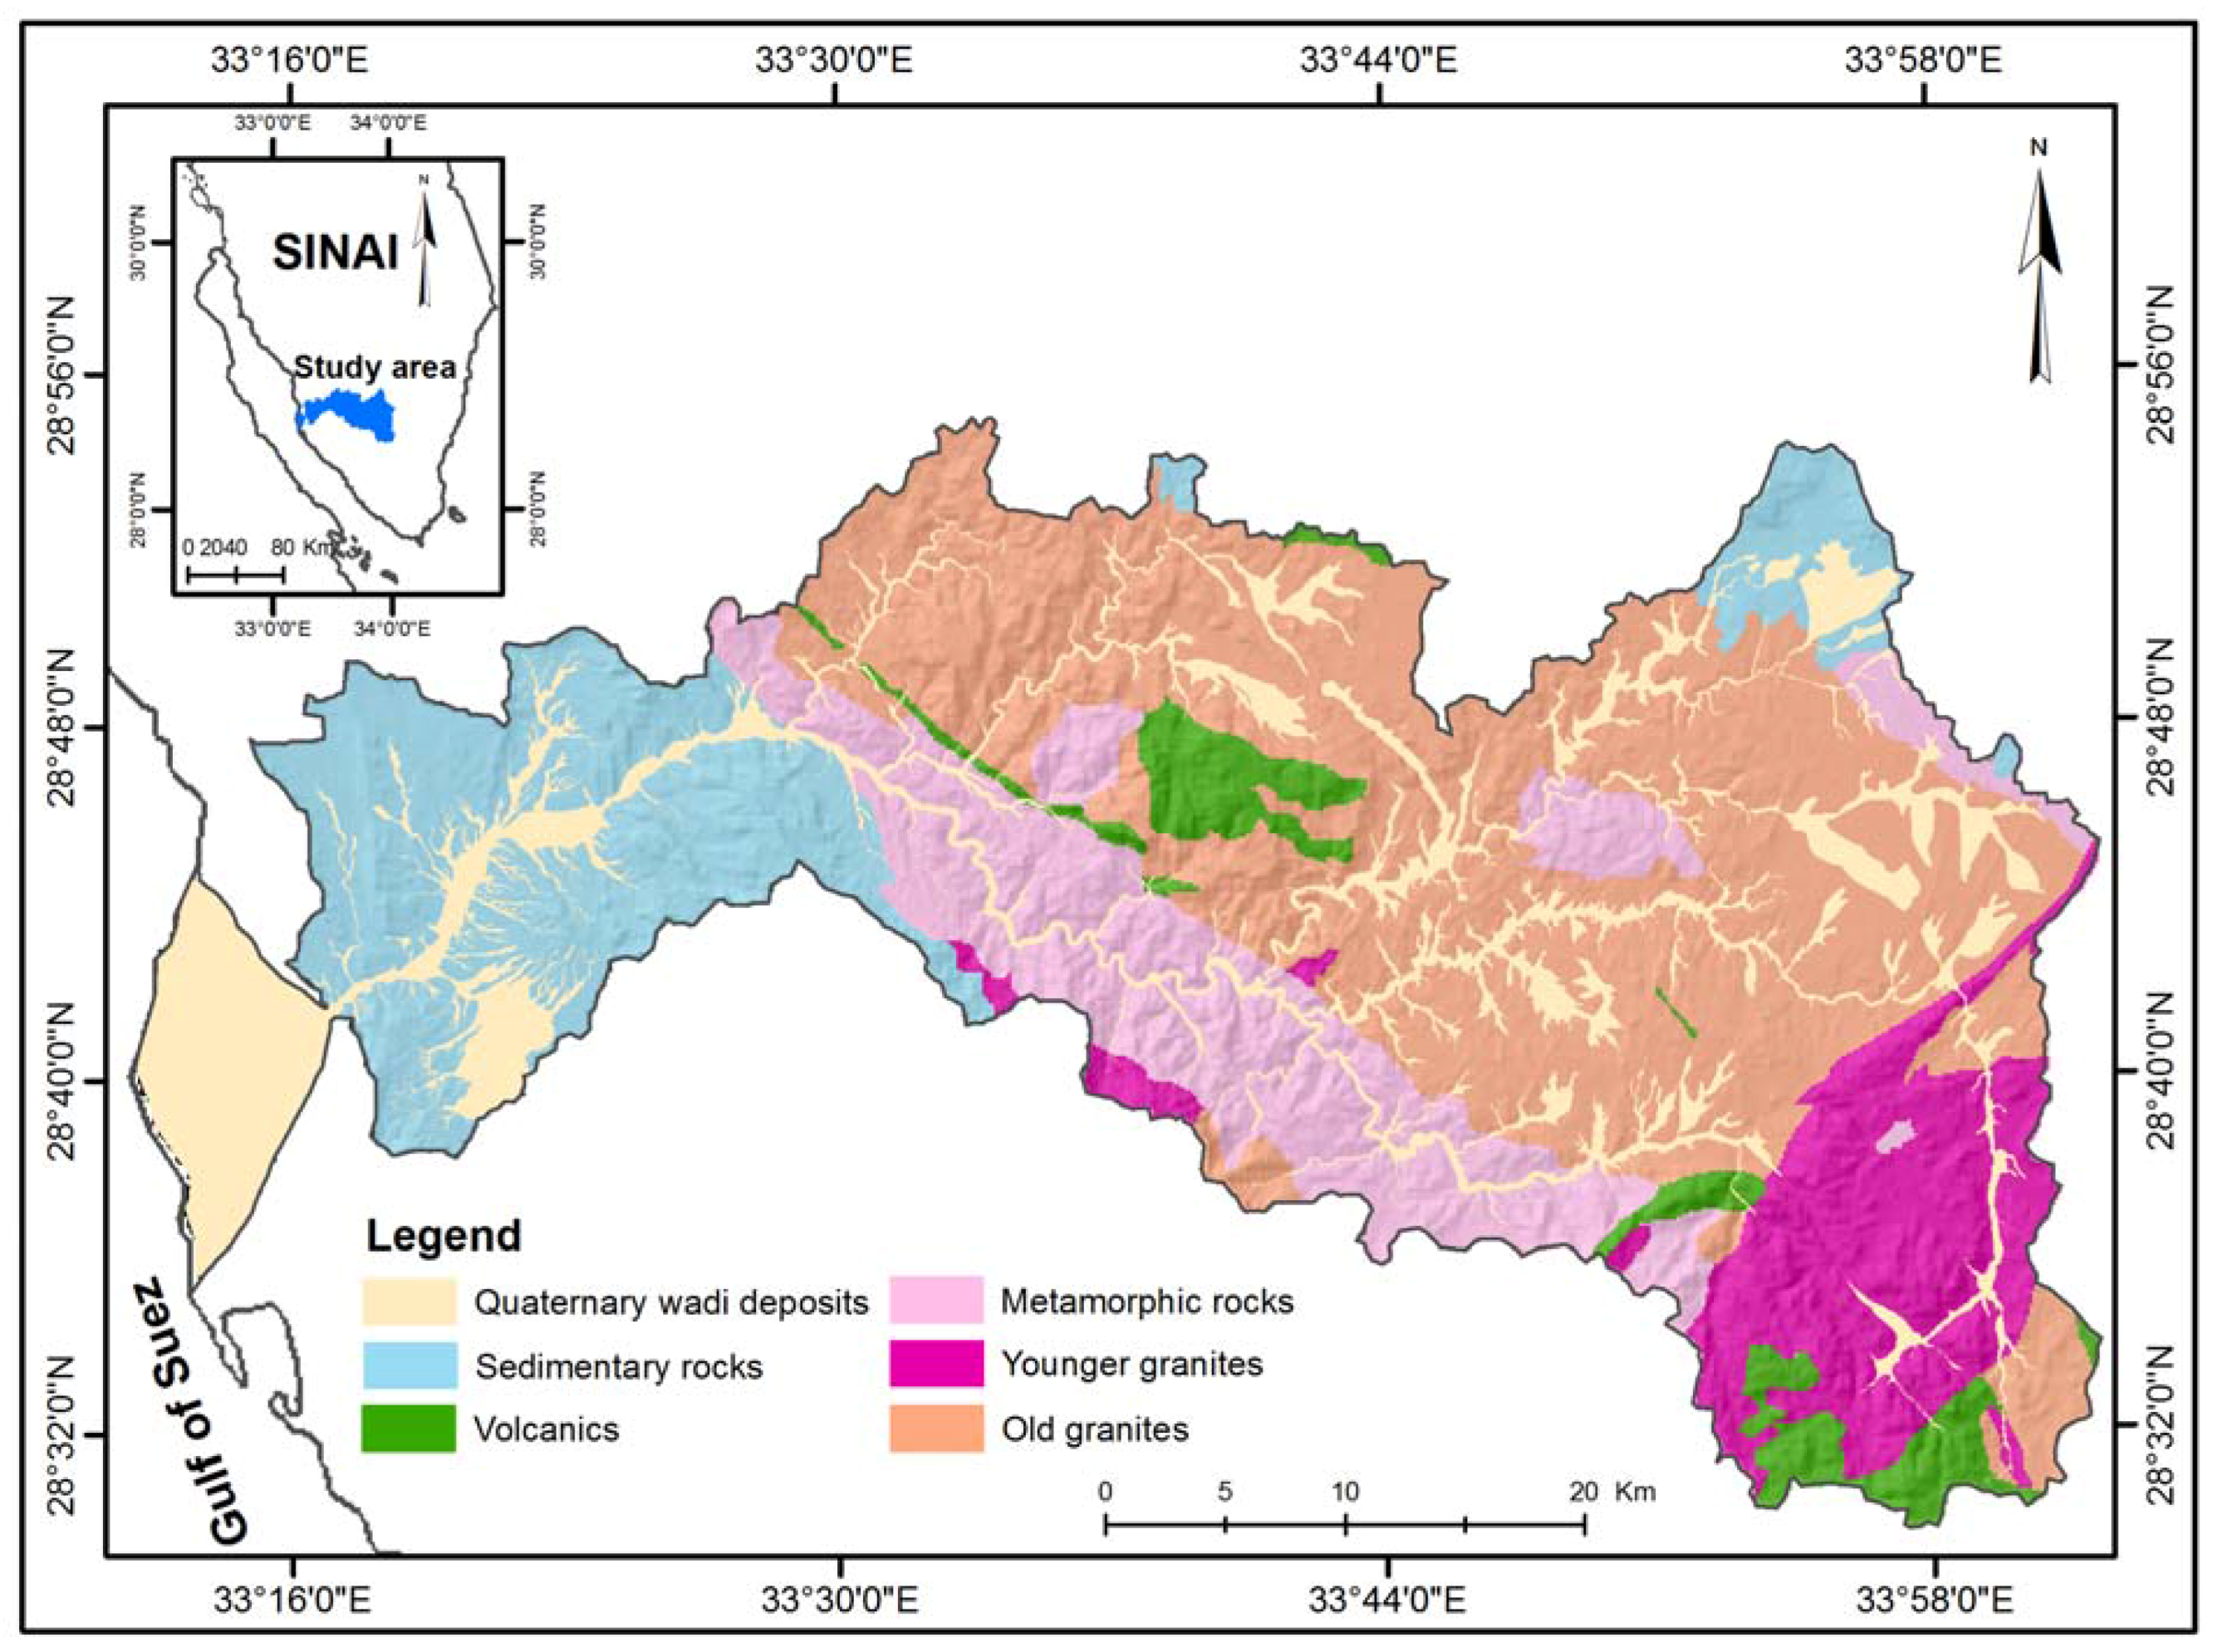
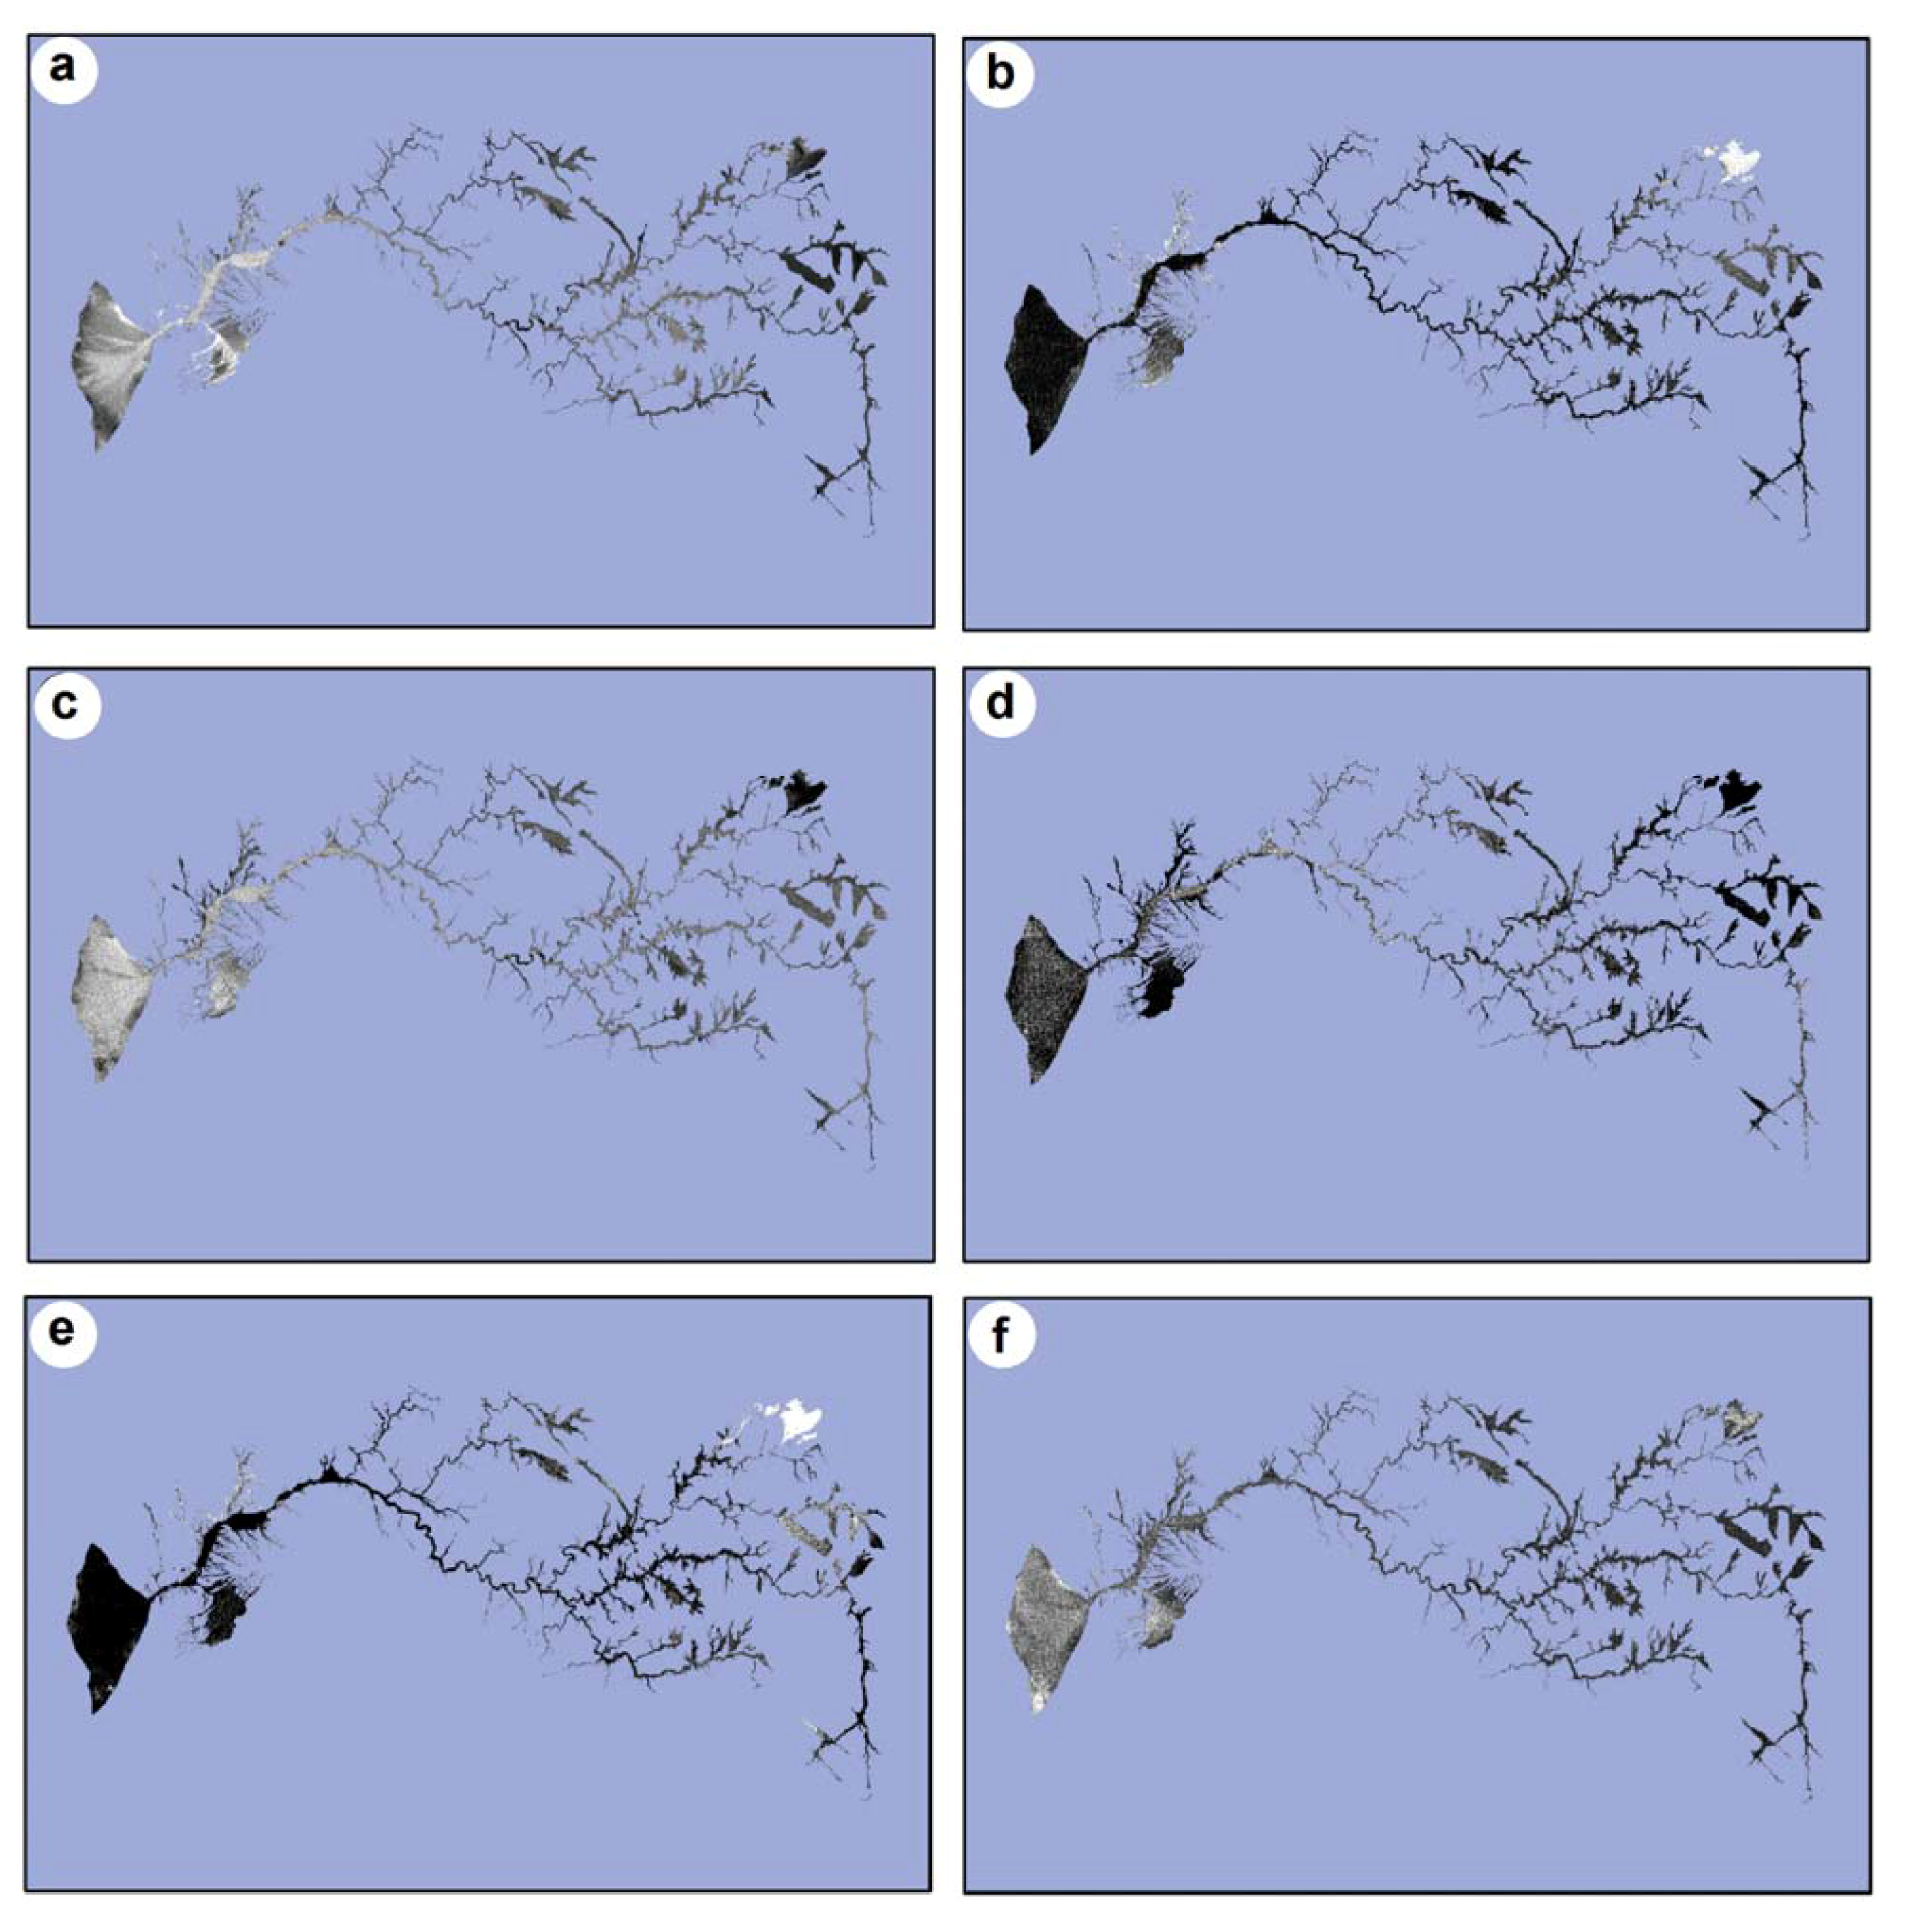
The spatial distribution of the carbonate fraction coincides with the sedimentary rock unit (mainly limestone) of the simplified geologic map. At some places it is covered by weathered old granite (
Figure 11b). These weathered old granites most probably were covered by a thin sedimentary cap like the much closer granites on the northeastern border of the Feiran basin. This sedimentary cap was washed out by torrential rainfalls and deposited within the wadi channels [
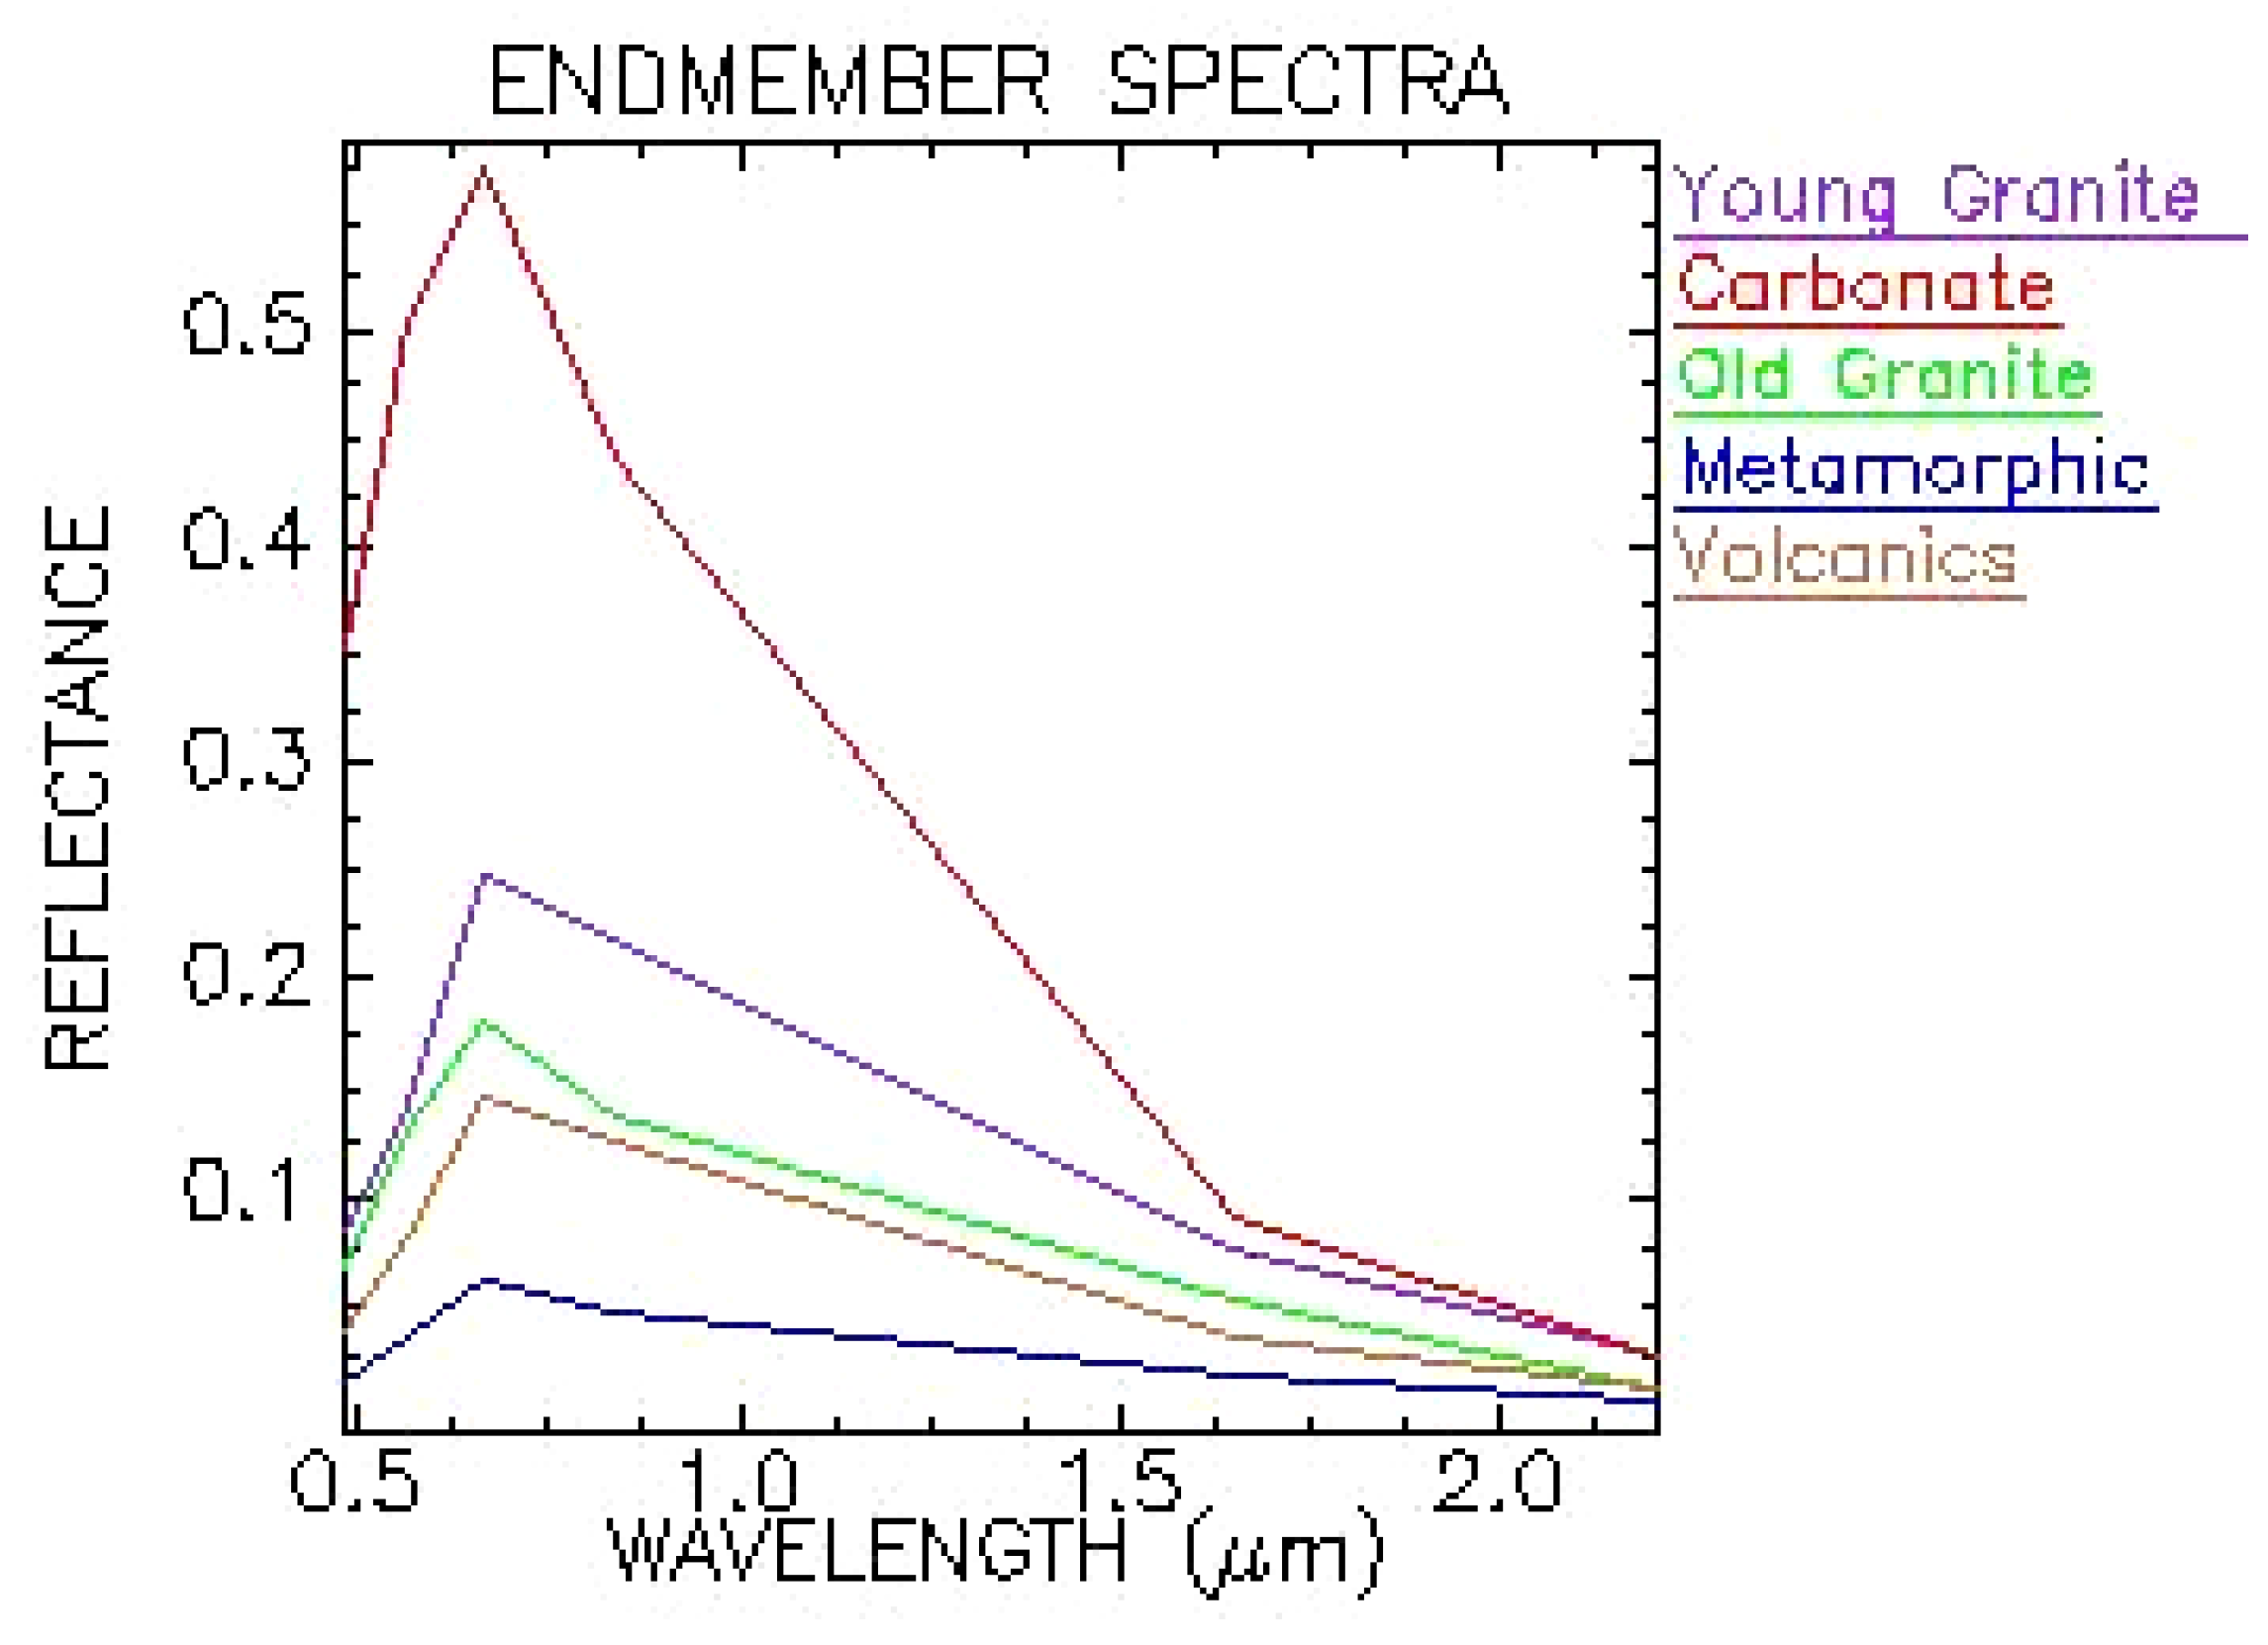
6]. The spectral reflectance curves of the old granite and volcanic endmembers are quite similar (
Figure 4). Thus, their fraction maps show very similar spatial distributions within the wadi courses (
Figure 11b,e). They are predominantly found in areas that are wide, relatively flat and surrounded by weathered old granite and volcanics. The young granite fraction is widely distributed along the wadi channel (
Figure 11c) because it is located at the most distant and highest terrain portion of the basin (
i.e., very long travel distance to the basin outlet) and has a relatively light color and well represented endmember spectrum. Conversely, the metamorphic fraction is grey to dark in color and represents the lowest spectral reflectance values (
Figure 11d). The colors in the fraction maps range from black to white, with lighter colors representing high fraction values and darker colors representing low fraction values. However, in the case of the residual error map high error values are shown with light colors and low errors with dark colors (
Figure 11f).
Table 4.
Statistics of the five endmember fraction and RMS error images of the alluvial area in Wadi Feiran basin. Bedrock outcrops and vegetation were masked out.
Table 4.
Statistics of the five endmember fraction and RMS error images of the alluvial area in Wadi Feiran basin. Bedrock outcrops and vegetation were masked out.
| ETM | Unmixing Fractions |
|---|
| Carbonate | Old granite | Young granite | Metamorphic | Volcanic | RMS error |
|---|
| Min Value | −0.177591 | −3.296668 | −0.866585 | −10.176119 | −5.59556 | 0.00000 |
| Max Value | 1.457814 | 2.680196 | 2.792672 | 7.578426 | 4.158999 | 0.007072 |
| Mean | 0.231171 | 0.059169 | 0.528635 | −0.76337 | −0.17111 | 0.000606 |
| 1 Stdev. | 0.091271 | 0.386858 | 0.263685 | 1.402204 | 0.735009 | 0.000459 |
| Percent < 0 | 0.3 | 50.5 | 3.2 | 73.7 | 66.6 | 3.0 |
| Percent 0 - 1 | 99.7 | 47.7 | 94.4 | 19.2 | 28.3 | 97.0 |
| Percent > 1 | 0.0 | 1.8 | 2.4 | 7.1 | 5.1 | 0.0 |
A density slicing was applied to each faction map using the following intervals: (<0.0), (0.0–0.25), (0.25–0.5), (0.5–0.75), (0.75–1.0) and ( >1); this means that the fraction percentage within the pixel is (<0%), (0% to 25%), (25% to 50%), (50% to 75%), (75% to 100%) and (s > 100%), respectively. The low-end values (<0%) are added to the 0% to 25% interval and the high-end values (>100%) are added to 75% to 100%. The final intervals are 0% to 25% (low predominance), 25% to 50% (low to medium predominance), 50% to 75% (medium to high predominance) and 75% to 100% (high predominance).
The same method used for correlating the classified hybrid images with the slope was applied to correlate the classified ETM+/Radarsat-1 hybrid image with the fraction maps. The results of this correlation are presented in figure 6 and summarized in
Table 5 where predominant endmembers within each class of the fused image are highlighted. In addition,
Table 6 displays the total percentage of endmember fractions per hybrid classes. From these tables and the graphs in figure 6 the following conclusions can be drawn: (1) the young granite fraction is the most predominant endmember and appears in all classes with relatively high percentages, while the old granite is only marginally present with slightly increased percentages in classes 4 and 5; (2) conversely, the metamorphic and volcanic fractions appear in small amounts in all classes; (3) followed by slightly larger amounts of the carbonate fraction, especially in classes 2 and 3.
Comparison of the spatial distribution of endmembers (
Figure 10) with the geological map (
Figure 1) shows the location of the host rocks with respect to the wadi deposits. The carbonate fractions are mostly present at the lower west portion of the basin not far from their sedimentary source-rock area; whereas the source-rock area of the younger granite fraction is in the upper east portion of the basin far away from the basin outlet. The fact that this endmember fraction is present all along the entire wadi system, shows its greater resistance and longer travel distance with respect to other endmembers. Not surprisingly the young granite is the most predominant endmember fraction in all classes. The distribution of the metamorphic fraction coincides with the location of its source rock and is present in the alluvial fan area. However, the metamorphic as well as the volcanic and old granite endmembers appear in relatively small amounts with respect to the young granites and carbonates.
Table 5.
Predominant rock composition (endmembers) within each class produced by unsupervised classification of the hybrid image.
Table 5.
Predominant rock composition (endmembers) within each class produced by unsupervised classification of the hybrid image.
| Classes | Carbonate | Old granite | Young granite | Metamorphic | Volcanic | Predominant EM |
| 1 | XXX | XX | XXX | X | XX | Young Granite and Carbonate |
| 2 | XXXX | X | XXXX | XXX | X | Young Granite, Carbonate and Metamorphic |
| 3 | XXXX | XX | XXX | XXX | X | Carbonate, Young Granite and Metamorphic |
| 4 | XX | XXXX | XX | XX | XXX | Old Granite and Volcanic |
| 5 | X | XXX | X | XXXX | XXXX | Metamorphic and Volcanic |
Table 6.
Statistical distribution of endmember fractions per hybrid classes. Numbers are in percent.
Table 6.
Statistical distribution of endmember fractions per hybrid classes. Numbers are in percent.
| Classes | Old granite | Young granite | Metamorphic | Volcanic | Carbonate |
|---|
| L | M-L | M-H | H | L | M-L | M-H | H | L | M-L | M-H | H | L | M-L | M-H | H | L | M-L | M-H | H |
|---|
| 1 | 74 | 16 | 7 | 3 | 11 | 29 | 38 | 22 | 80 | 5 | 5 | 10 | 74 | 9 | 8 | 9 | 62 | 38 | 0 | 0 |
| 2 | 76 | 14 | 7 | 3 | 10 | 28 | 37 | 25 | 78 | 6 | 4 | 12 | 79 | 9 | 5 | 7 | 50 | 50 | 0 | 0 |
| 3 | 73 | 15 | 7 | 5 | 12 | 27 | 38 | 23 | 77 | 6 | 4 | 13 | 79 | 9 | 4 | 8 | 50 | 50 | 0 | 0 |
| 4 | 66 | 17 | 10 | 7 | 18 | 36 | 34 | 12 | 78 | 7 | 3 | 12 | 71 | 11 | 8 | 10 | 64 | 32 | 0 | 0 |
| 5 | 70 | 16 | 9 | 5 | 21 | 42 | 28 | 9 | 76 | 8 | 4 | 12 | 69 | 11 | 8 | 10 | 79 | 21 | 0 | 0 |
Field verification carried out in February 2008 confirmed the results of the image processing work and shows that the interpretation of the resulting products matches field observation on grain/fragment size distribution and the predominant rock composition within each class (
Figure 8). Furthermore, the backscatter coefficient measurements obtained at the surveyed field points and their relationship to rock type and fragment/sediment grain size is comparable to other similar studies conducted in arid environments, specifically that of [
20] who demonstrated a close relationship between backscatter coefficient and the maximum height of rocks in fluvial and aeolian deposits of the western Sahara desert.
Figure 11.
Fraction maps of image endmembers (lighter colors mean high fraction values and dark colors mean low fraction values; except for the error map, where high error values are shown in white and low error values in black). (a) Carbonate, (b) Old granite, (c) Young granite, (d) Metamorphic, (e) Volcanic and (f) RMS error of unmixing result.


