1. Introduction
There are several active volcanoes in the world, located in remote areas, where ground-based or traditional monitoring systems are generally difficult to be employed. Especially (but not exclusively) for these volcanoes, satellite remote sensing may represent an opportunity, to better understand eruptive dynamics, to timely observe changes in the earth’s surface indicating impending events, and to monitor large scale and rapidly evolving phenomena, like ash plume injections into the atmosphere [
1].
Several satellite techniques have been proposed until now to identify and track volcanic ash plumes [e.g.,
2,
3,
4,
5,
6,
7,
8,
9,
10,
11], as well as to detect and monitor volcanic hot spots [e.g.,
12,
13,
14,
15,
16,
17,
18,
19,
20,
21,
22,
23], using data provided by both polar and geostationary satellites. An original multi-temporal approach, named RST—Robust Satellite Technique [
24], already successfully used to study both volcanic phenomena [
9,
10,
11,
25,
26,
27,
28], has been implemented in an automatic system developed in IMAA-DIFA laboratories (Institute of Methodologies for Environmental Analysis-Department of Engineering and Physics of the Environment), to monitor Italian volcanoes in near real time. This approach, originally designed and developed for NOAA-AVHRR (National Oceanic and Atmospheric Administration-Advanced Very High Resolution Radiometer) records, has recently been updated in order to facilitate exportation even to EOS-MODIS (Earth Observing System-Moderate Resolution Imaging Spectroradiometer) and MSG-SEVIRI (Meteosat Second Generation-Spinning Enhanced Visible and Infra-Red Imager) data, for which further improvements of RST performances are expected. MODIS offers, in fact, a better radiometric resolution than AVHRR and an improved spectral resolution, with two channels in MIR spectral region, one of them assuring an improved dynamic range and a higher saturation level (more than 500 K, compared to an average of about 320 K saturation brightness temperature for the AVHRR sensors in MIR band), particularly suitable to identify high temperature surfaces. Besides, SEVIRI, providing data with a 15 minutes temporal resolution, the highest currently available, offers a great opportunity to monitor volcanic phenomena in real time, in a quasi-continuous way. Moreover, thanks to a spectral channel in SO
2 absorption band (around 8.6 µm), both MODIS and SEVIRI should guarantee an improvement of RST performances in volcanic cloud detection and tracking.
In this paper, some preliminarily results of RST implementation on data provided by these satellite sensors are presented, discussing RST potential within a possible early warning system devoted to volcanic hazard monitoring and mitigation.
2. RST Approach
RST is a multi-temporal approach of data analysis that considers every anomaly in space-time domain as a deviation from an “unperturbed” state, specific for each place and time of observation [
24]. Long-term historical series of satellite records are processed in multi-temporal sequence, stacked according to homogeneity criteria in order to reconstruct the “normal” behavior of the signal, which is required to compute a local variation index, named ALICE (Absolute Llocal Index of Change of the Environment), and used to automatically identify perturbing events. Such an index, defined at pixel level, is expressed in its general formulation as:
In Equation (1),
V(x,y,t) represents the satellite signal measured at time
t for each pixel (
x,y), while
µv(x,y) and
σv(x,y) respectively represent the temporal mean (
i.e., expected value) and standard deviation (
i.e., natural variability) of the same signal, determined processing long time series of homogenous satellite records, stratified according to some homogeneity criteria (e.g., same spectral channel/s, same month and acquisition time) [
24]. These spectral reference fields are calculated after the application of a specific cloud detection scheme [
29,
30], and after the computation of a
kσ clipping filter, used at pixel level in order to automatically remove possible signal outliers related to residual spurious effects [
24].
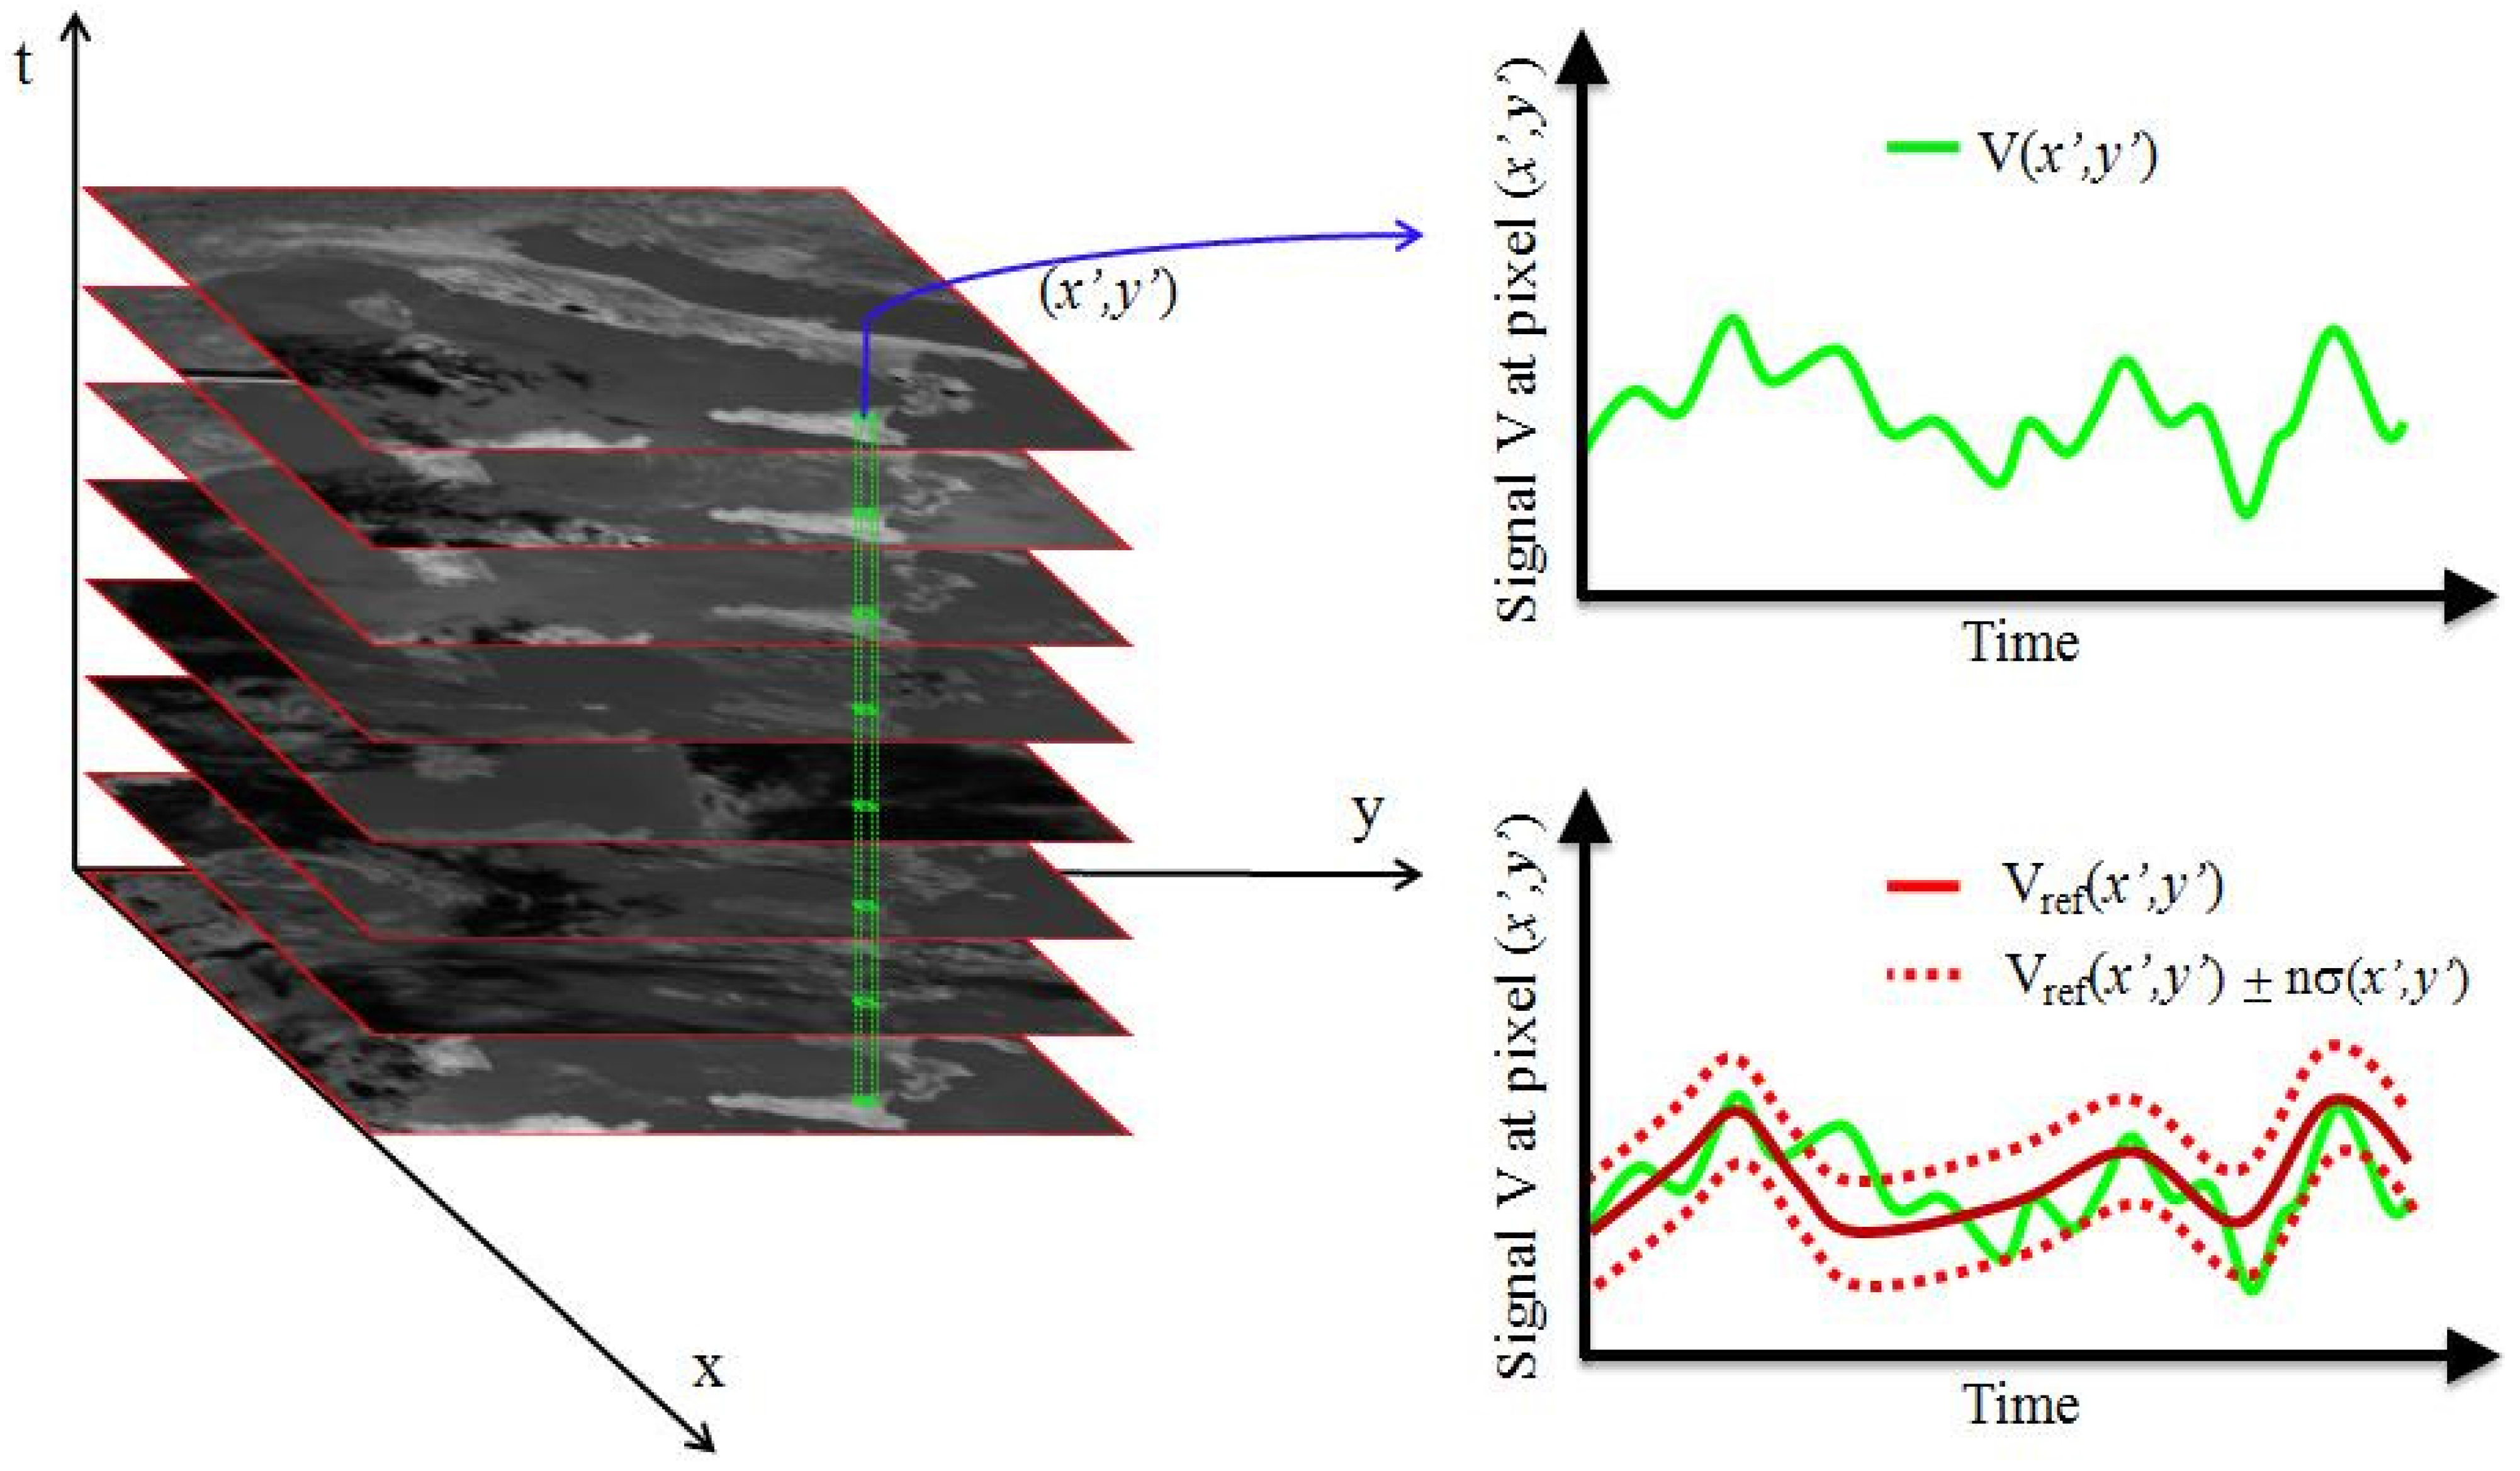
Figure 1.
Schematic sketch of RST approach. On the left, a generic data-set of satellite imagery co-located in the space-time domain. On the right, a time series of a generic signal (in green) measured for a specific location (x’,y’) is plotted (top panel); the derived expected behavior (e.g., temporal mean, red solid line), together with statistical confidence levels (e.g., temporal standard deviations, red dotted lines), are reported (bottom panel).
The ⊗V(x,y,t) index gives an indication of how much the satellite signal at hand deviates from its normal behavior. This deviation is then weighted by a factor (i.e., σv(x,y)) representing a measure of the natural fluctuation of the signal, historically observed in the analyzed time series, which depends on both natural and observational noise contributions.
In practice, anomaly detection is intrinsically more difficult in areas (and periods) where natural fluctuations are normally high, whereas, in correspondence of very stable and clean series, even a slight deviation may be promptly identified and flagged as an anomaly. In general, the higher (in modulus) the index value, the stronger the intensity of detected anomaly.
This general scheme of data analysis, which may be used to study several natural and environmental hazards (e.g., earthquakes, oil spills, floods, forest fires, etc.) producing variations in spectral signals measured from space, in the specific case of volcanic activity monitoring has already been applied to detect hot spots as well as to identify volcanic ash plumes, by using different spectral signatures (observed in single channel and/or in band combination).
In the following sections a brief description of these specific applications is reported.
2.1. RST Approach for Thermal Activity Monitoring
The RST approach for volcanic hot spot detection and monitoring has widely been described in several papers [e.g.,
19,
20].
Briefly, the satellite signal acquired in MIR spectral band, at around 3.5–4μm, the most sensitive to high temperature surfaces, is processed in the space-time domain, within the multi-temporal approach described above. The specific ALICE index is then computed as:
where
TMIR(x,y,t) is the signal measured in the MIR spectral channel (in terms of brightness temperature) at place (
x,y) and time
t (
i.e.,
t is the acquisition time of the image at hand to be analyzed), while
µMIR(x,y) and
σMIR(x,y) respectively represent the temporal mean and the temporal standard deviation of the signal, derived for the same place (
x,y) under similar observational conditions, following the above mentioned RST prescriptions.
The ⊗MIR(x,y,t) index is intrinsically not affected by site effects (i.e., variations of the surface emissivity, high reflectivity of exposed soils, natural warming of volcanic rocks, etc.) that may represent a possible cause of false identification in automatic detection of volcanic hot spots from space. These effects, in fact, generally occur in the same places and under similar observational conditions (e.g., around noon and in summer on exposed soils), are considered as “normal” by RST and do not produce anomalous values of the ALICE index (because, for example, of high values of µMIR(x,y)) and, consequently, do not generate false identifications.
As previously reported, the ⊗MIR(x,y,t) index gives an indication of how much the TMIR(x,y,t) signal, measured at time t, deviates from its normal behavior. Therefore, high values of the ⊗MIR(x,y,t) index are expected in the presence of thermal features at high temperature and/or of large extent.
Different critical levels of the
⊗MIR(x,y,t) index, provided they are statistically significant, are also computed to better identify different intensity hot spots, with low values of this index more suitable to detect weak anomalous thermal signals, like the ones that sometimes occur before the beginning of new eruptive events [
20,
25]. RST approach has demonstrated in several test cases to perform well, although some residual problems and limitations still remain that need to be fully assessed and quantified. A specific study, still in progress at time of writing, aims to better quantify RST performances both in terms of reliability and sensitivity in detecting volcanic hot spots. In particular, a long term time domain analysis of satellite records is under investigation to validate the daily hot spot products with available ground true. Preliminary results seem to confirm that residual RST inaccuracies arise from cloud edges in daytime data and/or from natural signal fluctuation effects.
In
Section 3, some preliminary results of RST implementation on MSG-SEVIRI data, achieved analyzing the eruptive Mt. Etna eruptive events of February 2005, will be shown and discussed, evaluating advantages expected by the use of geostationary satellite images.
2.2. RST Approach for Ash Plume Detection and Tracking
RST approach was also proposed and applied for volcanic ash cloud detection, demonstrating to be capable of overcoming some limits of traditional, fixed threshold based, methods [
11,
12].
The method strongly relies on the traditional ash detection scheme formerly proposed by Prata [
2]. Main differences are: (i) it considers relative rather than absolute signals; (ii) a three-channel scheme (adding signal measured in MIR band) is implemented. Briefly, taking into account the inverse behavior of volcanic ash particles at spectral wavelengths of 11 µm and 12 µm in comparison with atmospheric water vapor, due to acid component and ash particles, and considering that even the spectral difference of the signal measured at around 3.5 µm and 11 µm may provide useful indications about ash plumes [
5,
6,
9,
10], two local variation indexes are computed as:
where
T3(x,y,t),
T11(x,y,t) and
T12(x,y,t) respectively represent the brightness temperatures measured at around 3.5 µm, 11 µm and 12 µm,
µT11-T12(x,y,t) and
µT3-T11(x,y,t) are the temporal means, and
σT11-T12(x,y,t) and
σT3-T11(x,y,t) the temporal standard deviations, of the correspondent temperature differences determined processing long-term time series of homogeneous satellite records, according to RST prescriptions [
11,
12].
Negative values of the
⊗T11-T12(x,y,t) index are expected in the presence of volcanic ash clouds, while positive values of the
⊗T3-T11(x,y,t) index, with different intensity depending on the base of observational conditions, should characterize the same volcanic features [
9,
10].
By combining the above mentioned local variation indexes, if different critical levels of the signal are analyzed, volcanic ash clouds may be correctly discriminated from meteorological ones, and automatically identified in their correct shape and extent [
10].
In
Section 4, some preliminary results of RST implementation on EOS-MODIS data for ash cloud detection, obtained studying the Mt. Etna eruptive events of October 2002, will be shown and discussed.
3. Hot Spot Detection Using SEVIRI Data
Aiming at “continuous” satellite monitoring, rapid alert and early warning capabilities, RST has recently been implemented on MSG-SEVIRI data, providing information from the best observational frequency presently available (
i.e., 15 minutes). SEVIRI, like GOES that was already used to determine eruption onset with fairly good results [
31], offers a great opportunity to follow space time evolution of volcanic phenomena, thanks to the above mentioned unique temporal resolution. Furthermore, the natural collocation of satellite images, the invariance of view angles among different images together with the constant and precise acquisition times from day to day, all factors reducing the observational noise, should further increase RST sensitivity to subtle hot spots [
32].
In this section, the results achieved by using RST approach on MSG-SEVIRI records, acquired on 17 February 2005, during an eruption in progress at Mt. Etna, are reported. This study was carried out in order to verify RST/SEVIRI system capability to automatically detect abrupt changes in thermal volcanic activity. Moreover, the assessment of RST performances, even with a scarcely populated series of historical satellite records, was another objective of this work. Only two years of satellite records were, in fact, available at the time of the event in order to construct the spectral reference field of temporal mean and standard deviation, (i.e., SEVIRI operational since 2003).
The RST approach was implemented on SEVIRI data computing the ⊗MIR(x,y,t) index, for the first time, on 96 different time slots (24 hours at 15 minute steps), and analyzing its temporal trend for the pixels covering the volcano edifice of Mt. Etna.
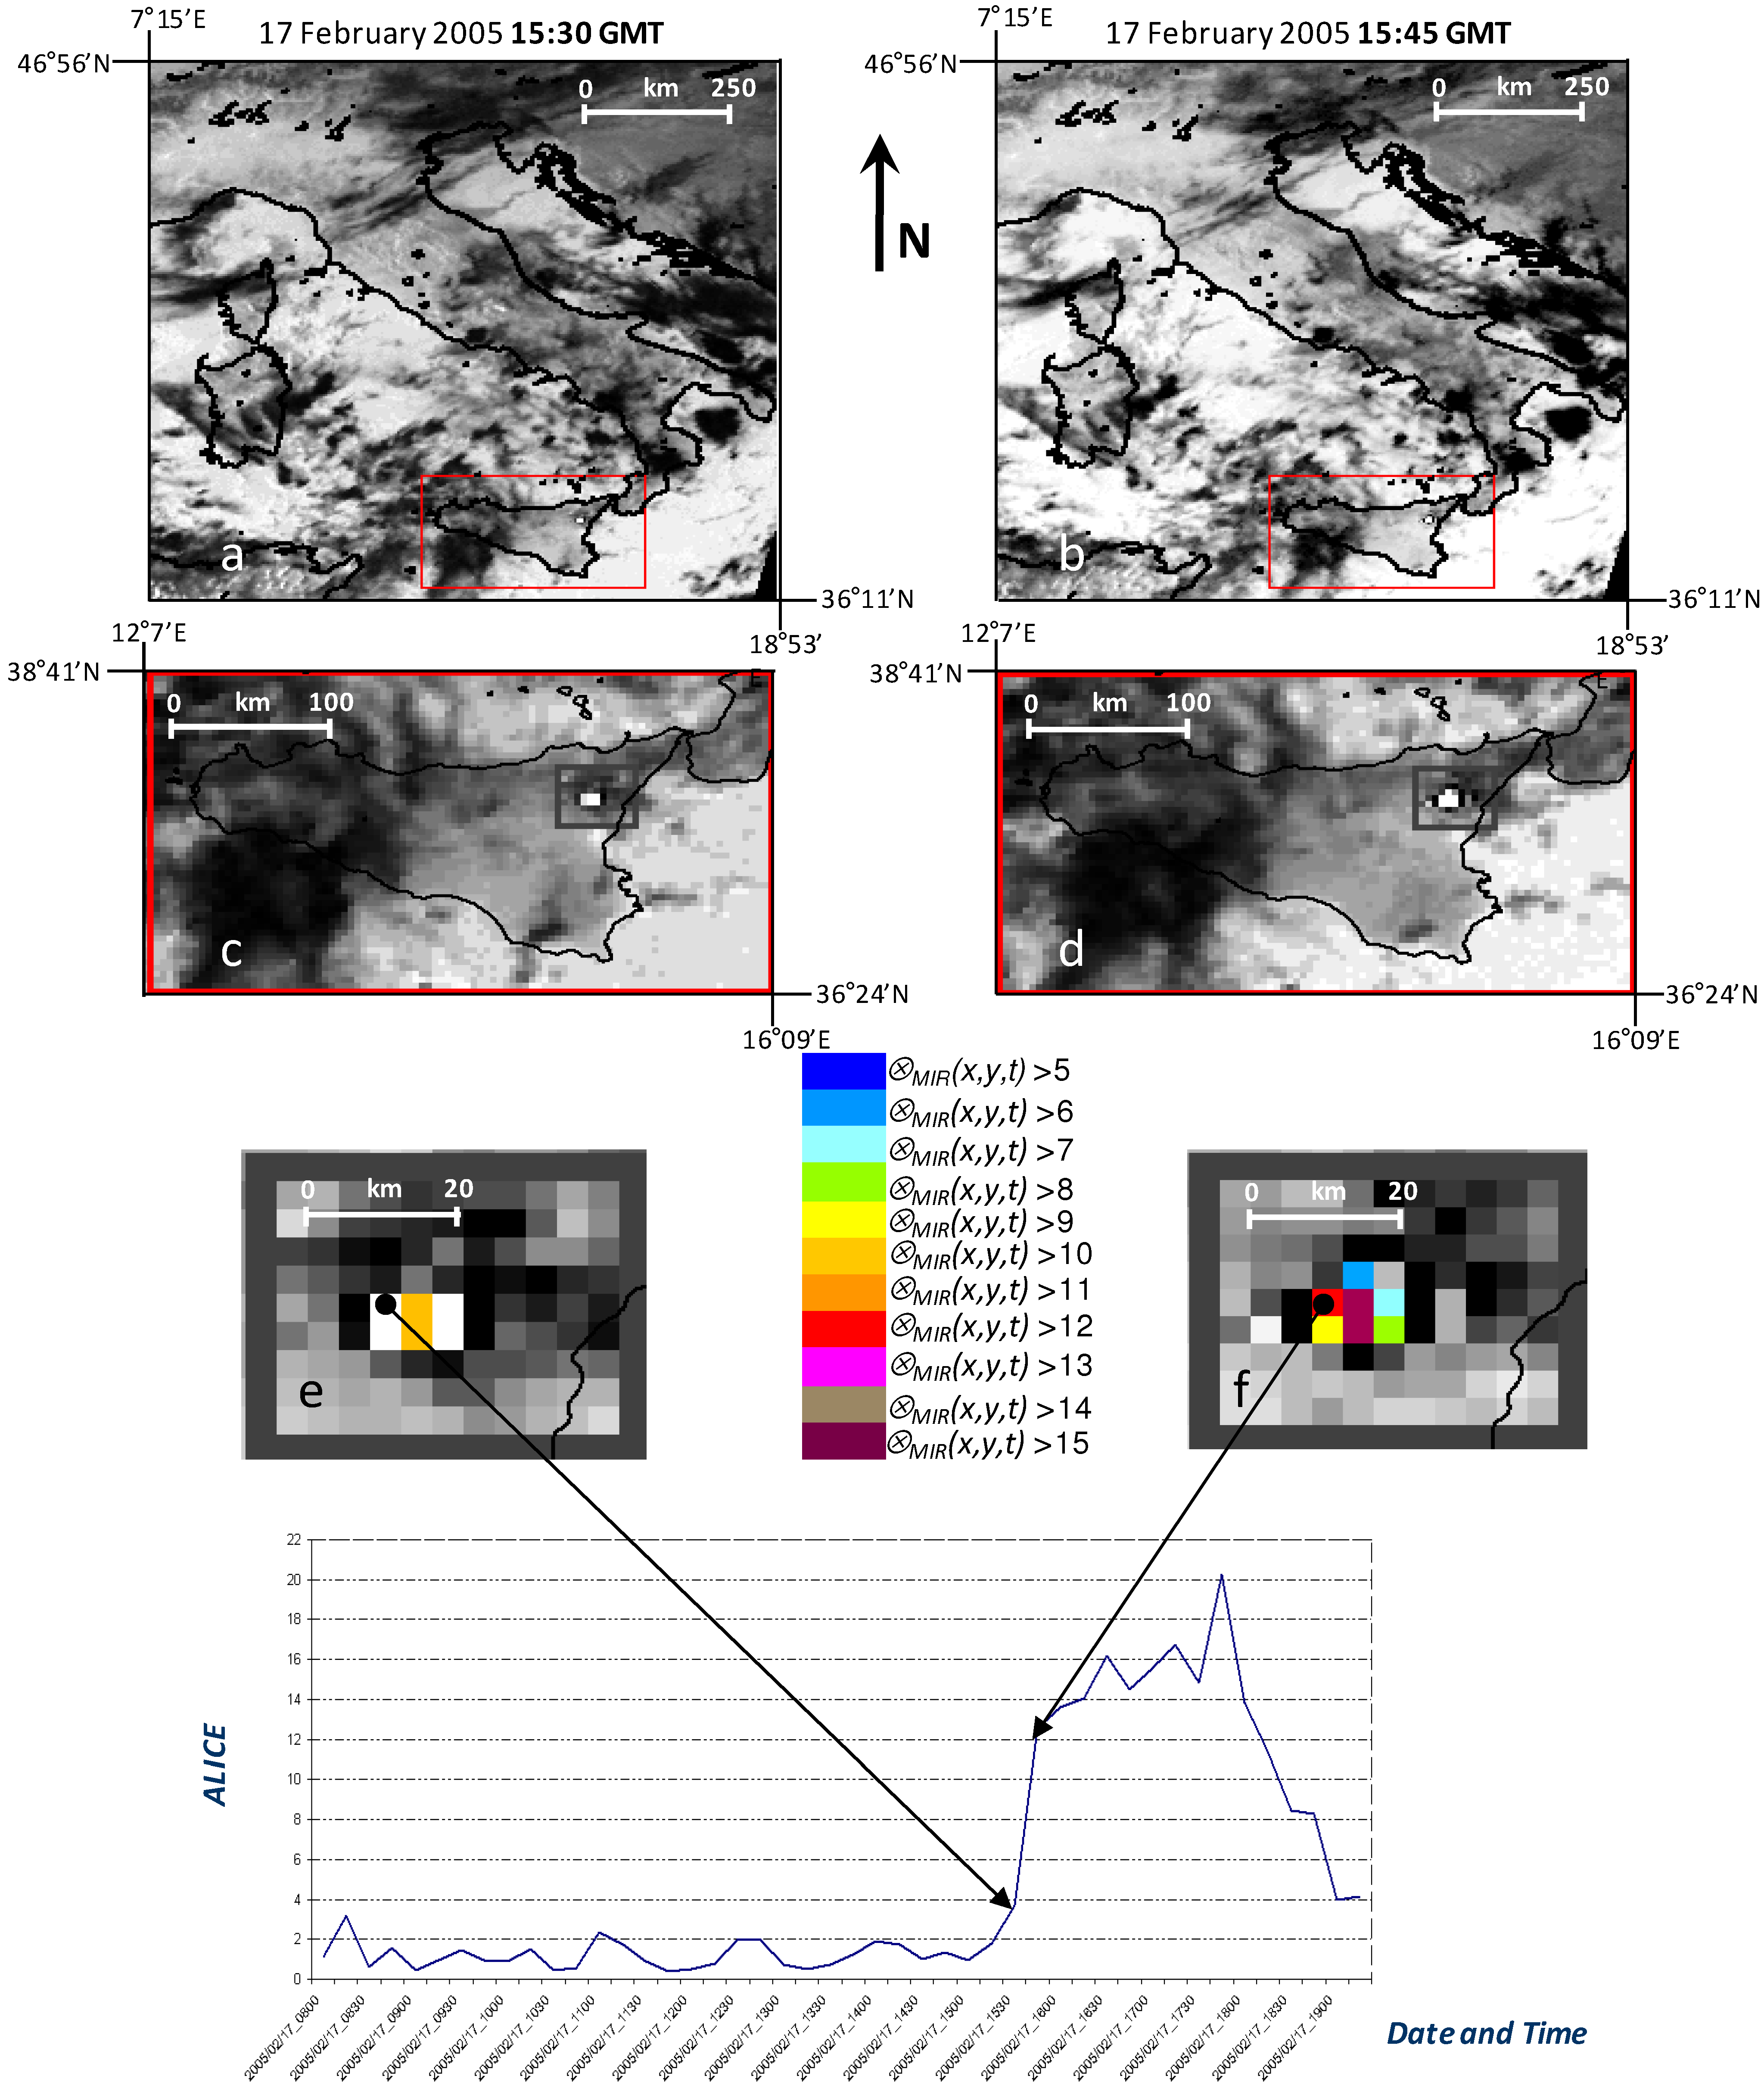
As can be seen from
Figure 2, where the trend of the
⊗MIR(x,y,t) index from 08:00 GMT to 19:00 GMT is reported for a pixel of the volcano edifice, starting from quite a stationary condition (with
⊗MIR(x,y,t) ≤ 2) recorded until 15:15 GMT, a sudden increase of
⊗MIR(x,y,t) index (
⊗MIR(x,y,t) ≅ 4) was observed, this was significant since it occurred between two SEVIRI acquisitions rather than over a longer time period of an hour. Although, in this case, the reference fields are likely to suffer from a poor data set population, this value represents a statistically significant anomaly that, in case of a normal distribution, corresponds to a probability of occurrence lower than 0.1%.
Therefore, this sudden increase in thermal signal indicated the occurrence of a perturbing event at Mt. Etna on the afternoon of 17 February 2005. The ⊗MIR(x,y,t) index, in fact, continued to significantly increase at 15:45 GMT, up to a very anomalous value (⊗MIR(x,y,t) ≅ 13), and still maintained such high values even over the following few hours, confirming the presence of a forcing thermal source at very high temperature at the surface. Such an abrupt increase, from ⊗MIR(x,y,t) ≅ 4 up to ⊗MIR(x,y,t) ≅ 13 represented the most intense variation observed in the volcanic area. Even surrounding pixels, in fact, (like the ones that were characterized by a different thermal activity in progress at volcano), showed a thermal variation, measured by the ALICE index, but with a relative intensity less significant from a statistical point of view.
Figure 2.
15-minute temporal variation of the ⊗MIR(x,y,t) index for a pixel including an eruptive vent that emitted a lava flow on 17 February 2005. On the top, two magnifications of the SEVIRI products of 15:30 (left) and 15:45 (right) are reported. On the bottom, the zooms of the volcanic area, and plot of temporal fluctuations of ⊗MIR(x,y,t), with black arrows indicating pixel for which time series was computed.
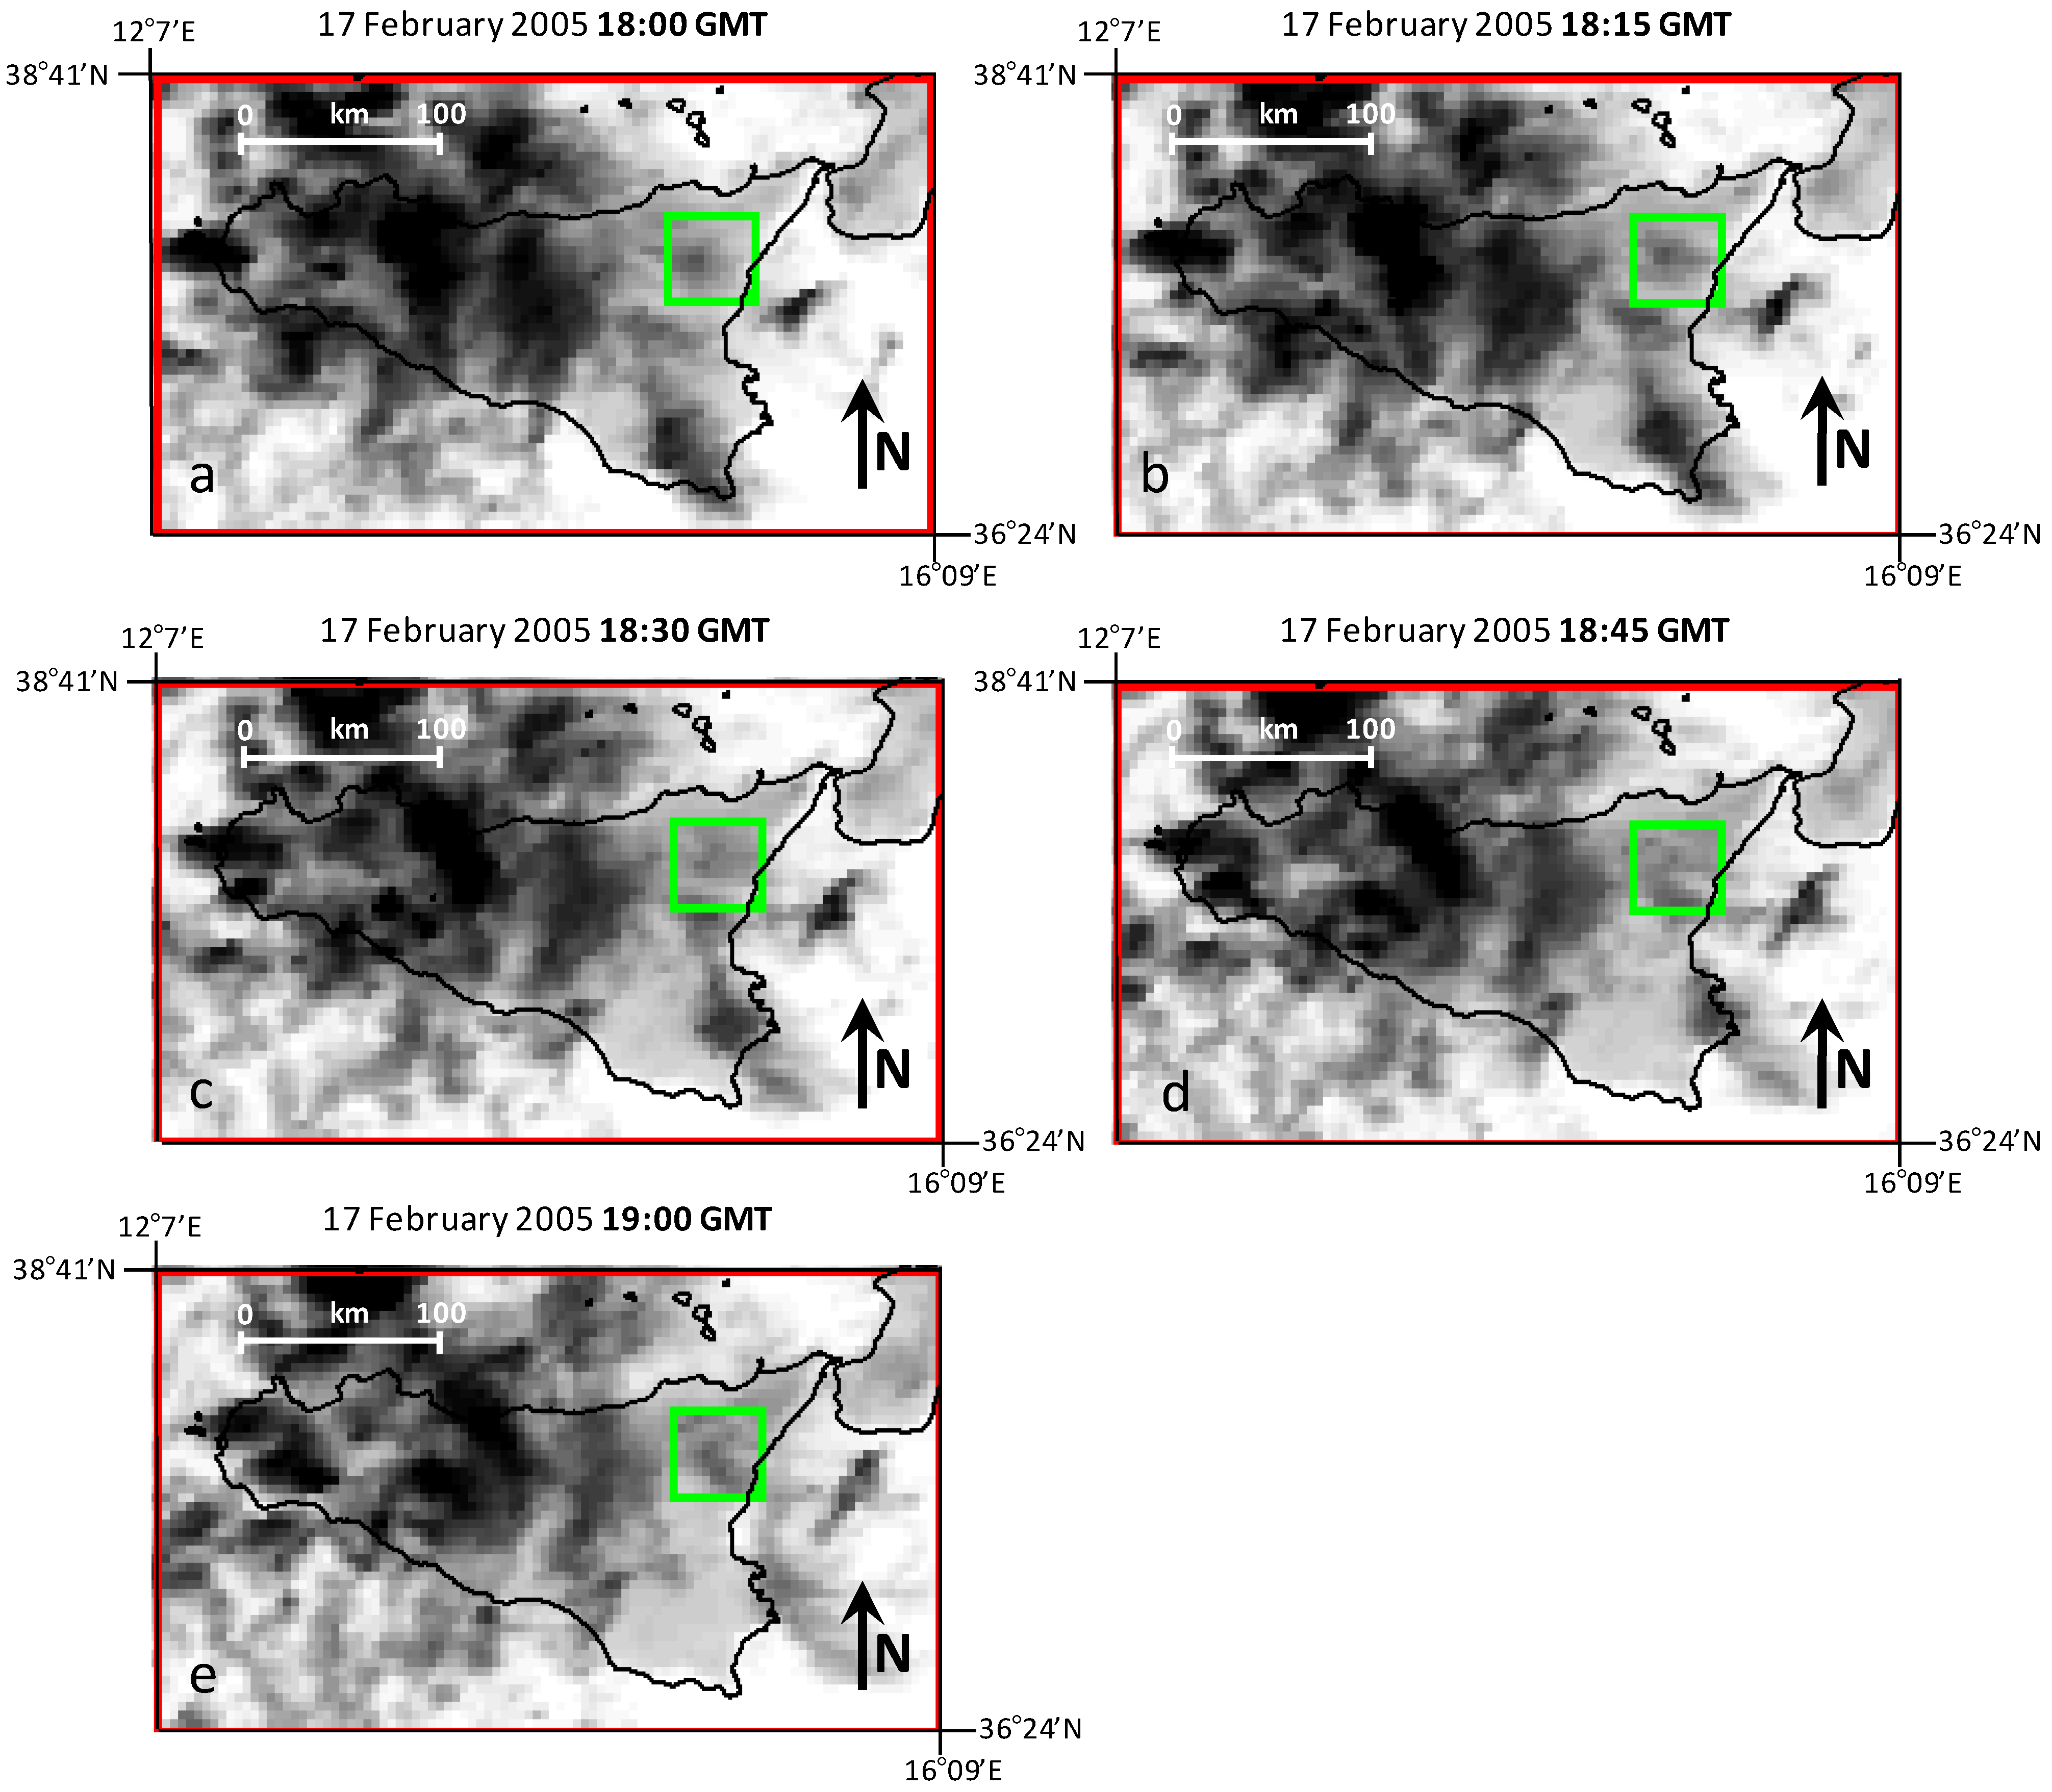
As can be seen from the figure, the peak in
⊗MIR(x,y,t) index value was reached at 18:00 GMT (
⊗MIR(x,y,t) > 20). From 18:00 GMT, a reduction of
⊗MIR(x,y,t) index value was observed because of a clouds passage that progressively contaminated the Region of Interest, as shown in
Figure 3. The observation of an abrupt increase in thermal signal at Mt. Etna on 17 February 2005 was in agreement with a newly documented lava effusion that took place from an eruptive fracture which opened on 10 September 2004 at 2,620 m altitude. The ground based observations, carried out the day after at volcano, confirmed, in fact, the presence of a new lava flow that reached 1,950 m, moving towards Serra Giannicola Grande [
32]. This retrospective analysis of high-temporal resolution data shows the potential of the
⊗MIR(x,y,t) index in timely detecting increases in thermal signal occurring at beginning of new eruptive events.
Figure 3.
15-minute temporal sequence of SEVIRI thermal infrared images (Ch9) of 17 February 2005 acquired between 18:00 GMT and 19:00 GMT showing a progressive cloud cover (dark pixels in the scenes indicate clouds) of the Mt. Etna area (green box).
Figure 3.
15-minute temporal sequence of SEVIRI thermal infrared images (Ch9) of 17 February 2005 acquired between 18:00 GMT and 19:00 GMT showing a progressive cloud cover (dark pixels in the scenes indicate clouds) of the Mt. Etna area (green box).
Afterwards, other similar results were obtained by the same detection scheme even in different geographic areas and using longer time series of historical satellite records [
27,
33].
These studies seem to show that the higher signal-to-noise ratio offered by SEVIRI in comparison with polar satellite sensors, related to natural collocation of the images and to the invariance of acquisition time slots, may offer a wider range of critical levels of the signal more suitable to better discriminate volcanic hot spots, and to identify the beginning of new eruptive events.
4. Ash Plume Detection Using MODIS Data
MODIS sensor offers a high radiometric resolution (12 bit) in 36 spectral channels, ranging in wavelength 0.4–14.4µm, with a spatial resolution up to 250 m for visible bands (2 channels at 250 m, 5 at 500 m, and the remaining 29 channels at 1 km).
Some of these channels, being centered in MIR and TIR spectral bands are particularly suitable to detect hot spots, as well as to identify and track volcanic ash plumes. In this section, some preliminarily results of RST implementation on this sensor data for ash cloud detection and tracking are reported.
Starting from 27 October 2002 a new flank eruption took place at Mt. Etna emitting a significant amount of lava. An impressive ash cloud was also generated, forcing the closure of Fontana Rossa Catania’s International airport for several days [
32].
Such an eruption was monitored in near real time by RST, previously named RAT (Robust AVHRR Technique), processing NOAA-AVHRR records to detect hot spots [
20] as well as to identify and track volcanic ash plumes [
10].
In this work, the RAT approach for ash cloud detection and tracking is, for the first time, applied to MODIS data (moving from RAT to RST), in order to confirm its intrinsic exportability to whatever satellite system, saving its performances. If confirmed, in fact, RST independence on specific satellite sensors and platforms, will allow for its implementation within an integrated, multi-sensor approach that will guarantee improved monitoring capabilities.
A large data-set of satellite images was processed with this aim in mind. More than 1,000 MODIS data, covering the period 2000–2008, were analyzed following RST prescriptions. In particular, data were stratified in two data-sets, one including all the diurnal pass of Terra and Aqua satellites over the Mt. Etna Region, and the other collecting all the night-time data, both used to generate the spectral reference fields required for the local variation indexes computation, as described in paragraph 2.2.
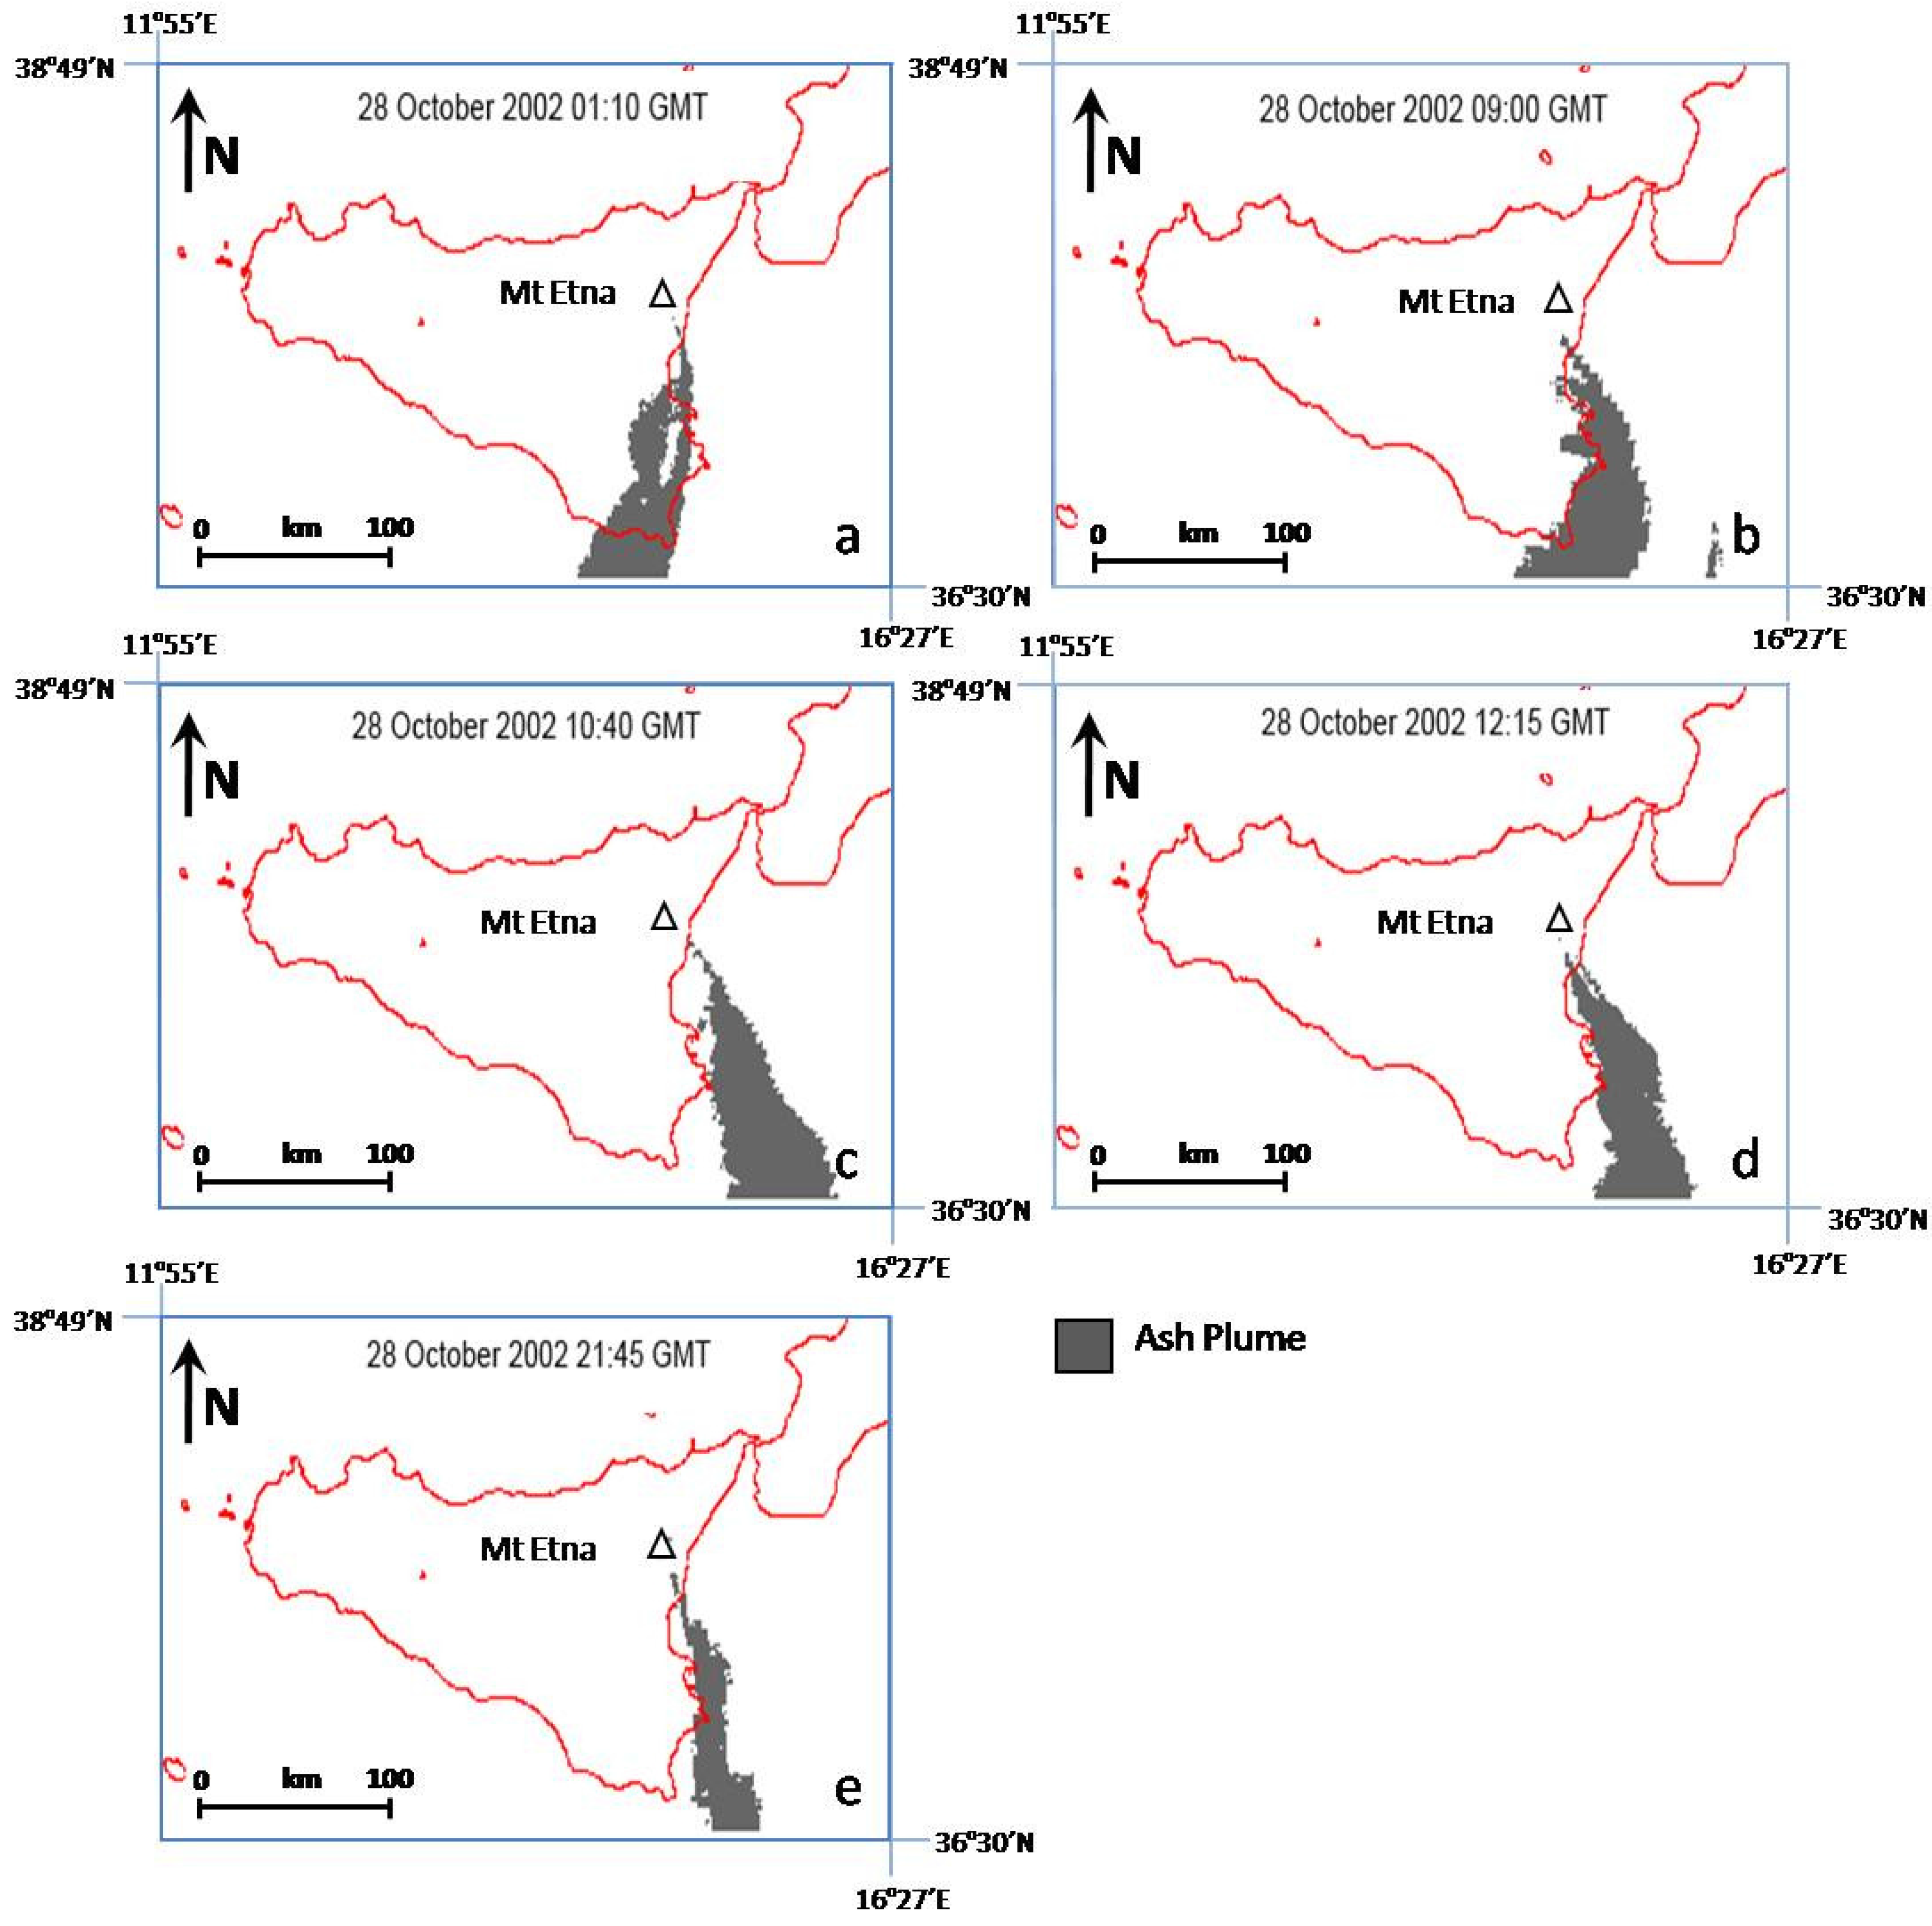
In
Figure 4, a time sequence of MODIS ash products, derived over the Region of Interest (centered over Mt. Etna area) for 28 October 2002 at different time passes, are reported.
These products demonstrate RST capabilities in detecting space-time evolution of volcanic ash clouds also when applied to MODIS data and even in different observational conditions (
i.e., processing both night- and day-time satellite records). It should be noted that these results are in very good agreement with the ones formerly achieved by using NOAA-AVHRR records, which confirmed the improvement offered by RAT/RST in comparison with traditional split window products in effectively discriminating ash from weather clouds with a good accuracy [
10].
In order to better appreciate RST performances in correctly detecting and discriminating volcanic ash plumes from meteorological clouds, the satellite overpass of 30 October acquired at 12:05 GMT has been reported in
Figure 5. This figure (RGB image) shows that even in the presence of conspicuous and diffuse meteorological clouds over the scene, the volcanic ash cloud was successfully identified without any misdetection. These results suggest that the integration of AVHRR and MODIS records, within the proposed detection scheme, is actually feasible in order to increase the frequency of observation in active volcanic areas, improving temporal sampling for a more effective satellite monitoring of volcanic phenomena.
Figure 4.
Temporal sequence of RTS ash products (grey pixels) generated processing all the MODIS records acquired on 28 October 2002 over Mt. Etna area (the white triangle in the figure). Red lines represent coastlines.
Figure 4.
Temporal sequence of RTS ash products (grey pixels) generated processing all the MODIS records acquired on 28 October 2002 over Mt. Etna area (the white triangle in the figure). Red lines represent coastlines.
These results encourage the full implementation of RST on different satellite sensors, like SEVIRI, in view of an actual implementation of such a technique within a possible operational scenario.
Figure 5.
EOS-MODIS RGB image of 30 October 2002 at 12:05 GMT. The ash plume detected by RST is marked in red.
Figure 5.
EOS-MODIS RGB image of 30 October 2002 at 12:05 GMT. The ash plume detected by RST is marked in red.
5. Conclusions
In this paper, the RST—Robust Satellite Technique exportability on different space systems (EOS-MODIS and MSG-SEVIRI) and its potential in detecting and monitoring volcanic hot spots, as well as in identifying and tracking volcanic ash plumes, has been analyzed.
As shown in previous papers, SEVIRI, thanks to natural collocation of satellite images and the native stability of view-angles (peculiar to geostationary satellites), reducing the observational noise, may further increase RST sensitivity in detecting subtle hot spots. Moreover, its temporal resolution of 15 minutes (the best currently available) offers a unique opportunity to promptly identify abrupt changes in thermal signals possibly related to the beginning of new eruptive events.
In this work, the first promptly and timely hot spot detection performed using RST on SEVIRI data has been reported and discussed. Analyzing the temporal trend of ⊗MIR(x,y,t) index computed at 96 different time slots, over Mt. Etna area, an abrupt increase in thermal signal was clearly observed in the early afternoon of 17 February 2005, corresponding with a new lava effusion from an eruptive fissure opened since September 2004. The unique temporal resolution, together with the high sensitivity offered by SEVIRI, confirms that the RST scheme applied to these data, may represent a powerful tool for volcano monitoring, especially in terms of early warning and rapid detection purposes. This study has also demonstrated that RST may be successfully implemented even when only a scarcely populated time series of historical satellite records is available. However, in order to obtain the best performances, the use of a more dense multi-year series of satellite records is preferable.
Some preliminarily results of RST implementation even on MODIS data, regarding ash plume identification and tracking, have also been reported and discussed in this paper. The Mt. Etna eruption of October 2002, already successfully monitored and investigated using NOAA-AVHRR records, was analyzed here using EOS-MODIS data, by implementing the RST approach for the first time for this kind of application. Preliminarily results here confirm the RST capabilities in detecting and tracking volcanic ash plumes using different satellite sensor data. Moreover, this study suggests that AVHRR and MODIS records, within the RST scheme, may potentially be integrated in order to increase the frequency of observations in areas like Mt. Etna, for a more effective and continuous satellite surveillance of active volcanoes.
The methodology may easily be implemented on whichever kind of satellite sensor data, without requiring any ancillary information, and is practical in a global sense. This method offers some important advantages both in terms of reliability and efficiency, and is, in principle, suitable to be used within operational contexts. It is mainly based on data which are freely available on the web, thus the costs for reference fields computation are only related to labor efforts and computing times. Finally, it should be stressed that, in terms of cost-benefit, the possible major costs required for an operational use of this method in comparison to traditional ones, are likely to be balanced by the high performances assured in monitoring volcanoes.


