1. Introduction
Growth observation, impact assessment, and timely strategic response to small variations in crop production is known as precision agriculture. It has been used in a wide range of agricultural activities including field crop production, dairy farming, horticulture, and forest management. Site-specific crop management (SSCM) is one facet of precision agriculture which involves spatial referencing, crop and climate monitoring, attribute mapping, decision support systems, and differential action. SSCM is carried out with a greater degree of precision through the use of geospatial technologies. Geospatial technology is a combination of four essential tools: remote sensing, geographic information systems (GIS), global positioning systems (GPS), and information technology or data management [
1,
2,
3,
4,
5,
6,
7]. SSCM has become very common in management of field and row crops during recent years. Yet, its application for non-traditional horticultural crops has not been very widespread [
8]. Companies, such as Lanworth (
http://lanworth.com/), which gather intelligence on natural resources, use geospatial technologies to map, analyze, and forecast agriculture and forest output. This is based on crop and forest growth parameters which is a large amount of data, terabytes in size. It helps in the SSCM of agricultural and forest products and increases the yield in a sustainable manner.
The application of aerial or satellite imaging, along with GPS and GIS, is the first step towards the successful application of SSCM for fruit and nut crops [
9]. The use of SSCM for horticultural crops such as fruit and nut crops has potential for increasing net returns and optimizing resource use [
8]. The delineation of orchards and spatial analysis using geospatial technology can provide additional information for management decision making, such as the determination of fruit yield, the quantification and scheduling of precise and proper fertilizer, irrigation needs, and the application of pesticides for pest and disease management. Ultimately, it will improve profits for producers [
8]. The use of remote sensing has become common for the general detection of the growth and health of orchards on a larger scale. However, digital imaging technology is increasingly being used for intensive site-specific management of orchards as well, for instance: estimating the amount of fruits on individual trees, fruit quality, and also leaf area index or crown cover.
The overall goal of this paper is to provide a review of studies that use geospatial technology and especially remote sensing for conducting SSCM in fruit and nut crops, including oranges, peaches, pecans, apples, grapes, blueberries, as well as other crops around the world. Another objective of this paper is to help fruit and nut crop managers and other stakeholders to understand the applications of geospatial technology for proper management of their crops and subsequently increase their productivity.
2. SSCM in Agricultural (Row) Crops
Research on precision agriculture has been conducted since the late 1980s. However, a rapid development with respect to SSCM of agricultural crops, especially row crops, occurred during the nineties and the early years of the 21st century. Initial research mostly included yield forecasting and recommendations to address the low yield levels for specific locations in individual fields. Research on precision management of agricultural crops includes maize [
2,
3,
4,
10,
11,
12], wheat [
5,
6], soybean [
11,
13,
14], cotton [
15,
16,
17], sugar beet [
18], barley [
19], sorghum [
20,
21], oats [
22] and others that are common in the United States and other countries across the world [
23,
24,
25,
26,
27]. Most studies used remotely sensed imageries, including panchromatic, multi-spectral or hyperspectral satellite, aerial, and video photographs. They also used other geospatial techniques such as image processing, GIS, and GPS for the spatial-based yield estimation of different crops. A few examples of SSCM for traditional row crops are discussed below:
Diker
et al. [
10] suggested the potential application of aerial photos and GIS to monitor spatial and temporal variability within a field and to estimate the potential yield of maize. They used four vegetation indices, the normalized difference vegetation index (NDVI), green NDVI (GNDVI), IR/R, and IR/G, to compare yield monitor data, SPAD (Soil and Plant Analyzer Development) chlorophyll meter reading, and leaf area index (LAI). Gopalapillai
et al. [
11] used digital multi-spectral images to derive spatial weed density for a soybean field. For image calibration, they used image indices such as NDVI, SRI, normalized NIR, and red and green band information. In their study, surprisingly, the correlation between image indices and weed density changed with different resolutions. High resolution imageries pinpointed the weed locations with single pixels. Thus, it reduced the number of mixed pixels (mixels) of crop and weed together. At a 5.3 m pixel resolution, the correlation between the indices and the weed density was highest. They also found a correlation between planting date, soil types, and herbicide applications with respect to weed density.
Seidl
et al. [
13] found that by incorporating remote sensing information through normalized vegetation index (NVI) with modeling they could improve the prediction of soybean yield with the CROPGRO-Soybean model using spatial variability information. Goel
et al. [
14] reported a strong correlation between the digital information, e.g., spectral data of the aerial image, and soybean crop physiological parameters such as chlorophyll fluorescence, leaf greenness, leaf area index (LAI), photosynthesis rate, and plant height. In another application, Goel
et al. [
14] used multi-spectral (24 wave band) airborne optical remote sensing for detecting weed infestation in site-specific managed field crops. They used the multi-spectral band, with a range of 475.12 nm to 910.01 nm, and their results indicated that the wave band centered on 675.98 and 685.17 nm in the red region and 743.93 to 830.43 nm in the NIR region, had good potential for weed classification in a maize field. The Schiffes multiple range tests provided a
p-value that was less than 0.05 to support their findings.
Plant
et al. [
15] used the aerial images of a cotton field to determine final yield potential based on NDVI. They found that the spatio-temporal pattern of NDVI reflected the nitrogen stress factor of the cotton plant. However, the NDVI also tended to indicate that the stress factor did not result in a significant yield reduction. Teixeira and Ustin [
16] determined that NDVI values developed from aerial images can be good indicators for estimating cotton yield, while the differences in NDVI could provide guidance in locating specific areas where yield was reduced.
Yang and Anderson [
20] used color-infrared (CIR) images obtained in 1995 and 1996 with a three-camera digital video imaging system from two sorghum fields in southern Texas to estimate crop yield. They found significant correlation coefficients (r) between grain yield and the NIR-band, R-band, G-band, and NDVI information of the digital video image based on stepwise regression. Yang and Everett [
21] used color-infrared digital images to predict the yield of commercial sorghum fields. They found a correlation between sorghum yield and the green ratio (NIR/ Green) value of the digital image data.
Humburg and Stange [
18] obtained five multi-spectral aerial images on different dates from an experiment consisting of ten different fertility treatments and spectrometer readings from the same plots to determine the correlation between the spectral indices and sugarbeet quality variables, such as recoverable sugar. They found that the green NDVI had the best correlation of more than 86% compared to the normal gray values of individual bands (red, green, or blue). Lamb
et al. [
22] used airborne digital imaging for evaluating the accuracy of mapping weeds in seedling crops (wild oats). They found a correlation of 71% between the NDVI and SAVI images and the weed data obtained from the field.
With respect to the application of SSCM in other regions of the world, Ray
et al. [
17] used NDVI derived from spectral information that was obtained from the LISS I sensor located on an Indian Remote Sensing (IRS) satellite to predict cotton yield for a very large area,
i.e., the Sundarnagar district of Gujarat in India. Their model to estimate yield, provided very promising results with only a 1.2% relative deviation from the actual yield. Sun [
27] used advanced “3S-technology” (RS, GIS, and GPS) to monitor the growth of crops and to provide recommendations for crop management in China. He analyzed a range of information sources: aerial photographs, meteorological satellite data, Landsat TM data, GIS, ground survey data for local growth and development monitoring, crop planting area, crop yield, and other relevant information pertaining to China. He concluded that remote sensing has potential for dynamic monitoring and yield estimation of many types of crops for large regions. However, his study did not provide any information with respect to the accuracy of his yield predictions.
3. Precision Agriculture for Management of Traditional Agronomic Crops
Many studies [
1,
2,
3,
4,
5,
6,
7,
8,
9,
10,
11,
12,
13,
14,
15,
16,
17,
18,
19,
20,
21,
22,
23,
24,
25,
26,
27] have been conducted worldwide to determine the variation in crop yield using remotely-sensed measurements. However, more recent SSCM studies have focused on the determination of the spatial variability of soil nutrients, water stress, location-based crop diseases, and other parameters associated with in-field variability [
28,
29,
30,
31,
32,
33,
34,
35,
36,
37,
38]. Some research has also been performed to determine the potential impact of climate change on the spatial variability of crop production, especially on a larger scale [
28,
29]. Although these studies are not pure SSCM studies, they are intended to understand and improve crop production. Researchers are now using advanced image processing techniques such as optical sensing and well-developed machines fitted with sensors suitable for intense analysis of the factors that control the variability in crop yield [
34].
Pests and diseases can have a potential impact on crop yield as well as product quality. The application of SSCM for detecting the spatial variability of pest and disease infestations for different crops is now very common. For instance, Kulkarni
et al. [
30] used SSCM to detect soybean cyst nematode (SCN;
Heterodera glycine) in a soybean field because it is difficult to determine the onset of SCN as its symptoms are not dramatic. Airborne visible-infrared imagery of the field was acquired and linear regression analysis of the green normalized difference vegetation index (GNDVI) derived from aerial imagery, was used to obtain an estimation of the infestation that was over 70% accurate. There are other studies as well that used SSCM to determine the onset or localization of pest and disease infestations [
31,
32,
33].
For potatoes, it is important to determine the in-season potato crop nitrogen status (CNS) to be able to obtain a high yield. A review study conducted by Goffart
et al. [
34] suggested that the most important and available methods for CNS assessment be evaluated for their accuracy, precision, sensitivity, and feasibility. These assessments include the determination of the nitrate concentration of petiole sap, the measurement of leaf chlorophyll concentration using a hand-held chlorophyll meter, the measurement of crop light reflectance through a hand-held radiometer using passive sensors, and other methodologies. According to Goffart
et al. [
32], more recent methods that are still being developed are based on near, ground-based, air-borne or space-borne remote sensing. This information is then incorporated into decision support systems to provide recommendations for N fertilization management of potatoes [
32].
Reyniers
et al. [
34] stated that optical measurement platforms such as satellites, airplanes, and hand-held sensors do not meet the requirements for good site-specific nitrogen management recommendations. They therefore developed a tractor-mounted automated sensor system to automatically detect crop nitrogen stress status “on the go”. They found a deviation that was less than 10% from the actual nitrogen level in their study with wheat and recommended that the spectrograph red edge measurement was best suitable for estimating crop nitrogen uptake during growing season.
Panda
et al. [
37] developed a yield-based water use model to predict spatial water requirements for corn. The water use was based on: crop yield information that was estimated from vegetation aerial images taken between late July and early August of 1997–2001; bare soil image data of same years; land elevation data; weather data such as temperature and accumulated growing degree days (AGDD), solar radiation, rainfall; and the dates and amounts of irrigation applications. These crop growth-influencing parameters were integrated from germination until the date the aerial image acquisition was taken. The model was developed using a radial basis functional network (RBFN). A comprehensive review paper by Kitchen [
38] describes the use of emerging technologies for real-time and integrated agricultural decision making for irrigation scheduling.
There are ample SSCM studies for traditional row crop agriculture and advancements are being made over time [
1,
2,
3,
5,
6,
7,
13,
14,
15,
16,
17,
18,
19,
20,
21,
22]. Along with the advancements in technology, the practical applications of modeling, mechanical development, and technological usage are also increasing. However, these technologies are not as greatly developed for SSCM of fruit crops.
4. SSCM in Fruit and Nut Crops
Many studies have recently been conducted on the micromanagement of horticultural crops for large orchards and small farms. Horticultural crops, including fruit and nut crops, are high value crops for which SSCM might have potential for increasing net returns and optimizing resource use [
8]. Oranges, peaches, pecans, apples, grapes and blueberries are major components of the overall crop production system in the U.S. These fruit and nut crops need advanced geospatial technology for micromanagement.
SSCM for fruit and nut crops would utilize soil sampling, yield monitoring, and geospatial technology, such as remote sensing, GIS, GPS, and information technology [
8,
9]. In order for GIS to work efficiently in SSCM model development, comprehensive plant related databases need to be established. The key agricultural factors that contribute towards fruit and nut crop growth and production are different soil characteristics, climatic conditions, and land-use type. The soil characteristics involved in fruit and nut crop production are the soil pH, nutrient levels, drainage efficiency, texture, permeability and water holding capacity. Climatic factors that contribute toward fruit and nut crop growth are temperature, solar radiation, rainfall, chilling hours, growing degree days,
etc. All these physical factors must be part of a geospatial database and correlate to the corresponding spatial-based yield for fruit and nut crops for the development of a SSCM model.
7. Spectral Characteristics of Fruit and Nut Crops
Given that fruits and nuts are bushes or trees with green leaves, their spectral signatures are somewhat similar to other healthy vegetation. Mura [
51] suggested that near infrared (NIR) is very useful for vegetation survey and mapping because a very steep gradient of percent reflectance (of incident light) is produced at the 0.7–0.9 μm band. This can only be found for vegetation, not for any other land cover. It is well-known that for vegetation land cover, a strong absorption is dominated by carotenoid pigments (centered at 0.48 μm (blue)), chlorophylls (centered at 0.68 μm (red)), and a green peak centered at 0.56 μm where the cell pigments are least absorptive [
52]. A sharp rise in the curve at 0.7 μm is due to cellular reflectance rather than chlorophyll absorption that happens in the visible range of the spectrum. The high reflectance between 0.7 and 1.3 μm (NIR) band of the electromagnetic spectrum is dominated by the cell-wall/airspace interface and by refractive index discontinuities of cellular constituents of the leaves [
52]. The molecular vibrations in the leaves provide stronger absorption in the longer wavelength after 1.3 μm.
It is, therefore, essential to use images of the visible and NIR bands of the electromagnetic spectrum. As a result, any multispectral image (with NIR bands) can serve the purpose of distinguishing fruit and nut crops from other land covers. The spectral behavior of different fruit and nut crops are discussed below to obtain specific information for analysis.
Spectral signatures for American blueberry (rabbiteye (
vaccinium virgatum), southern highbush (
vaccinium darrowii), and northern highbush (
vaccinium corymbosum)) plants are yet to be developed. A study was conducted in the Fäjemyren peatland in southern Sweden in the temperate climatic zone to develop spectral signatures of Lingonberry or Lingon Blueberry (
vaccinium myrtillus) [
39]. Spectral signatures of the Lingon blueberry and bearberry plants suggest that their shrubs have a very low reflectance as compared to grasses and forest trees because of their medium stature and the fact that they mix easily with surrounding shadows [
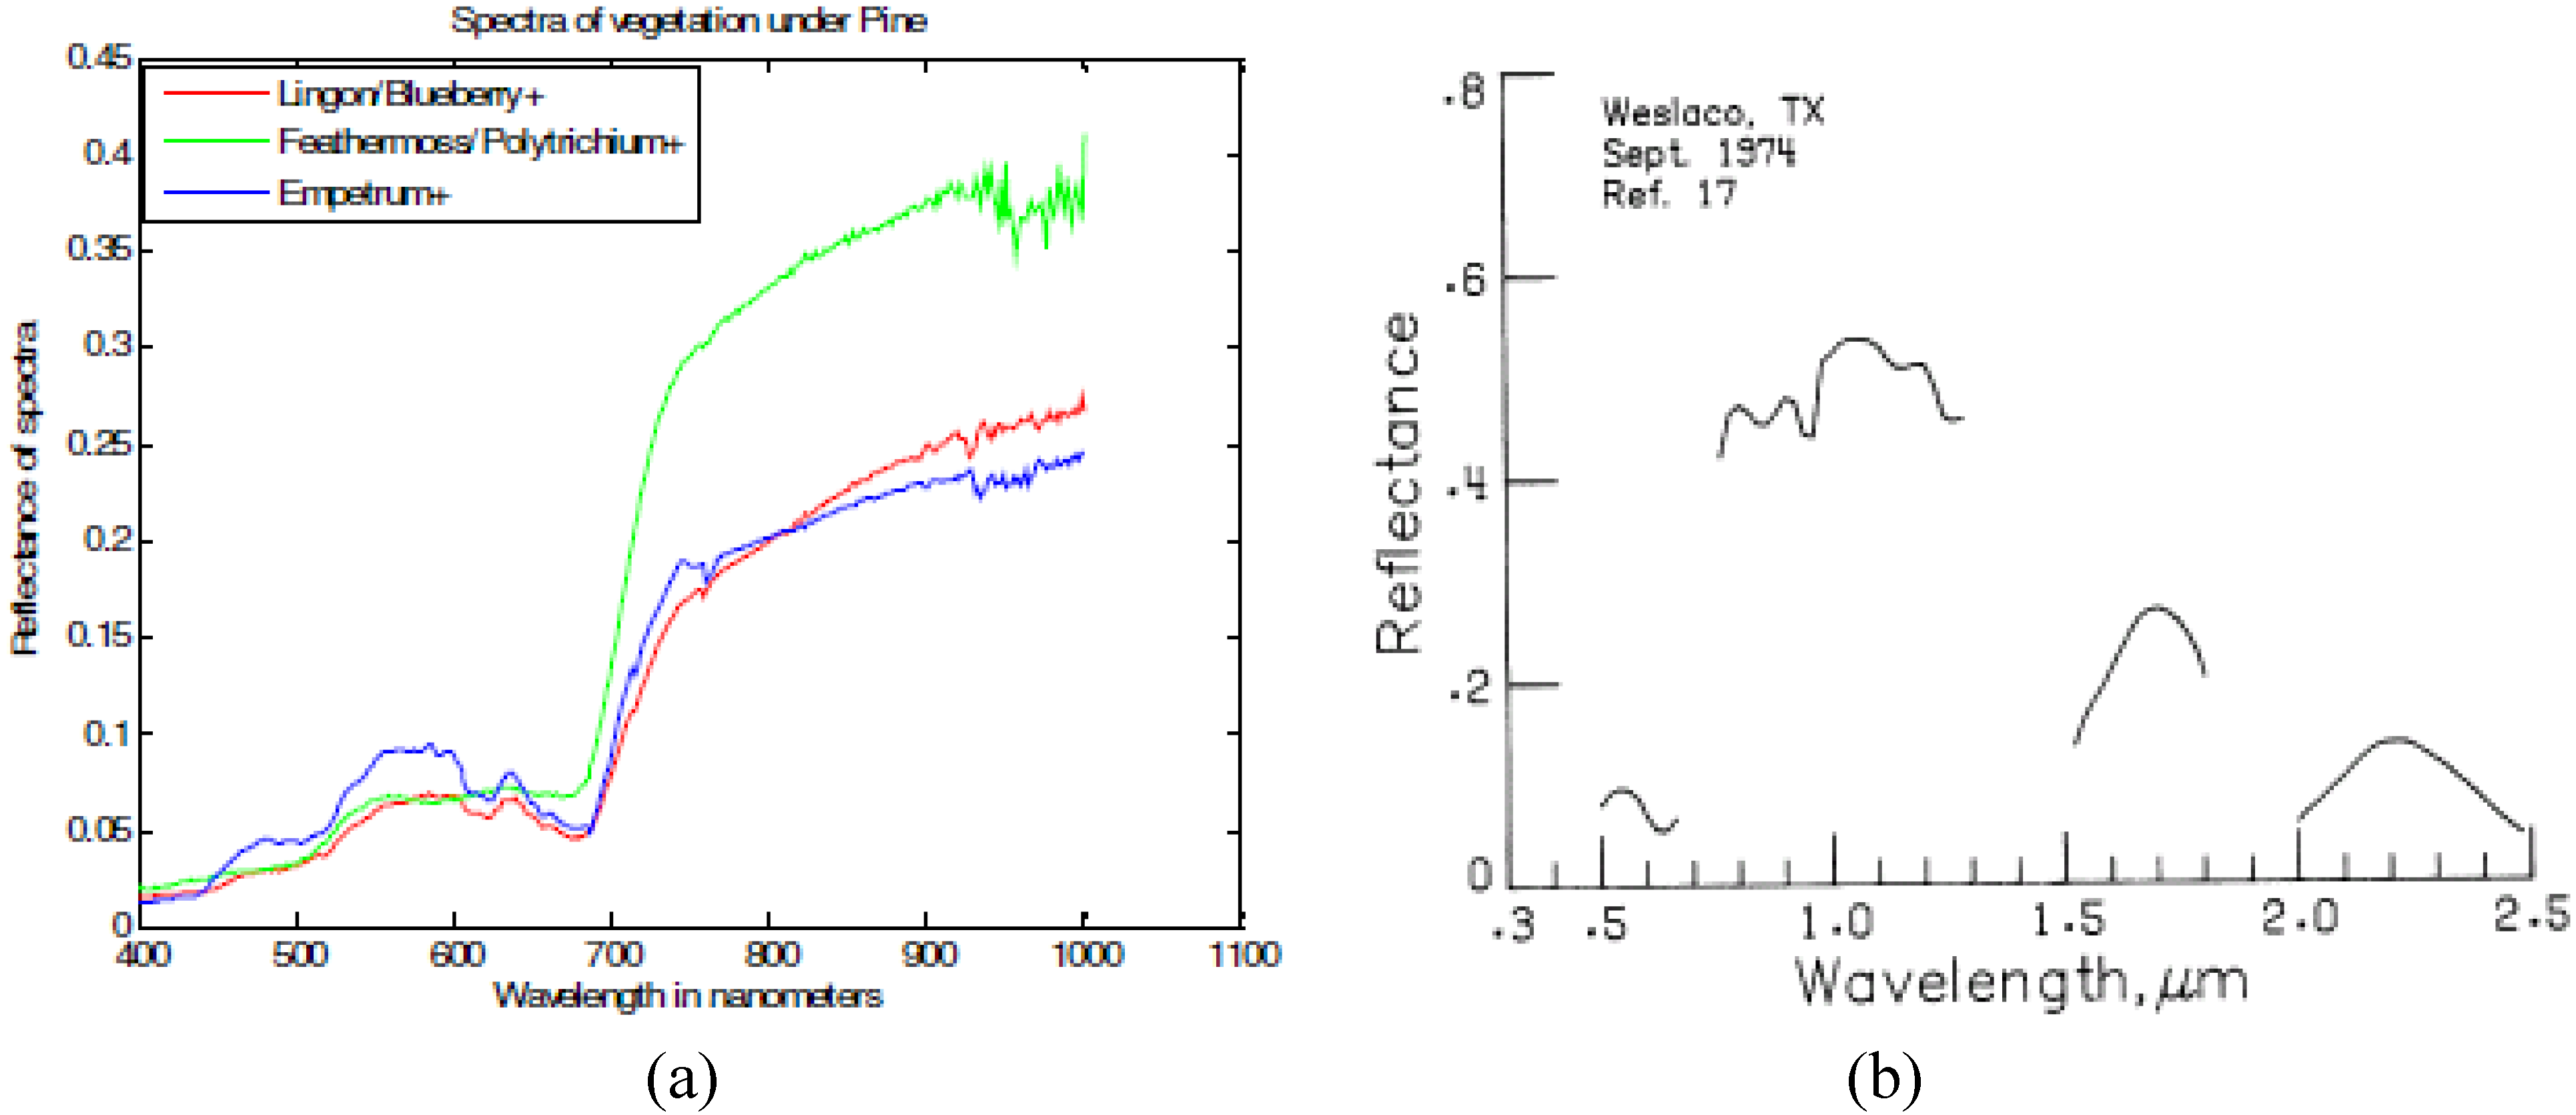
39]. Blueberry is distinguishable at the 680–700 nm (red) band width and the 800–900 nm (NIR) band width range. A spectral reflectance curve for blueberry is shown in
Figure 1a along with feathermoss and crowberry (Empetrum) [
39]. For this study, in the southern Swedish peatland, at select locations, 286 vegetation spectra (including Ligum Blueberry, feathermoss, and crowberry) were collected in the month of September and 116 and 63 spectra were recorded of the same species in the months of October and November, respectively [
39]. The locations for sampling were strategized using stratified random sampling [
39]. The three months spectra helped in studying the temporal variations in the sampled vegetations. The researchers calibrated the handheld field spectroradiometer using white spectralon panel and then followed by recording of the vegetation spectrum with the bare head of the instrument with a spectral sampling interval of 1.58 nm [
39]. They recorded the spectra as an average over ten sample spectra. According to the researchers, the accuracy of the spectral curve were affected by a wide range of factors such as water level, soil reflectance, time of day and year, cloud cover, humidity and temperature,
etc. However, for the time being, the blueberry spectral signature curve is the only available one to refer to.
NASA Langley Research Center, Hampton, Virginia had developed or collected spectral reflectances for 156 natural targets including a few fruit and nut crops, such as redblush citrus, oranges, prickly pear, and peach. The data or curves were developed with a uniform 0.01 or 0.02 μm [
52]. According to NASA Reference Publication 1139, the spectral curves of different targets were selected for field measurements made with high-resolution scanning spectrophotometer and laboratory spectral measurements in the case of limited field measurement data [
52]. It is not clearly specified which measurement methods were used for the fruit and nut crops’ spectral curve development. The sampling size and process, the temporal measurement procedure, and the locations of the samples are unknown for these fruit and nut crops’ spectral curve development. But these curves should be used for reference because they were compiled by the reputed organization, NASA.
Redblush citrus is distinguishable at the 600–650 nm (Green) band width with a high absorption, at the 950–1,000 nm (NIR) band width range with a steep absorption rate, and at the 1,000–1,150 nm (NIR) band width range with the highest reflection rate. A spectral reflectance curve for redblush citrus is shown in
Figure 1(b) as obtained from NASA Reference Publication 1139 [
52].
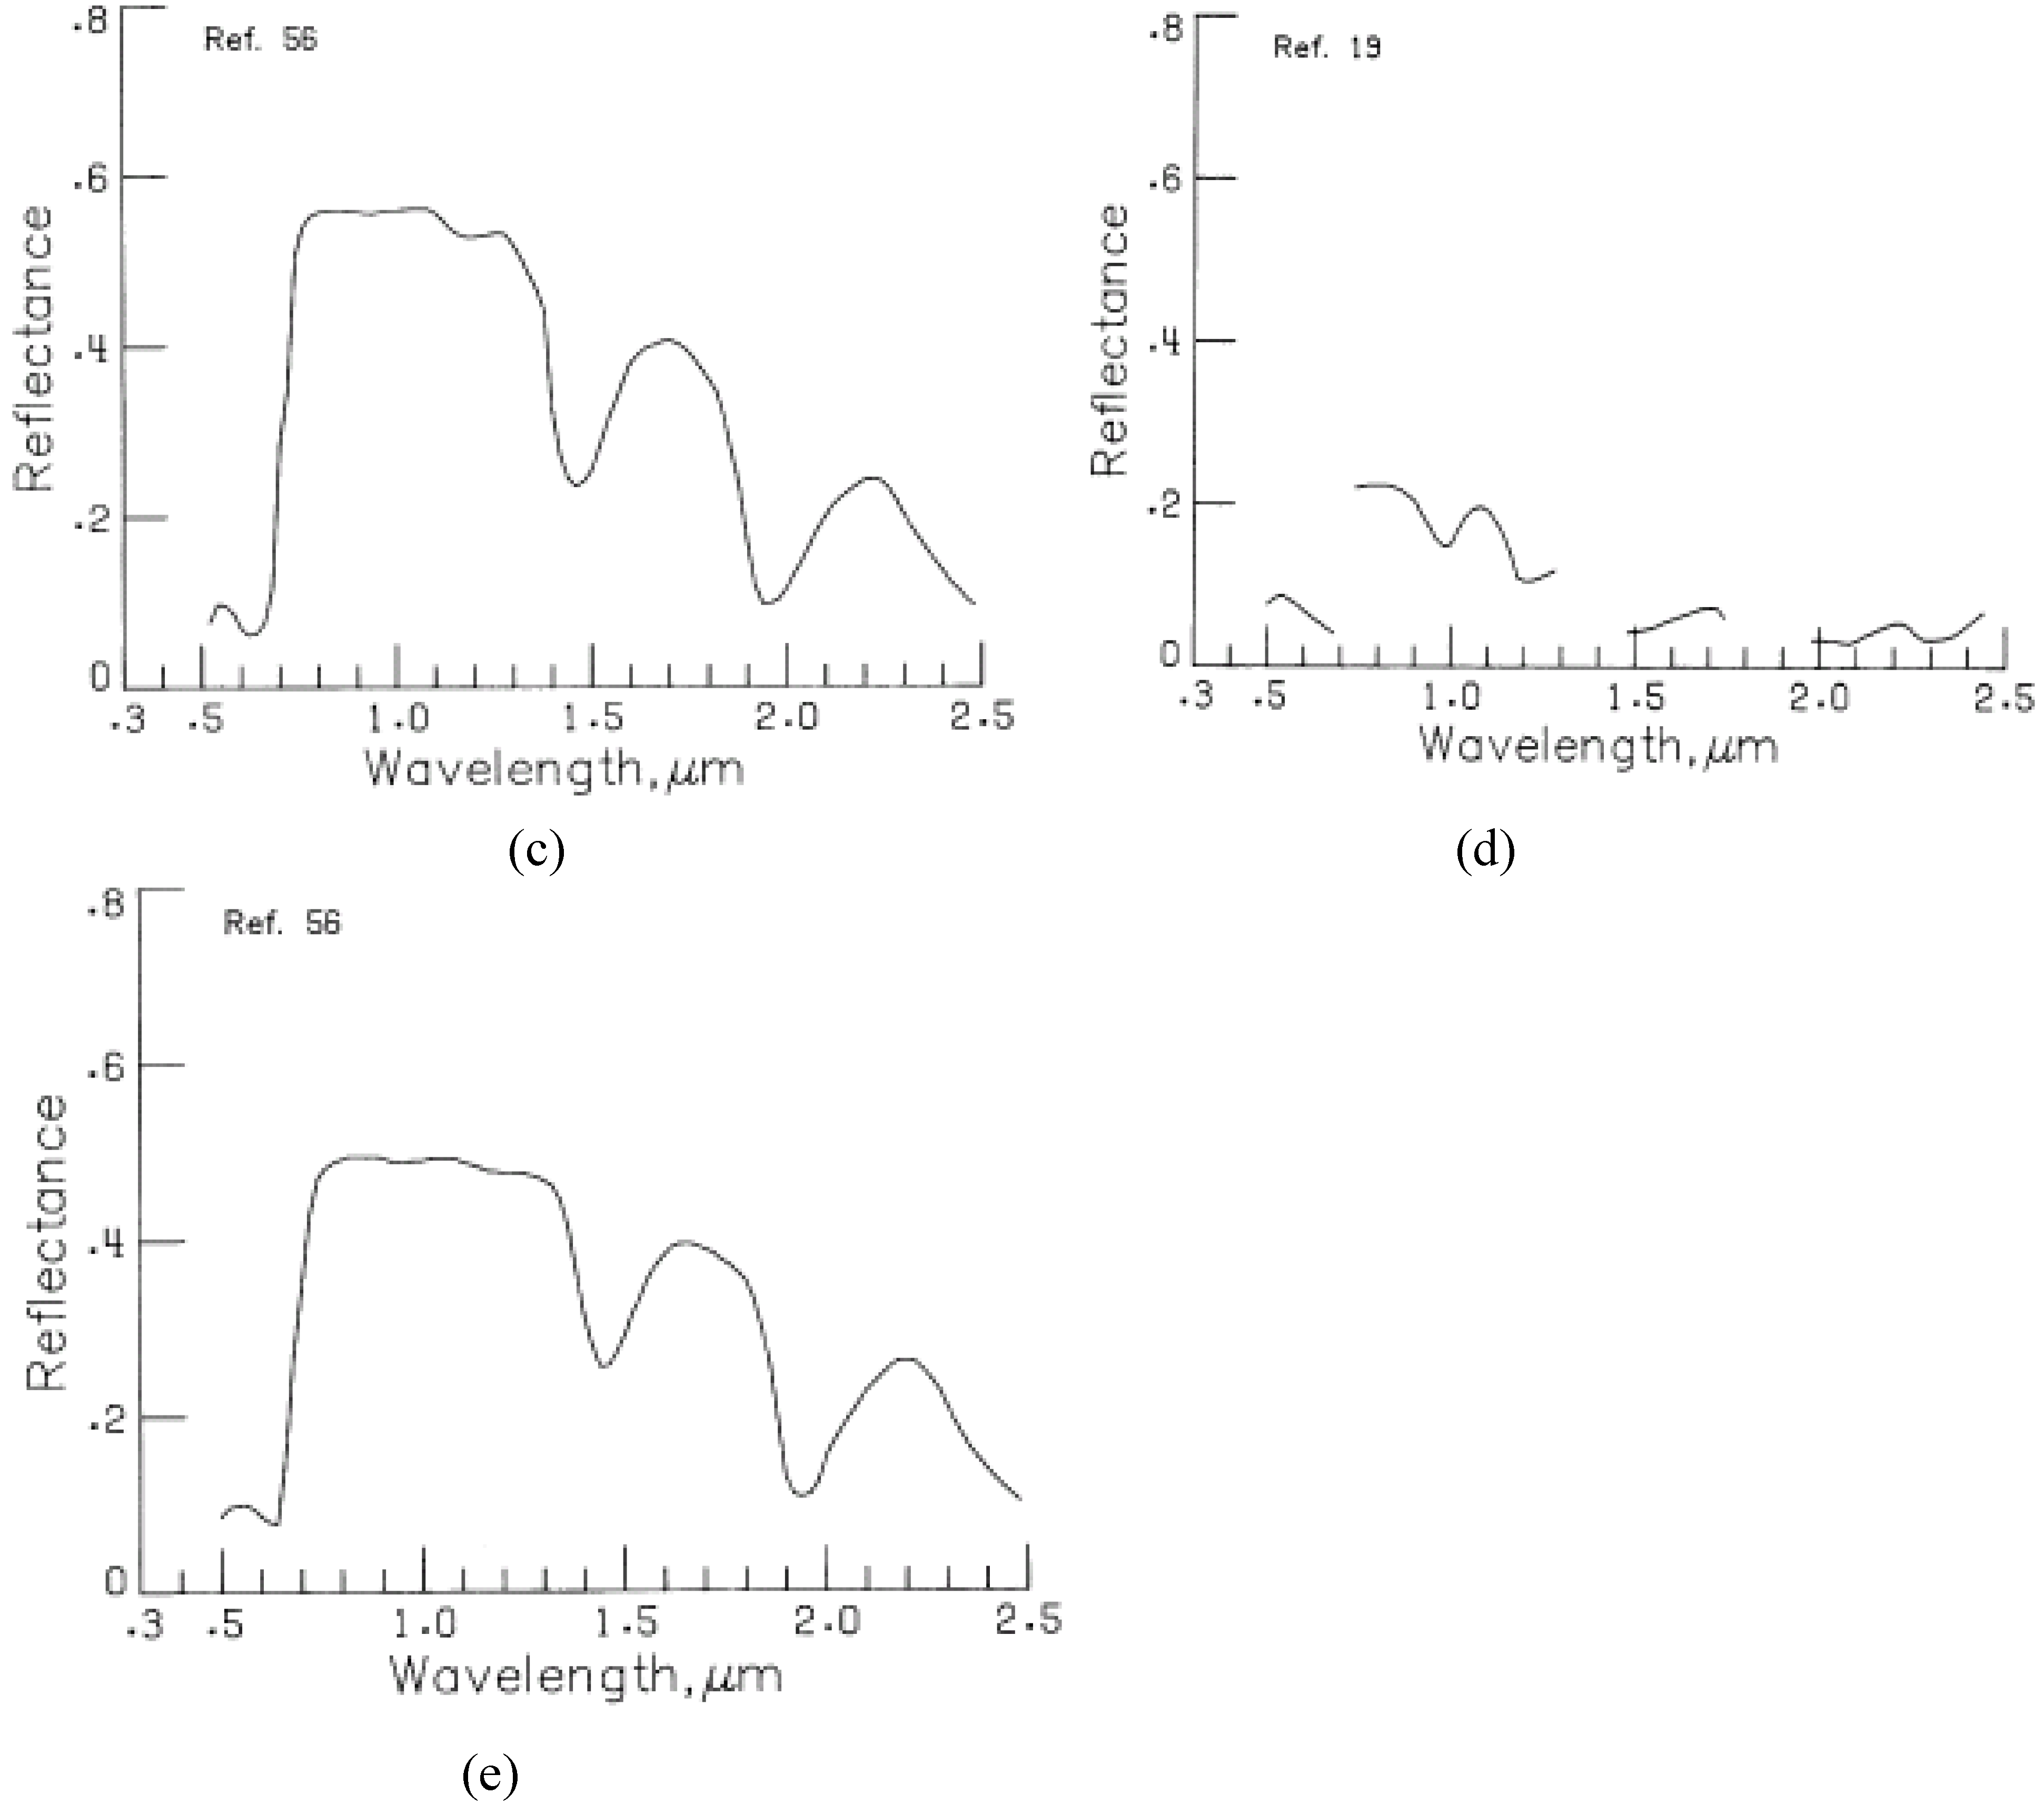
The leaves of orange trees can be distinguishable at the 650–700 nm band width where they have the highest absorption and at the 800–1,100 nm (NIR) band width range with the highest reflection rate.
Figure 1c shows the spectral reflectance curve to help researchers in SSCM decision making [
52]. Prickly pear has the highest absorption at the 700 nm band and the highest reflectance at the 750–900 nm (NIR) band width (
Figure 1(d)) [
52]. The leaves of peaches have almost the same reflectance curve as the leaves of oranges with the highest absorption at the 650 nm band and the highest reflectance at 750–1,200 nm (NIR) band width (
Figure 1(e)) [
52]. Therefore, other digital image characteristics such as the textural feature should be used to distinguish peach trees from orange trees.
These spectral reflectance curves are useful for researchers engaged in developing SSCM for individual fruit and nut crops through the use of remote sensing. The curves would guide researchers to decide which band images they need to procure to obtain distinguishable digital information. Again, these curves also point towards obtaining the digital number range (0–255) for a crop at a particular band using the reflectance percentage (Y-axis info of the curves) with respect to the wavelengths (X-axis info of the curves).
Figure 1.
Spectral reflectance curves of different fruit and nut crops. Spectral reflectance curve for:
(a) blueberry, feathermoss crowberry [
39];
(b) redblush citrus [
52];
(c) orange leaves [
52];
(d) prickly pear [
52];
(e) peach leaves [
52].
Figure 1.
Spectral reflectance curves of different fruit and nut crops. Spectral reflectance curve for:
(a) blueberry, feathermoss crowberry [
39];
(b) redblush citrus [
52];
(c) orange leaves [
52];
(d) prickly pear [
52];
(e) peach leaves [
52].
Spectral reflectance curves at different wavelengths for other fruit or nut trees such as pecan, apple, grape, and other crops (not shown in the study) are not available yet. Research is needed in order to develop these curves to support SSCM for these crops.
8. Image Platform to Use for Fruit and Nut Plant SSCM
Knowledge for the selection of an image platform, basically the image resolution, is essential for any kind of SSCM study [
8]. The scope of the study is a primary indicator of the image resolution requirement. If the study is for a large area of coverage, e.g., determining the blueberry orchards for the entire state of Georgia, U.S., Landsat imagery at a 30-meter resolution is possibly sufficient. With a Landsat image, a fruit or nut orchard (large size) can be easily delineated. But small orchards (< 2.5 ha) surrounded by forests or tall grasses cannot be differentiated easily [
8]. Therefore, high resolution imageries such as SPOT panchromatic (10-m resolution) and MSS (20-m resolution) imagery are crucial. If individual plants are to be differentiated for SSCM, very high resolution imagery such as QuickBird (2.15-m resolution) images or National Agricultural Imagery Program (NAIP; 1-m resolution) orthophotographs are best suited.
Shrivastava and Gebelein [
48] performed a study in Florida to delineate citrus groves for economic assessment, using Landsat Enhanced Thematic Mapper Plus (30 m) imagery. Their results showed a significant correlation between citrus production/income with remotely sensed imagery-derived citrus area coverage. Sharma and Panigrahy [
49] used Indian Remote Sensing Satellite (IRS) LISS III and IRS AWiFS (23 m and 55 m, respectively) imagery data to develop an apple orchard database for the entire state of Himachal Pradesh in India and were successful in the delineation using a relatively low resolution imagery. The same low resolution IRS imageries were also used for identifying and prioritizing the suitable sites for passion fruit plantations in the hilly districts of the north-eastern states of India.
O’Connel and Goodwin [
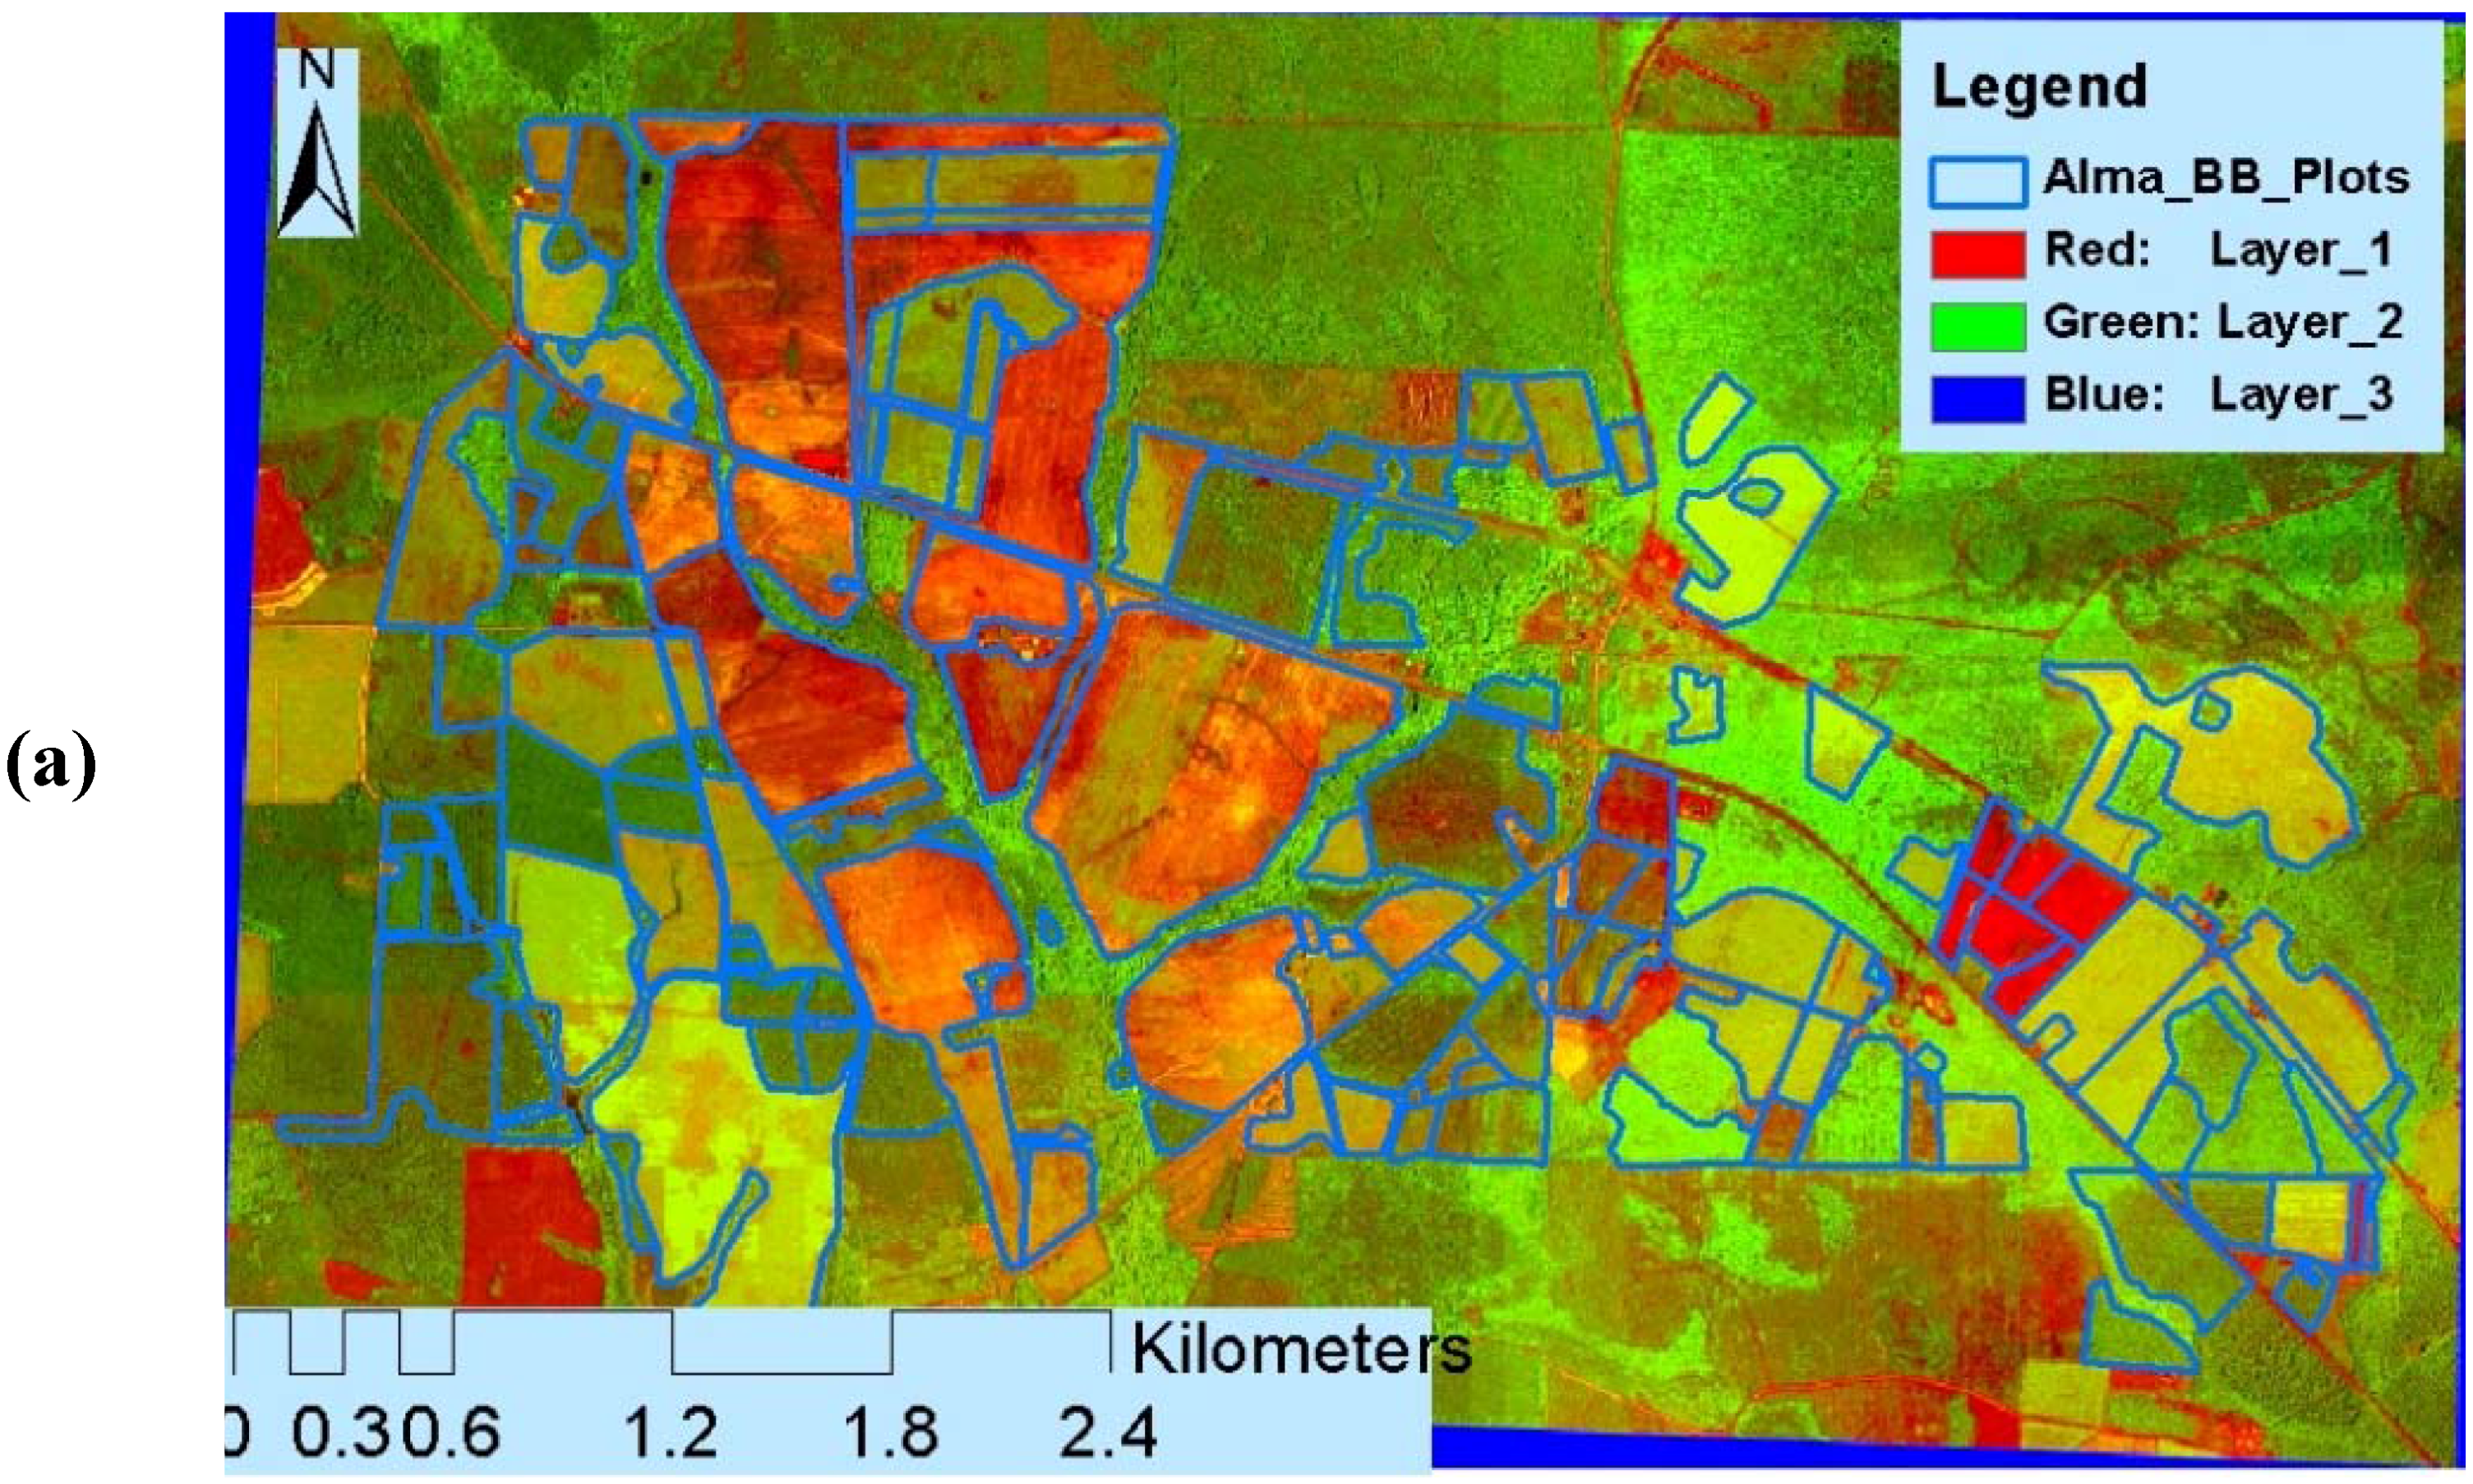
46] used remotely-sensed high resolution aerial photographs to identify the tree canopy of a peach orchard for yield forecasting and the estimation of crop water requirements. In their case, they needed to identify individual trees to perform SSCM and hence they used high resolution images. Blueberry orchards are generally established in an area that has just been cleared from shrubs and forest trees, and, therefore, it is difficult to distinguish blueberry bushes from other trees and shrubs with low resolution imagery such as 30-m Landsat TM or ETM. Panda
et al. [
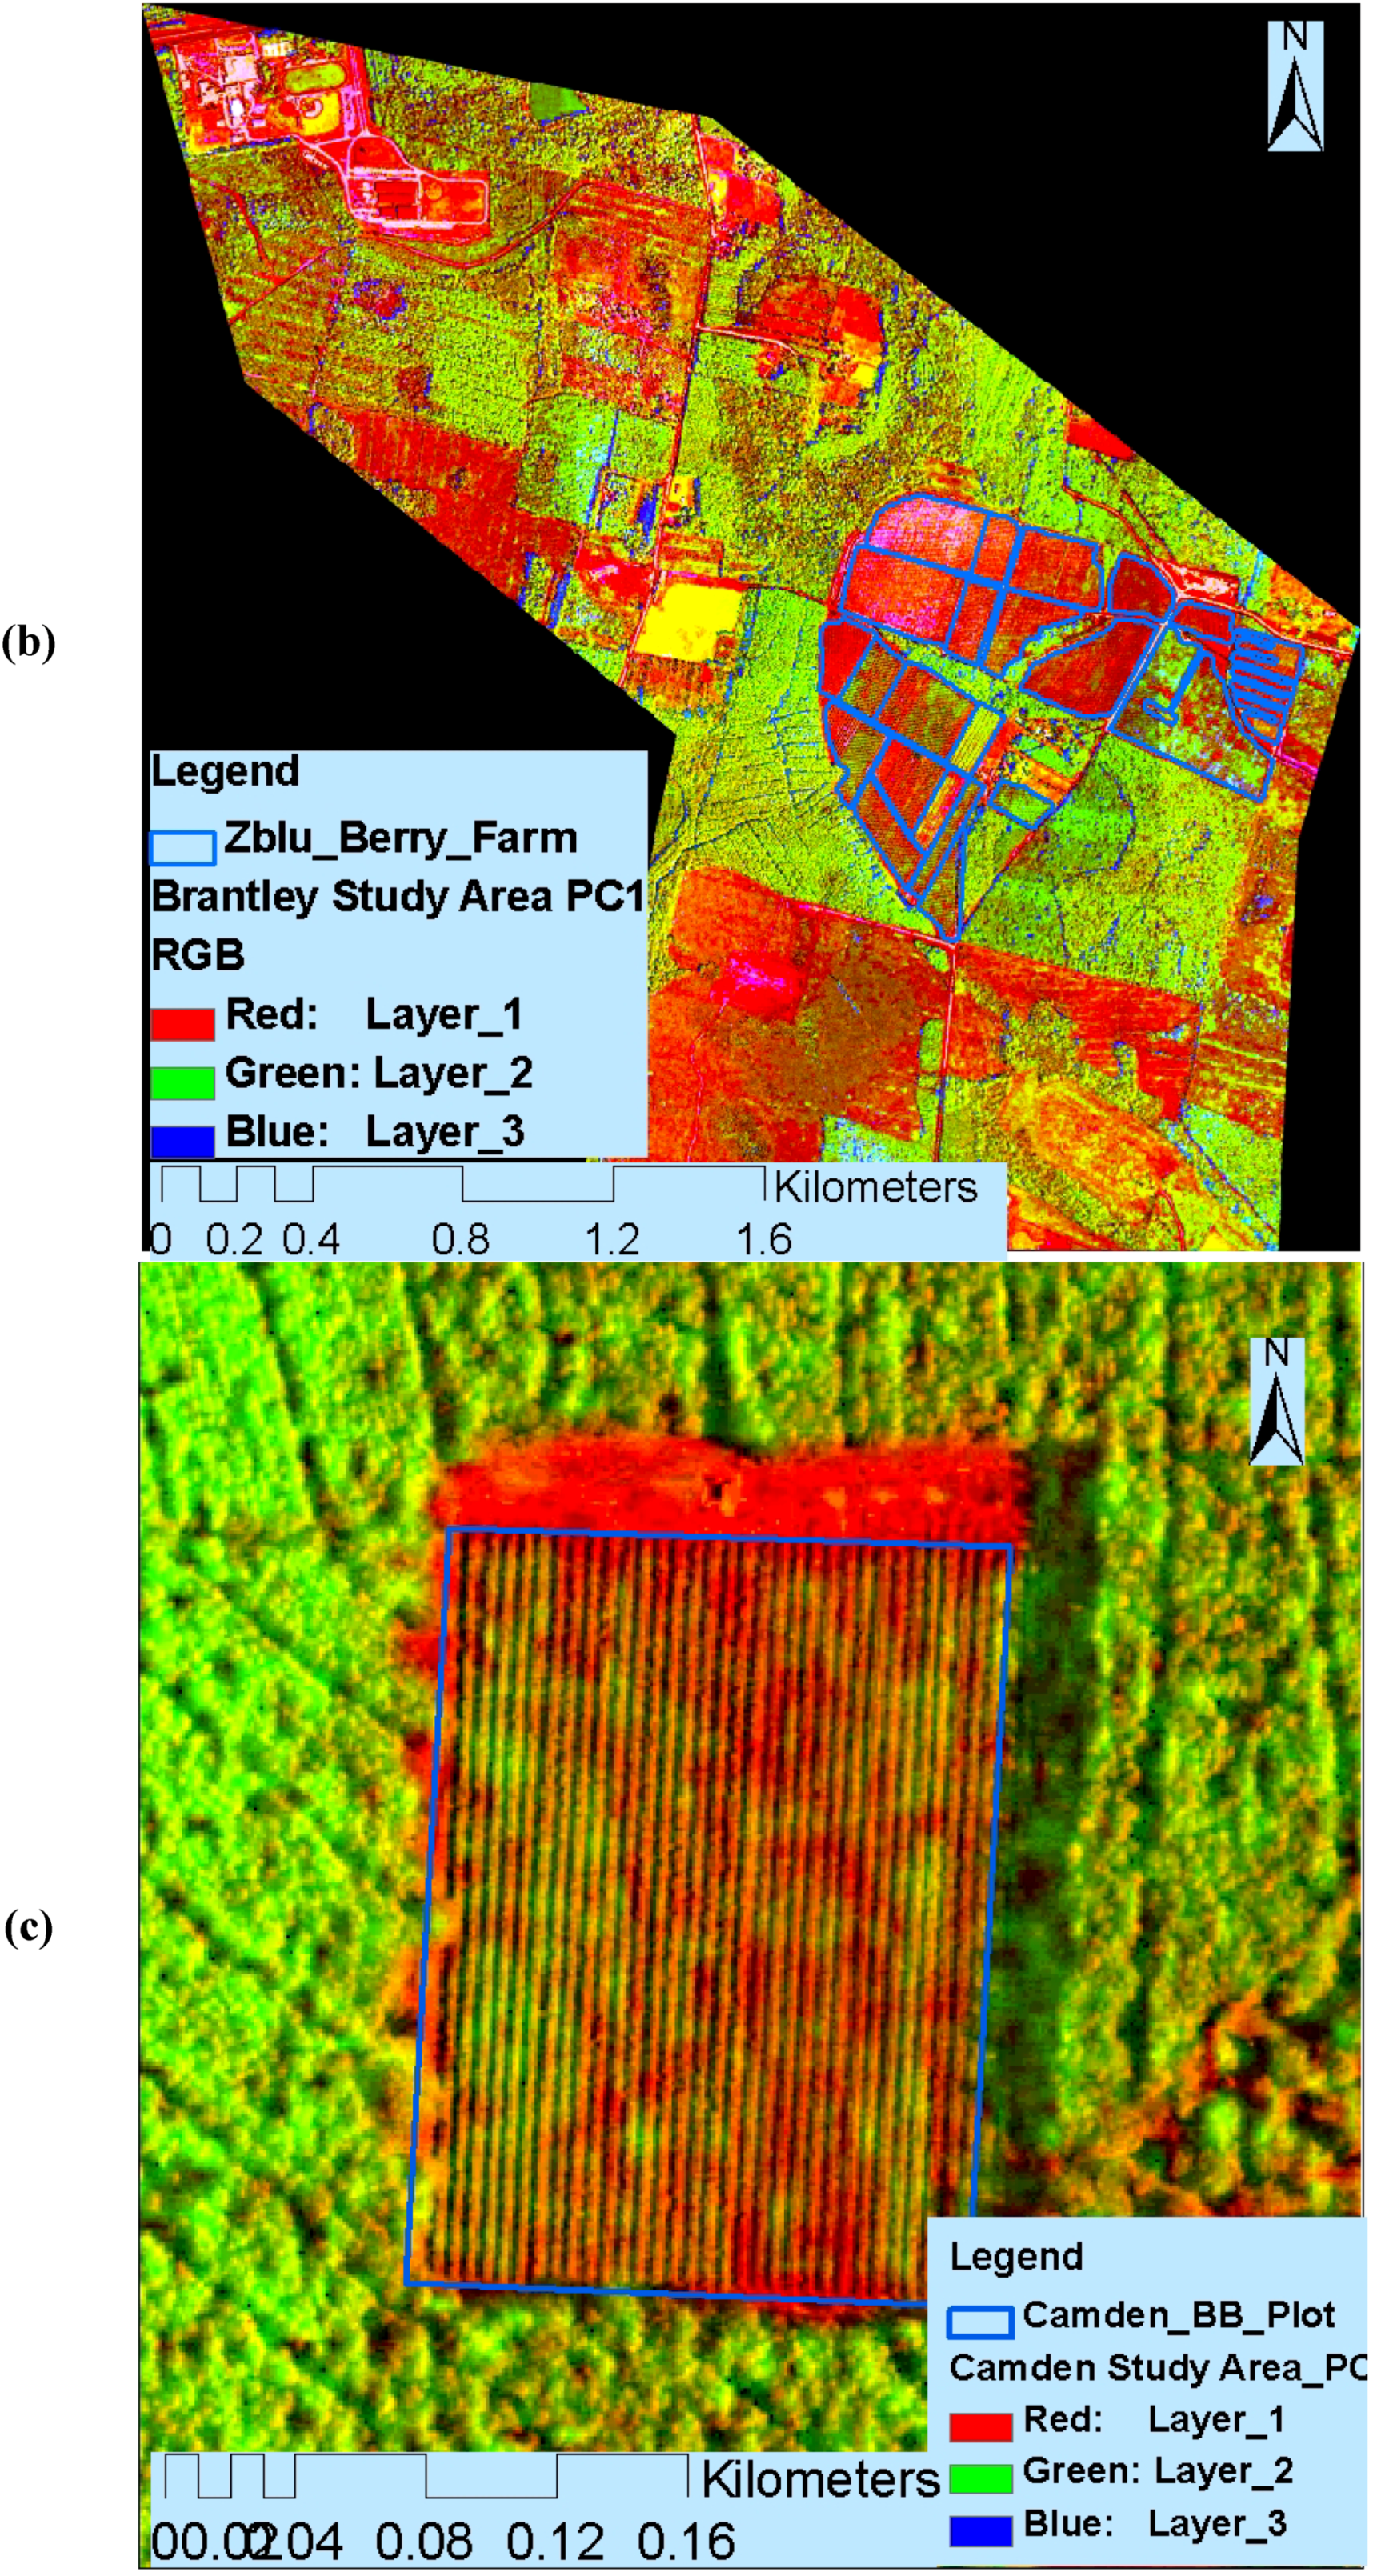
54] used very high resolution 1-meter multi-spectral NAIP imagery to identify blueberry orchards in three southeastern counties (Bacon, Brantley, and Camden) in Georgia, U.S. (
Figures 2(a–c)). Panda
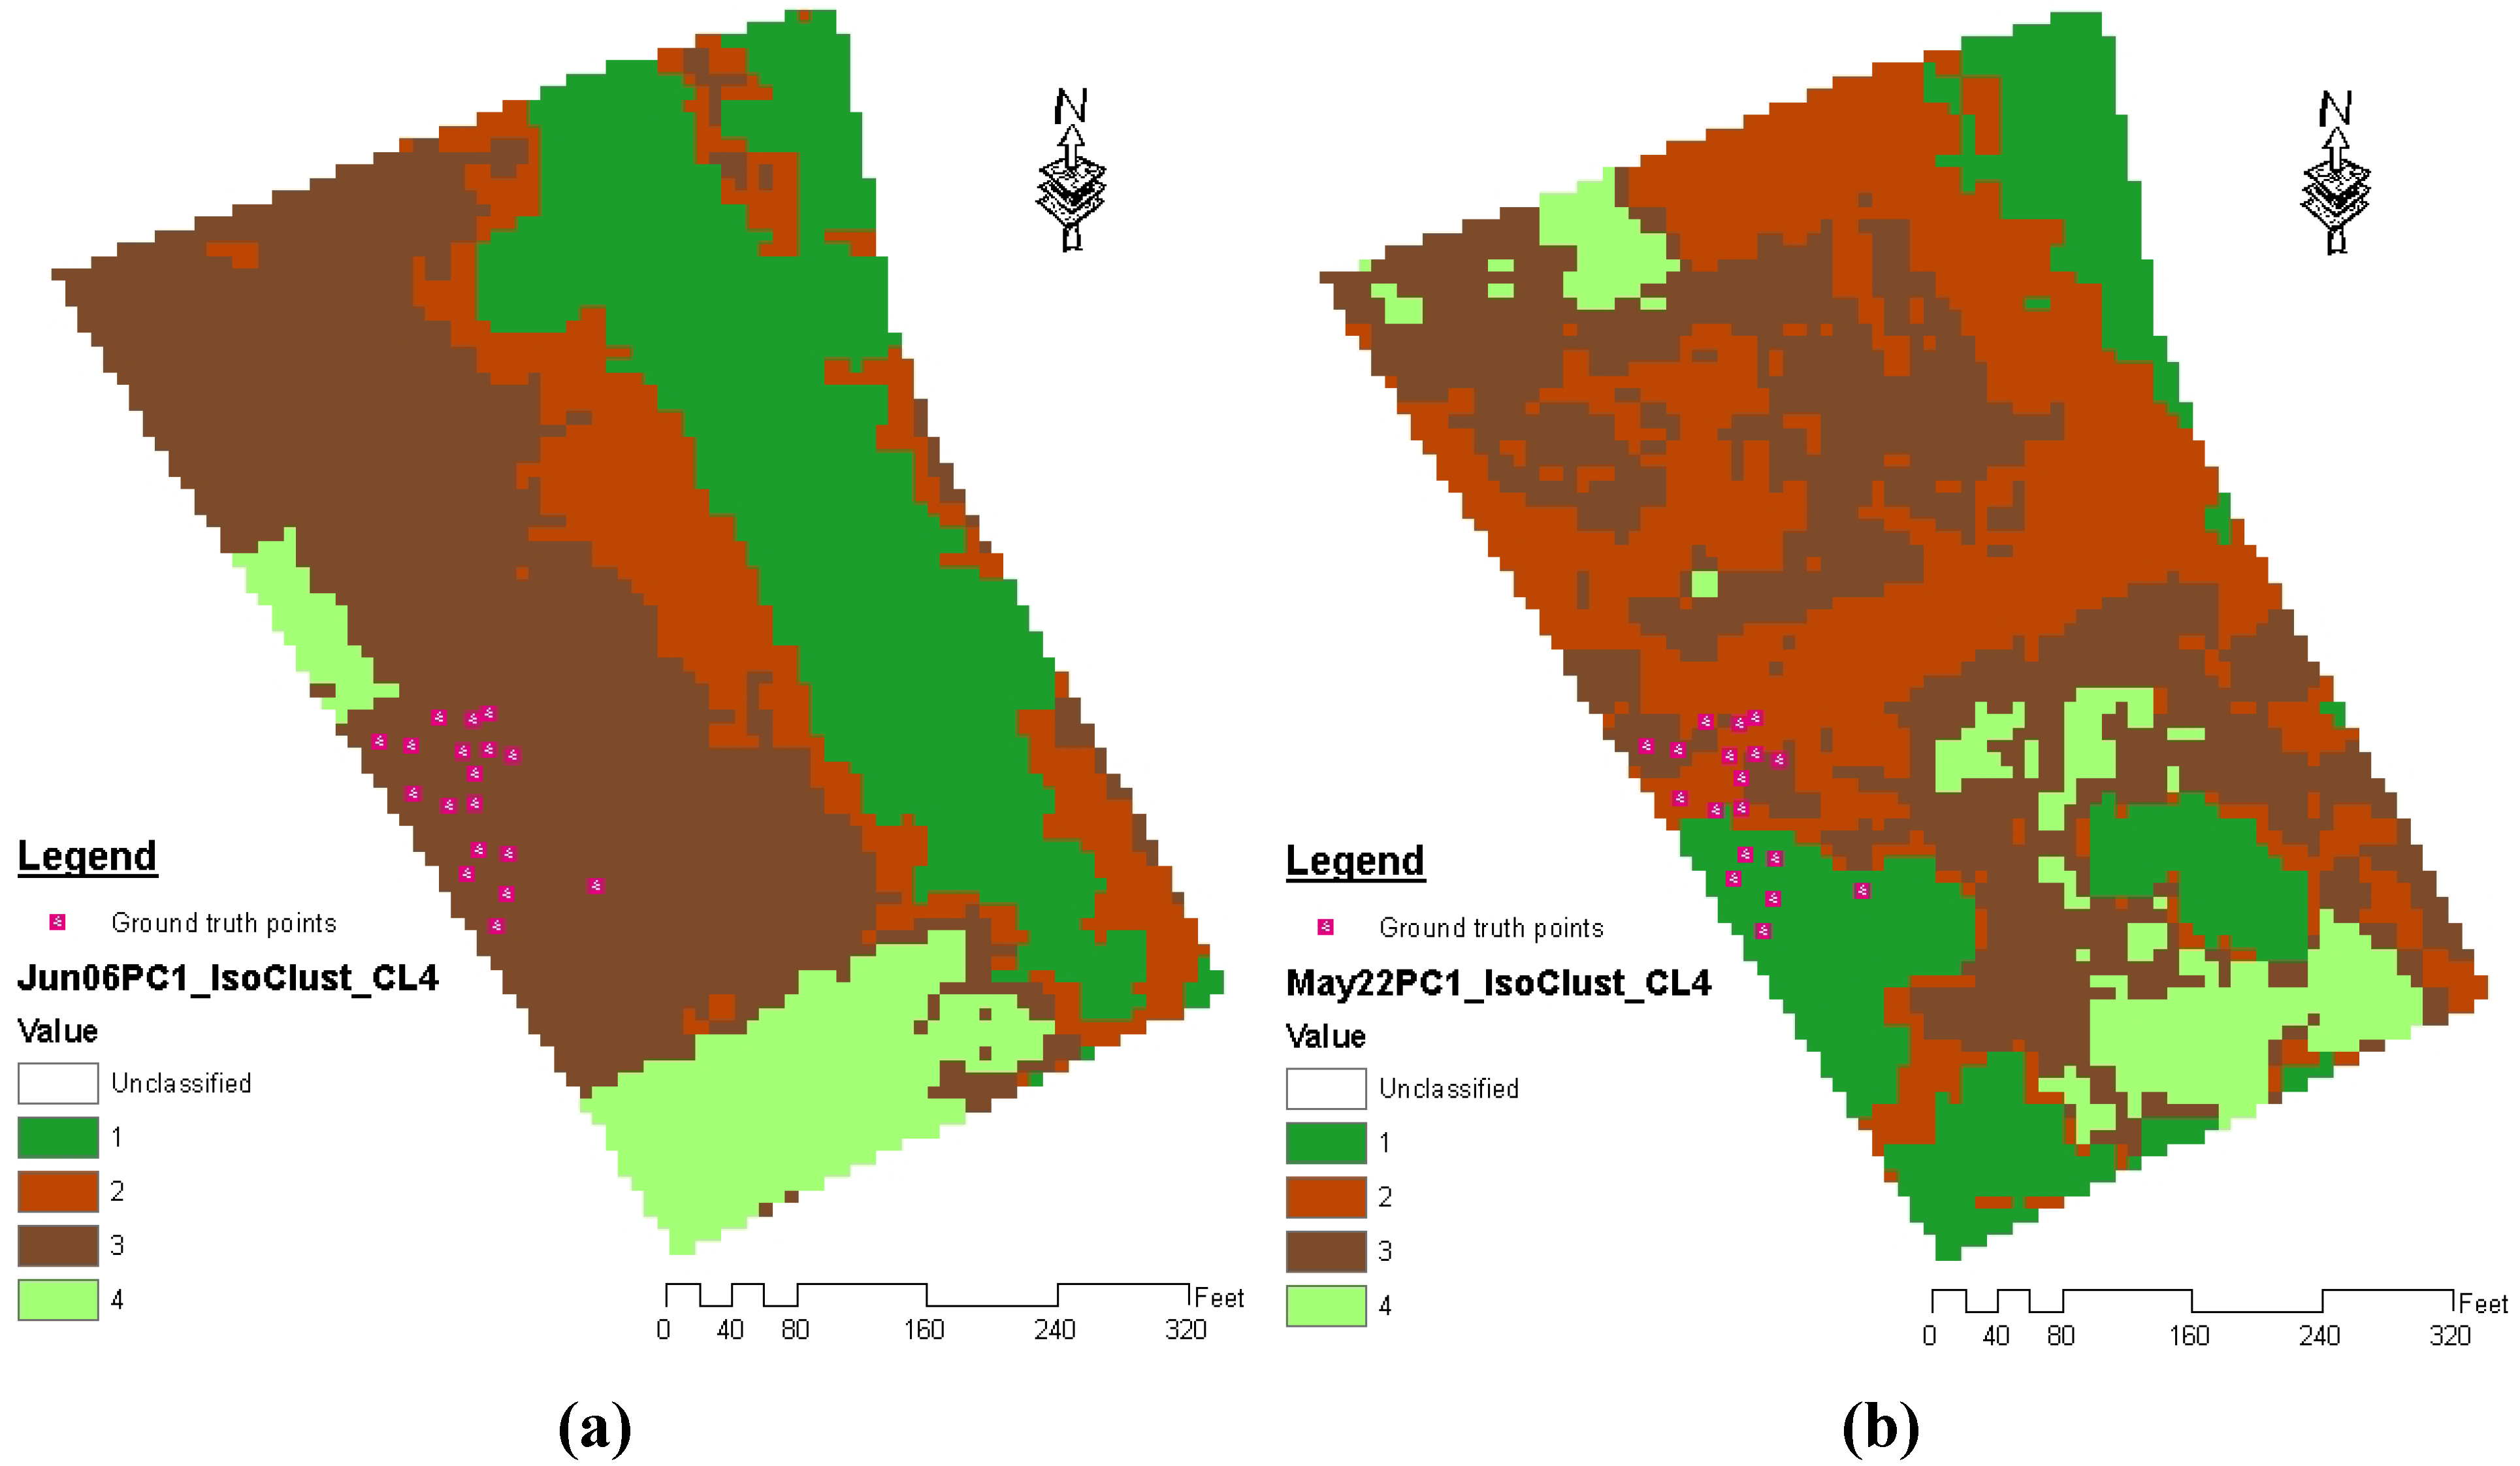
et al. [
8] also used 2.15-m resolution QuickBird imagery for distinguishing blueberry plants from pine forest and dwarf and tall grasses (
Figures 3(a,b)). Torres
et al. [
57] conducted a study to distinguish olive tree orchards using remote sensing images by clustering assessment techniques. They used 0.25- to 1.5-m resolution imageries to perform the advanced SSCM process for an olive orchard that was only 2 hectares in size.
Figure 2.
Principal component image of the three study areas in Georgia, U.S: Bacon (a), Brantley (b), and Camden County (c), along with the GPS recorded blueberry farms at different stages.
Figure 2.
Principal component image of the three study areas in Georgia, U.S: Bacon (a), Brantley (b), and Camden County (c), along with the GPS recorded blueberry farms at different stages.
Figure 3.
Ground truth points of blueberry plants in unsupervised classified image of study area (blueberry plants) shown on May 22, 2006 (a) and June 06, 2006 (b) with ISODATA clustered classified QuickBird image.
Figure 3.
Ground truth points of blueberry plants in unsupervised classified image of study area (blueberry plants) shown on May 22, 2006 (a) and June 06, 2006 (b) with ISODATA clustered classified QuickBird image.
As discussed earlier, multispectral imageries with visible and NIR bands would be sufficient for studying fruit and nut plants because the differentiable spectral characters are available mostly in the visible and NIR bands (
Figure 2,
Figure 3,
Figure 4,
Figure 5 and
Figure 6), while some fruit crops have a very long range for the highest spectral reflectance (800–1,100 nm band). Therefore, AVIRIS imagery that records reflected light in 224 visible and near-infrared wavelengths from a National Aeronautics and Space Administration (NASA) high-altitude aircraft could be used because this high-spectral resolution allows detection of subtle spectral features that are diagnostic of specific minerals and plant characteristics. There is a great potential for airborne hyperspectral imagery use in estimating fruit yield and detecting plant stress as supported by several studies [
62,
63].
Researchers have used various bands of the electromagnetic spectrum to study different aspects of diverse horticultural crops. Sutherland
et al. [
60] have used the TIR band imagery to detect frost on horticultural crops for subsequent decision-making. Polo
et al. [
61] have used a low-cost tractor-mounted scanning Light Detection and Ranging (LIDAR) system for non-destructive recordings of tree-row structure in orchards and vineyards to determine the tree-row volume and total surface area (crown cover). The use of LIDAR imagery data for horticultural SSCM has an immense scope because it can determine plant heights along with spectral characteristics. Walklate
et al. [
62] followed a similar procedure with LIDAR to determine the canopy cover of semi-dwarf Cox apple trees. Use of airborne LIDAR in studying pesticide spray applications on horticultural plants has become an important topic recently due to the emergence of organic farming [
63].
9. Image Processing Approach for Fruit and Nut Crops SSCM
To extract digital information from remote sensing images and to correlate this with fruit and nut crop SSCM, one must use image-processing techniques and build models [
64]. Image processing techniques generally involve classification and algebraic manipulation to determine the spatial variability in the image [
65]. High resolution images contain an enormous amount of information and can, therefore, be computationally intensive when analyzed. Thus, it is desirable to reduce the dimensionalities of the image data while at the same time extracting relevant and significant information [
8]. As fruit and nut crops have similar spectral characteristics to forested vegetation, supervised classification is not the best procedure to distinguish these crops in imagery. Therefore, unsupervised clustering is one of the most desirable techniques for image segmentation, especially for analyses where unexpected land cover types can be obtained [
8]. Three visible bands,
i.e., red, green, and blue, in multi-spectral imagery contain digital information about land uses which differ significantly because each band has a different reflectance pattern. Therefore, it is essential to use all three bands to extract pertinent information about land use/land cover types from remotely sensed images [
66].
Since 1978, scientists working in remote sensing have argued that the vegetation dynamics can be detected with the red and infrared bands of the electromagnetic spectrum [
67]. However, vegetation such as shrubs can be easily distinguished with the green band along with the red band [
8]. In many cases, classified individual (R-, G-, and B-) band images show poor classification accuracy because the data from all of the spectral bands involve a certain degree of redundancy [
68]. The principal component analysis (PCA) approach is one of the best techniques to analyze correlated multidimensional data so that all the multispectral band information regarding the vegetation reflectance would be intact [
8].
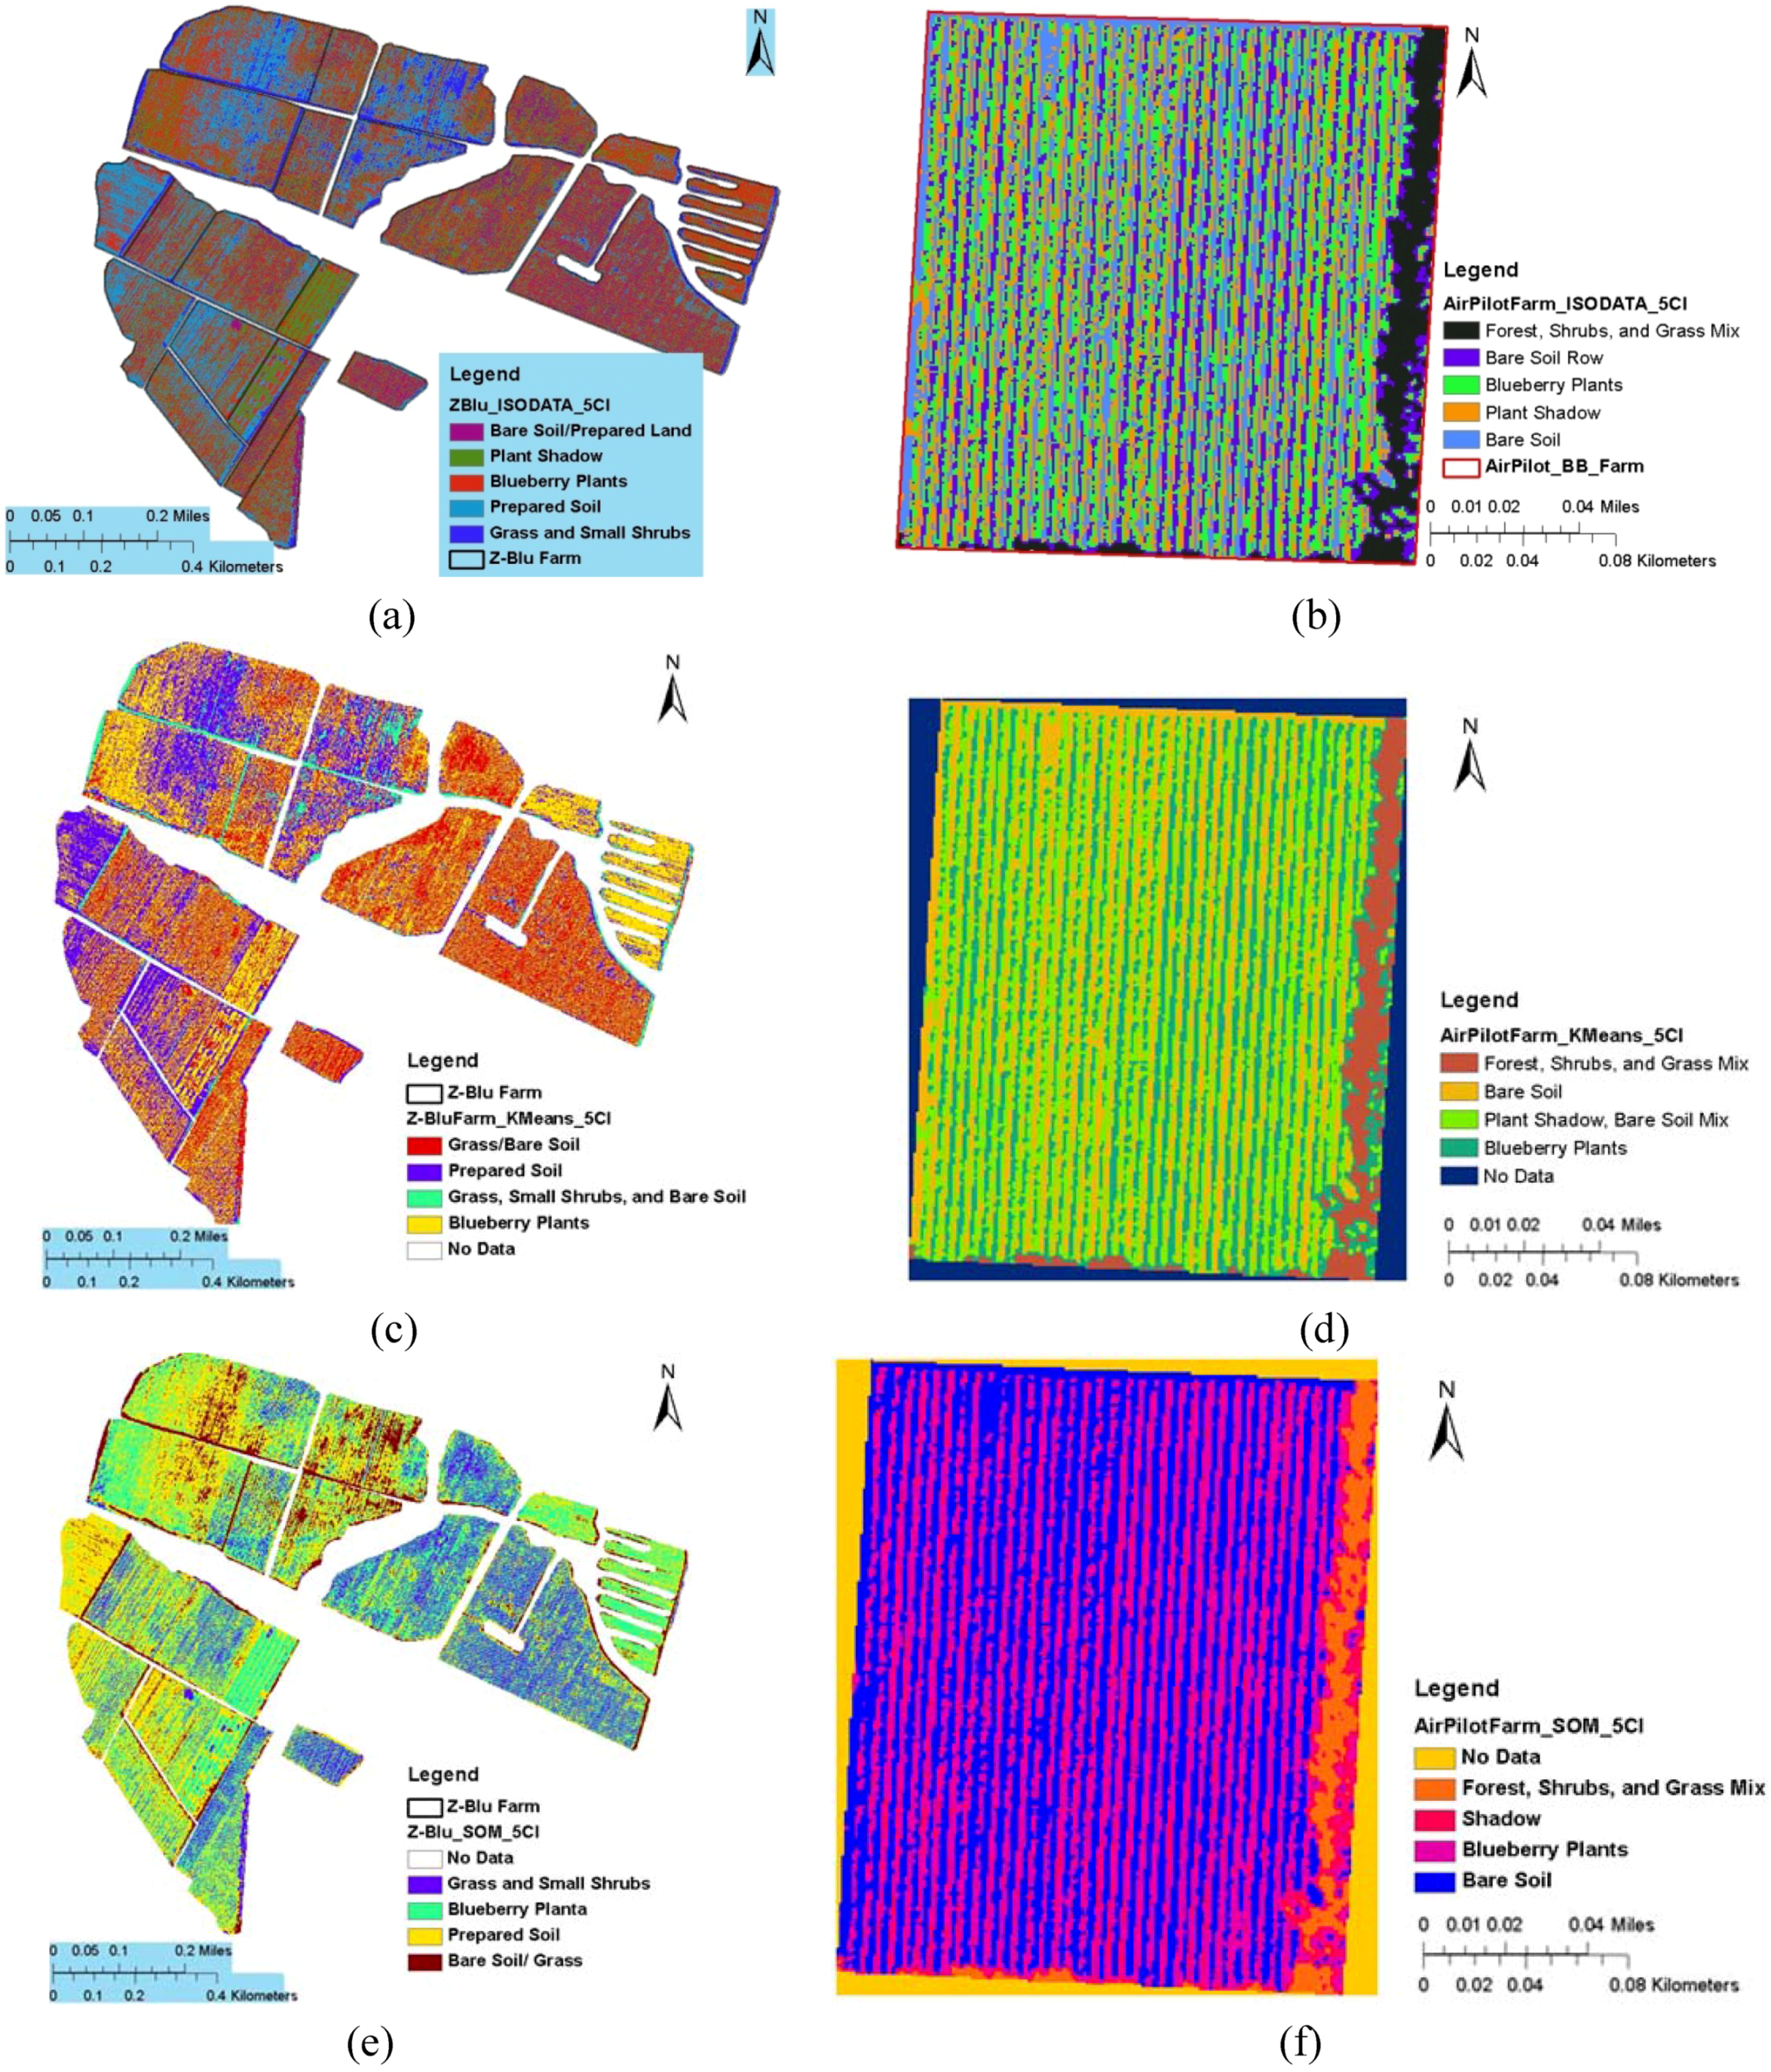
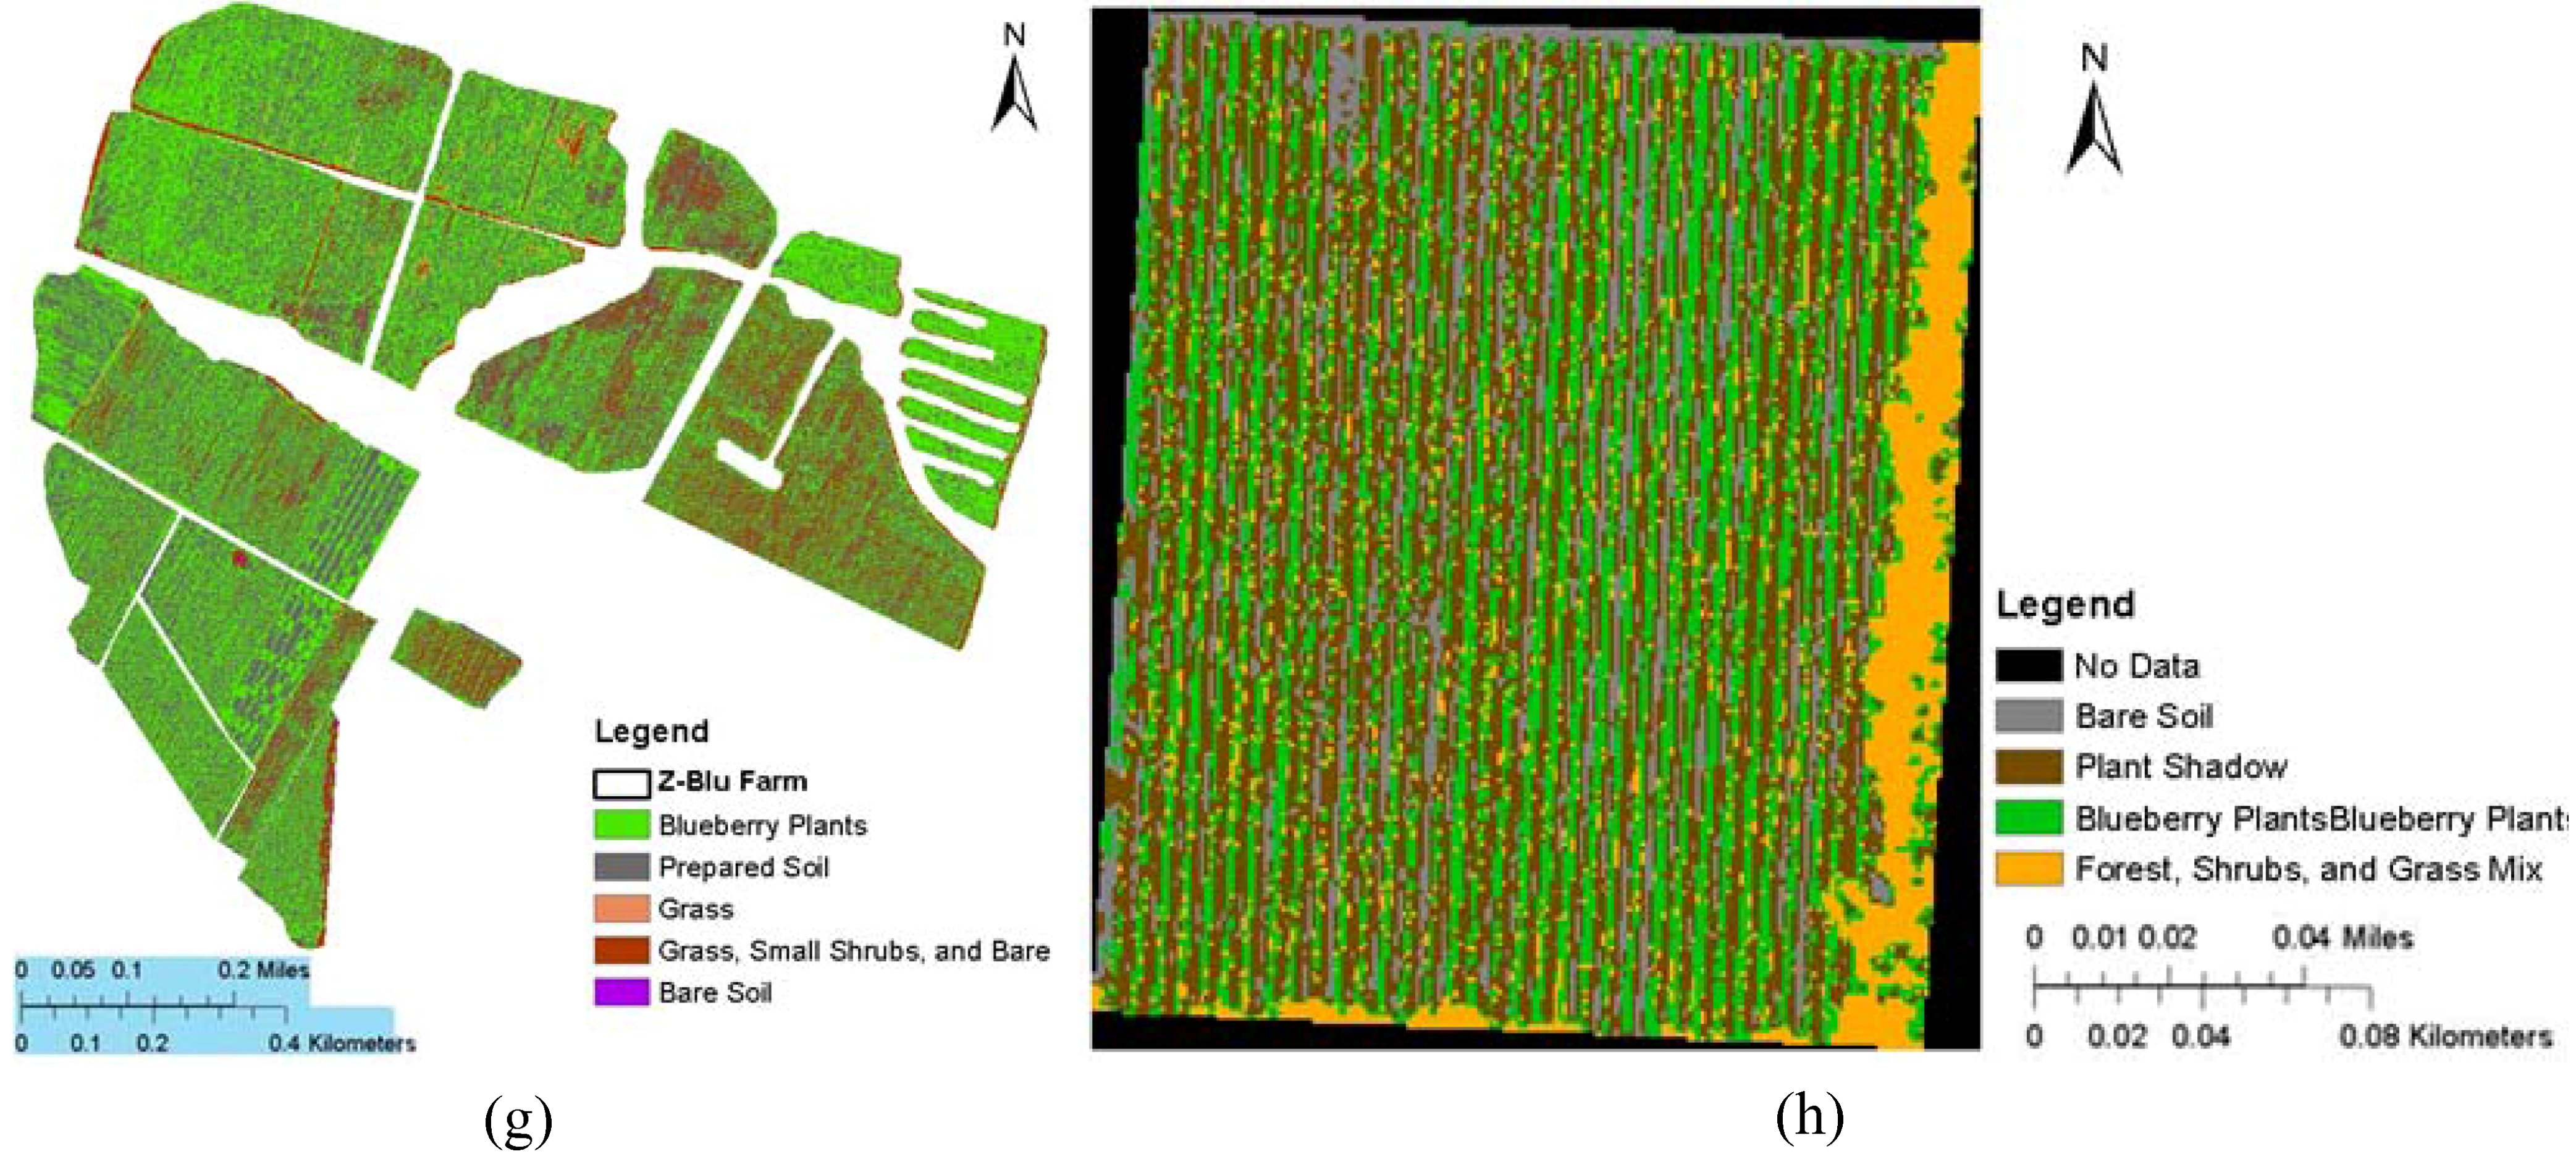
Along with these image processing techniques, most of the researchers who work in this area use other advanced image processing and geospatial technologies to study horticultural plants for decision support. Advanced image classification techniques such as ISODATA, WARD-minimum variance technique, k-means clustering, Bayesian classification algorithm, fuzzy multivariate cluster analysis, and artificial neural classification techniques like back-propagation neural networks and self-organizing map techniques are being used to delineate horticultural crops in satellite images [
8]. Panda
et al. (2010) has studied the application of different advanced image clustering algorithms to distinguish blueberry plants from bare soil/prepared land, plant shadow, prepared soil, grass and small shrubs [
69]. Four different algorithms such as ISODATA, K-means, SOM, and Fuzzy ARTMAP were used in the classification process in two different locations (Nahunta and Woodbine) in Georgia, U.S. [
69].
Figure 4(a–h) provide a comparative result of the study.
Table 1 and
Table 2 show the comparative results obtained from the study on these two locations. These studies support the importance of remote sensing for the management of fruit and nut crops. The use of remote sensing in horticultural SSCM has increased in recent years but there is a vast capacity for improvement.
Figure 4.
Comparison of different classification algorithms in blueberry plants differentiation from other land-use in blueberry orchards of Z-Blu Farm in Nahunta, GA and Air-Pilot Farm in Woodbine, GA, U.S. ISODATA clustering segmentation of the NAIP image of the Z-Blu Farm (a) and of the Air Pilot Farm (b); K-means clustering segmentation of the NAIP image of the Z-Blu Farm (c) and Air Pilot Farm (d); SOM clustering segmentation of the NAIP image of the Z-Blu Farm (e) and Air Pilot Farm (f); and ISODATA clustering segmentation of the NAIP image of the Z-Blu Farm (g) and Air Pilot Farm (h).
Table 1.
The classification accuracy report of four image segmentation algorithm applications on Z-Blu Farm 2009 NAIP imageries.
Table 1.
The classification accuracy report of four image segmentation algorithm applications on Z-Blu Farm 2009 NAIP imageries.
| Image segmentation algorithms | Producer’s accuracy
% | User’s accuracy
% | Overall accuracy
% | Kappa Statistics |
|---|
| ISODATA | 65 | 85 | 80 | 0.38 |
| K-means | 70 | 88 | 82 | 0.42 |
| SOM | 82 | 94 | 88 | 0.53 |
| Fuzzy ARTMAP | 80 | 91 | 85 | 0.50 |
Table 2.
The classification accuracy report of four image segmentation algorithm applications on Air-Pilot Farm 2009 NAIP imageries.
Table 2.
The classification accuracy report of four image segmentation algorithm applications on Air-Pilot Farm 2009 NAIP imageries.
| Image segmentation algorithms | Producer’s accuracy
% | User’s accuracy
% | Overall accuracy
% | Kappa Statistics |
|---|
| ISODATA | 80 | 92 | 86 | 0.52 |
| K-means | 85 | 90 | 88 | 0.56 |
| SOM | 88 | 95 | 92 | 0.72 |
| Fuzzy ARTMAP | 88 | 94 | 91 | 0.70 |
10. GIS Use in Fruit and Nut Crop SSCM
Geographic Information Systems can also provide an important contribution towards fruit and nut crop SSCM. Study area delineation, orchard boundary digitization for ground truth, and preparation of other spatial data in addition to remotely sensed imagery are some of the tasks that could be accomplished with GIS. Spatial data processing is most essential for SSCM related model development such as yield prediction, water-demand forecasting, or the determination of soil nutrient availability.
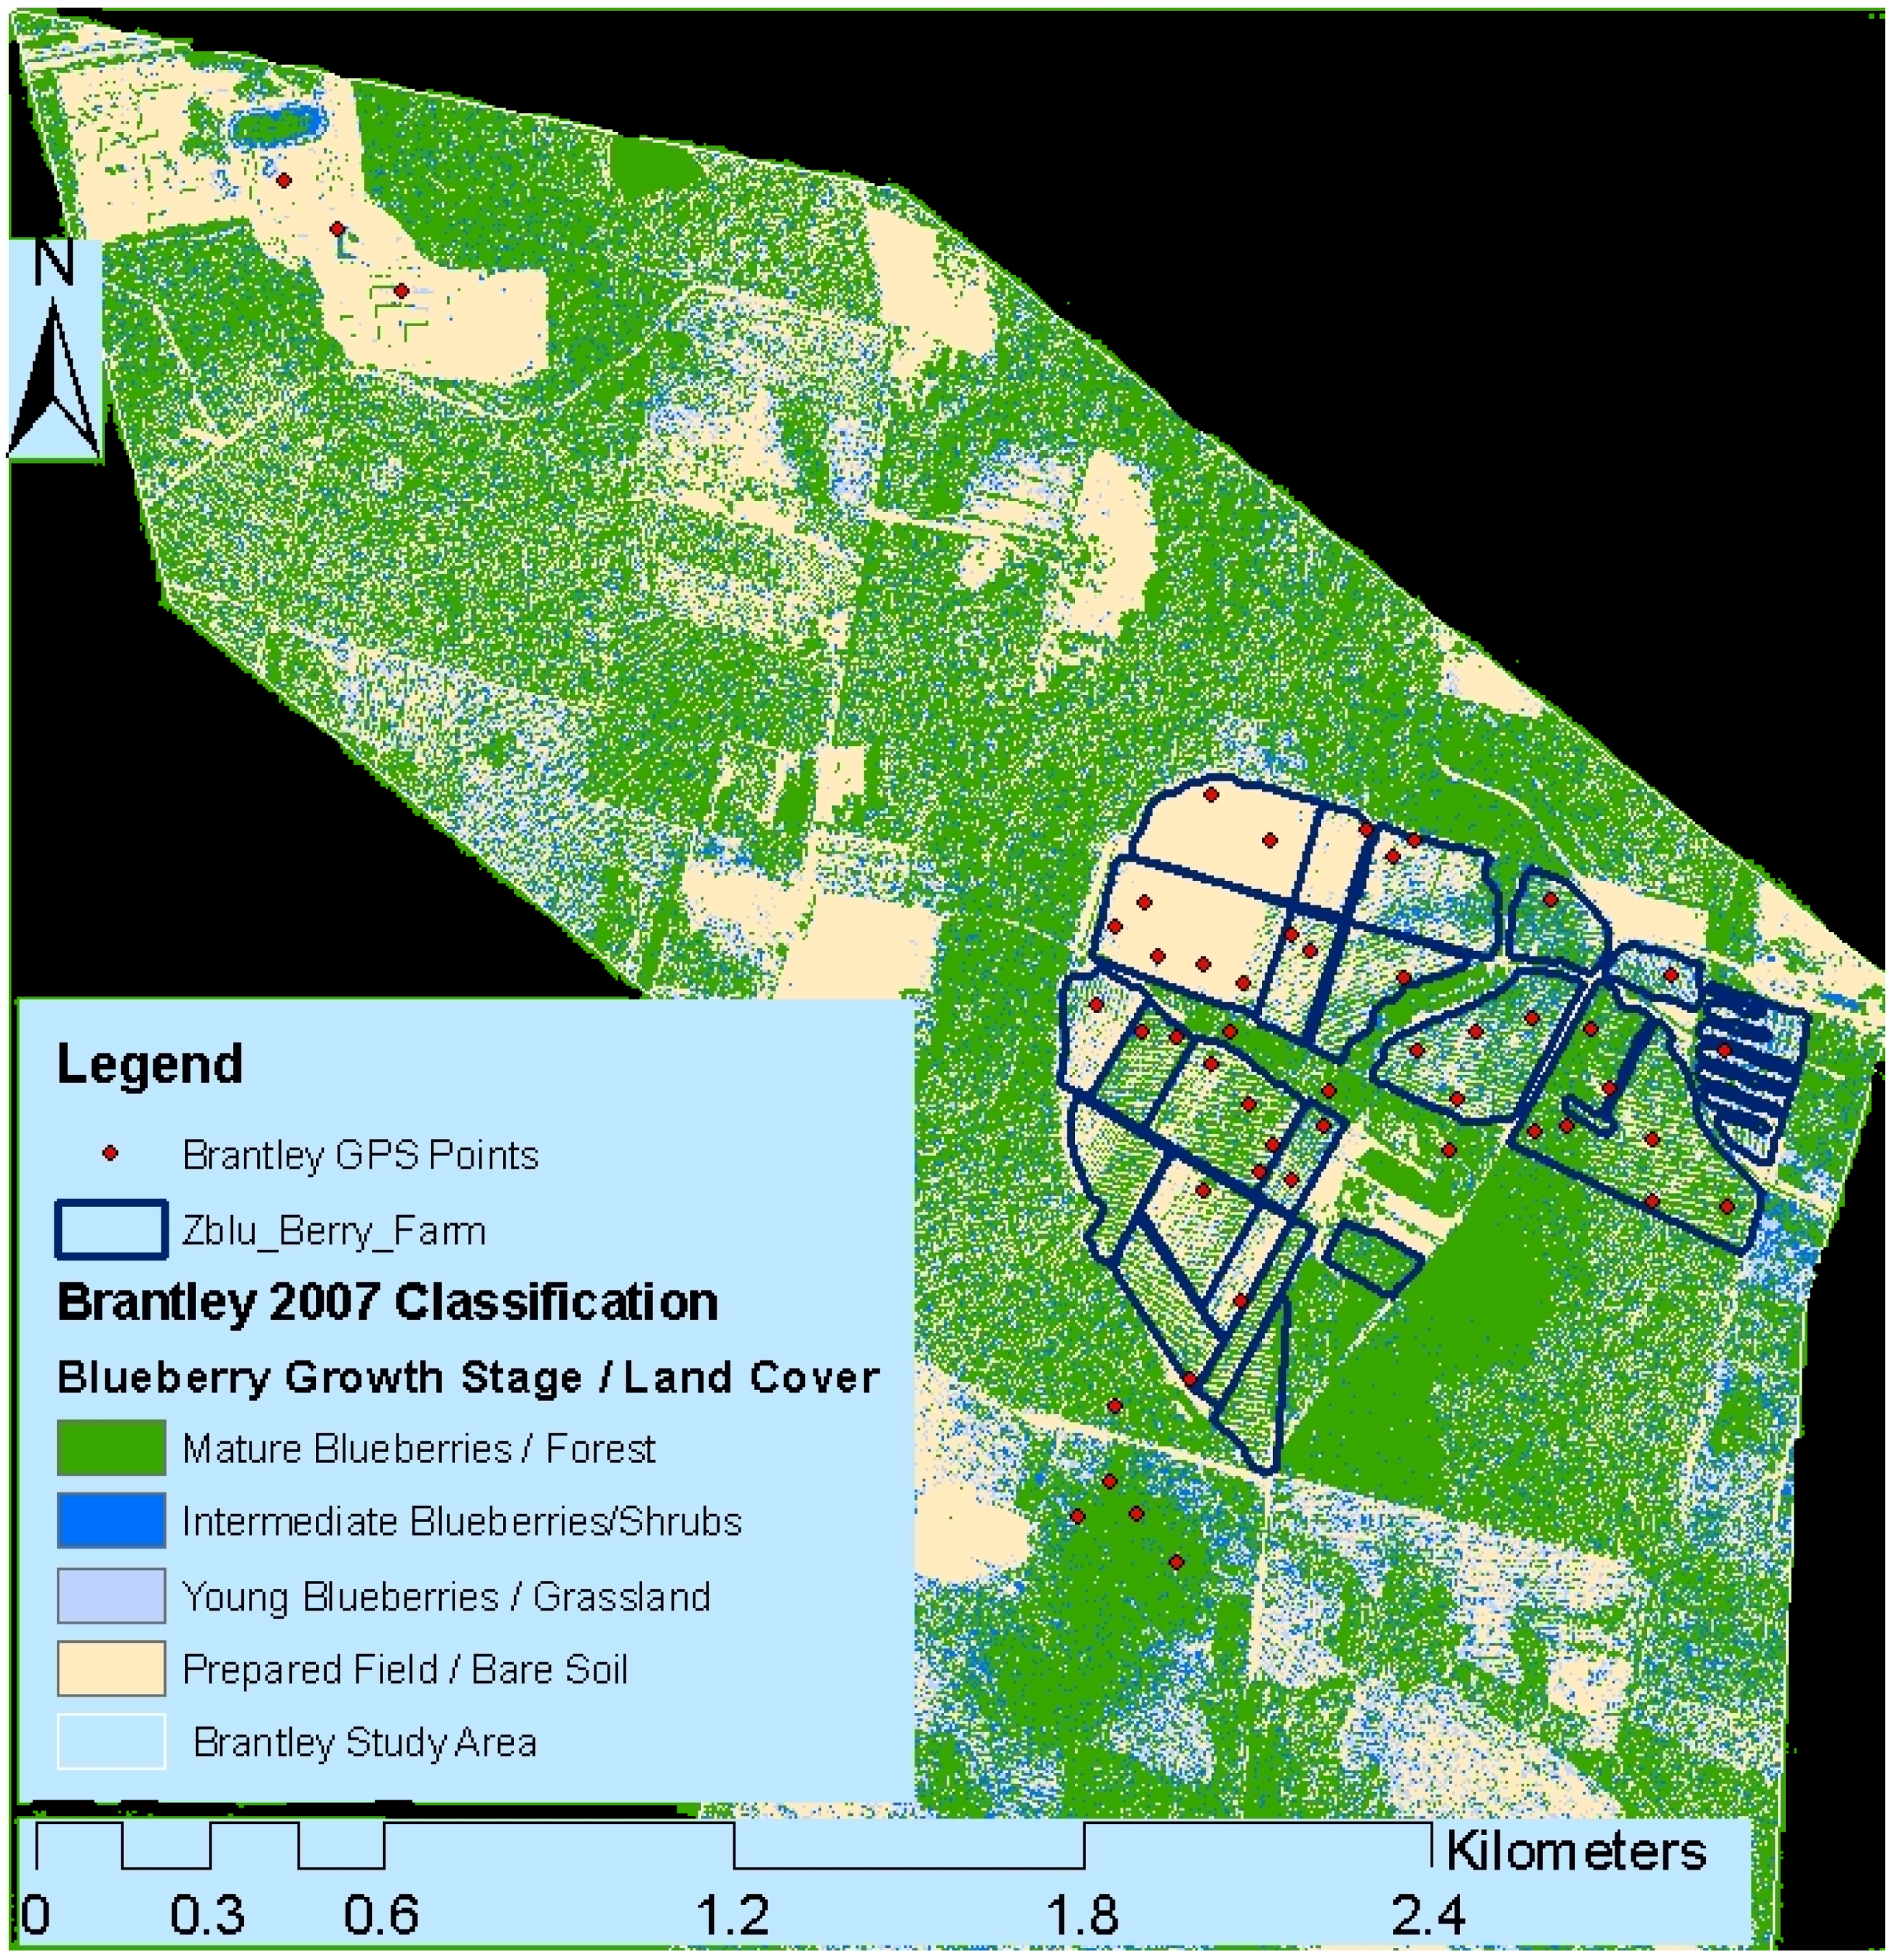
Figure 5 provides an example of GIS and remote sensing usage in delineating blueberry orchard boundaries and describing the extent of different blueberry crop growth types in a study area [
54]. This study was conducted in the proximity of Nahunta City of Brantley County in Georgia, U.S. An advanced blueberry orchard, Z-Blu Farm is delineated inside the study area using GIS tools. Individual plot areas were calculated (not shown in the figure) using the Calculate Geometry Tool of ArcGIS software. The same tool also helped in calculating the total area of the study area,
i.e., 5.88 km
2 [
54]. IDRISI Andes (Clarks Lab, Clarke University, Worcester, MA, U.S.) software was used to classify the study area NAIP (1-m resolution) imagery using Self-organizing Map (SOM) image classification technique. The study image was classified with 15 classes and a classification dendrogram was developed using WARD minimum variance technique to merge clusters with close cluster mean values. Four distinct classes (Mature Blueberry/Forest, Intermediate Blueberry/Shrubs, Young Blueberries/Grassland, and Prepared Field/Bare Soil) were observed in the study area, which helped in further advanced SSCM of the crop. GIS also facilitated to find the total area under each class. For example, in this study, Mature Blueberry/Forest class covered 2.87 km
2 or 48.78% of the total study area. The other three classes, Intermediate Blueberry/Shrubs, Young Blueberries/Grassland, and Prepared Field/Bare Soil covered 0.52 km
2, 0.58 km
2, and 1.91 km
2, respectively, or 8.76%, 9.86%, 32.60% of the total study area, respectively. Ground control points (GCP) are shown in
Figure 5, which were used for the classification accuracy assessment.
Figure 5.
SOM classified image of Brantley County study area along with ground truth points (50 points) and GPS-recorded blueberry orchards at different stages.
Figure 5.
SOM classified image of Brantley County study area along with ground truth points (50 points) and GPS-recorded blueberry orchards at different stages.
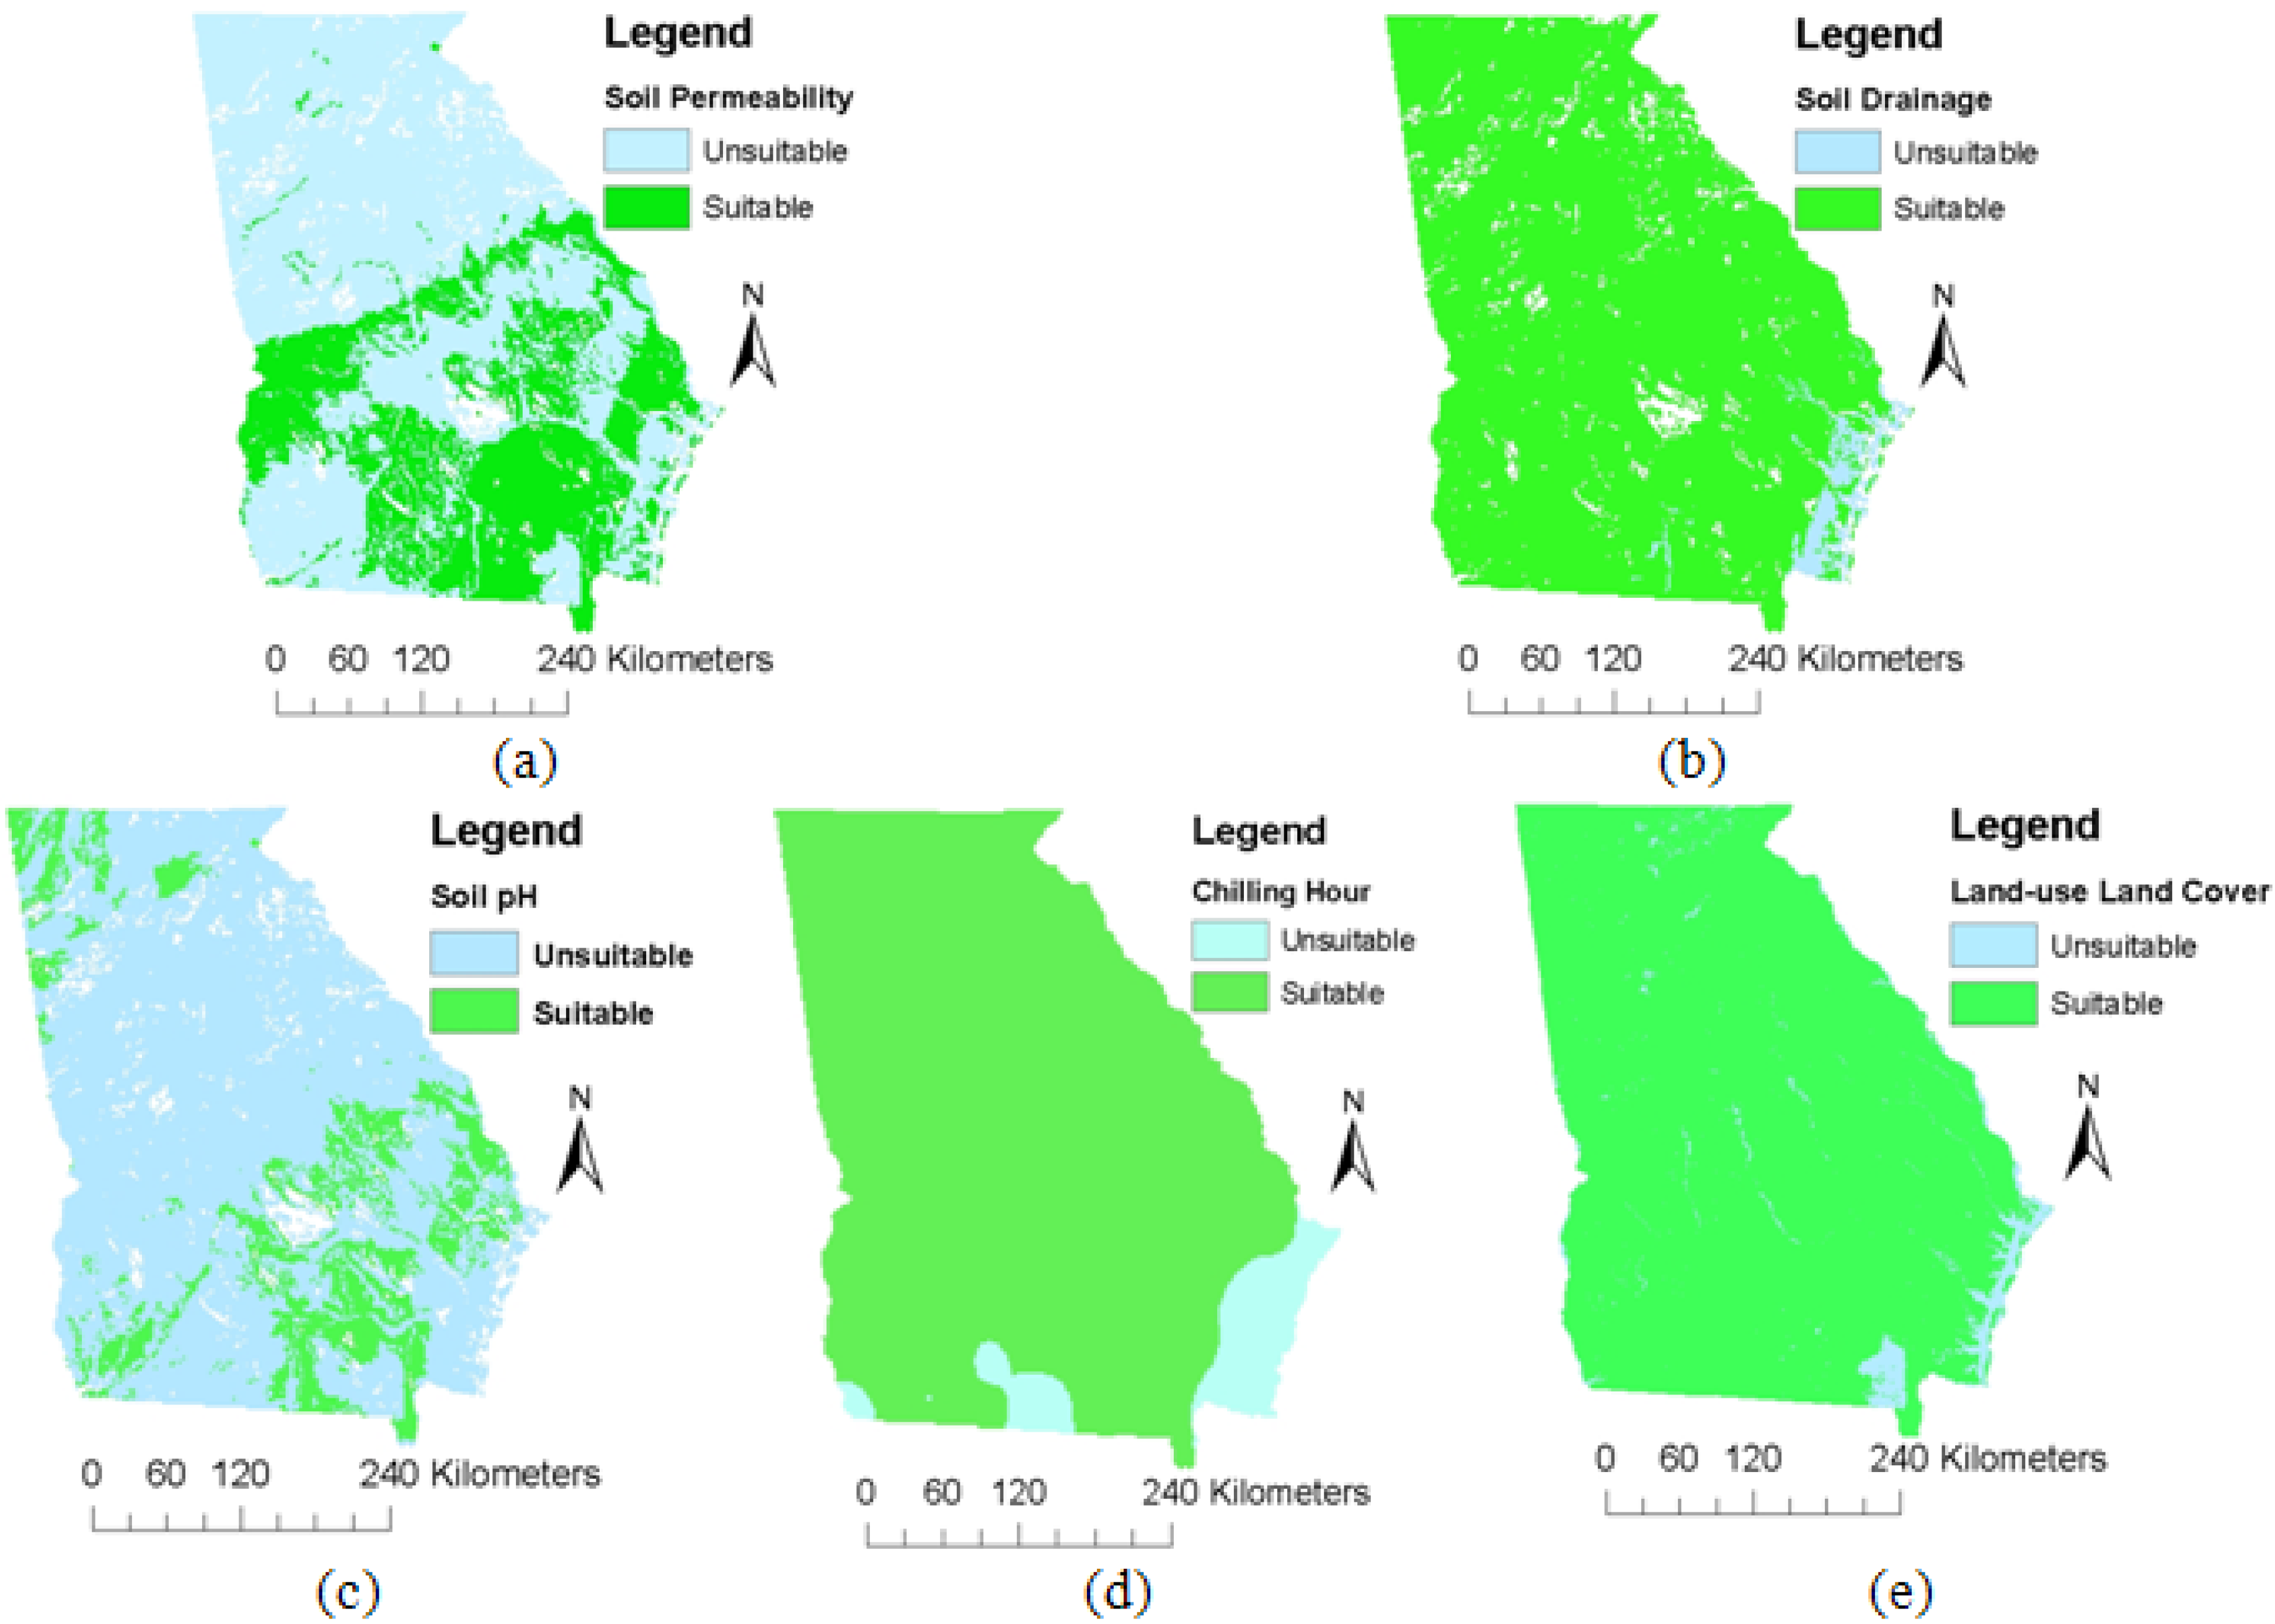
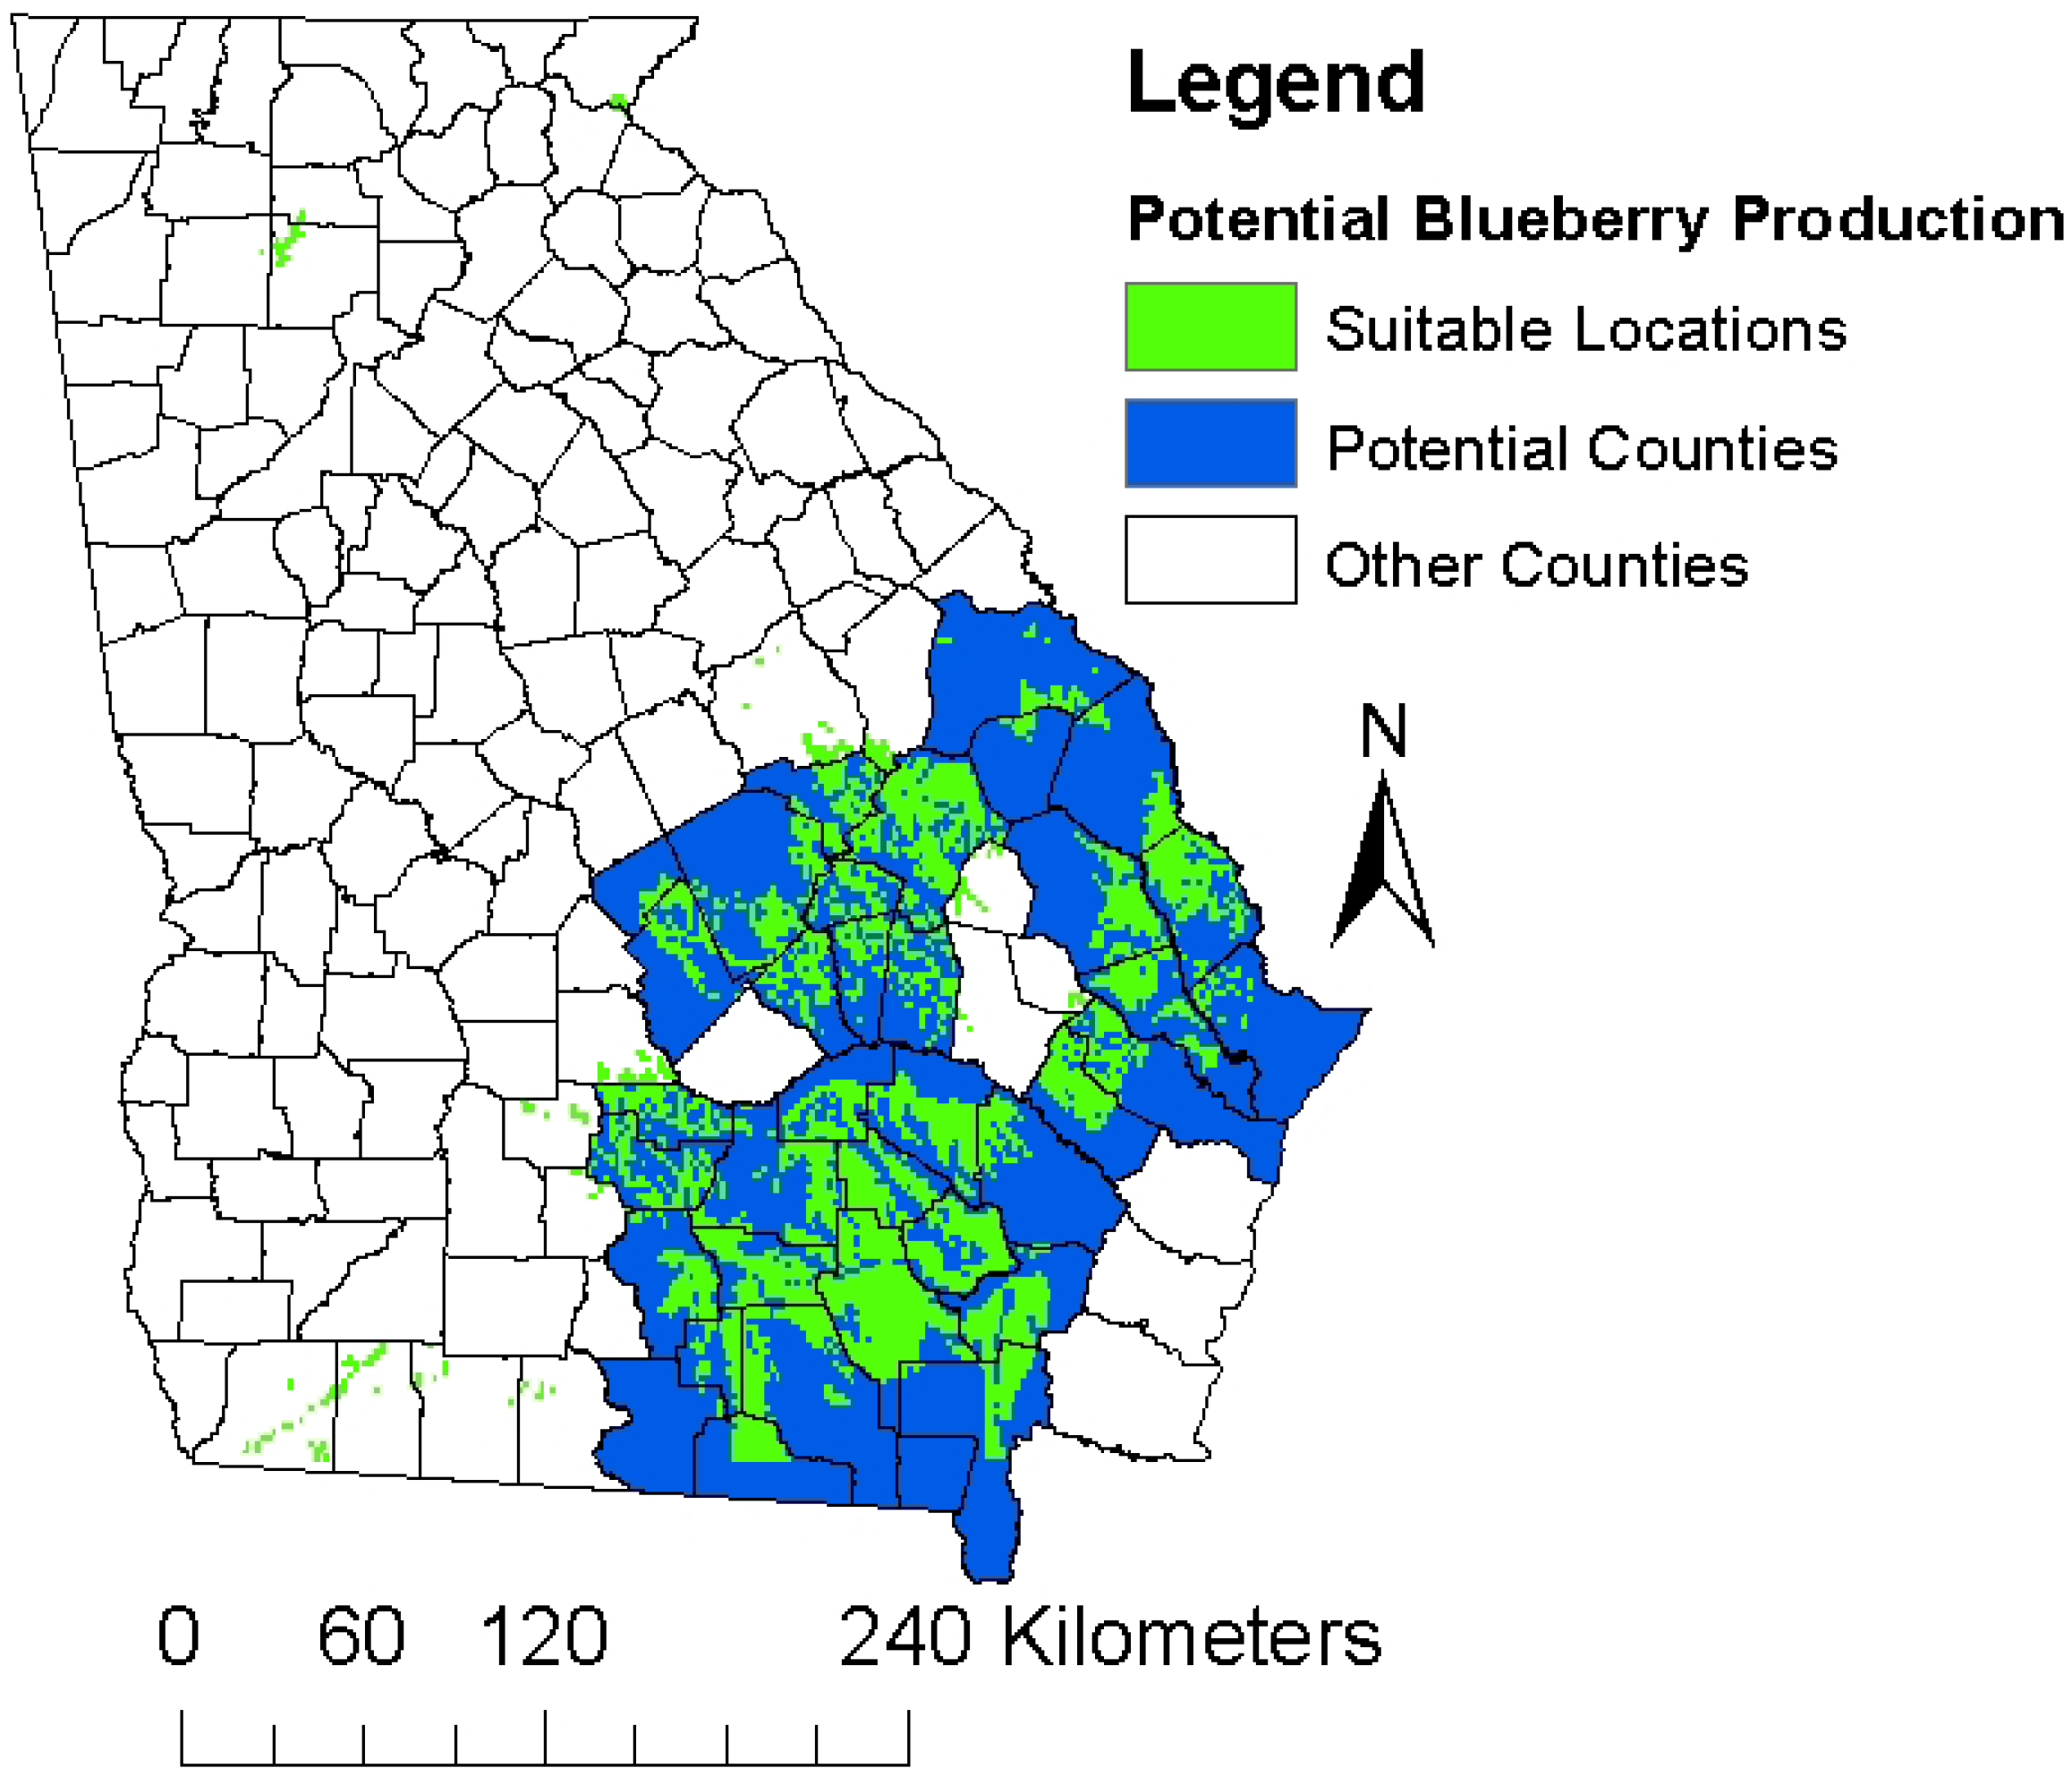
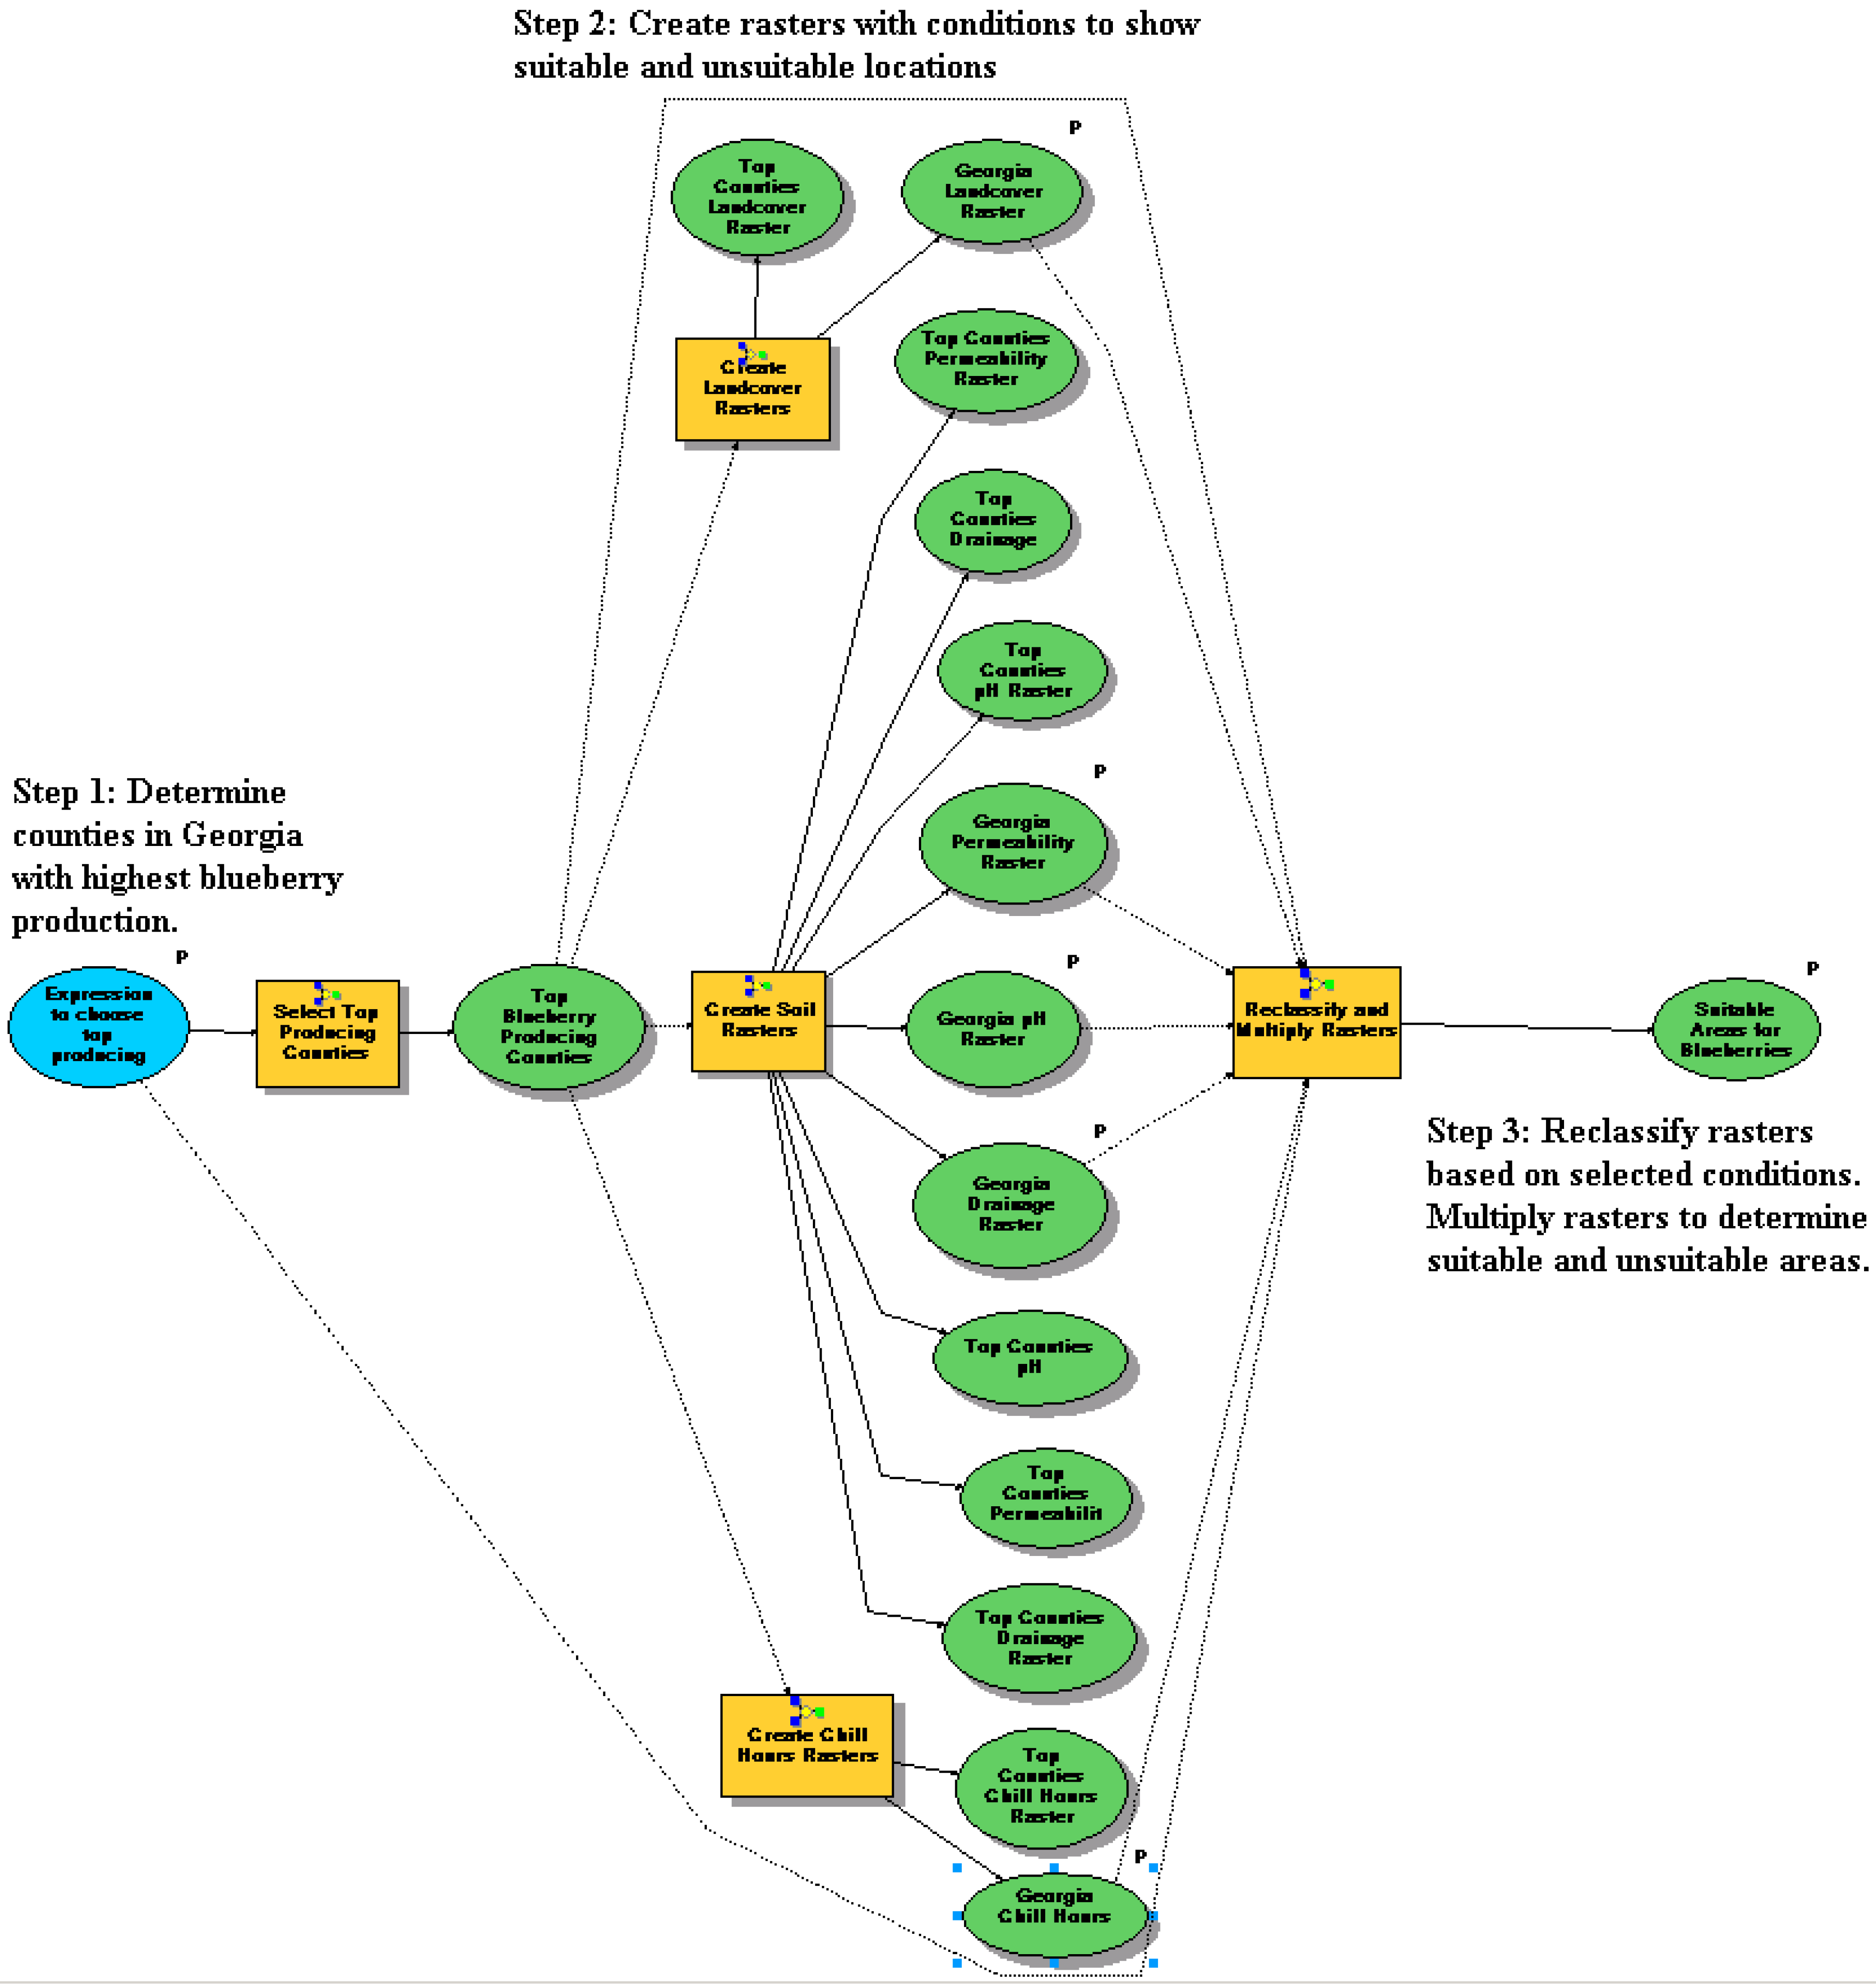
The advanced application of GIS can help in designing geospatial models to conduct suitability analysis for a particular fruit or nut crop.
Figure 6 represents a geospatial model that was developed to find suitable locations in the state of Georgia in the United States for blueberry production [
53]. The model used five pertinent factors: chilling hours, soil permeability, soil drainage ability, soil pH, and the land cover types in Georgia to obtain suitable locations for blueberry plantations. The study also
Figure 6.
Geospatial model developed in ArcGIS Model Builder for the blueberry crop suitability analysis in the State of Georgia, U.S.
Figure 6.
Geospatial model developed in ArcGIS Model Builder for the blueberry crop suitability analysis in the State of Georgia, U.S.
demarcated the area where blueberry is being produced and which area has potential to plant blueberry in Georgia [
53].
Figure 7 shows the suitable locations based on individual contributing factors used in the analysis.
Figure 8 represents the suitable locations for blueberry production in Georgia [
53]. Similar models can be developed for any fruit or nut crops suitable location analysis in either the United States or other parts of the world using similar or different contributing factors.
Figure 7.
Maps showing the suitable areas in Georgia for various blueberry production parameters: soil permeability (a), soil drainage (b), soil pH (c), chilling hours (d), and land-use (e).
Figure 7.
Maps showing the suitable areas in Georgia for various blueberry production parameters: soil permeability (a), soil drainage (b), soil pH (c), chilling hours (d), and land-use (e).
Figure 8.
Blueberry production suitability map for Georgia.
Figure 8.
Blueberry production suitability map for Georgia.
12. Other Physical Characteristics Analysis of Fruit and Nut Crop SSCM
Similar to other crops, successful cultivation of fruit and nut crops has specific requirements with respect to weather suitability such as chilling hours, growing degree days (GDD), and rainfall, soil characteristics such as nutrient availability, pH level, drainage, and permeability, and land-use and land cover (LULC) types [
8]. These can all be analyzed to determine the perfect physical conditions for growth of a crop and to delineate potential areas for fruit and nut crop production.
In the case of blueberries, the rabbiteye varieties normally require a smaller number of chilling hours,
i.e., 150–600 hours, compared to 200–700 hours for southern highbush varieties and more than 1,000 hours for northern highbush varieties [
70]. Blueberries prefer an acidic, well-drained soil with an average pH of 4.0–5.5 and an optimum pH of 4.8 [
71]. A well-drained soil profile with a minimum depth of 45 cm is suitable for blueberry production [
72]. High soil permeability is a necessity for blueberry production because water-saturated soil conditions for a prolonged period of time can harm the bushes and can cause a severe infestation of Phytophthora root rot [
72]. For blueberry production, soils with an organic matter of at least 3% are preferred, although rabbiteye varieties can grow in soils that have as little as 1% organic matter [
4]. Blueberries grow best on land that has recently been cleared of forests or has never been planted with other crops. It is also preferred to grow blueberries close to forest cover for frost protection [
73]. Other fruit and nut crops have similar physical requirements for optimum growth and development. However, further information is needed in order to be able to develop an extensive database for suitability analysis and fruit and nut crop SSCM.
13. Advanced Techniques for SSCM of Fruit and Nut Crop
We are now in the irrefutable era of global warming. Therefore, basic SSCM application for crop management need to be changed to reflect the erratic weather pattern that is happening now due to El Nino and La Nina effect [
74]. The erratic weather pattern includes rainfall pattern, cold and heat wave movement, and sudden freeze condition in non-freezing locations,
etc. Therefore, advanced determination of rainfall pattern and freezing conditions are essential for SSCM application in crop production and especially fruit and nut crop production.
In the next few decades water scarcity will be acute and, therefore, advanced water management techniques should be developed to meet the need of water usage in agriculture [
75]. As mentioned in
Section 3, Panda
et al. [
37] used the soil characteristics, climate factors, and aerial images of the crop field to develop crop yield based water use model to predict the total water requirement for corn. Similar models could be developed to predict the water requirements for the fruit and nut crops. Thus, judicious site specific water use will help in conserving water. It will also help in the SSCM of the fruit and nut crop in case of erratic weather pattern. Wired magazine in its 16.07 issue [
76] mentioned how the Lanworth Company, through its advanced data management technology, reduced the corn crop production estimation by a whopping 200 million bushels in the United States which was conducted by United States Department of Agriculture (USDA). Therefore, in the future, the use of data mining [
2], image mining [
77], and advanced database management technologies will help in the advancement of the SSCM in fruit and nut crops.
14. Conclusions
This paper provides a comprehensive review on the development and application of SSCM for fruit and nut crops. The review also confirmed that not many studies (compared to row crop agriculture) have been conducted so far on fruit and nut crops’ SSCM. This review paper provides one-stop-information on available technology for the fruit and nut crop SSCM. The study provides a detailed application of geospatial and information technology in the blueberry crop management with a case study in Georgia, U.S., and in a few study locations in southeast Georgia. They can be replicated as described or modified based on local requirements and needs. This study also provides a detailed analysis of several characteristics responsible for blueberry production and describes, through references, how to develop geospatial models using those characteristics to plan for its management. Similar models can be developed using related crop characteristics to manage the crop.
Schupp
et al. [
78] provides an overview of current progress and the potential for future innovations for specialty crops which includes fruit and nut crops. They stated that “
Video, laser, and satellite imaging technologies will become pertinent to future improvements in orchard production and associated equipment. First, it is important to develop a tree system that is compatible with imaging technologies—a high density planting, trained to a continuous planar fruiting wall. Engineers have indicated that this type of system will lend itself more easily to upcoming commercial technologies, both mechanical and imagery.”
According to Schupp
et al. [
78], imaging technology has the potential to cross multiple areas of tree fruit production, such as crop load assessment, including blossom or green fruit counts, yield estimation, determination of insect presence or disease infection and associated eradication, soil moisture content determination for enhanced irrigation system design, estimation of fertilizer, pesticide, and herbicide application rates, and the development of assisted or automated pruning and harvesting strategies. Schupp
et al. [
78] state that different technological approaches such as satellite imagery, real-time laser images, and video imagery application will prove successful for fruit and nut crop SSCM.
Finally, this review paper would encourage researchers to advance the SSCM in fruit and nut crops as is being done in other row crop cases.


