Article

Building Damage Estimation by Integration of Seismic Intensity Information and Satellite L-band SAR Imagery

1
Information Technology Research Institute, National Institute of Advanced Industrial Science and Technology, Site 2, 1-1-1 Umezono, Tsukuba 305-8568, Japan
2
Department of Civil Engineering, Faculty of Engineering, Gifu University, 1-1 Yanagido, Gifu 501-1193, Japan
*
Author to whom correspondence should be addressed.
Remote Sens. 2010, 2(9), 2111-2126; https://doi.org/10.3390/rs2092111
Submission received: 20 July 2010 / Revised: 4 August 2010 / Accepted: 30 August 2010 / Published: 8 September 2010
(This article belongs to the Special Issue Remote Sensing in Seismology)

Abstract

:
For a quick and stable estimation of earthquake damaged buildings worldwide, using Phased Array type L-band Synthetic Aperture Radar (PALSAR) loaded on the Advanced Land Observing Satellite (ALOS) satellite, a model combining the usage of satellite synthetic aperture radar (SAR) imagery and Japan Meteorological Agency (JMA)-scale seismic intensity is proposed. In order to expand the existing C-band SAR based damage estimation model into L-band SAR, this paper rebuilds a likelihood function for severe damage ratio, on the basis of dataset from Japanese Earth Resource Satellite-1 (JERS-1)/SAR (L-band SAR) images observed during the 1995 Kobe earthquake and its detailed ground truth data. The model which integrates the fragility functions of building damage in terms of seismic intensity and the proposed likelihood function is then applied to PALSAR images taken over the areas affected by the 2007 earthquake in Pisco, Peru. The accuracy of the proposed damage estimation model is examined by comparing the results of the analyses with field investigations and/or interpretation of high-resolution satellite images.

Graphical Abstract

1. Introduction

Worldwide remote monitoring from space of natural disasters, such as earthquakes, tsunamis, and floods, is becoming more common in recent years with the launch of the “International Charter Space and Major Disaster” system. This system has facilitated the immediate observation of disaster affected regions using earth observation satellites since around the year 2000, and provides a quick access to high-resolution satellite images with a ground resolution finer than 1 m, which is comparable with imagery available for commercial use.
Remote observation and the study of a large variety of worldwide natural disasters, takes advantage of several types of sensors. Mainly two types of sensors are used in satellite remote sensing of Earth; optical sensors which observe reflective and radiometric characteristics in the visible light, near and mid-infrared, and thermal infrared regions, and radar sensors which use microwaves with wavelengths between several centimeters to several tens of centimeters. High-resolution optical sensor images can be used to assess damage at building level [1,2] or to evaluate damage to ground, such as landslides, in regions where field investigation may be difficult [3], making them a promising observation method for emergency responses following disasters. Unfortunately, this method is not applicable in regions with incidence of cloud cover or cloud shadows. On the other hand, radar sensors are capable of observing the ground irrespective of weather conditions or the time of the day, and therefore have been gaining prominence as a reliable tool for grasping the overall picture of damage from disasters. In particular, crustal deformation monitoring technology [4] based on interferometric processing of the synthetic aperture radar (SAR) phase information, has been undergoing refinement through numerous case studies [5], and is now reaching a level where it can be utilized at a practical level.
A prompt investigation of direct damages from disasters to social infrastructure, such as buildings, as well as detailed information on their spatial distribution, is crucial for effective disaster response and reconstruction efforts. To address this problem, several comparative studies of backscattering intensity information or phase information of SAR images with building damage have been actively performed [6,7,8,9], using a dataset from the 1995 Kobe earthquake. Integration with seismic intensity information has also been implemented [10]. Matsuoka and Yamazaki proposed a linear discriminant score, that uses as variables the correlation and difference in backscattering coefficient before and after the earthquake as an indicator which correlates strongly with areas of building damage, using ERS-1 (ESA Remote-Sensing Satellite-1)/SAR images from the European Space Agency which observed the area hit by the Kobe earthquake before and after the event [11]. Furthermore, in order to evaluate the building damage ratio from SAR images, and to allow an integrated analysis with other types of information such as seismic intensity information, Nojima et al. derived a regression discriminant function that relates to the building damage ratio from the correlation and difference in backscattering coefficient, and created a model for quantitatively estimating the severe building damage ratio from a modeled likelihood function based on the regression discriminant function [12]. The versatility of this model has been qualitatively demonstrated, as it is not very susceptible to the effects of satellite observation conditions and regional characteristics, because it uses intensity information in the form of backscattering coefficient in order to extract areas of damage [13]. However, Nojima et al.’s estimation model is based on C-band (wavelength of about 5.7 cm) ERS-1/SAR images, which means that it cannot strictly be applied to L-band (wavelength of about 23 cm) JERS-1 (Japanese Earth Resource Satellite-1)/SAR and ALOS/PALSAR (Advanced Land Observing Satellite/Phased Array type L-band Synthetic Aperture Radar) images owned by METI (Ministry of Economy, Trade and Industry) and JAXA (Japan Aerospace Exploration Agency). This is because at different wavelengths, there are variations in backscatter characteristics of target objects originating from their permeability, permittivity and surface roughness.
In this paper we follow the procedure used by Nojima et al. [12] in order to create an estimation model for the severe building damage ratio that can be applied to PALSAR images from ALOS, which has been conducting several observations of earthquake damage since the launch of the satellite in January 2006. We will also determine a modeled likelihood function for the severe building damage ratio from JERS-1/SAR images of the 1995 Kobe earthquake, and we will demonstrate that the building damage distribution can be accurately estimated through integration with fragility functions for building damage in terms of JMA (Japan Meteorological Agency) seismic intensity. Furthermore, we apply our new methodology to PALSAR images from ALOS, which observed the areas of the 2007 Peru earthquake, and assess our model performance by comparisons with field investigations.

2. Likelihood Function from JERS-1/SAR

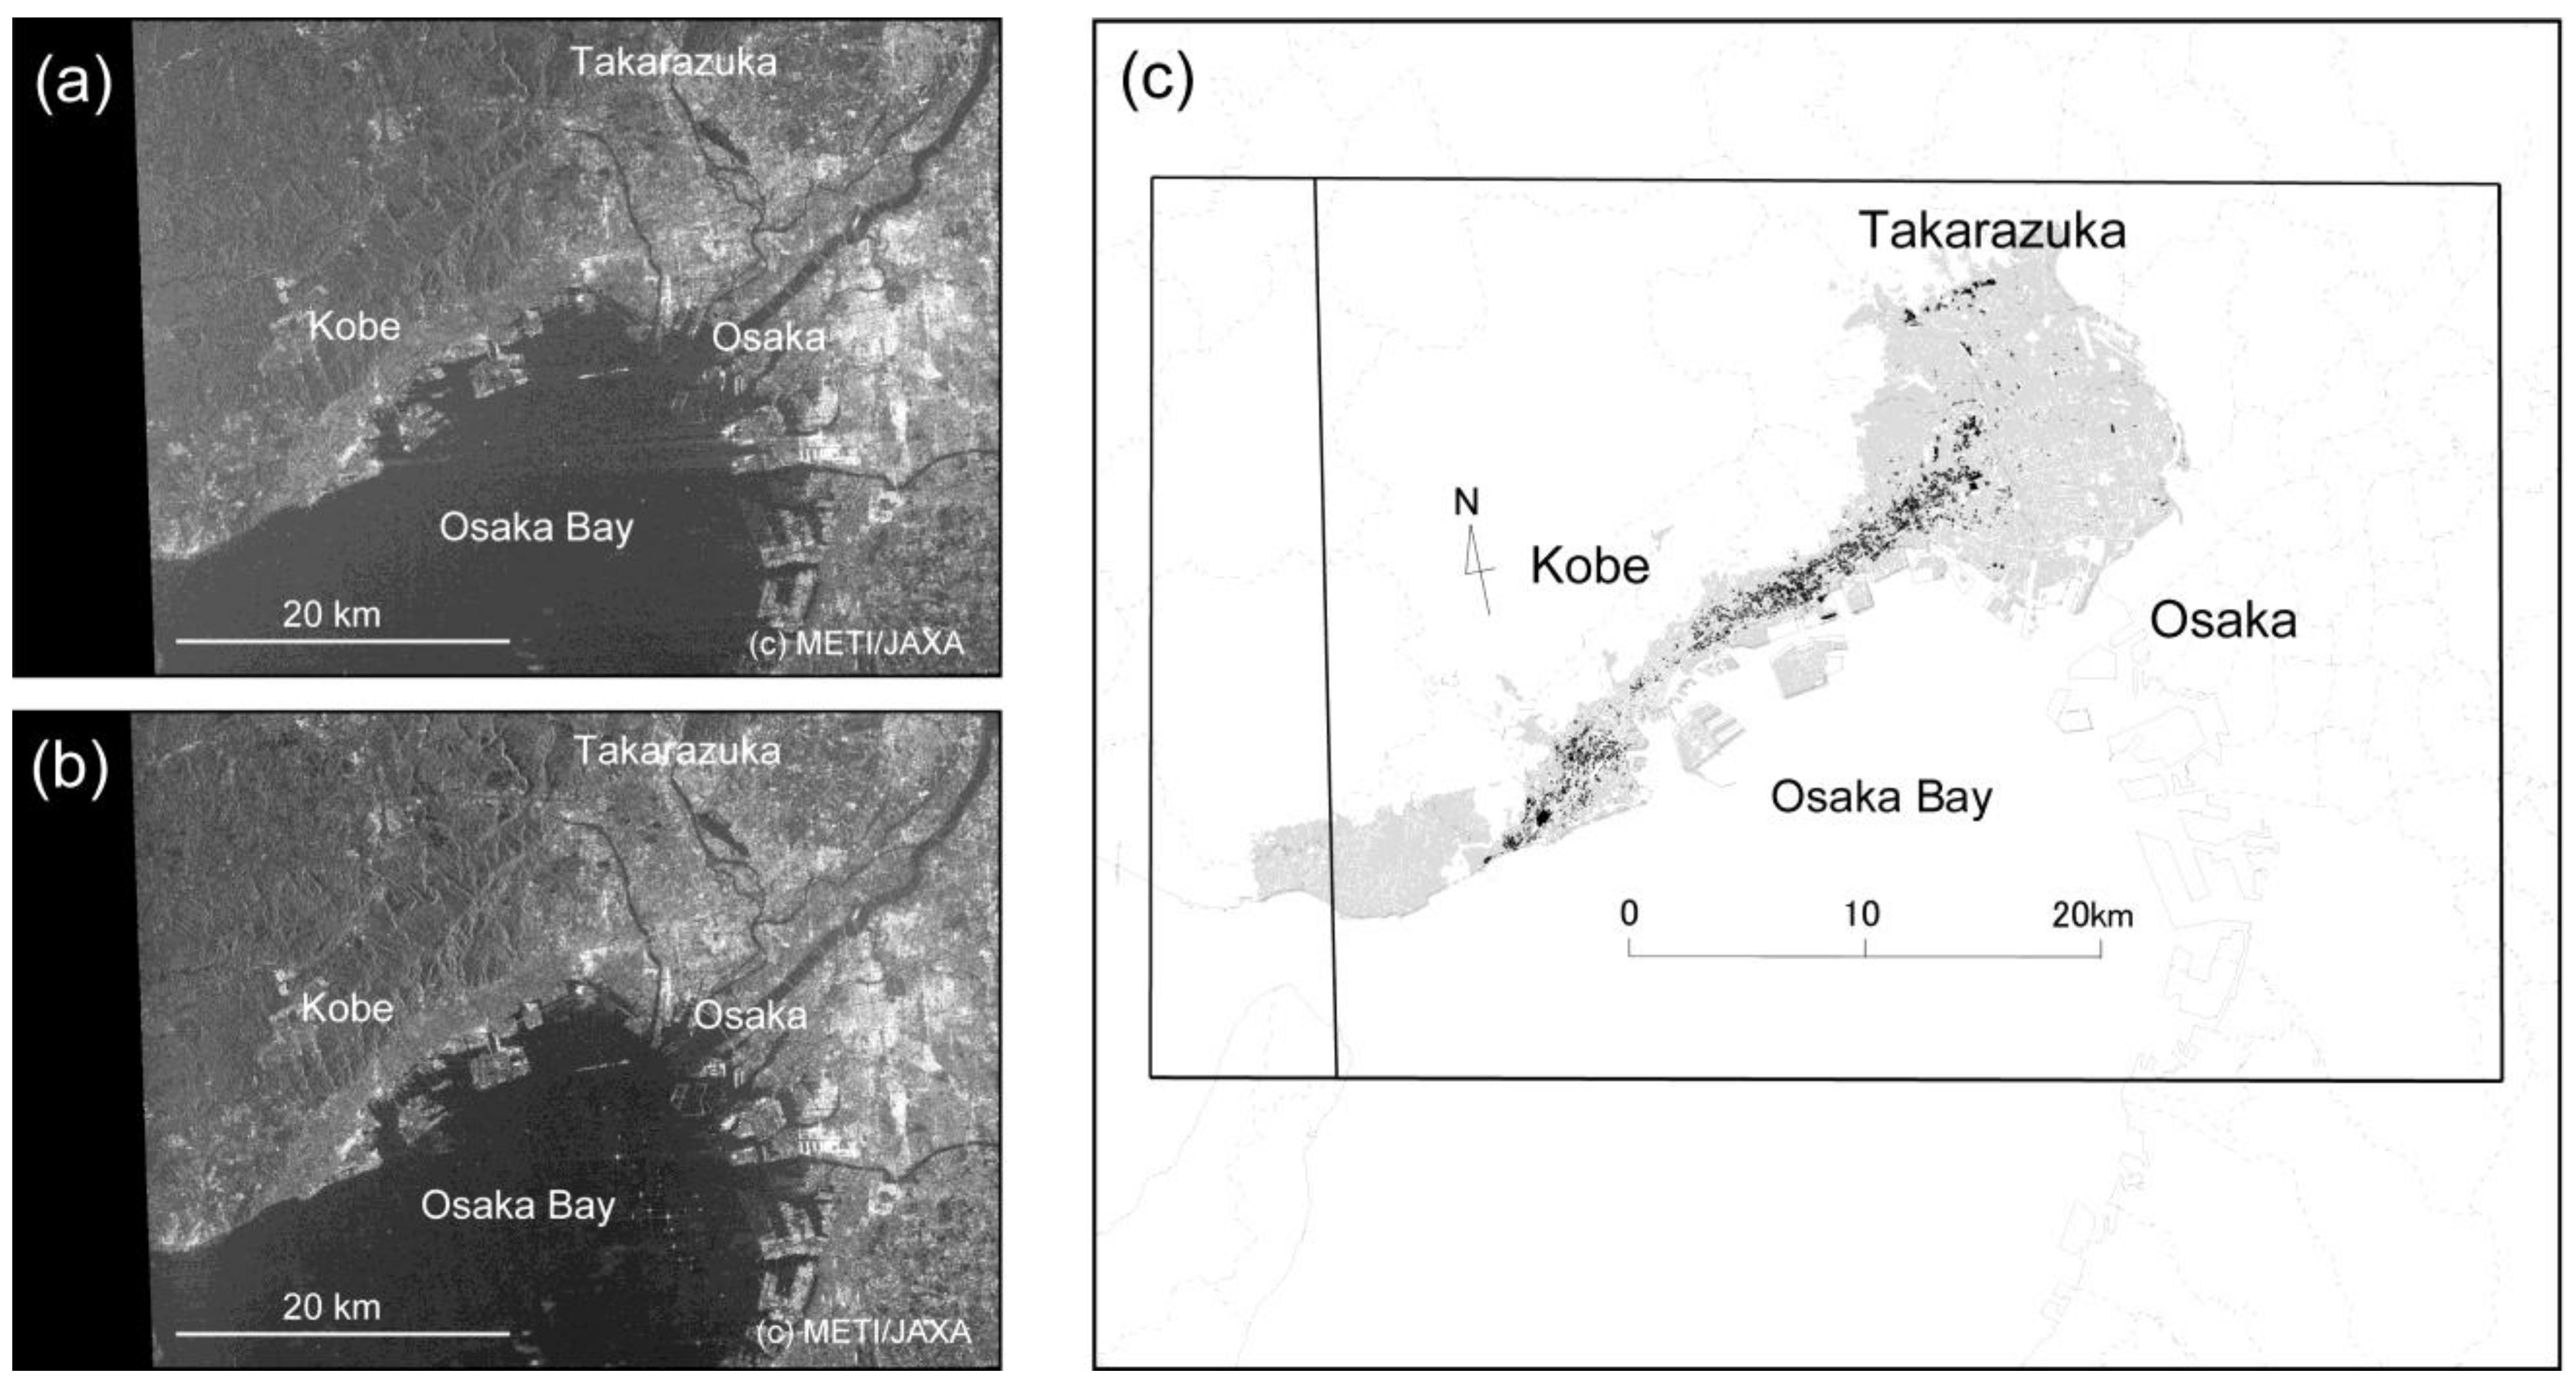
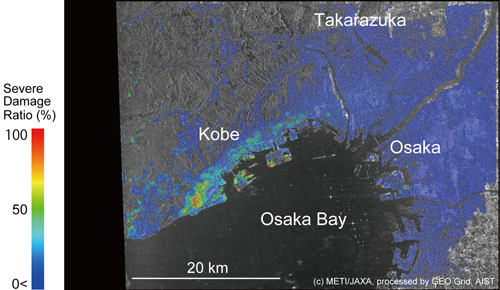
2.1. SAR Images and Ground Truth Data

The JERS-1 satellite launched by Japan in 1992 was operational until 1998, and made observations of the region affected by the 1995 Kobe earthquake. This satellite was equipped with an optical sensor (OPS) and a radar sensor (SAR). SAR images for before and after the earthquake (before: May 17, 1994; after: May 4, 1995) are shown in Figure 1(a,b). For the ground truth data, the GIS-based building damage data was provided based on detailed survey results compiled by AIJ (the Architectural Institute of Japan) and CPIJ (the City Planning Institute of Japan), and digitized by BRI (the Building Research Institute), wherein the building damage level is classified into five categories; damage by fire, severe damage, moderate damage, slight damage, and no damage, with the number of damaged buildings being totaled for each city block [14]. Severe damage almost corresponds to G5~G4 and a part of G3 in the classification of the European Macroseismic Scale (EMS-98) [15]. Using the field survey data, severe damage ratio of buildings at a city-block level was calculated as the ratio between the number of buildings classified as burnt or severely damaged and the total number of buildings in each block. Figure 1(c) shows the data for building damage and areas where the severe damage ratio was more than 30% are colored black. There are significant linear noise patterns on the image, due to the fact that SAR sensors at the time had a relatively low signal-to-noise ratio. Although the effects of noise in the subsequent analysis is unavoidable, we have decided to use this dataset because no other earthquake that has been observed by L-band SAR has such an availability of data for building damage which is sufficiently detailed for statistical analyses. As a matter of note, the post-quake image was taken approximately four months after the earthquake, which means that it is probable that some of the buildings which were damaged by the quake had been either partially or fully demolished or dismantled; however, this image was chosen so as to allow a comparison with an ERS/SAR image which was taken in the same time interval. The size of 1 pixel in the SAR image is about 30 m.
Figure 1. JERS-1/SAR images from before and after the 1995 Kobe earthquake and target area of analysis. (a) Image taken May 17, 1994 (before). (b) Image taken May 4, 1995 (after). (c) Building damage data after the earthquake (black areas indicate severe damage ratio of over 30%) [14].
Remotesensing 02 02111 g001

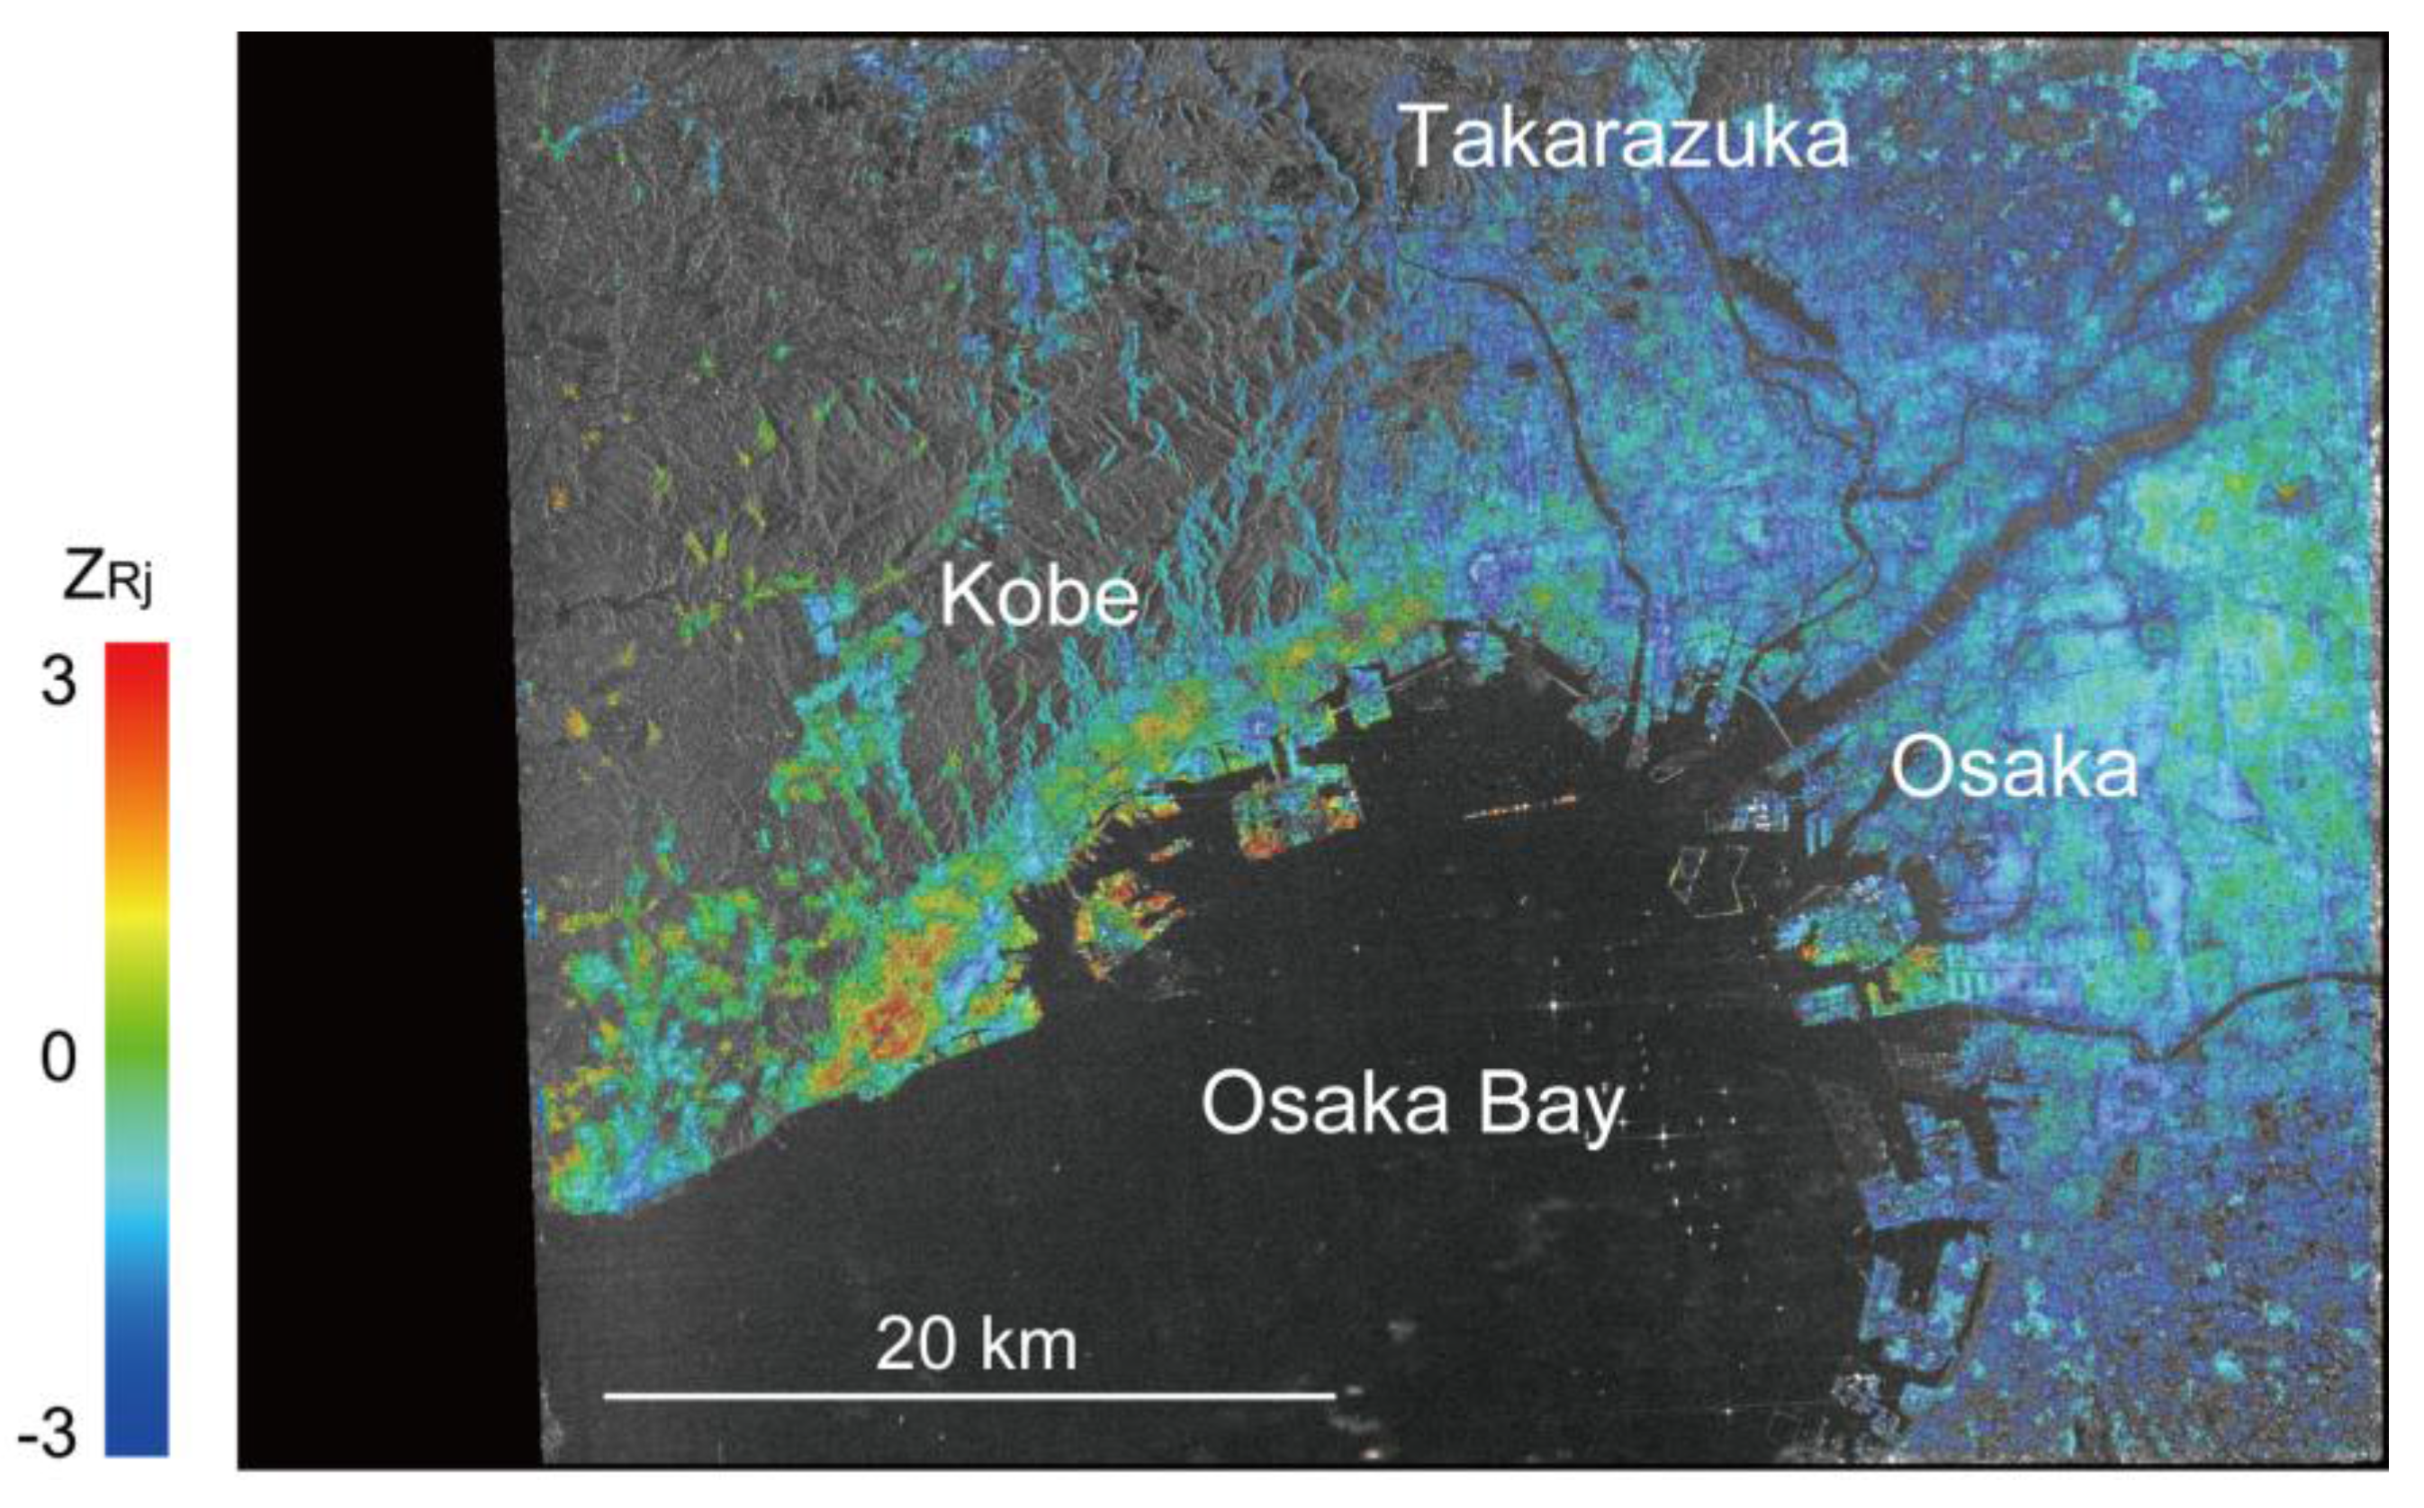
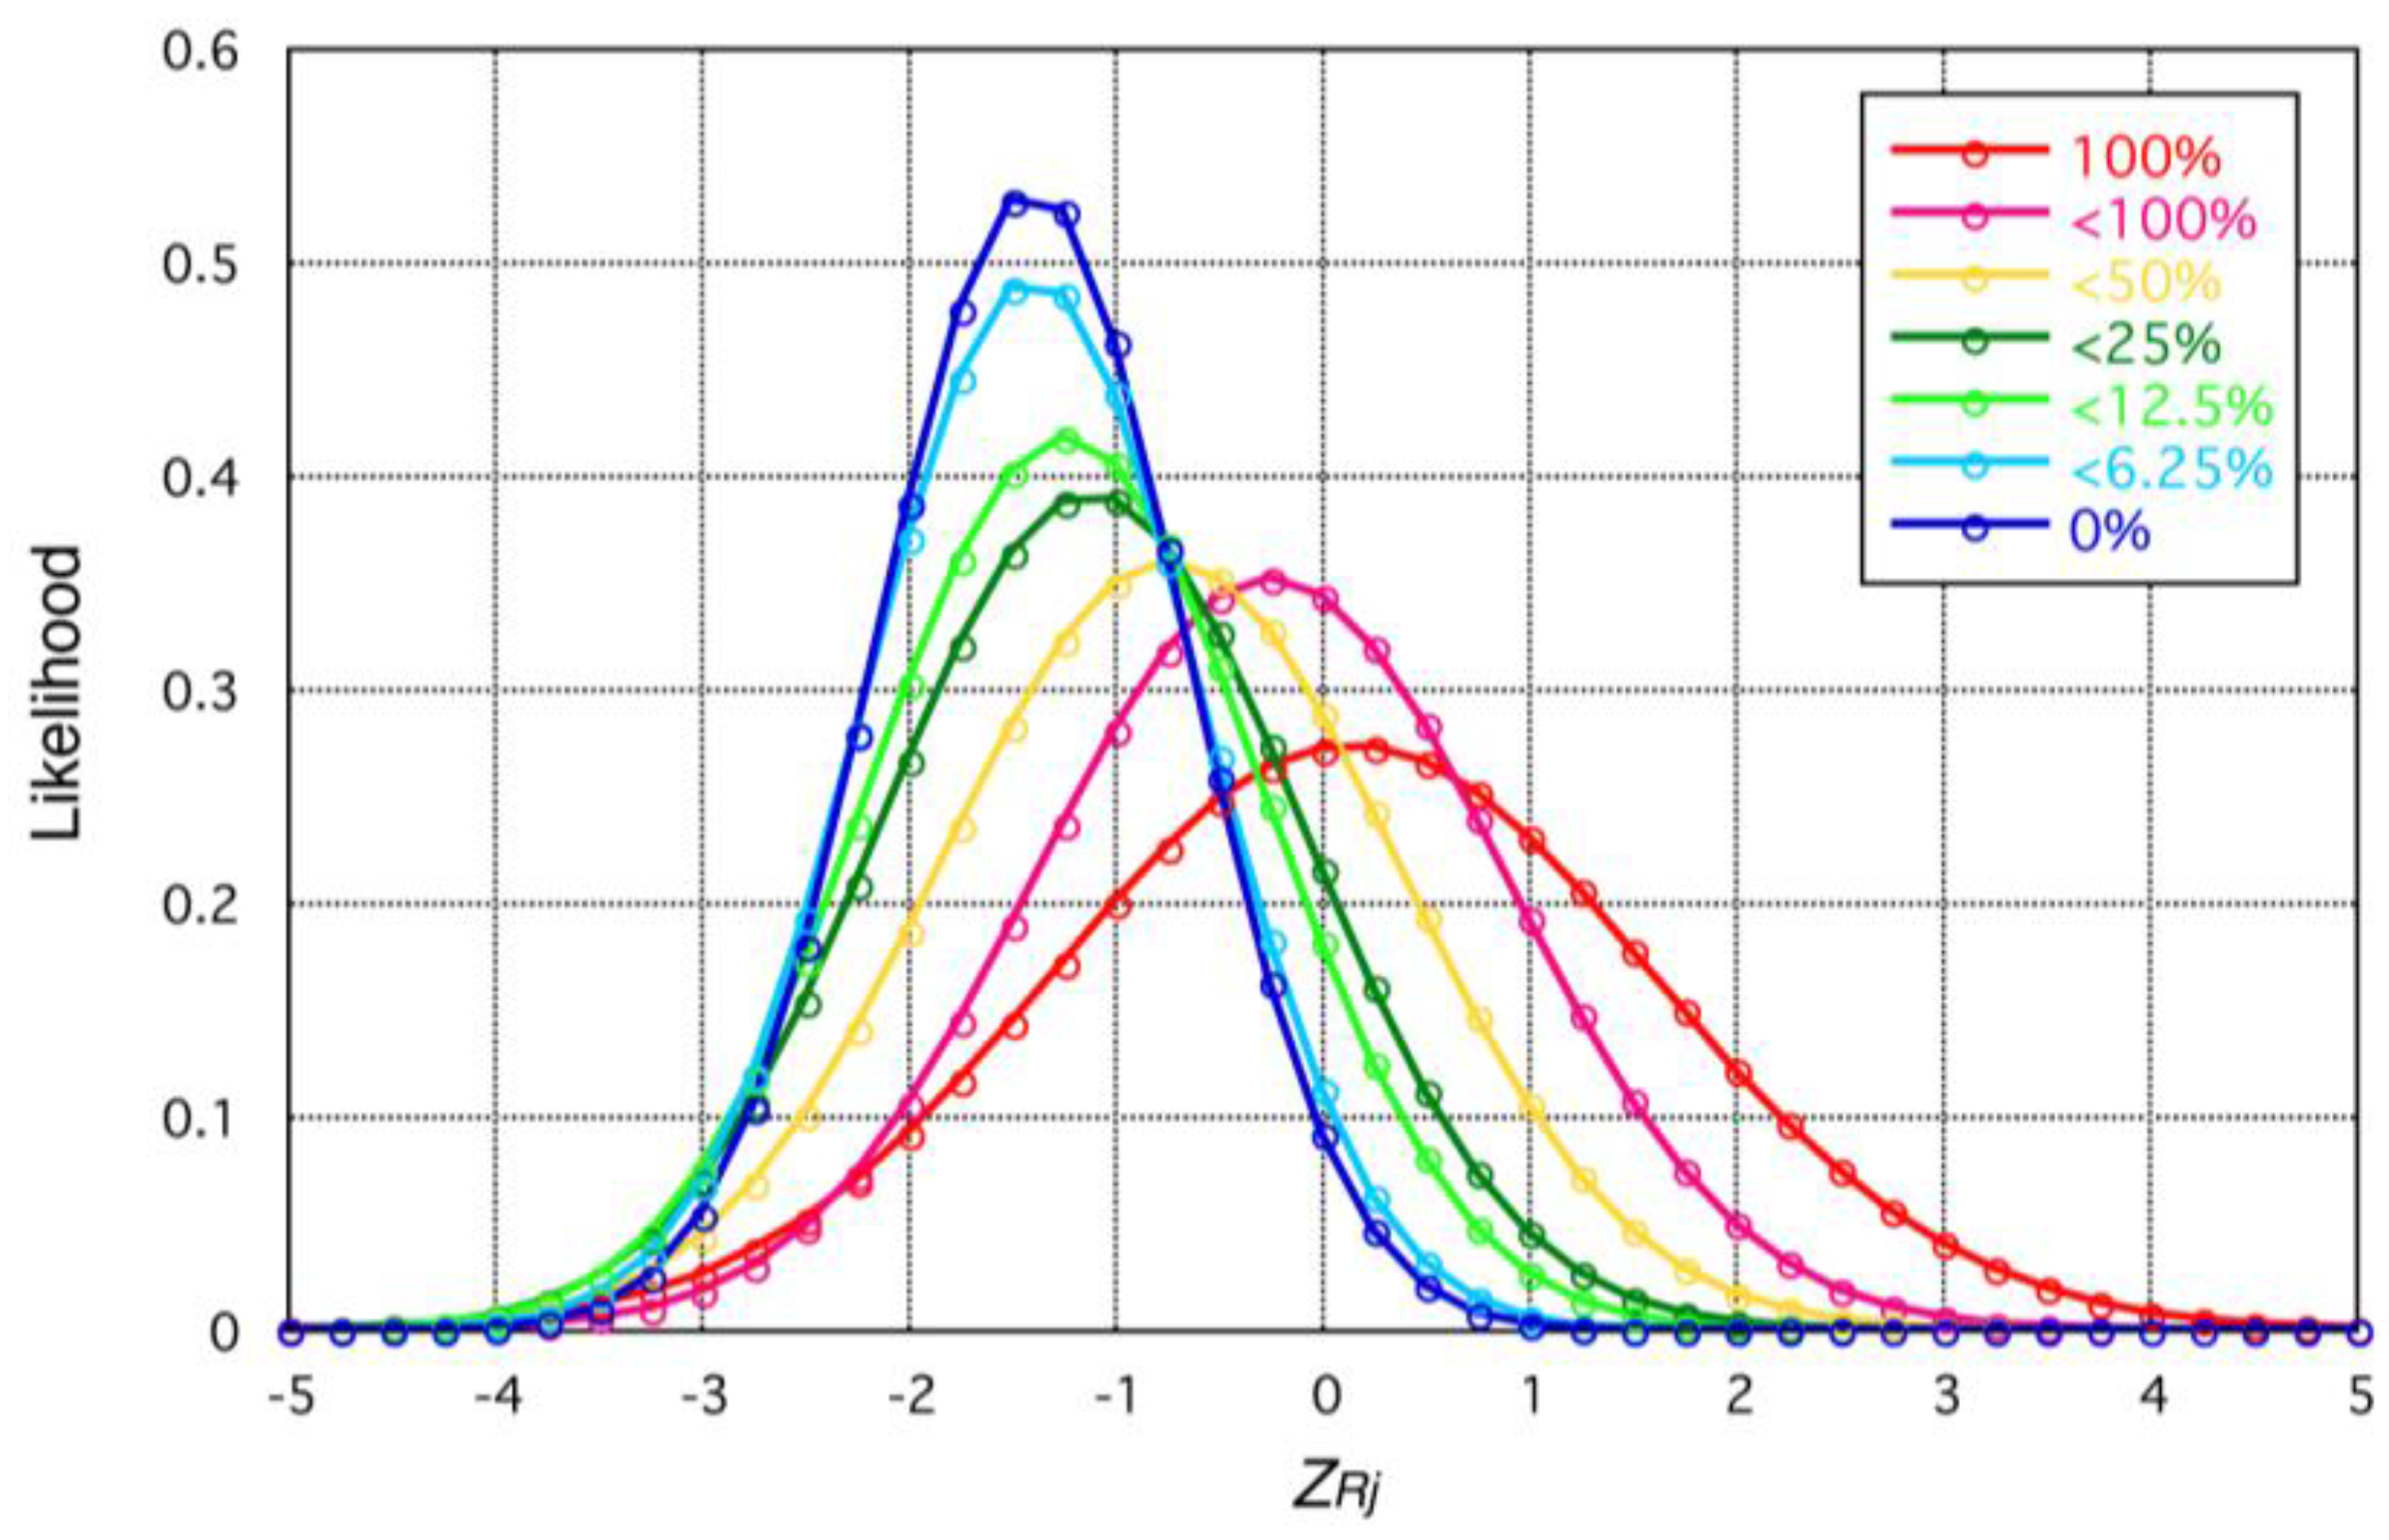
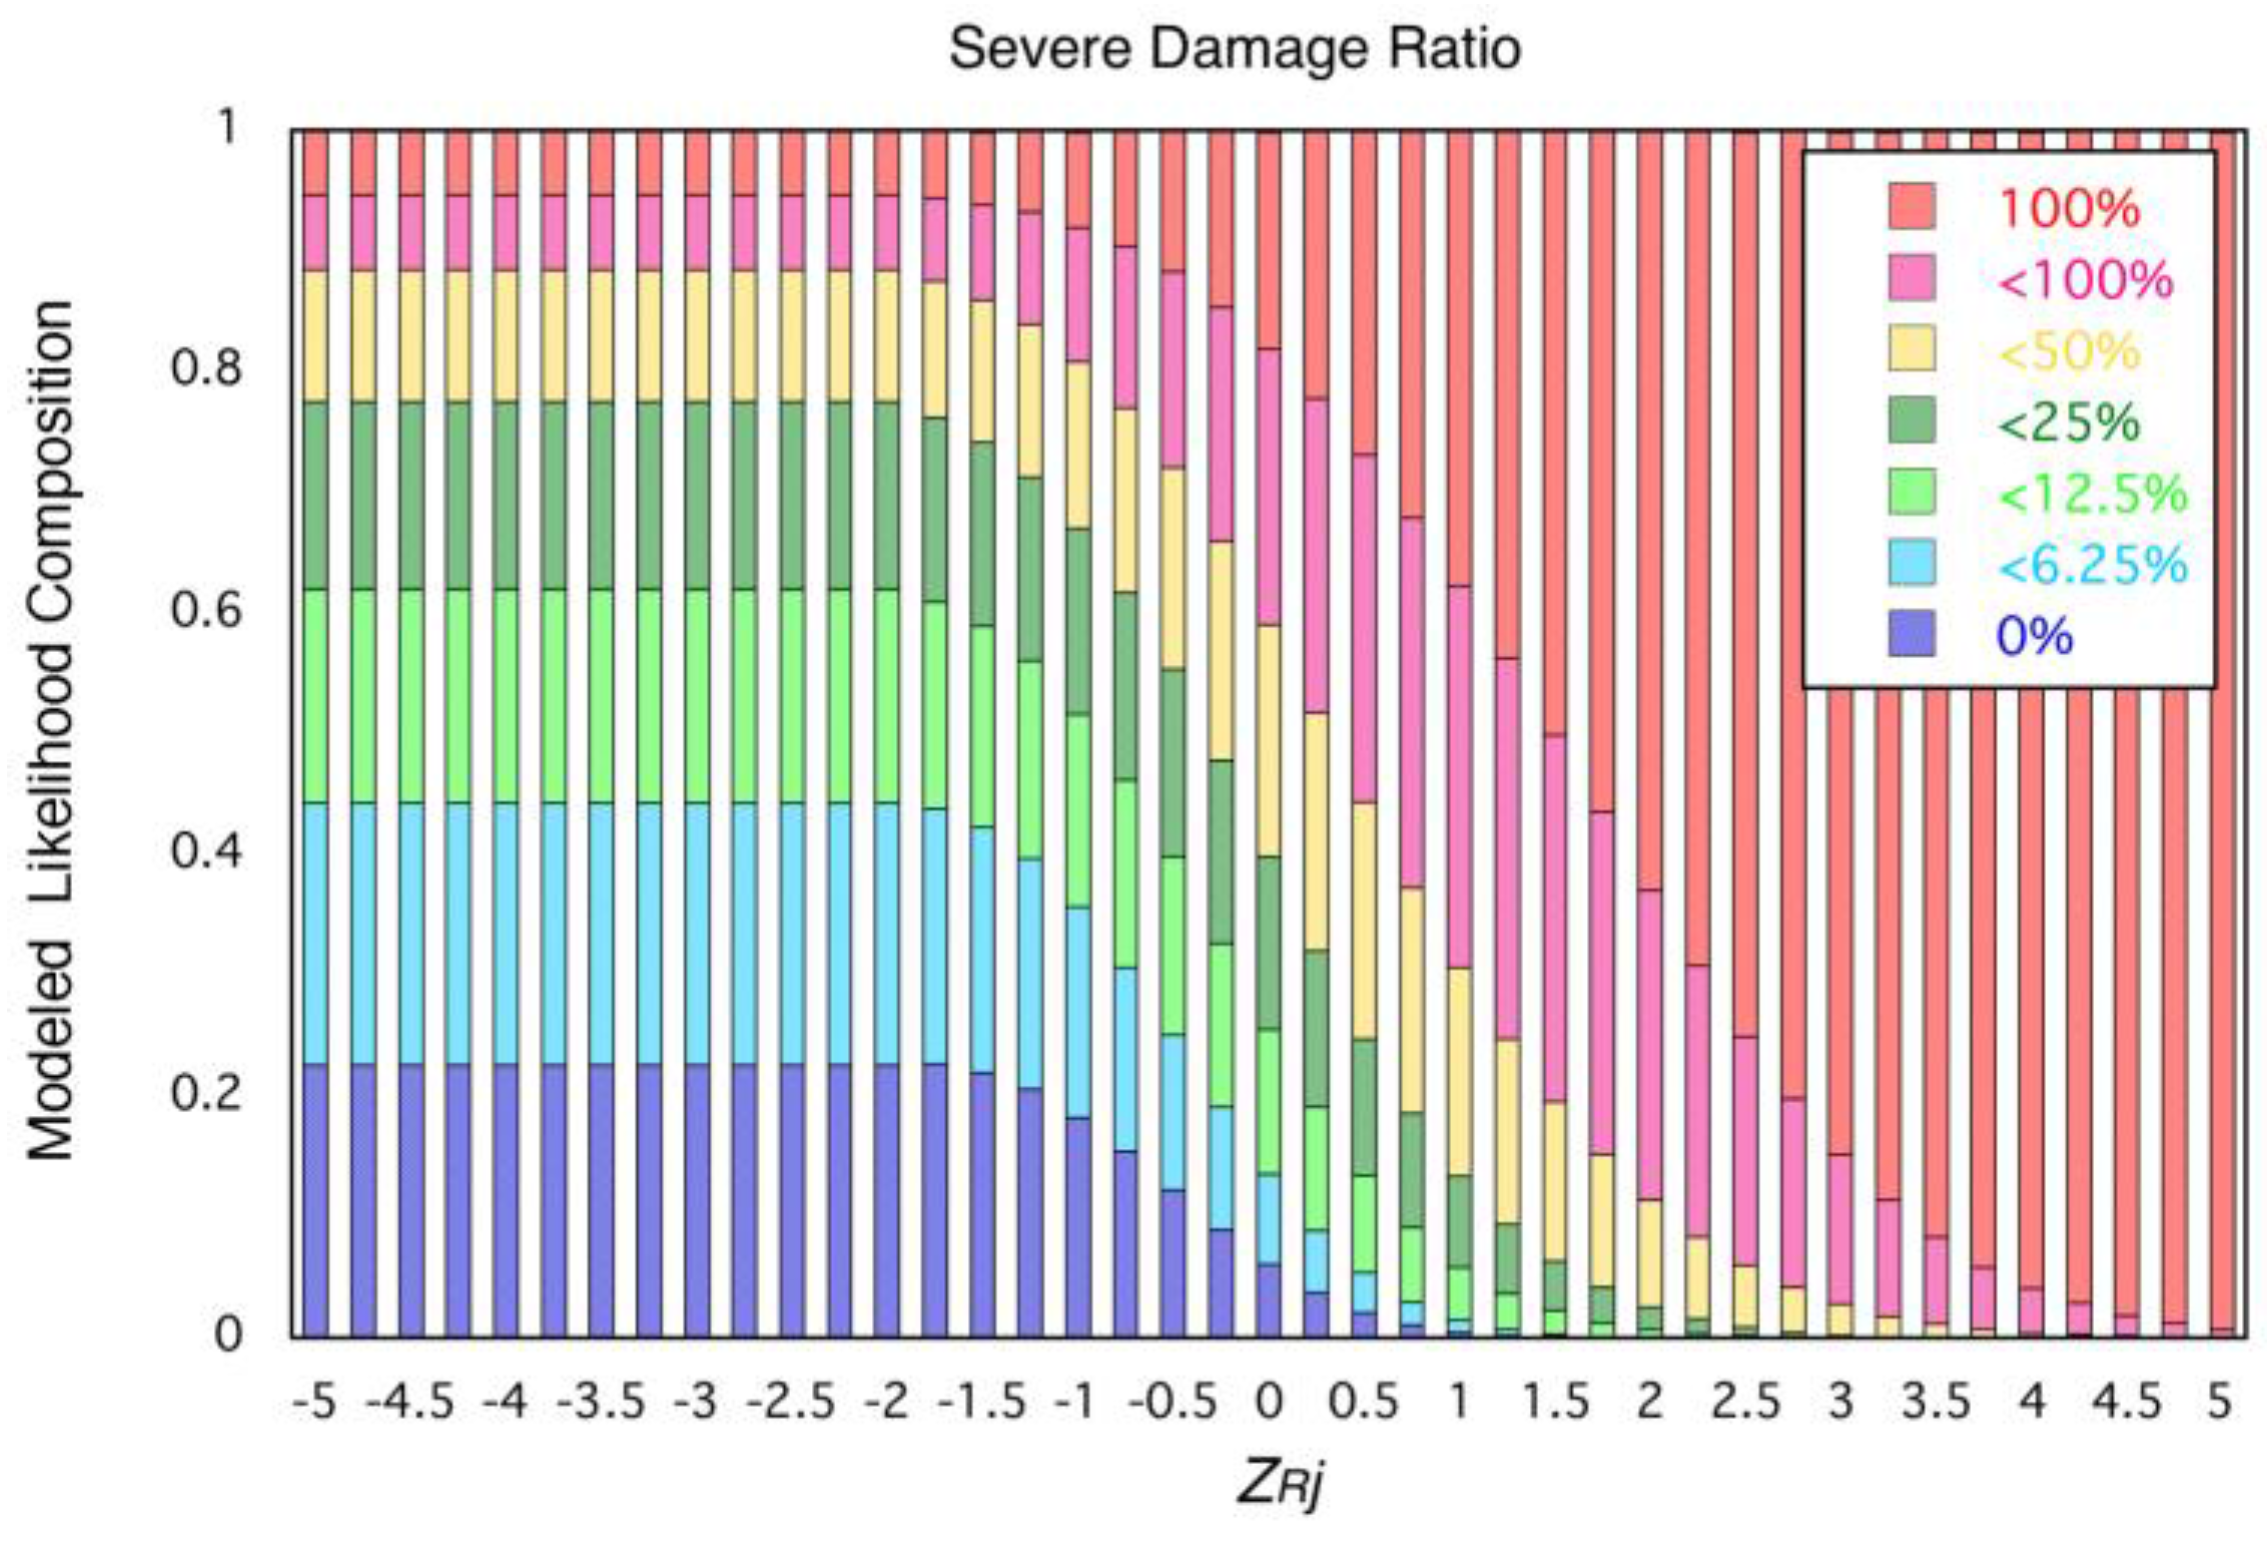
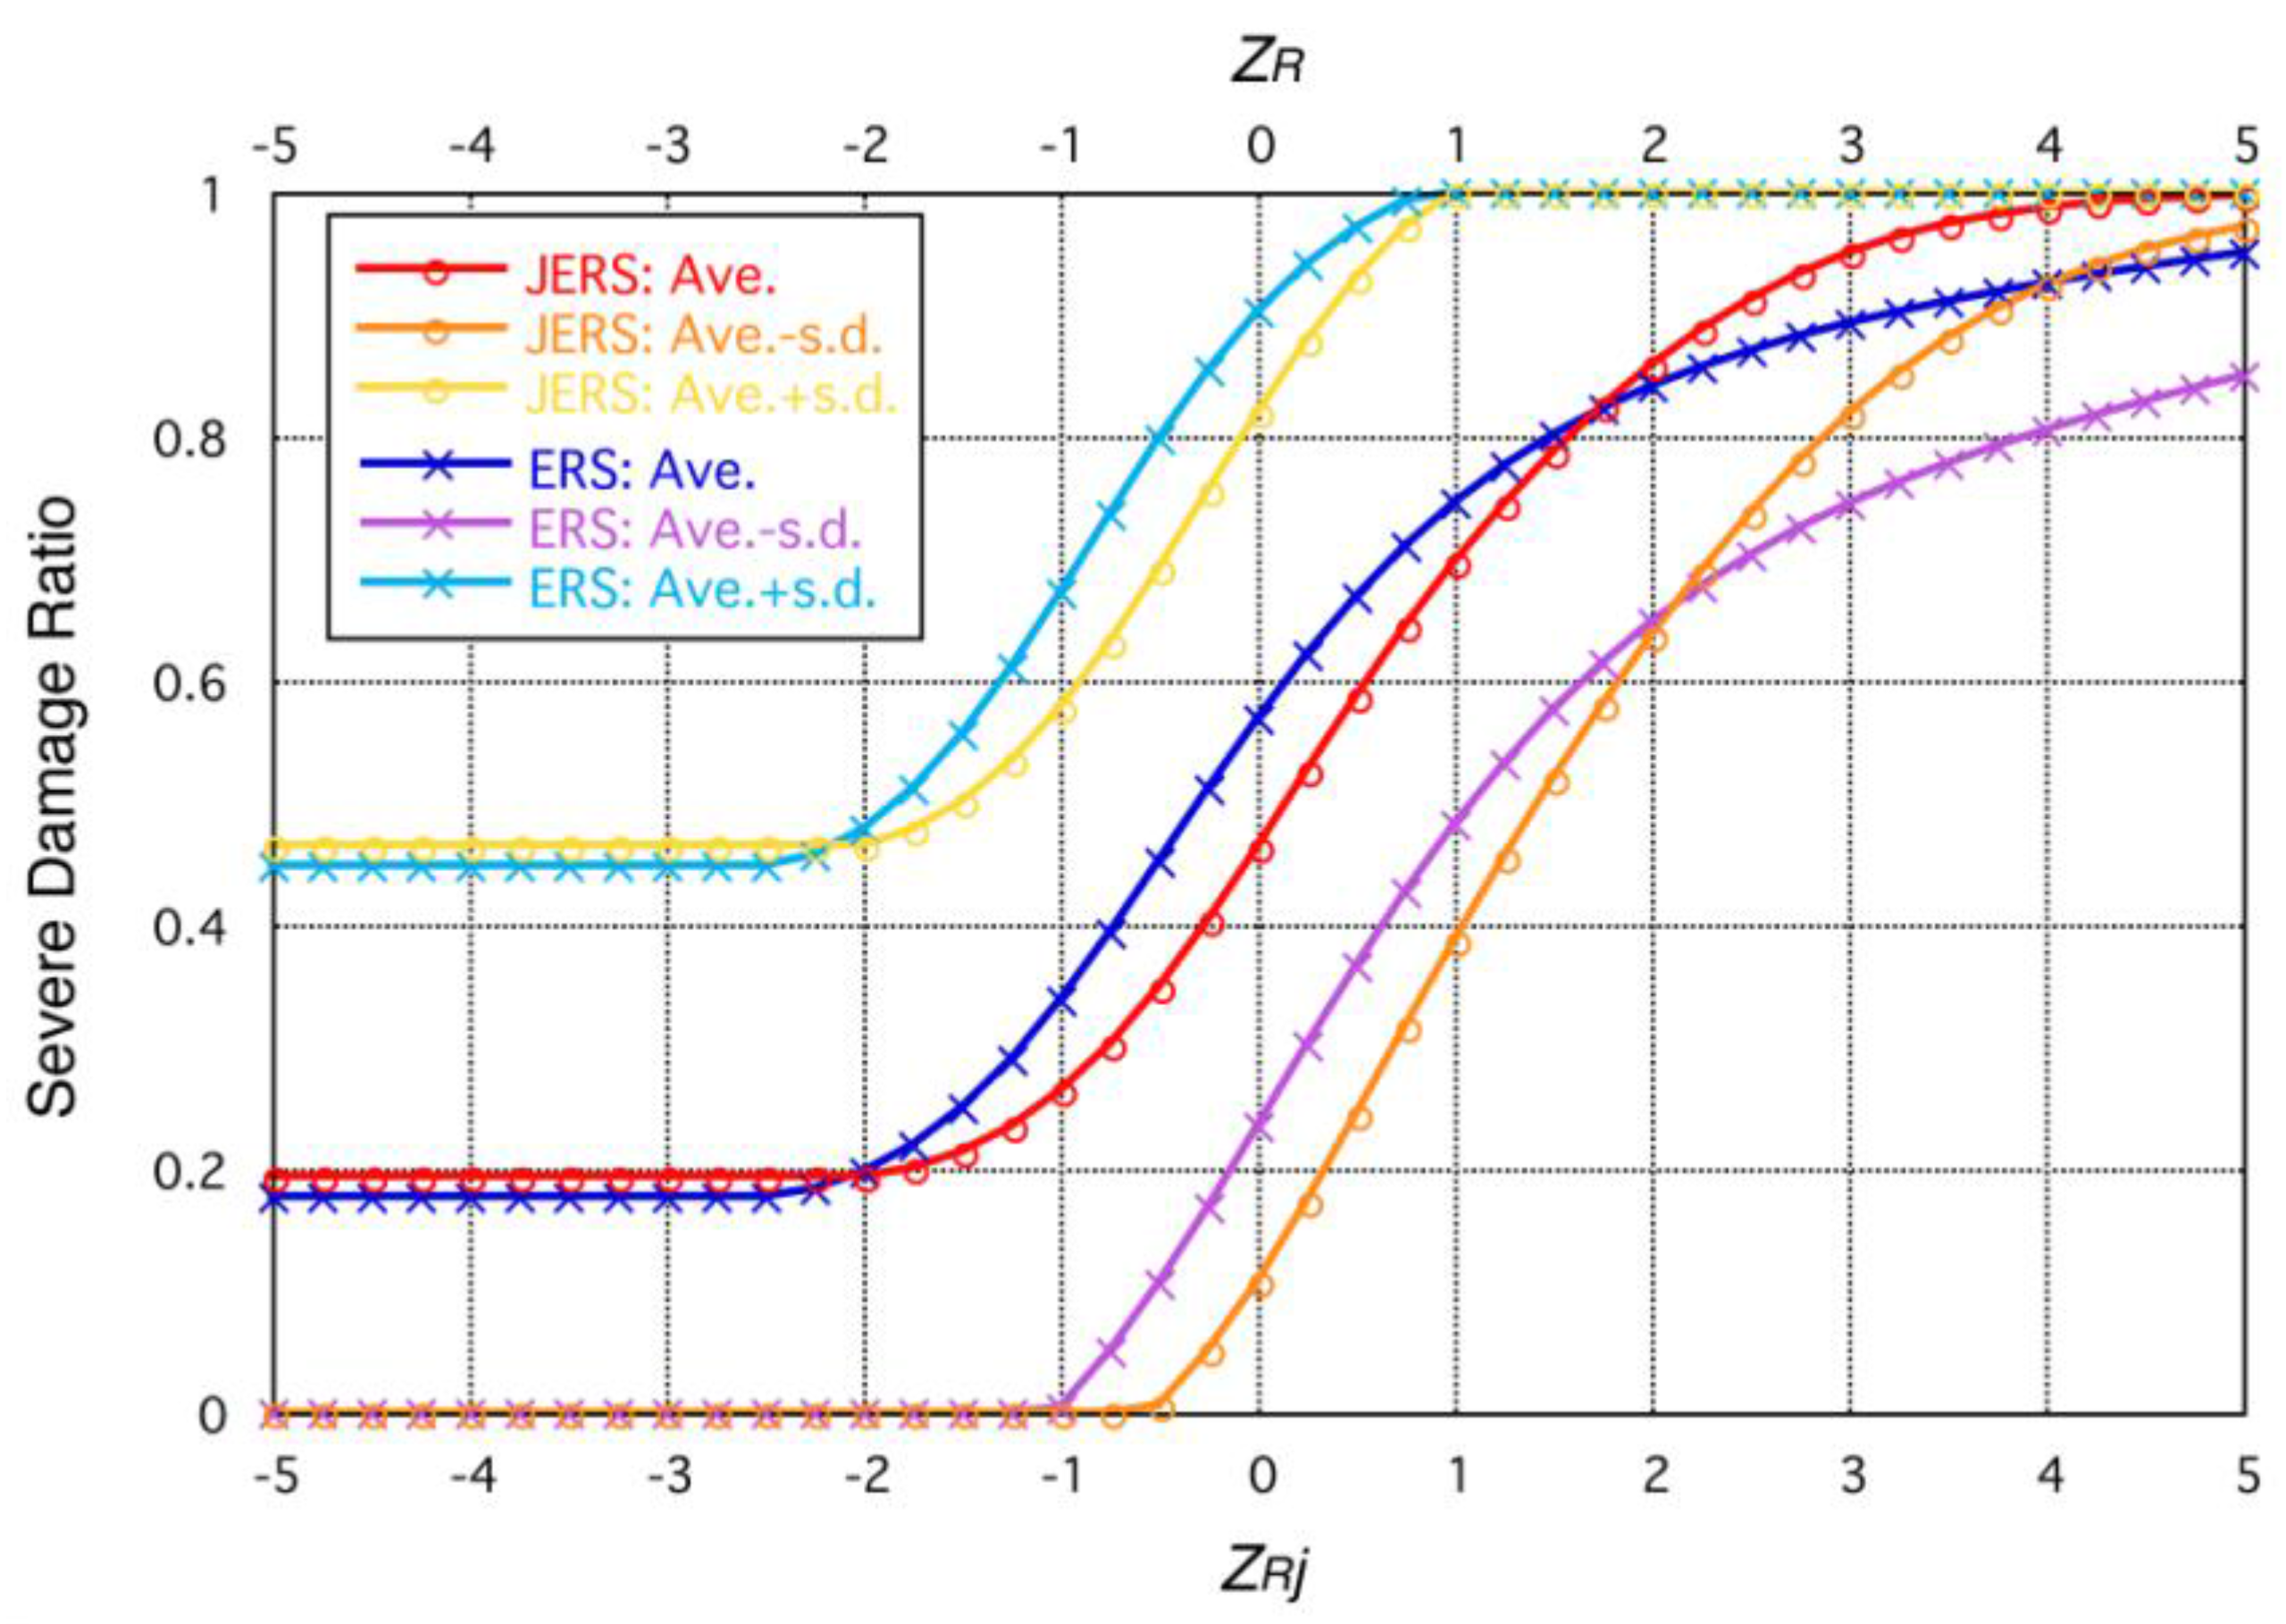
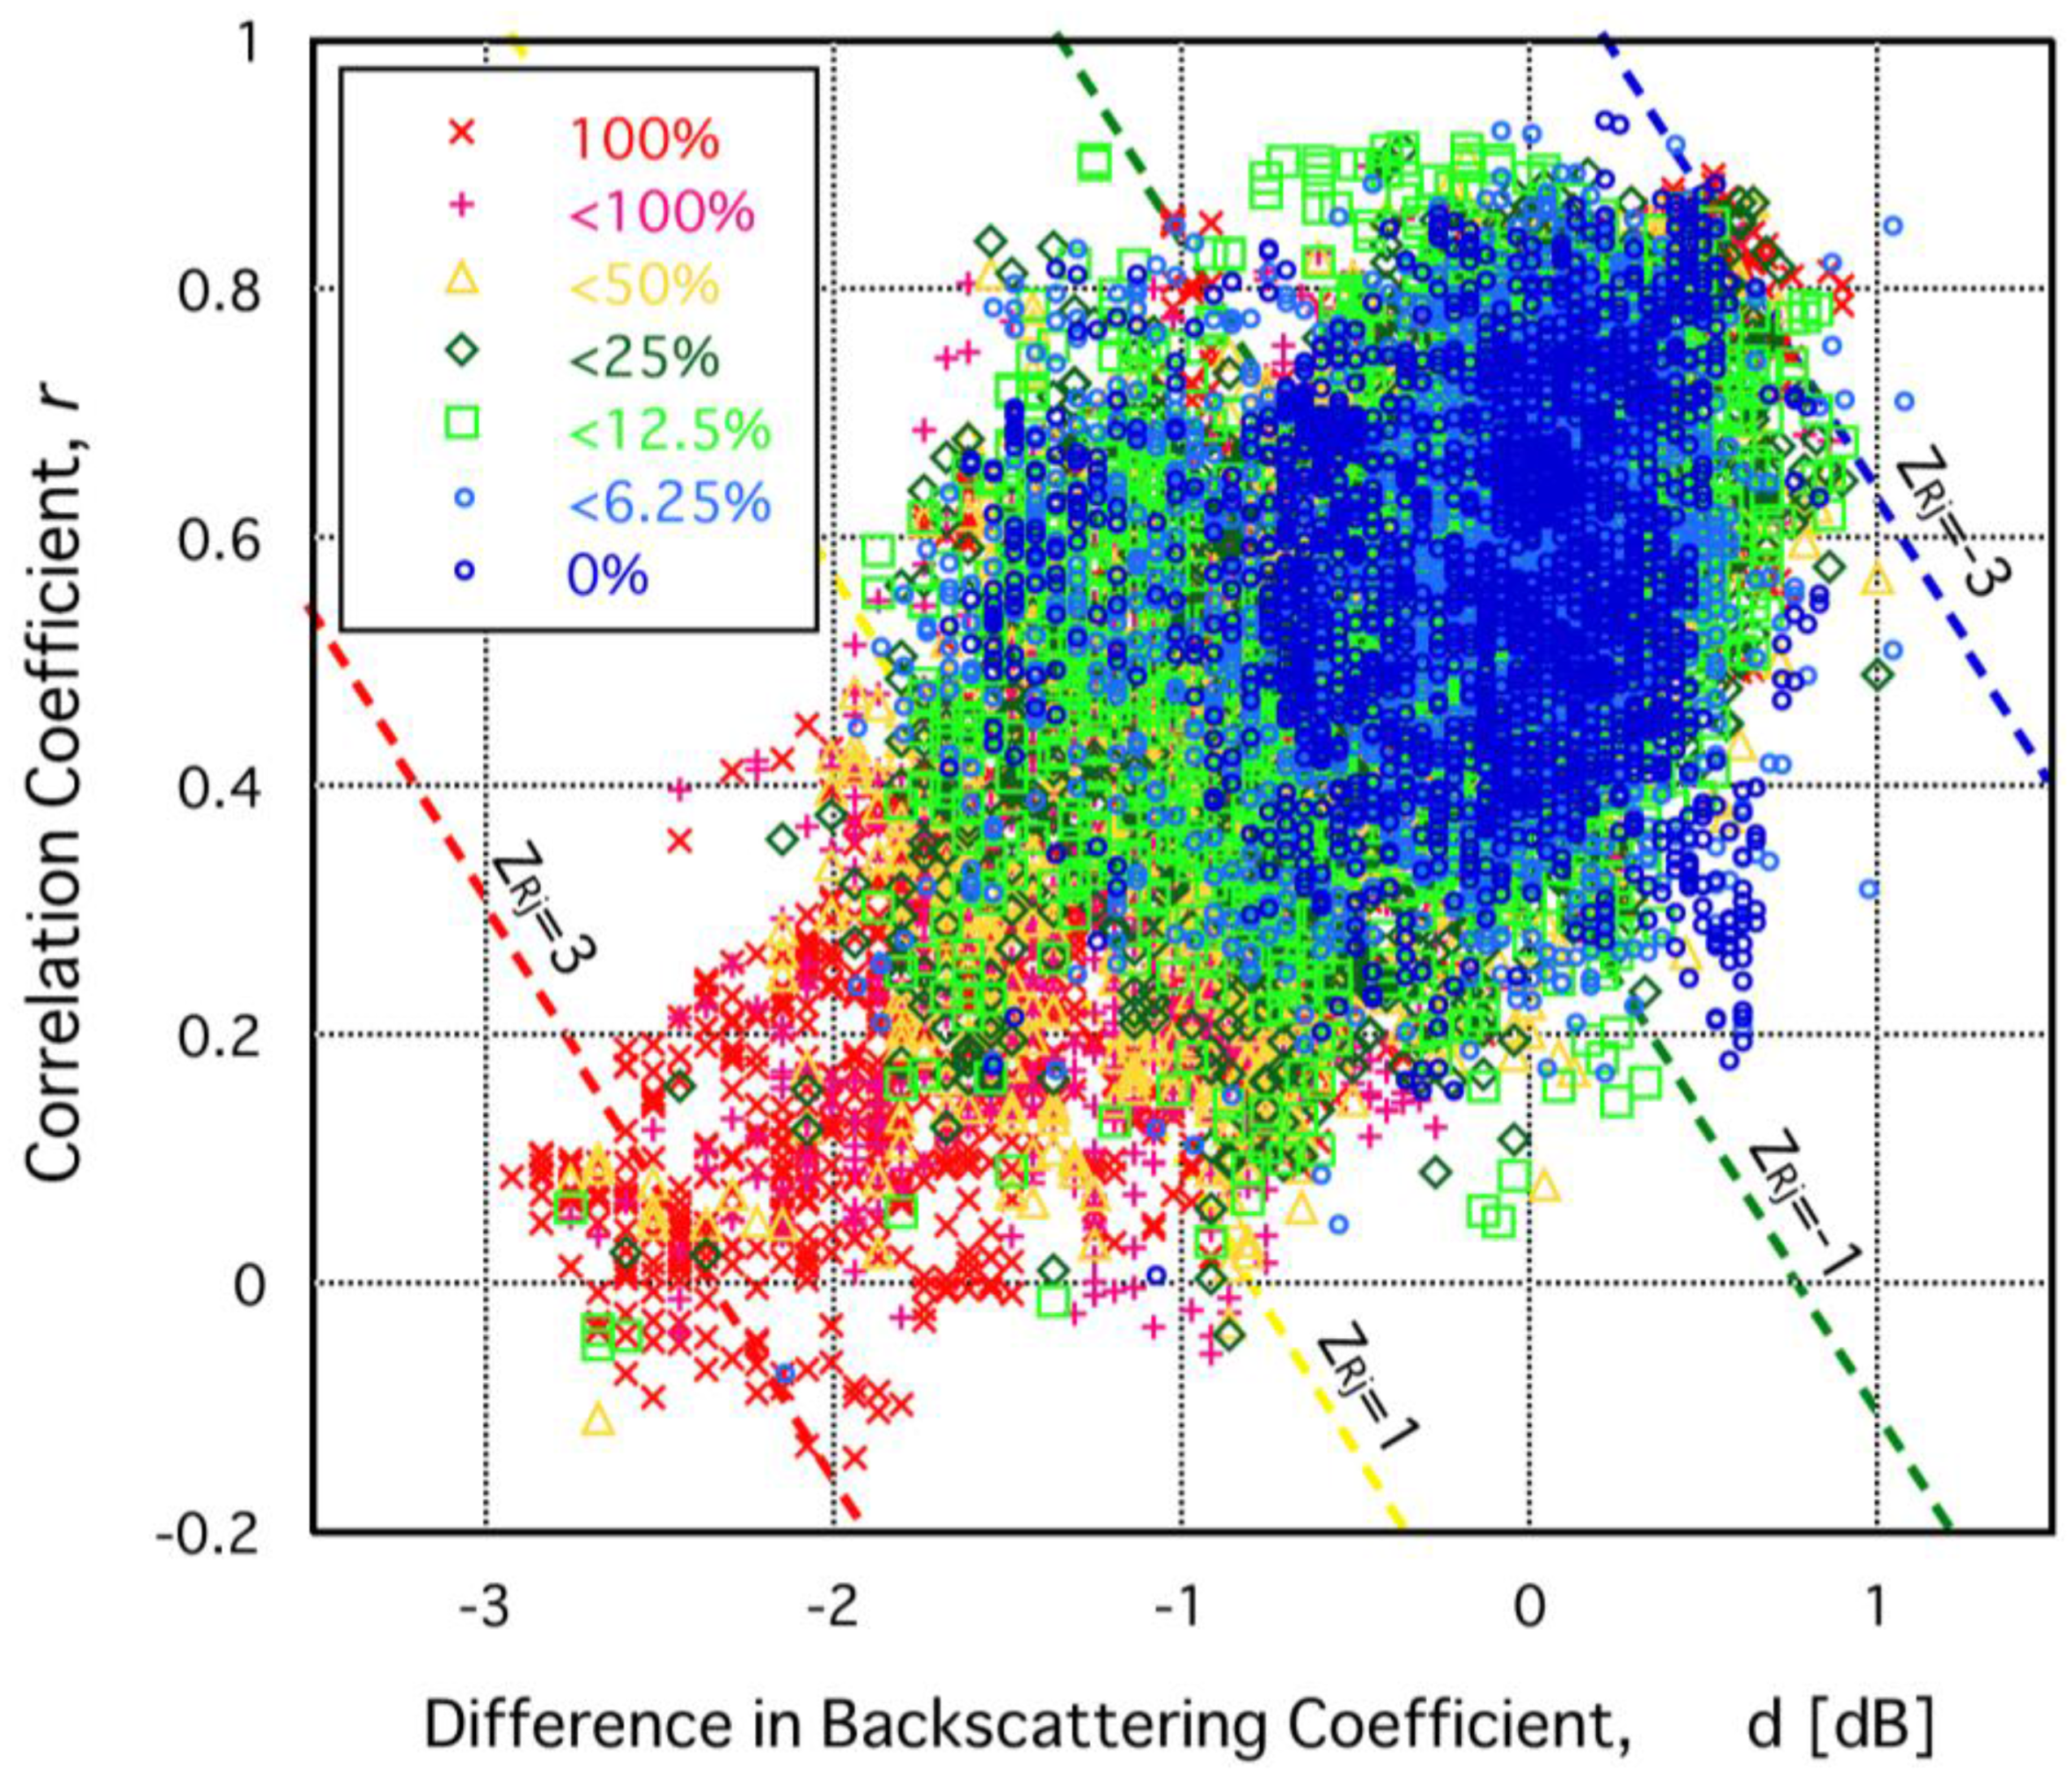
2.2. Derivation of Regression Discriminant Function and Likelihood Function

Following Nojima et al., the regression discriminant function for building damage is calculated from two characteristic values, the correlation coefficient and the difference in backscattering coefficient of pre-event and post-event SAR images [12]. First, following accurate positioning of the two SAR images, a speckle noise filter with a 21 × 21 pixel window [16] is applied to each image. The difference value is calculated by subtracting the average value of the backscattering coefficient within a 13 × 13 pixel window of the pre-event image from the post-event image, and the correlation coefficient is also calculated from the same 13 × 13 pixel window [11].
d = 10 log 10 I ¯ a i 10 log 10 I ¯ b i
r = N i = 1 N I a i I b i i = 1 N I a i i = 1 N I b i ( N i = 1 N I a i 2 ( i = 1 N I a i ) 2 ) ( N i = 1 N I b i 2 ( i = 1 N I b i ) 2 )
Here, d represents the difference in backscattering coefficient [dB], r represents the correlation coefficient, and N represents the number of pixels within the target window. N is 169 because a 13 × 13 pixel window is used. Iai, Ibi represent the i-th pixel values of the post-event and pre-event images respectively, and Īai, Ībi are the average values of 13 × 13 pixels surrounding the i-th pixel.
Then, the images are superposed with the data for building damage, and 2,000 pixels are randomly extracted from areas corresponding to each of the seven damage severity rankings as shown in Table 1 (total of 14,000 pixels) to create a training sample. Figure 2 shows a scatter diagram of d and r for each damage severity ranking. In areas with more severe damage, the difference in backscattering coefficient tends to have a larger absolute value in the negative, and the correlation coefficient tends to be smaller. This is because when microwaves hit undamaged pre-event buildings, multiple reflections between the ground and the building (cardinal effect) result in a large backscatter returning to the satellite; whereas in destroyed buildings and empty plots, microwaves scatter in various directions, reducing the amount which returns to the satellite, resulting in a negative difference. In addition, damage to buildings increases the spatial variation in backscattering of the post-quake image with respect to the pre-quake image, decreasing the correlation coefficient.
Table 1. Range of severe damage ratios and mean values for each damage severity ranking.
Damage RankSevere Damage Ratio D (%)Mid-value (%)
θ1D = 00.0
θ20.0 < D < 6.253.13
θ36.25 ≦ D < 12.59.38
θ412.5 ≦ D < 2518.75
θ525 ≦ D < 5037.5
θ650 ≦ D < 10075.0
θ7D = 100100.0
Figure 2. Scatter diagram of the difference in backscattering coefficients and correlation coefficients for each damage severity ranking.
Remotesensing 02 02111 g002
The result of applying regression discriminant function [17], a method of multiple-group discrimination, using d and r of the seven damage severity rankings, for a quantitative evaluation of the severe damage ratio, is shown in Equation 3.
Z R j = 1.277 d 2.729 r
Here, ZRj represents the discriminant score derived from JERS-1/SAR. Figure 2 also shows discriminant lines calculated by several ZRj values. Figure 3 shows the distribution of ZRj determined from pre-and post-event JERS-1/SAR images. ZRj is fairly large in an area extending in a northeasterly direction from Nagata Ward, Kobe. It should be noted that the target area is restricted to urban areas where the cardinal effect can be expected; therefore, areas whose pre-event backscattering coefficient is small (under −7 dB) are masked.
Figure 3. Distribution of discriminant score ZRj obtained from JERS-1/SAR.
Remotesensing 02 02111 g003
Next, the likelihood function for estimating the severe damage ratio from the discriminant score ZRj is created. Figure 4 shows the frequency distribution of ZRj for 2,000 pixels for each damage severity ranking, modeled using normal distribution. Table 2 shows the average values and standard deviations of ZRj for each damage severity ranking. The discriminant score ZRj is larger with higher damage severity ranking. However, similar to the case of ERS-1/SAR, the distribution curves cross, for some damage severity rankings, in regions with small discriminant scores; therefore, there is a limit to the abilities of the discriminant analysis in areas with a low damage severity ranking. Figure 5 shows modeled likelihood functions. For the region where ZRj is under −2.0, a constant value obtained by extrapolating the value at ZRj = −2.0 is used in order to avoid a reversal of sequence of the severe damage ratio caused by the distribution curves crossing. The average values and standard deviations of the estimated severe damage ratio against the discriminant score ZRj can be obtained from the central values of the damage severity rankings in Table 1, Table 2, and the distribution shown in Figure 5. Figure 6 shows the curves for the average values and the average values ± standard deviation of the severe damage ratio estimated from ZRj. This curve is equivalent to the fragility function for damage without seismic intensity information, and the severe damage ratio increases with increasing ZRj. When ZRj < −2.0, the distributions overlap as shown on Figure 4 and Figure 5, and contain an amount of information (average severe damage ratio of 19.4% and standard deviation of 27.1%) which is only marginally more in comparison to complete non-information (average severe damage ratio of 34.8% and standard deviation of 35.8% at an equal probability of 1/7 for each damage severity ranking). Therefore, seismic intensity information is used as supplementary information for a highly accurate estimation which includes regions of low severe damage ratio.
Figure 4. Normal distribution model of discriminant score ZRj frequency distribution.
Remotesensing 02 02111 g004
Table 2. Average values and standard deviations of likelihood function of SAR intensity image information.
Damage RankAverage of ZRjStandard Deviation
θ1−1.3990.747
θ2−1.3900.809
θ3−1.2330.955
θ4−1.1101.018
θ5−0.7331.107
θ6−0.2411.134
θ70.1511.457
Figure 5. Modeled likelihood functions by discriminant score ZRj.
Remotesensing 02 02111 g005
Figure 6. Relationship between the discriminant scores ZRj (JERS) and ZR (ERS), and the severe damage ratio (average values and standard deviations).
Remotesensing 02 02111 g006

3. Damage Ratio Estimation by Integration with Seismic Intensity Information

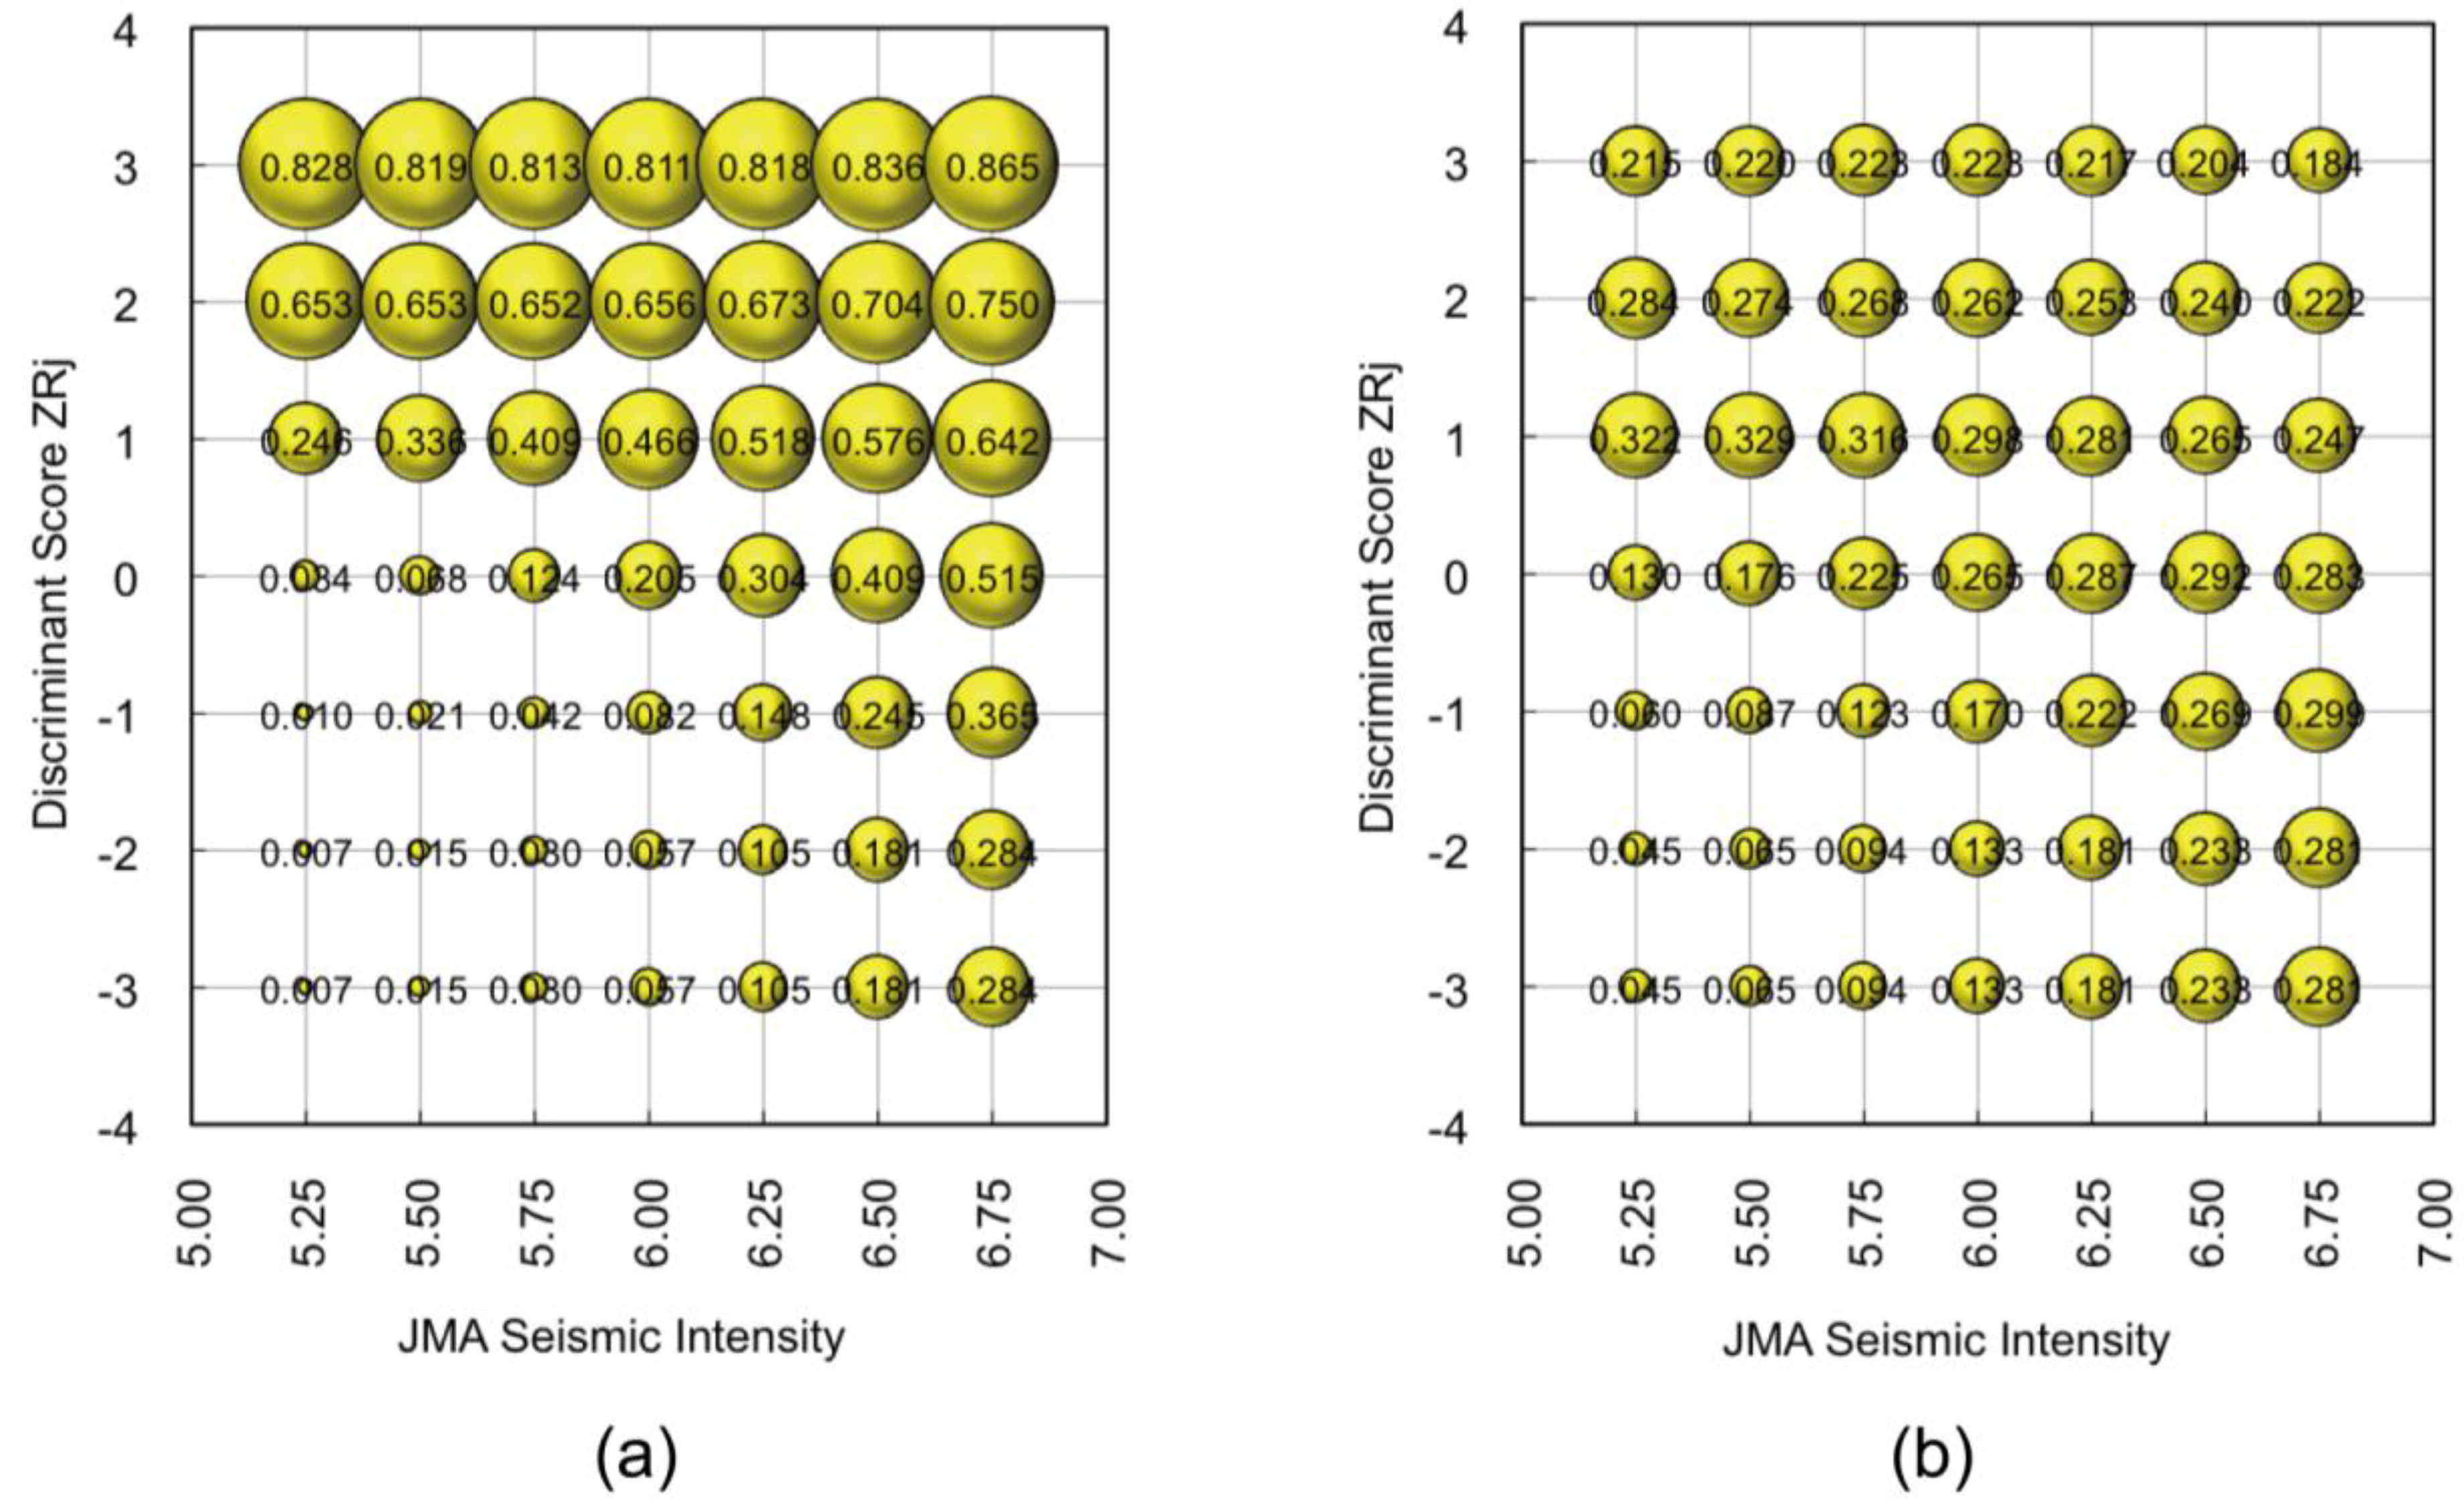
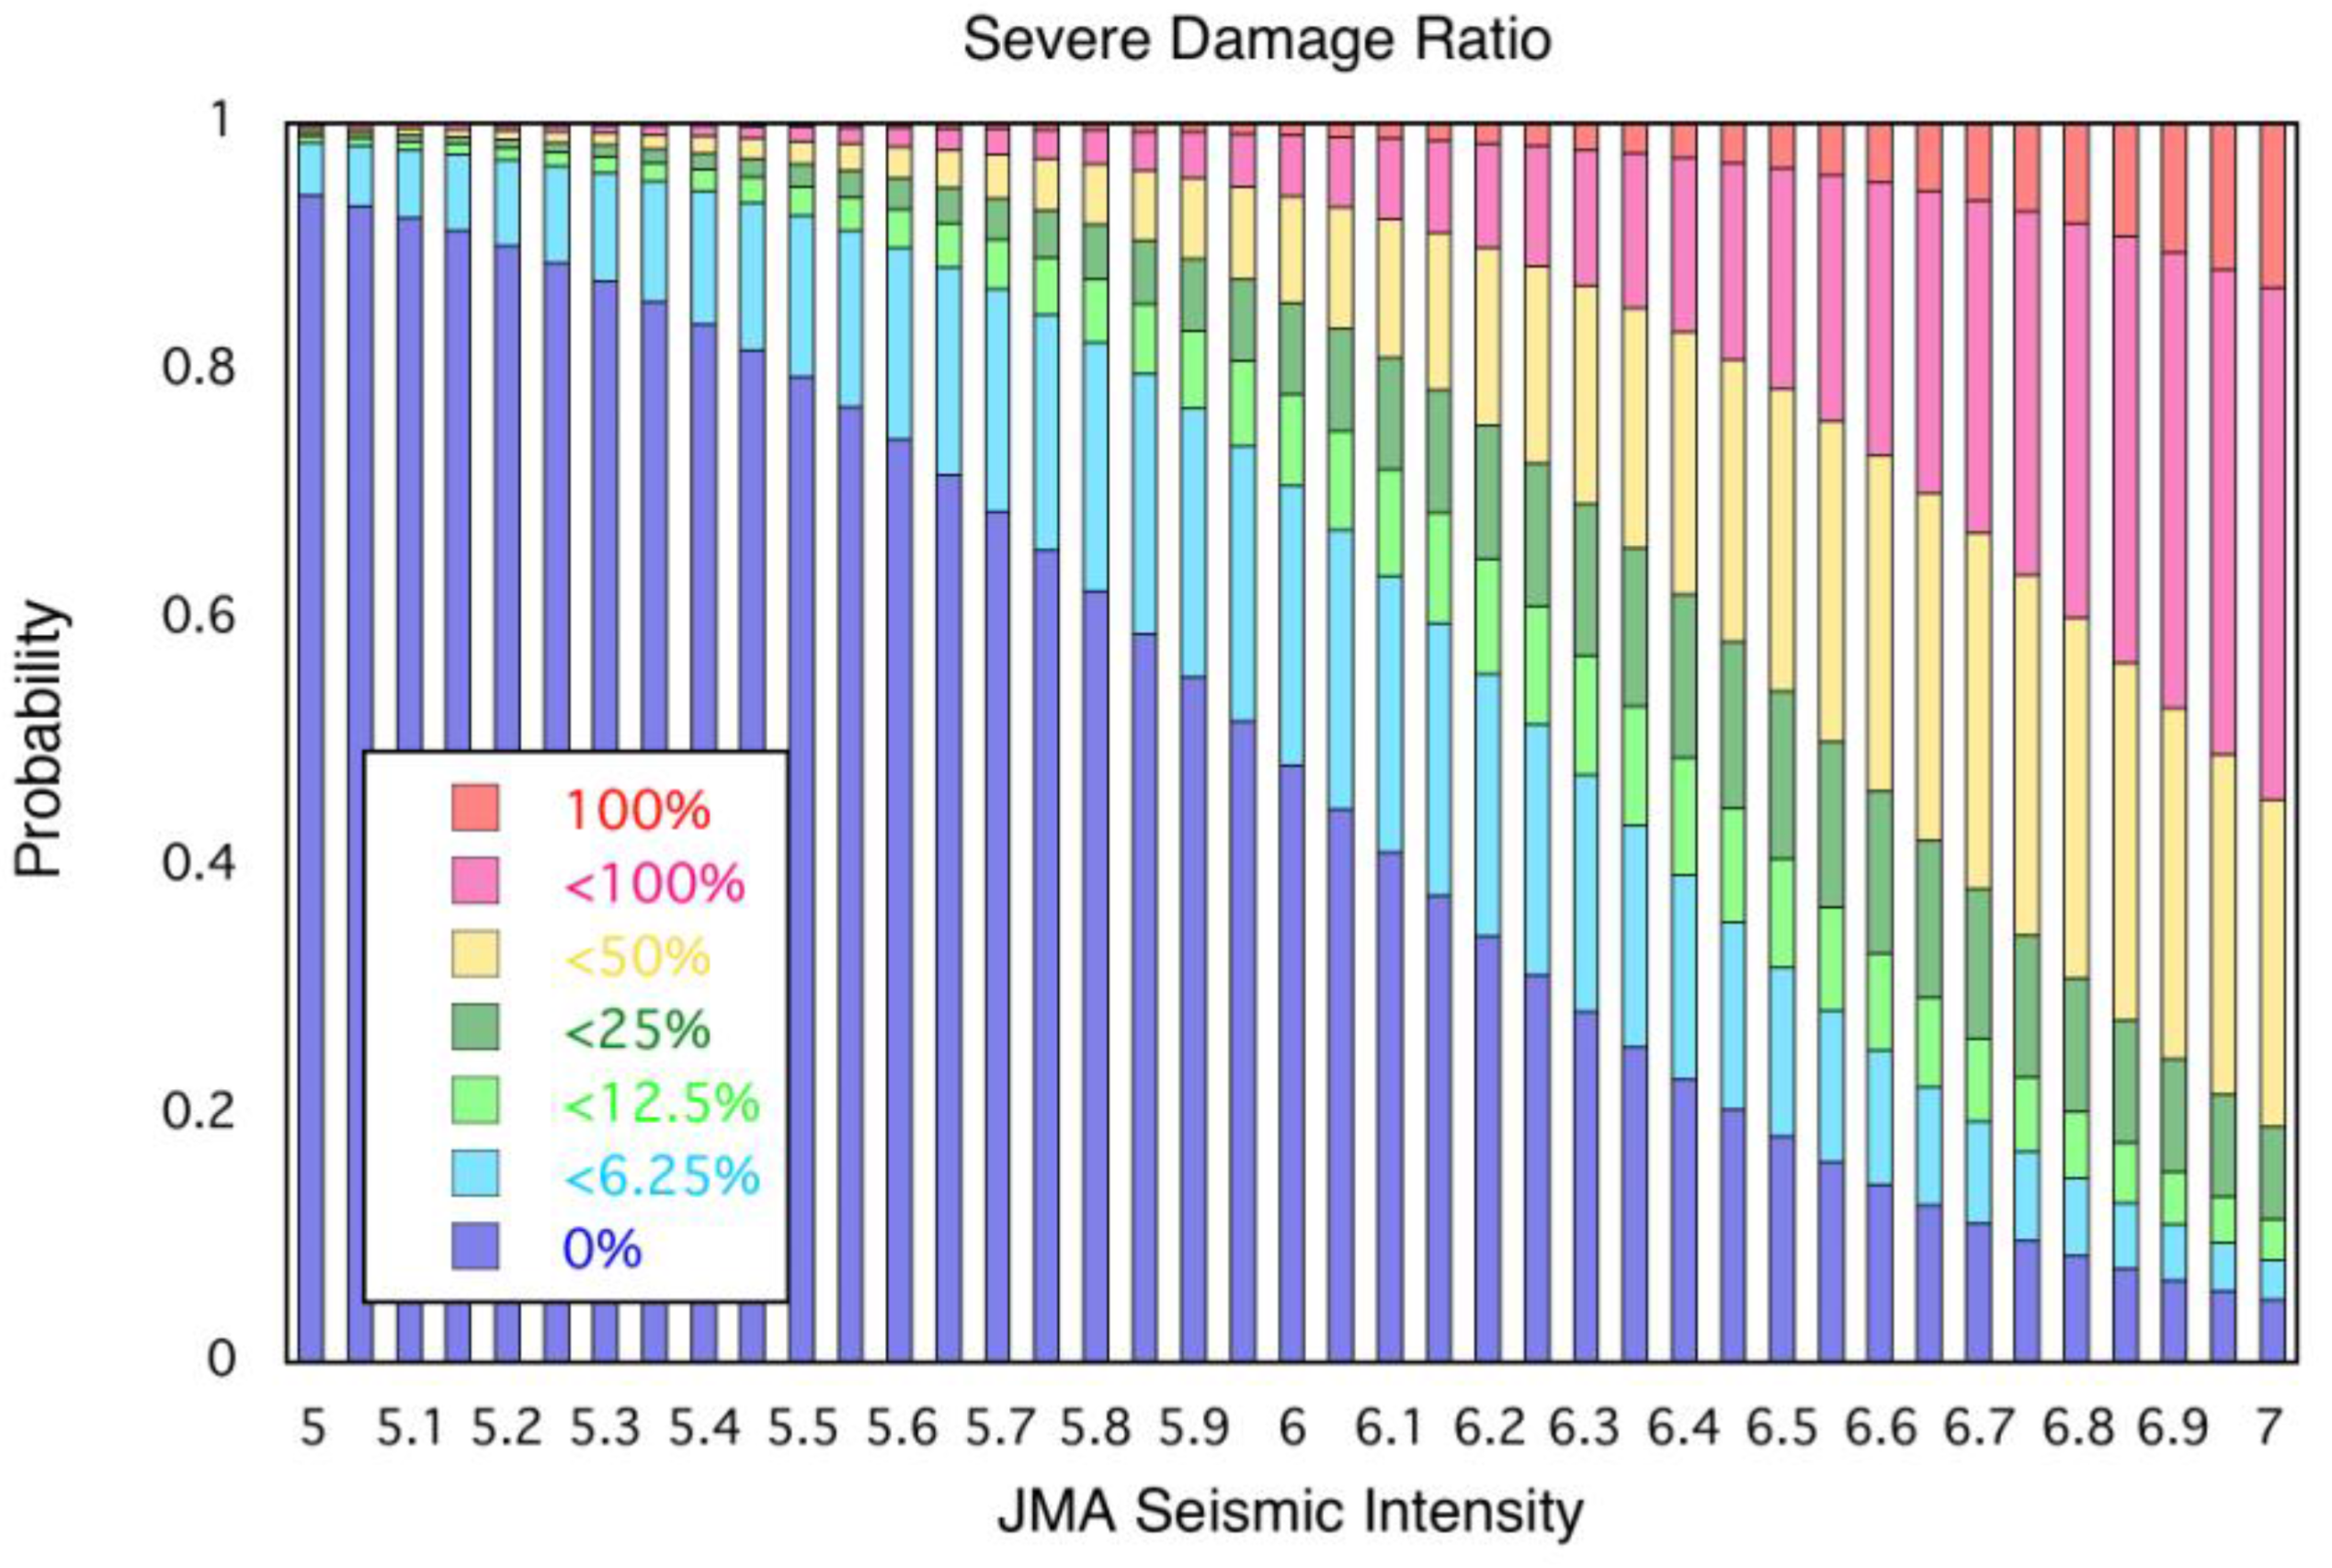
3.1. Integration of SAR Images and Seismic Intensity Information

Already, the fragility function of damage rank in terms of JMA-scale seismic intensity information (Figure 7) and the relationship between seismic intensity and average and standard values of severe damage ratio (Figure 8) have been created [12]. The average value is red color and the values of its plus and minus standard deviation are shown in dark and light yellow colors, respectively.
Figure 7. Fragility function derived from the Kobe earthquake dataset [12].
Remotesensing 02 02111 g007
Figure 8. Relationship between seismic intensity and severe damage ratio (average value [red], with plus and minus standard deviations [dark and light yellow]) [12]. The modified curves (average [green], with plus and minus standard deviations [dark and light blue]) are also shown for the Peru earthquake case.
Remotesensing 02 02111 g008
Using Bayesian updating theory, we can calculate posterior probability from the modeled likelihood function of ZRj (see Figure 5) and the fragility function of seismic intensity (see Figure 7) for each damage rank, by following the procedure developed by Nojima et al. [12]. Figure 9(a,b), respectively, shows the average values and the standard deviations of the severe damage ratio after probability updates for the 49 combinations of the two indices as examples.
Figure 9. Estimated severe damage ratio from integration of SAR information and seismic intensity information. (a) Average values. (b) Standard deviations.
Remotesensing 02 02111 g009

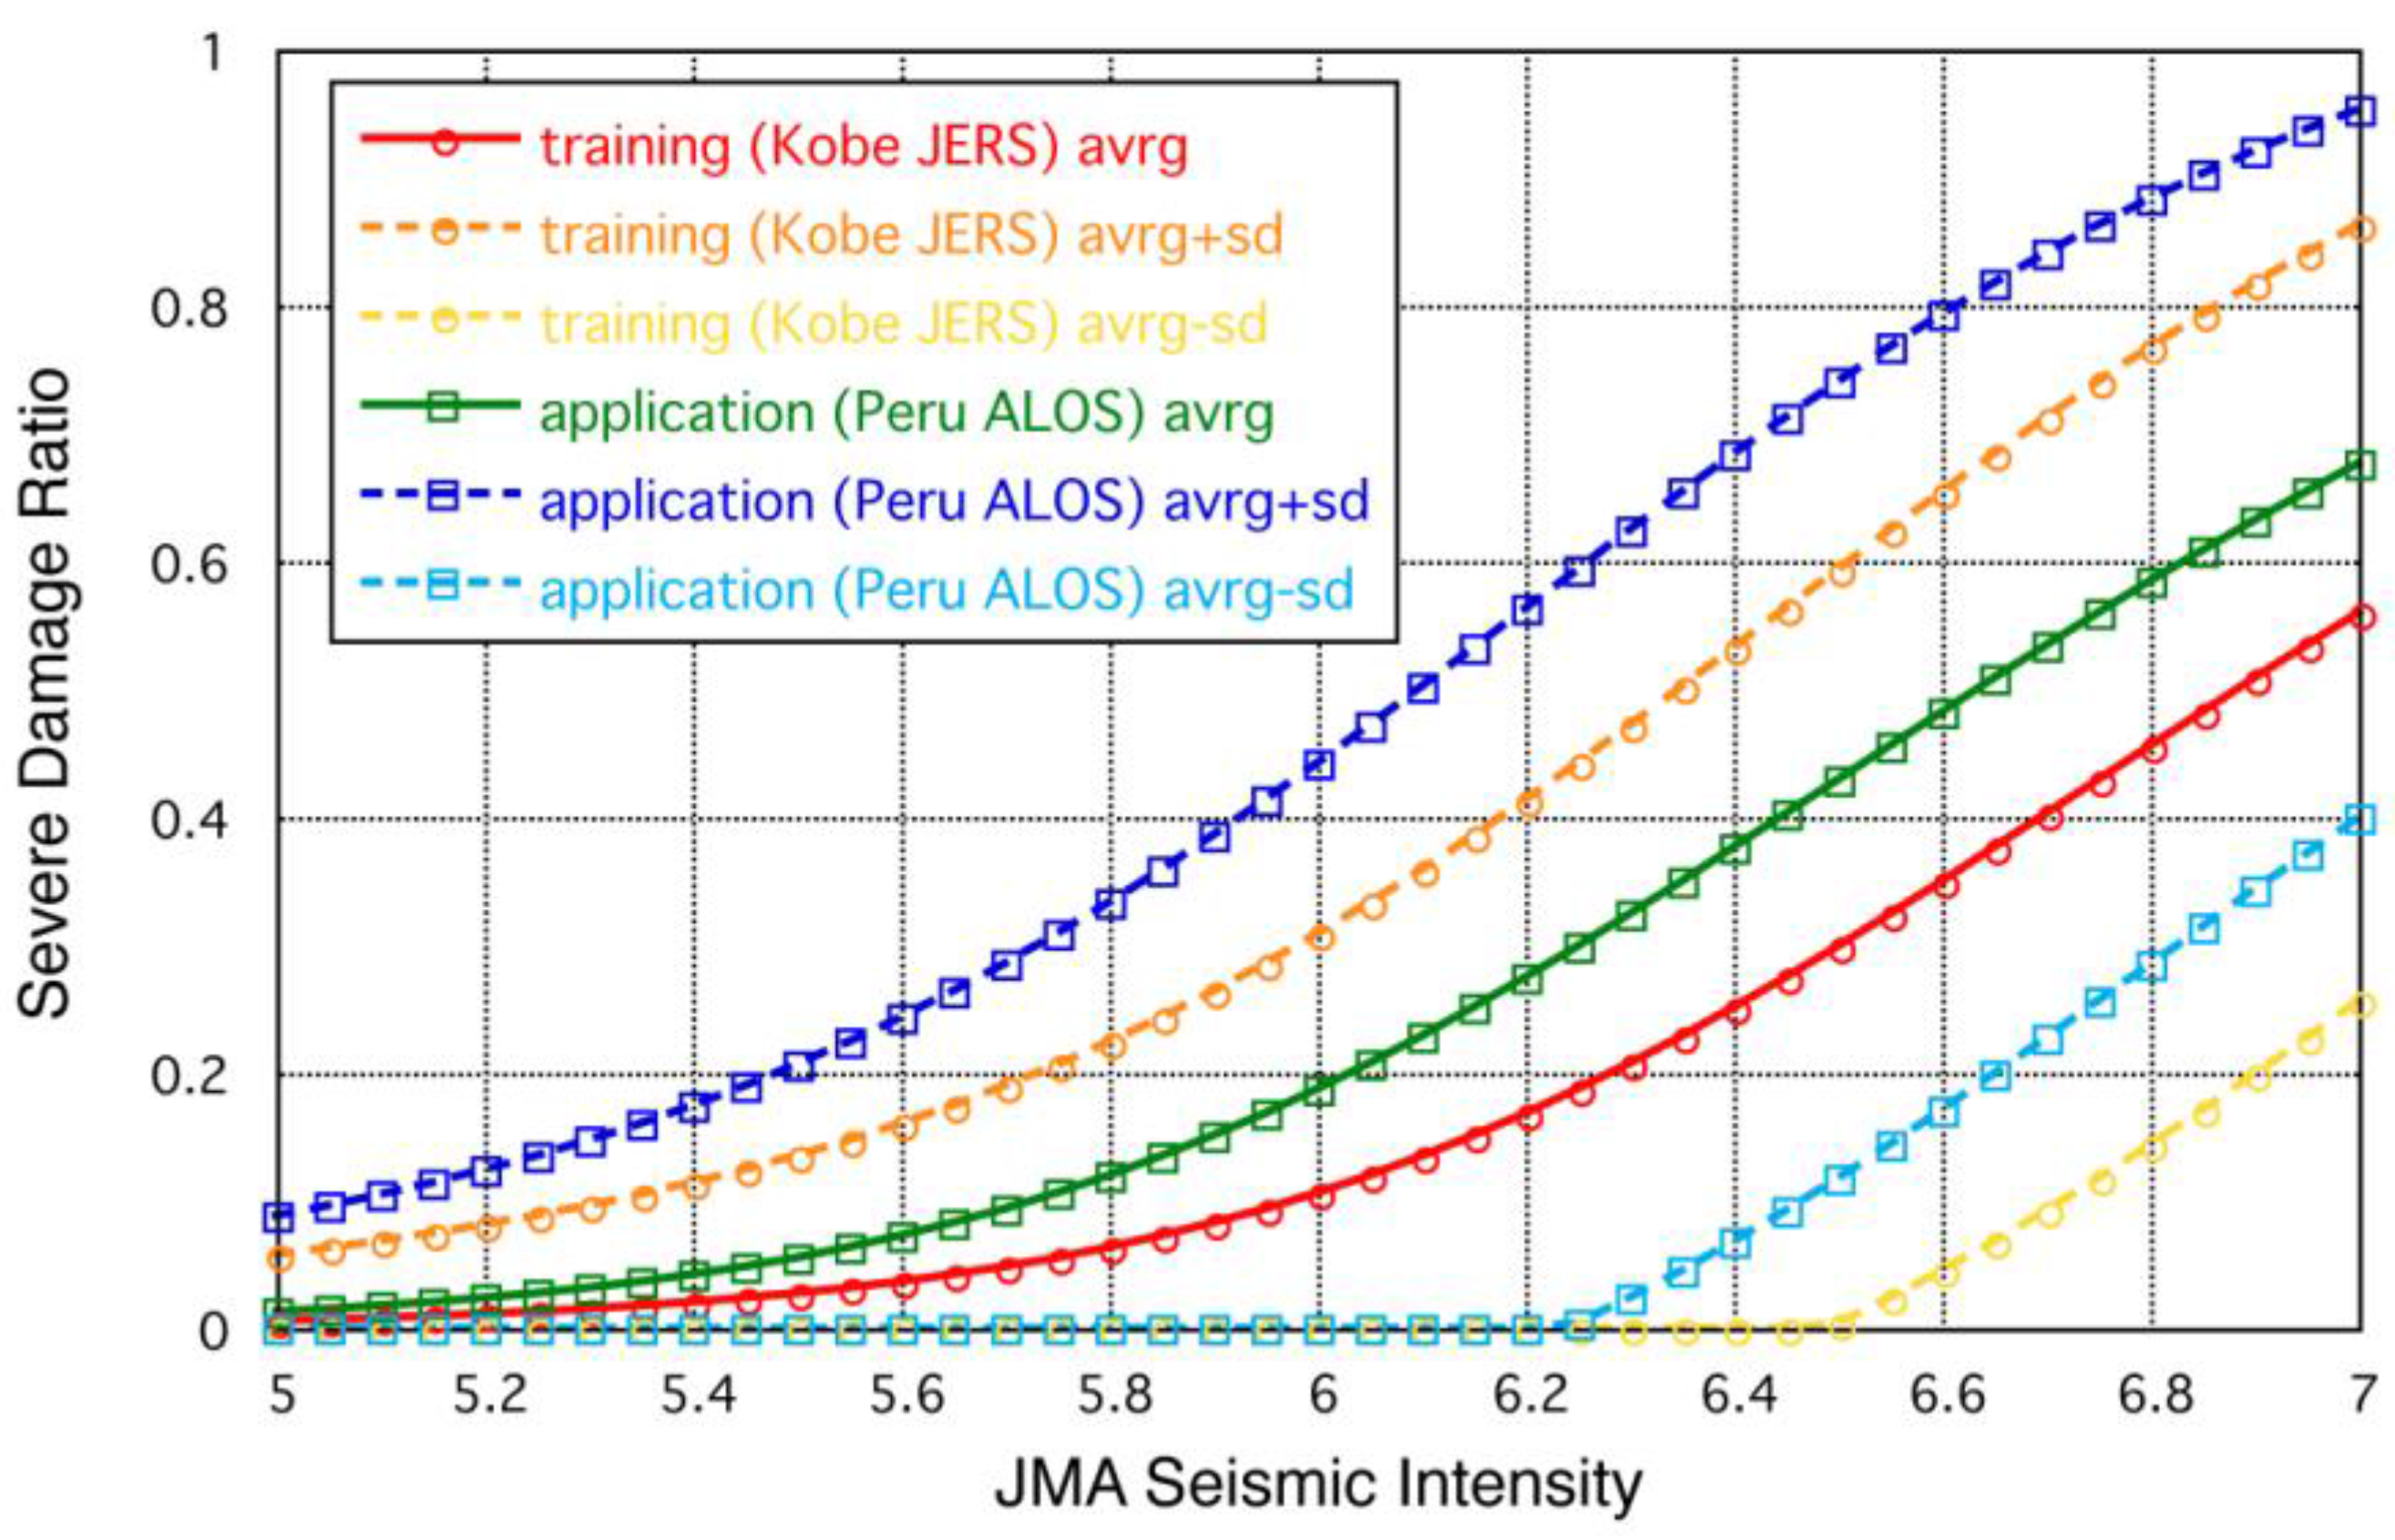
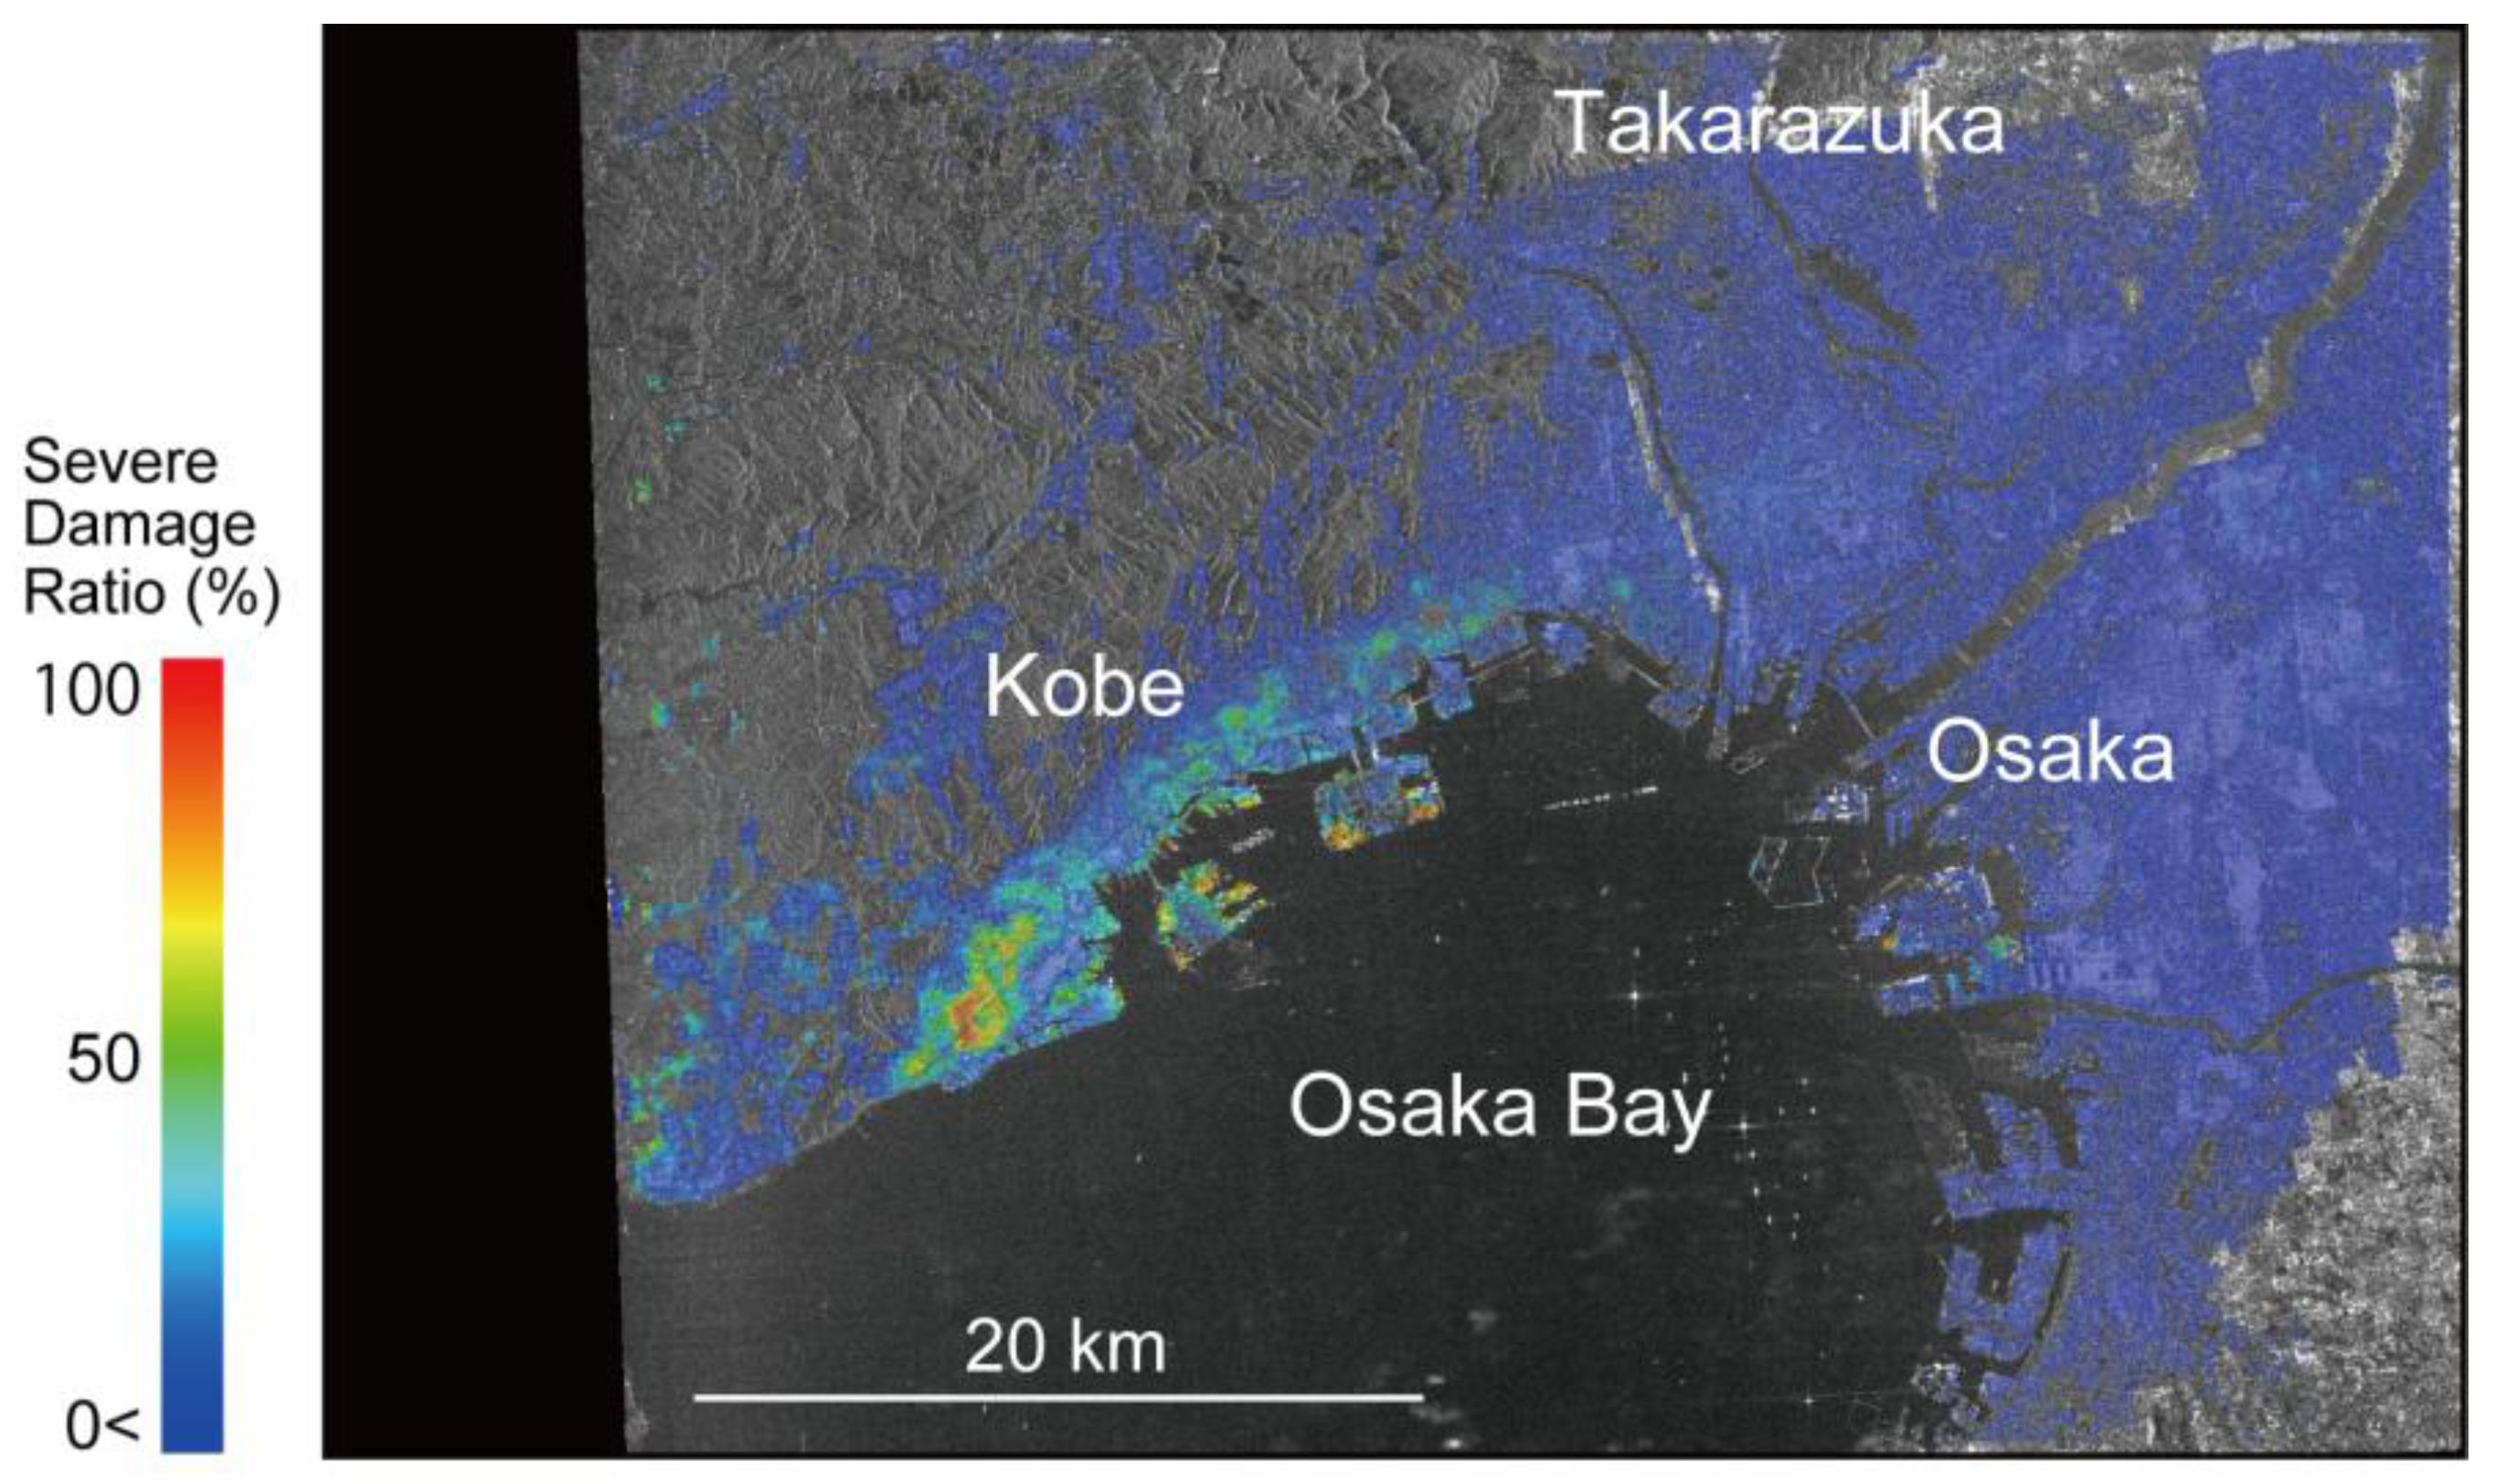
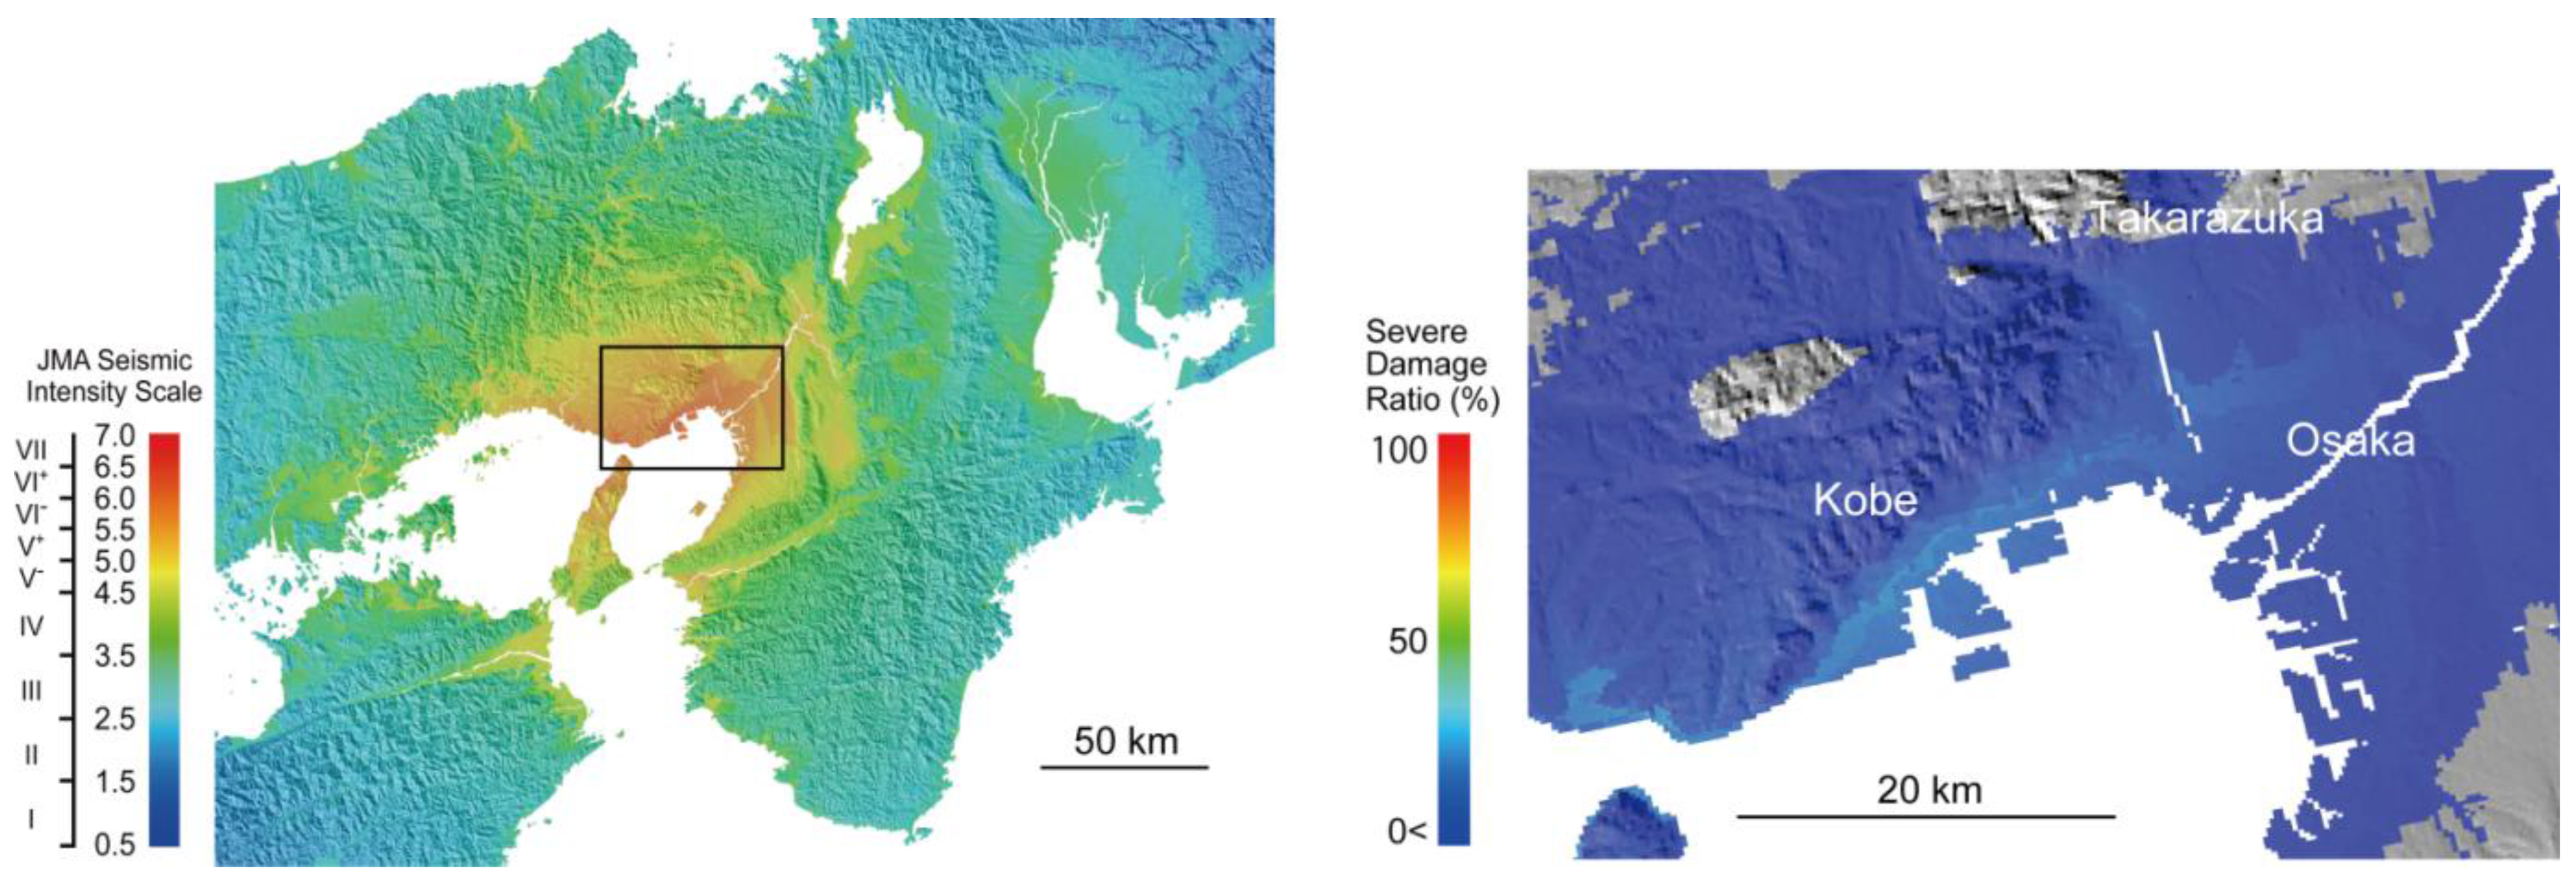
3.2. Estimation of Severe Damage Ratio in the Kobe Earthquake

An example of integration in the Kobe earthquake is shown in this section. The seismic intensity information is estimated by multiplying the seismic intensity on stiff soil layer with the amplification factor of the subsurface layer. A model by Wald [18] was used for the locations of the fault lines, and the attenuation relationship of peak velocity by Si and Midorikawa (crustal earthquake, using shortest distance to fault plane) [19] were used for the seismic intensity on stiff soil layer. For the amplification distribution of the surface layer, the average shear wave velocity for the ground was calculated from the 250 m grid-version [20,21] of the Japan Engineering Geomorphologic Classification Map [22] and the amplification was estimated using a formula [23]. The values for peak ground velocities (PGV) at the surface thus obtained were converted to seismic intensity using the relationship [24] by Fujimoto and Midorikawa.
Seismic intensity distribution and the severe damage ratio (average values) distribution estimated from the fragility function for damage, overlaid onto a shaded relief map, is shown in Figure 10. It can be seen that seismic intensity tends to be larger on lower ground. Additionally, we can estimate, purely from the seismic intensity information, that the severe damage ratio is likely to be large in the coastal regions of Kobe. However, because this is based on a simple method, which does not take into account factors such as the direction of fault rupture, the estimated seismic intensities are lower than the actual intensities in the area around Takarazuka where the effect of such factors was significant.
Figure 10. Distribution of estimated seismic intensities (left) and distribution of estimated severe damage ratios from seismic intensity information (average values) (right) for the Kobe earthquake.
Remotesensing 02 02111 g010
Figure 11 shows the estimated severe damage ratio (average values) obtained through an integration of discriminant scores ZRj of the SAR images (Figure 3) and seismic information (Figure 10). Compared to the severe damage ratio estimation using seismic intensity information only, the contrast between severely damaged areas and lightly damaged areas is more pronounced, and a distribution which resembles the so-called “earthquake damage belt” from Kobe to Nishinomiya (black areas in Figure 1(c)) is obtained. As for Takarazuka, whose seismic intensity has been underestimated, the severe damage ratio estimated by the integration is also underestimated due to small discriminant score ZRj from the SAR data (see Figure 3). The requirement for more accurate seismic intensity estimations, and the capacity of JERS-1/SAR images, are issues which need to be examined in more detail in the future.
Figure 11. Distribution of estimated severe damage ratios (average values), estimated from an integrated processing of the discriminant score ZRj of the JERS-1/SAR image and seismic intensity information.
Remotesensing 02 02111 g011

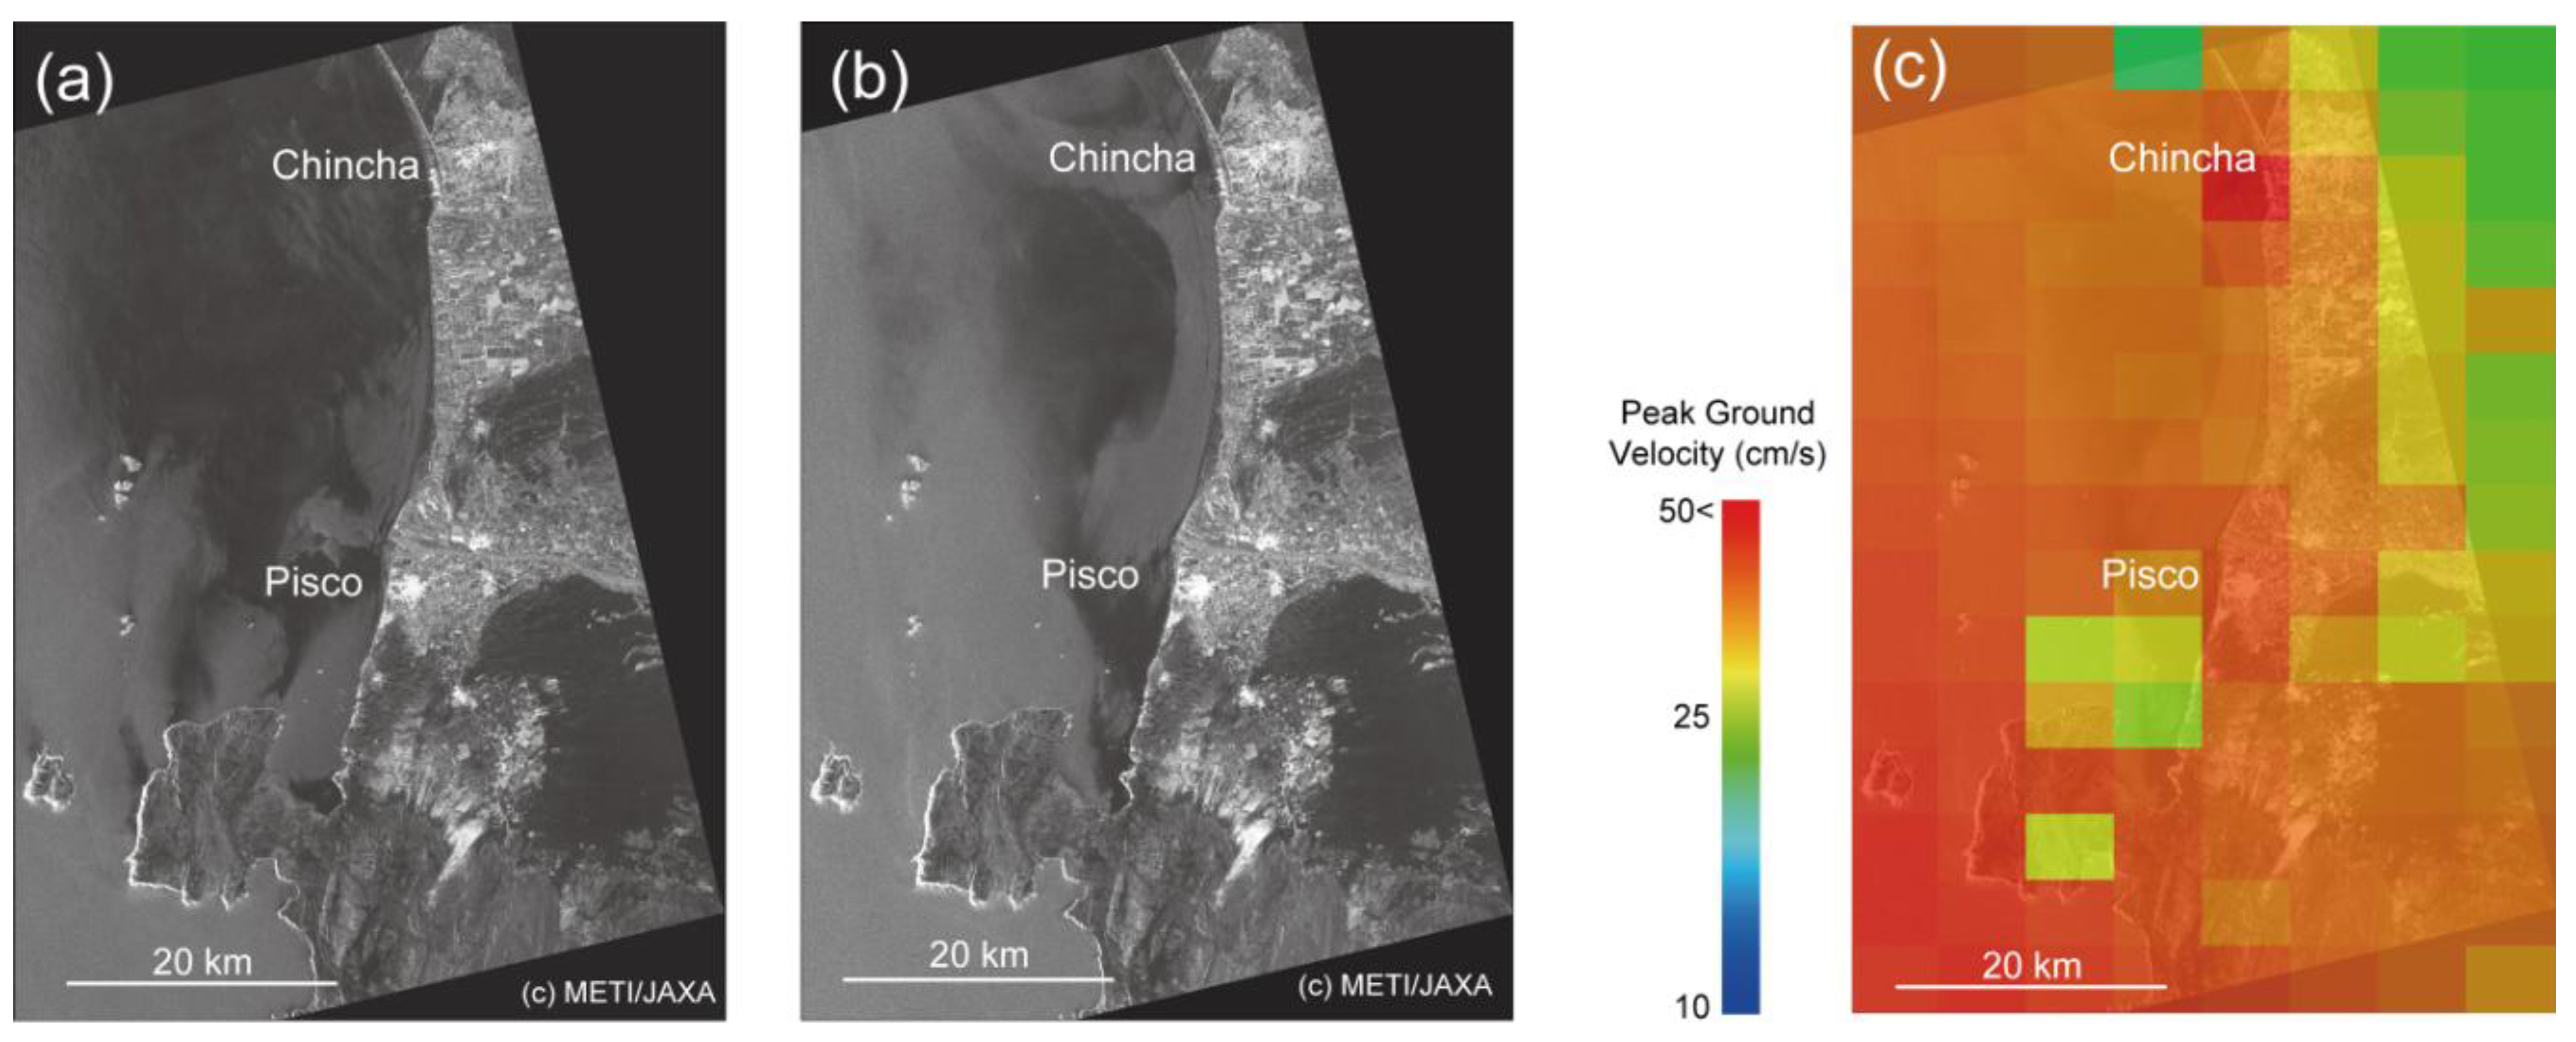
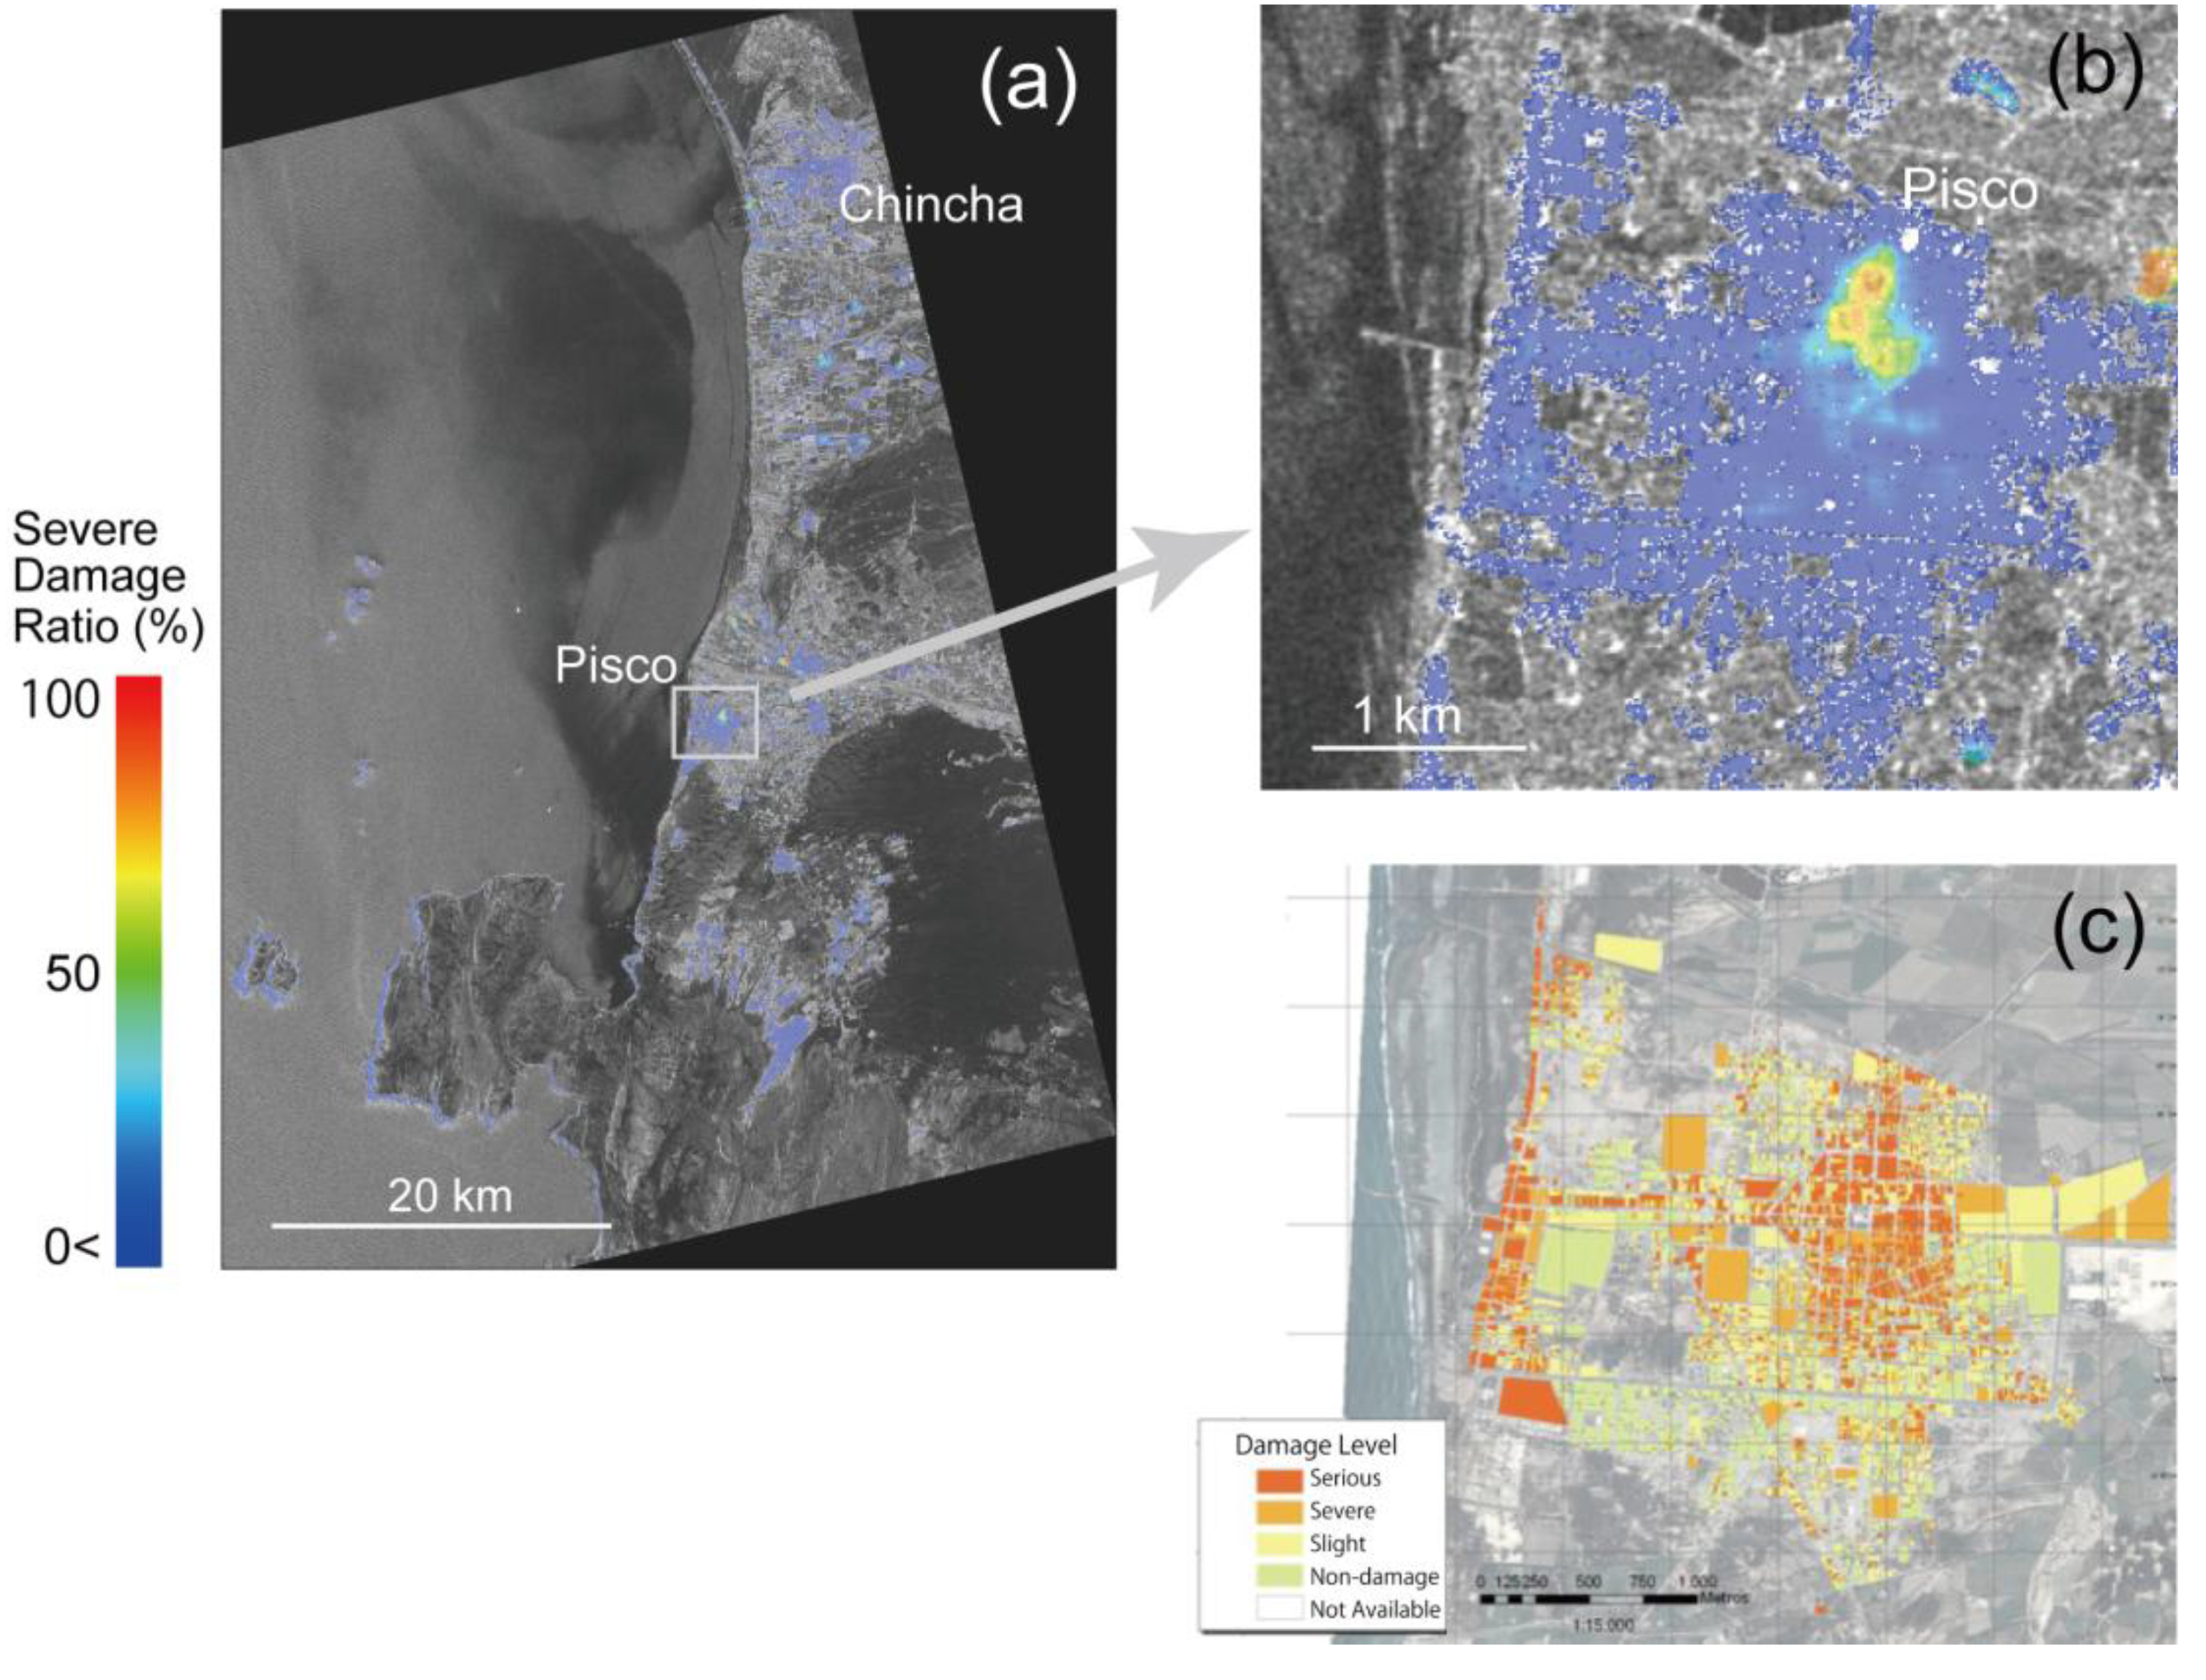
4. Application to ALOS/PALSAR Images of the 2007 Peru Earthquake

The severe building damage ratio estimation model for L-band SAR image proposed above is applied to ALOS/PALSAR images for the 2007 Peru earthquake, and the accuracy of the model is examined through comparisons between the results of integration with seismic intensity information and the actual damage situation. For the seismic intensity information, we used the grid data of PGV from ShakeMap [25,26] and PAGER [27] which are published by the U.S. Geological Survey (USGS) immediately after the events, and obtained the seismic intensities from the PGVs using a formula [24]. Additionally, in order to take into consideration the seismic resistance of buildings in this country, we amended the fragility function for damage (the curves are shifted −0.25 in terms of seismic intensity) so that it more or less corresponds with previous fragility functions for damage [28,29]. The modified fragility function is also shown in Figure 8. The average value is a green color and the values of its plus and minus standard deviation are shown in dark and light blue colors, respectively.
The Peru Earthquake, which measured Mw 8.0 and occurred 40 km north-west of the city of Chincha on August 15, 2007, caused serious damage in the city of Pisco and surrounding areas, with more than 500 dead or missing and more than 35,000 buildings completely destroyed. The coastal area affected by the quake was observed by ALOS/PALSAR in high-resolution mode about two weeks after the event. Pre- and post-event images are shown in Figure 12(a,b) (pre-event: July 12, 2007; post-event: August 27, 2007). The ground resolution is approximately 12.5 m. The PGV distribution from the USGS [30] is shown superimposed on the PALSAR image in Figure 12(c).
Figure 12. ALOS/PALSAR image before and after the 2007 Peru earthquake, and strong motion distribution. (a) Image taken July 12, 2007. (b) Image taken August 27, 2007. (c) PGV distribution estimated by USGS overlaid with ALOS/PALSAR image.
Remotesensing 02 02111 g012
Figure 13. Distribution of severe damage ratios (average values) estimated from an integration of PALSAR images and seismic intensity information, and comparison with damage study data. (a) All areas of image. (b) Close up of Pisco area. (c) Building damage survey data in Pisco [31].
Remotesensing 02 02111 g013
A discriminant score ZRj is obtained from the PALSAR image and PGVs are converted to seismic intensities; the two results are integrated, using the modeled likelihood function and the fragility function for damage, to arrive at estimations of the severe damage ratio, the results of which are shown on Figure 13(a). Figure 13(b) shows a close-up of the Pisco area. Because built-up area is the target, areas with backscattering coefficient of under −5 dB are hidden. The field survey in Pisco was carried out for three months after the event by a team composed of researchers and structural engineers. They inspected and classified severest building damage level in each city-block into serious, severe, slight, and no damage, then plotted corresponding color to each block in GIS dataset shown on Figure 13(c) [31]. The serious damage almost corresponds to the situation where at least one building classified into G5~G4 as in EMS-98 exists in each block. It must be noted that from this damage map we cannot calculate statistical information such as damage ratio like the Kobe case. Therefore, the quantitative comparison between the actual damage situation and estimated damage ratio is difficult. When qualitatively compared to the distribution of building damage in Pisco, according to the results of ground investigation after the earthquake, there is good agreement between areas in the city center with a high concentration of seriously or severely damaged buildings and areas with high severe damage ratio estimated from the PALSAR image. It must be noted that damage in the western coastal area of Pisco has not been detected using the PALSAR image. It is possible that the extent of the damage is limited to a narrow area where building density is considered to be low according to the optical satellite, QuickBird, image captured after the earthquake, thereby rendering the change too small to be adequately detected from the image. Since this damage detection technique is based on the cardinal effect of building groups peculiar to SAR images, and its change calculated from rather large size of the local window to calculation, detectable damage areas should be densely and extensively built-up [32].

5. Conclusions

We proposed a modeled likelihood function for severe building damage ratio from discriminant scores obtained via regression discriminant analysis, using the difference values and correlation coefficients from pre-event and post-event JERS-1/SAR images of the areas affected by the 1995 Kobe earthquake, as well as damage severity rankings obtained from building damage data of the quake, as explaining variables. We demonstrated that the severe building damage ratio distribution can be estimated from SAR images through integration with the fragility function for damage in terms of seismic intensity of this earthquake. Furthermore, we applied the proposed model to ALOS/PALSAR images of the 2007 Peru earthquake, and examined the accuracy of the proposed model qualitatively through comparisons with local field investigations. A further study is needed through statistical approaches in order to validate our approach quantitatively.
In terms of application of the model for early-stage estimations following earthquakes abroad, a realistic option would be to use a seismic intensity estimation system that is in global use. Although ShakeMap has been used in this instance, the estimation should ideally be updated when detailed seismic intensity distribution information through strong motion observations and high-precision simulations become available. For estimations of building damage, the function for the Kobe earthquake was used; however, it is preferable that a fragility function for damage that is appropriate for the situation of the relevant country [33] be used in order to further increase the accuracy of damage estimation. This is an issue to be addressed in the future.

Acknowledgements

The JERS-1/SAR and PALSAR data are the property of METI and JAXA, and were provided by RESTEC (Remote Sensing Technology Center of Japan) and ERSDAC (Earth Remote Sensing Data Analysis Center), respectively. We received grants, for part of the research, from the grant-in-aid for scientific research (Research No. 21310119) and the “Development of real-time tsunami damage detection technology for expeditious disaster response of Japan and ASEAN countries (Project ID: 08E52010a)”, a NEDO (New Energy and Industrial Technology Development Organization) Industrial Technology Research Grant Program. We would like to express our gratitude.

References and Notes

  1. Yamazaki, F.; Yano, Y.; Matsuoka, M. Visual damage interpretation of buildings in Bam city using QuickBird images following the 2003 Bam, Iran, earthquake. Earthq. Spectra 2005, 21, S329–S336. [Google Scholar] [CrossRef]
  2. Gusella, L.; Adams, B.J.; Bitelli, G.; Huyck, C.K.; Mognola, A. Object-oriented image understanding and post-earthquake damage assessment for the 2003 Bam, Iran, earthquake. Earthq. Spectra 2005, 21, S225–S238. [Google Scholar] [CrossRef]
  3. Miura, H.; Midorikawa, S. Detection of slope failure areas due to the 2004 Niigata-ken Chuetsu earthquake using high-resolution satellite images and digital elevation model. J. Jpn. Assoc. Earthq. Eng. 2007, 7, 1–14, (in Japanese with English abstract). [Google Scholar] [CrossRef]
  4. Massonnet, D.; Rossi, M.; Carmona, C.; Adragna, F.; Peltzer, G.; Fiegl, K.; Rabaute, T. The displacement field of the Landers earthquake mapped by radar interferometry. Nature 1993, 364, 138–142. [Google Scholar] [CrossRef]
  5. Hao, K.X.; Si, H.; Fujiwara, H.; Ozawa, T. Coseismic surface-ruptures and crustal deformations of the 2008 Wenchuan earthquake Mw7.9, China. Geophys. Res. Lett. 2009, 36, L11303. [Google Scholar] [CrossRef]
  6. Aoki, H.; Matsuoka, M.; Yamazaki, F. Characteristics of satellite SAR images in the damaged areas due to the Hyogoken-nanbu earthquake. In Proceedings of 19th Asian Conference on Remote Sensing, Manila, Philippines, November 1998; C7. pp. 1–6.
  7. Matsuoka, M.; Yamazaki, F. Interferometric characterization of areas damaged by the 1995 Kobe earthquake using satellite SAR images. In Proceedings of 12th World Conference on Earthquake Engineering, Auckland, New Zealand, January 2000. CD-ROM, Paper ID 2141.
  8. Yonezawa, C.; Takeuchi, S. Decorrelation of SAR data by urban damages caused by the 1995 Hyogoken-nanbu earthquake. Int. J. Remote Sens. 2001, 22, 1585–1600. [Google Scholar] [CrossRef]
  9. Ito, Y.; Hosokawa, M.; Matsuoka, M. A degree estimation model of earthquake damage using temporal coherence ratio. In Proceedings of International Geoscience and Remote Sensing Symposium, Toulouse, France, July 2003; CD-ROM. p. 3.
  10. Hosokawa, M.; Jeong, B.; Takizawa, O.; Matsuoka, M. Disaster risk evaluation and damage detection using remote sensing data for global rescue operations. In Proceedings of Commission VIII ISPRS Congress, Beijing, China, July 2008; Available online: http://www.isprs.org/proceedings/XXXVII/congress/8_pdf/2_WG-VIII-2/06.pdf (accessed on 18 May 2010).
  11. Matsuoka, M.; Yamazaki, F. Use of satellite SAR intensity imagery for detecting building areas damaged due to earthquakes. Earthq. Spectra 2004, 20, 975–994. [Google Scholar] [CrossRef]
  12. Nojima, N.; Matsuoka, M.; Sugito, M.; Ezaki, K. Quantitative estimation of building damage based on data integration of seismic intensities and satellite SAR imagery. J. Struct. Mech. Earthq. Eng. 2006, 62, 808–821, (in Japanese with English abstract). [Google Scholar] [CrossRef]
  13. Matsuoka, M.; Yamazaki, F. Application of the damage detection method using SAR intensity images to recent earthquakes. In Proceedings of International Geoscience and Remote Sensing Symposium, Toronto, ON, Canada, June 2002; CD-ROM. p. 3.
  14. Final Damage Report of the 1995 Hyogo-ken Nanbu Earthquake; Building Research Institute: Tsukuba, Japan, 1996; [CD-ROM]; p. 303. (in Japanese)
  15. Grünthal, G. European Macroseismic Scale (EMS-98); European Seismological Commission: Luxembourg, Belgium, 1998; p. 99. [Google Scholar]
  16. Lee, J.S. Digital image enhancement and noise filtering by use of local statistics. IEEE Trans. Patt. Anal. Mach. Int. 1980, 2, 165–168. [Google Scholar] [CrossRef]
  17. Okuno, T.; Kume, H.; Haga, T.; Yoshizawa, T. Multivariate Statistical Methods; Union of Japanese Scientists and Engineers: Tokyo, Japan, 1981; pp. 259–321. (in Japanese) [Google Scholar]
  18. Wald, D.J. Slip history of the 1995 Kobe, Japan, earthquake determined from strong motion, teleseismic and geodetic data. J. Phys. Earth 1996, 44, 489–503. [Google Scholar] [CrossRef]
  19. Si, H.; Midorikawa, S. New attenuation relations for peak ground acceleration and velocity considering effects of fault type and site condition. In Proceedings of 12th World Conference on Earthquake Engineering, Auckland, New Zealand, January 2000. [CD-ROM], Paper ID 532.
  20. Matsuoka, M.; Wakamatsu, K.; Fujimoto, K.; Midorikawa, S. Average shear-wave velocity napping using Japan Engineering Geomorphologic Classification Map. J. Struct. Eng. Earthq. Eng. 2006, 23, 57s–68s. [Google Scholar]
  21. Wakamatsu, K.; Matsuoka, M. Development of the 7.5-arc-second engineering geomorphologic classification database and its application to seismic microzoning. Bull. Earthq. Res. Inst. 2006, 81, 317–324. [Google Scholar]
  22. Wakamatsu, K.; Kubo, S.; Matsuoka, M.; Hasegawa, K.; Sugiura, M. Japan Engineering Geomorphologic Classification Map; University of Tokyo Press: Tokyo, Japan, 2005; p. 112, (in Japanese with English abstract, GIS data in CD-ROM). [Google Scholar]
  23. Fujimoto, K.; Midorikawa, S. Empirical estimates of site amplification factor from strong-motion records at nearby station pairs. In Proceedings of the 1st European Conference on Earthquake Engineering and Seismology, Geneva, Switzerland, September 2006. [CD-ROM], Paper No.251.
  24. Fujimoto, K.; Midorikawa, S. Empirical method for estimating J.M.A. instrumental seismic intensity from ground motion parameters using strong motion records during recent major earthquakes. J. Inst. Social Safety Sci. 2005, 7, 214–246, (in Japanese with English abstract). [Google Scholar]
  25. Wald, D.J.; Worden, B.C.; Quitoriano, V.; Pankow, K.L. ShakeMap Manual: Technical Manual, User’s Guide, and Software Guide Ver. 1.0; Techniques and Methods 12-A1; US Geological Survey: Golden, CO, USA, 2006; p. 156.
  26. ShakeMap; U.S. Geological Survey: Golden, CO, USA. Available online: http://earthquake.usgs.gov/eqcenter/shakemap/ (access on 1 June 2009).
  27. PAGER: Prompt Assessment of Global Earthquakes for Response; U.S. Geological Survey: Golden, CO, USA. Available online: http://earthquake.usgs.gov/eqcenter/pager/ (access on 1 June 2009).
  28. Coburn, A.; Spence, R. Earthquake Protection. In Earthquake Risk Modeling; John Wiley & Sons: West Sussex, UK, 2002; p. 436. [Google Scholar]
  29. O’Rourke, T.D.; Sang-Soo, J.; Eguchi, R.T.; Huyck, C.K. Advanced GIS for loss estimation and rapid post-earthquake assessment of building damage. In Research Progress and Accomplishment; Multidisciplinary Center for Earthquake Engineering Research: Buffalo, NY, USA, 2000; pp. 157–164. [Google Scholar]
  30. ShakeMap us2007gbcv; U.S. Geological Survey: Golden, CO, USA. Available online: http://earthquake.usgs.gov/eqcenter/shakemap/global/shake/2007gbcv/ (access on 1 June 2009).
  31. Estrada, M.; Zavala, C.; Aguilar, Z. Damage study of the Pisco, Peru earthquake using GIS and satellite images. In Proceedings of International Workshop for Safer Housing in Indonesia and Peru, Tsukuba, Japan, March 2008.
  32. Matsuoka, M.; Horie, K.; Ohkura, H. Damage detection for the 2004 Niigata-ken Chuetsu earthquake using satellite SAR. In Proceedings of SPIE (Asia-Pacific Remote Sensing Symposium, Disaster Forewarning Diagnostic Methods and Management), Goa, India, November 2006; Vol.6412, ID64120M. p. 10.
  33. Jaiswal, K.; Wald, D.J. Creating A Global Building Inventory for Earthquake Loss Assessment and Risk Management; Open-file Report 2008-1160; U.S. Geological Survey: Golden, CO, USA, 2008; p. 103.

