1. Introduction
Sulfide ore deposits are abundant in the Pyrite Belt (SE Spain), and pyrite is present in significant quantities in mine waste in dumps and ponds. The massive polymetallic sulfides have been exploited for industrial use for over 5,000 years, as evidenced by the presence of pyrite nodules in coastal sediments. Mud, from ponds and solid waste, weathers rapidly to create a superficial hydrated sulfate crust via sulfide oxidation. Weathered crusts contain higher concentrations of heavy metals than unweathered mineral surfaces. Contamination from acid mine drainage is favored by sandy soils and alluvial deposits at the bottom of topographically low areas, which absorb contaminating matter through drainage or slope sliding.
Imaging spectroscopy using reference spectral libraries is recognized as a suitable technique for the study of mine waste, and enables quick mineralogical identification, saving time and costs. In contrast, conventional methods require tedious sample collection and chemical analysis, followed by interpolation of results through spatial mapping methods [
1]. Imaging spectroscopy also allows for mineralogical diagnoses of thin ephemeral crusts, with significant concentrations of heavy metals on surfaces which are inaccessible to direct observation [
2], providing an invaluable tool for environmental assessment.
Climate is a major controlling factor of the growth and solubilization of pyrite salts and other metallic sulfide mine waste. Most previous mine waste mapping studies using hyperspectral data have focused on the identification of environmental evidence for predicting the extent of heavy metal contamination and acid drainage in surface water and groundwater [
1,
3]. Maps produced from historic Hymap data of the area studied [
4,
5,
6] suggest that the mineralogical pattern within the mine waste and sediments is dependent on fluctuations in humidity and evaporation intensity, and could be used as a record of seasonal and annual climate changes. Later field and laboratory spectral investigations, which monitored mineralogical changes in mine waste from the end of the wet season through the dry season [
7,
8], were in agreement with these observations [
6].
Based on these results, the authors suggest variations to the spectral identification of pyrite mud weathering products, using spectral libraries developed under a careful evaluation of the geological context [
9,
10]. The geological and geomorphological influence of surfaces with pyrite oxidation on the spectral response was also evaluated. The work performed to date is part of a wider study of which the aim is to develop a monitoring system which can provide predictions on water quality estimations, and can be operated by regulators in the future.
2. Regional Geology and Climate
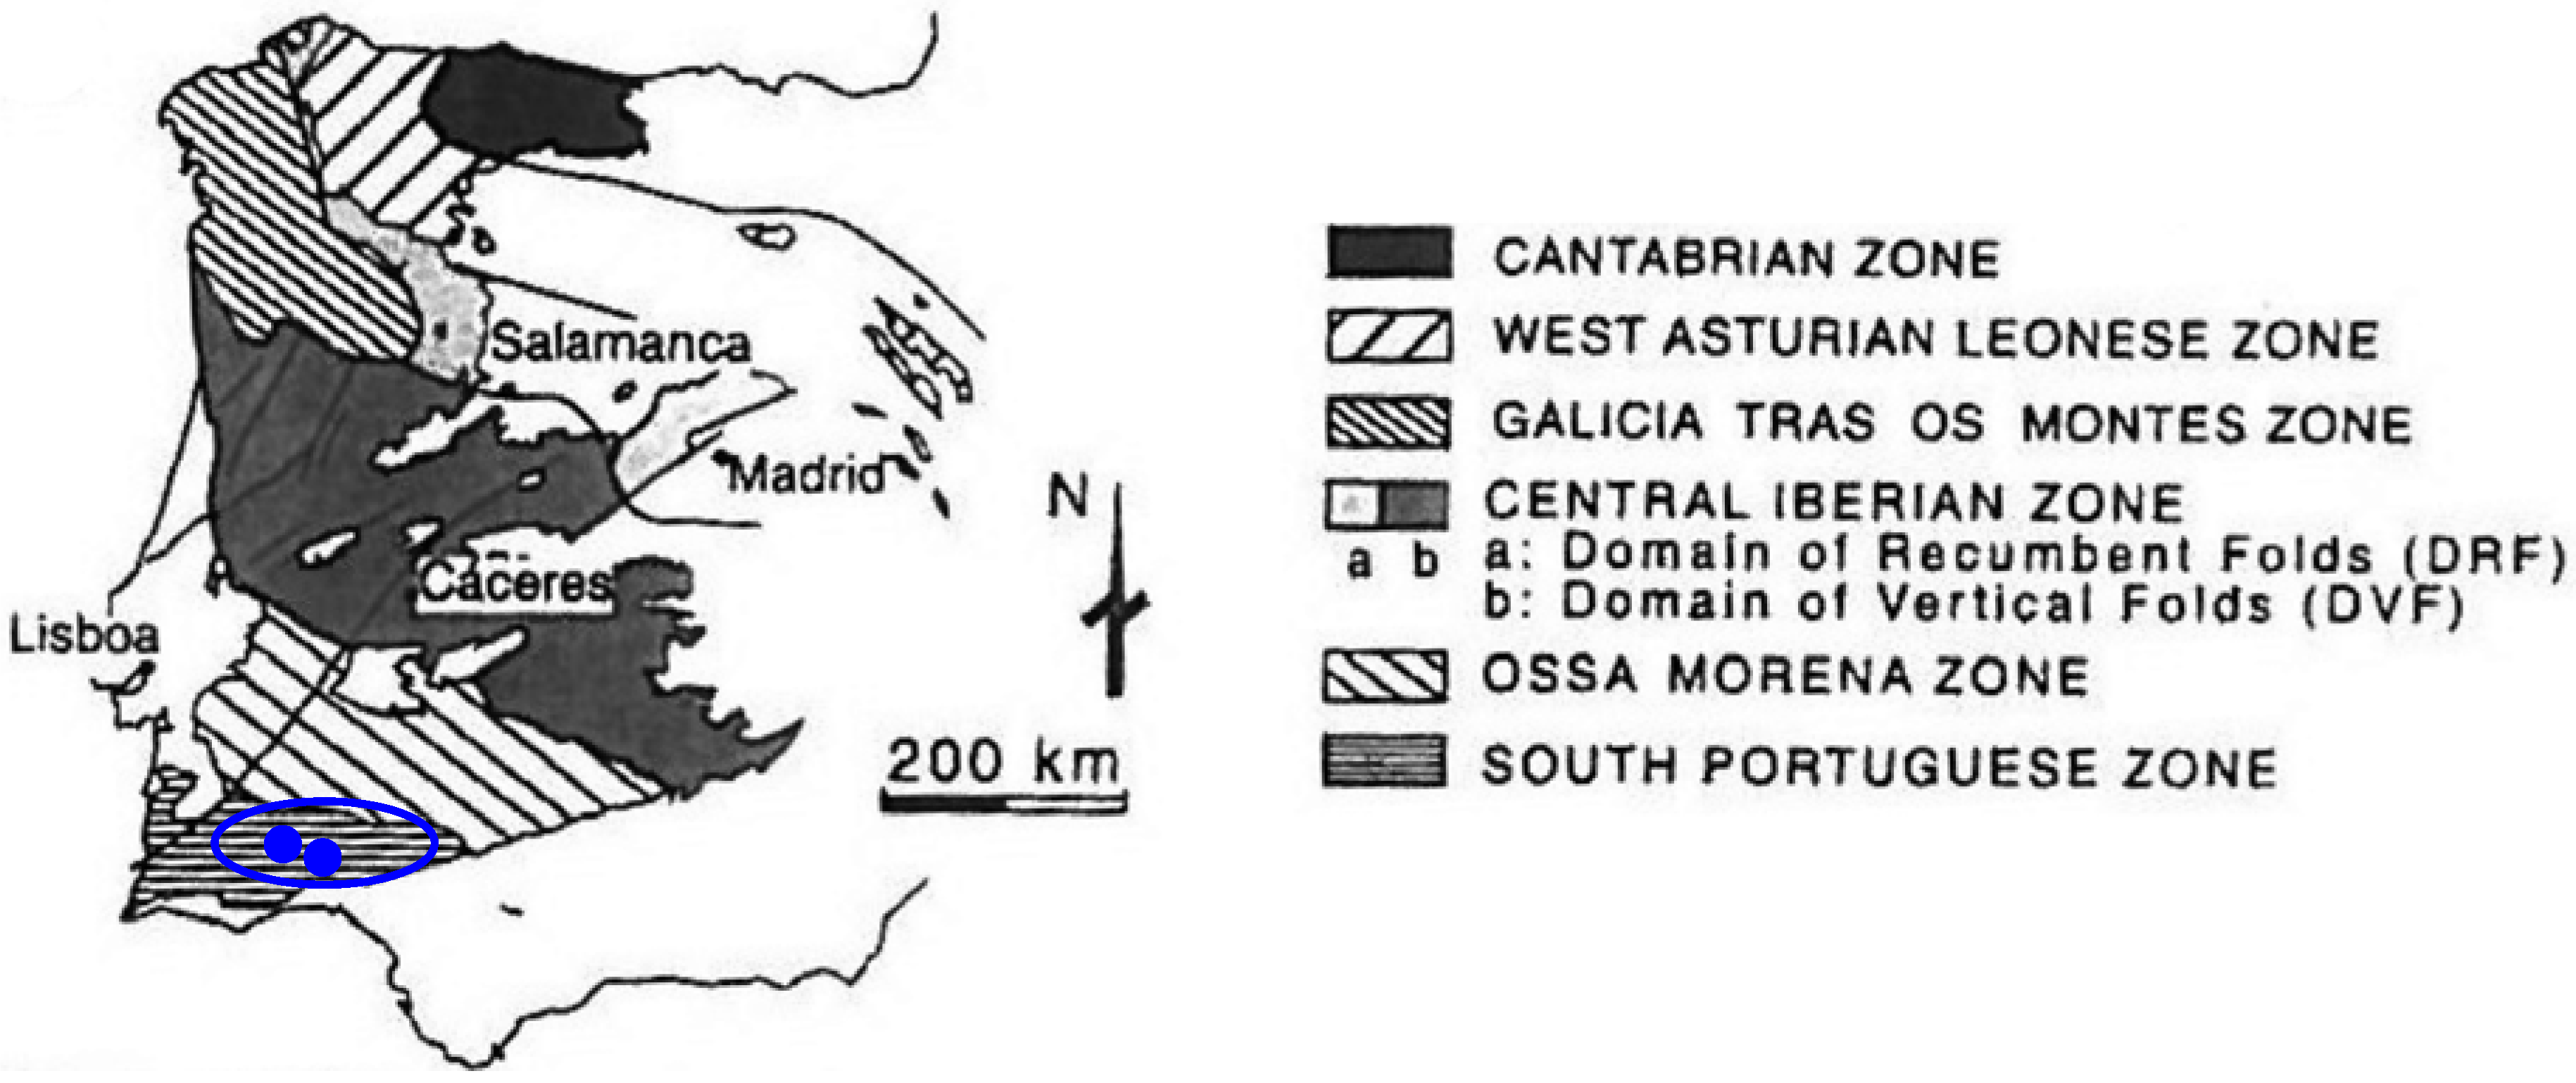
The Iberian Pyrite Belt (in southwest Spain and Portugal) is a wide outcrop which hosts massive sulfide deposits, and is responsible for significant acid mine drainage (
Figure 1), making it a favorable geological test case for hyperspectral image analysis. Pyrite mining has been conducted on the Iberian Pyrite Belt (Southwest Spain and Portugal) for over 5,000 years [
11]. Massive sulfide deposits are widespread throughout the region, and are hosted by a Volcano-Sedimentary Complex, which is composed of a thick stratigraphical series of volcanic detrital origin [
12].
Figure 1.
Location of the study area in the Iberian Hesperian Massif (Spain and Portugal). Dots locate Herrerias and Sotiel- Almagrera mine sites (Source: [
13]).
Figure 1.
Location of the study area in the Iberian Hesperian Massif (Spain and Portugal). Dots locate Herrerias and Sotiel- Almagrera mine sites (Source: [
13]).
Mines on the Iberian Pyrite Belt were already in operation by Tartesians and Phoenicians even before Roman times. Moreover, mining continued without a break from the Middle Ages (using manual methods) through the Industrial Revolution in the 19th Century, which was characterized by periods of intense operation. Massive sulfide deposits hosted by basalts were mined until the 1980s, when mining stopped. This geological framework is conducive for pyrite oxidation. The water quality of the rivers flowing through the area is subject to seasonal variations, which depend on the rainfall rate [
7].
The regional climate is Mediterranean, but is smoothed by the close presence of the Atlantic Ocean [
14]. Mediterranean climates are characterized by a wet season from October through May, and a dry season from late May through the summer. In addition, the insulation rate is extremely high throughout the year. Furthermore, the region is also classified as a semi-arid climate, with a permanently low water table, due to low precipitation rates.
Today, industrial mining operations have ceased at most metallic mine sites in the Iberian Pyrite Belt; and most mining facilities are abandoned and under the control of the authorities. The presence of numerous abandoned mines and the far-reaching exposure of the region to abandoned mine waste makes the Iberian Pyrite Belt an ideal field for testing environmental monitoring methods.
3. Dataset
Hymap data was collected over the Sotiel-Almagrera minesite, by the river Odiel (Iberian Pyrite Belt, Huelva, SW Spain) for the following periods: spring 1999; spring and summer 2004; summer 2005; summer 2008; and 13 August 2009. In addition, Hyperion data exist for the Sotiel-Almagrera minesite for 2 August for 2005, 2006 and 2007 [
5]. In addition, Hymap data was collected for the Las Herrerias minesite on 13 August 2009, and Hyperion data was recorded for the same minesite on 10 September 2006 and 24 August 2007. Hymap images of the river path of the river Odiel were recorded in the summers of 2008 and 2009.
Fieldwork was conducted in the summers of 2005, 2006, 2007, 2008, 2009 and 2010 on the mine sites and the river Odiel. Laboratory spectral measurements on field samples collected before 2007 were measured using a Perkin Elmer Lambda 950 spectrometer, equipped with an integrating sphere; spectra were recorded in the visible and near infrared wavelength range (0.4–2.4 μm) with a spectral resolution of 0.001 μm. Around 1,700 geologically documented spectra were measured both in the field and in the laboratory from field samples collected between 2005 and 2010. Laboratory monitoring of the mine dumps and river sediments was conducted in 2007 on 30 samples, using an additional 80 geologically documented field spectra [
6]. The entire flow path of the Odiel River was analyzed, including 200 field spectra, which were measured in 2005 using an ASD spectrometer, and ~500 geologically documented field spectral measurements, which were collected in September 2008 and from June 2009 to August 2009 with an ASD FieldSpec 3 Spectrometer (for thematic purposes) [
15]. Field spectra interpretation on mine sites begun with a field campaign of measurement, which were collected on 17 June 2005 in parallel with a Hymap flight over the same region [
4,
5], which covered a restricted part of the middle course of the River Odiel, where the old Sotiel-Almagrera mine site is located. Additional field spectra were collected over the Las Herrerias mine site in 2008 and 2010. Details on sampling procedures and measurement methods are explained in previous literature [
4,
5].
The interpretation of both field and laboratory spectra, which were collected during the summer of 2009, are based on laboratory spectra obtained for samples collected in the field in 2006 [
6] and 2007 [
16].
Selected representative samples were analyzed by X-ray diffraction. Selected samples of river sediments were also collected for conventional mineralogical analysis.
4. Hyperspectral Studies of Mine Waste
The high spectral resolution of airborne and spaceborne spectrometers has expanded the mapping capabilities of remote sensing data, especially with the use of AVIRIS data, which began in 1987. Advances in data calibration and the development of algorithms that are able to extract information from a large number of spatial spectral data, based on field spectra, have enabled the application of remote sensing data to environmental issues. Early studies on mine wastes were conducted by investigating secondary minerals, and initially focused on iron-bearing oxides and hydroxides [
17]. However, these research efforts were soon expanded to include secondary minerals related to mine waste weathering [
18,
19]. Minerals which generate acidic environments have begun to attract the attention of the geological scientific community, because they are highly environmentally mobile when solubilized in drainage water. The spectral behavior and solution properties of pyrite and sulfate, which are derived by oxidation, have been explored, and precipitation patterns have been traced using remote sensing hyperspectral data [
1,
20]. The development of spectral libraries from field sites has facilitated practically automatic mapping of ephemeral mineral features related to acid mine drainage [
21,
22,
23,
24,
25].
Contamination of the middle and lower basins of the river Agrio-Guadiamar from a sludge spill in Aznalcóllar (Spain) was monitored using hyperspectral data [
26,
27]. These studies produced a quantitative evaluation of the concentration of residual metals through secondary iron bearing minerals, and were supported by laboratory analyses of the spectral behavior of simulated mineral mixtures. Preliminary and mineralogical analyses of precipitates and efflorescent sulfate salt from various locations in the Pyrite Belt have recently been released to the public [
28]. In addition, hyperspectral mapping of mine tailings from the Sotiel mine in the Iberian Pyrite Belt has been reported [
3,
29,
30]. The current study began by considering mapping analyses of the oxidation and dehydration states of tailings near pond and mine facilities in Aznalcóllar, three months after a spill in 1998 [
31].
Pyrite oxidation products were mapped in pyrite mine dumps, mud tailings and river sediments, using historic Hymap data. The observed mineralogical changes associated with the underlying microgeomorphology suggest short-term climate variability, which follows seasonal and annual climate change trends [
4,
5]. Precipitates on crusts over fluvial sediments were also studied using Hymap data, coupled with detailed spectral laboratory work monitoring mineralogical changes through the dry season [
6].
The geochemistry of the river is closely monitored by local hydrogeologists [
8], and fluvial sediments from the Odiel River, which gather spills from numerous mine sites in its drainage basin, have drawn special attention to conduct a hyperspectral monitoring [
15]. In addition, several study sites were selected from maps compiled with historical Hymap data [
4,
5,
6], to sample and develop a laboratory spectral study which would enable monitoring of mineralogical changes over the summer [
6]. These observations enabled a description of the mineralogical evolution of the Sotiel-Almagrera mine site during several stages of its recovery process, including dump cleaning and the removal of mud tailings [
16]. Furthermore, quantitative estimations of spectral features were also tested: Absorption Depth, Full Width at Half Maximum and Asymmetry, using spectral derivatives and Modified Gaussian models [
32].
Only Hyperion can provide panoramic views of the mineral crusts over mine waste and fluvial sediments (spatial resolution 30 m). Recently, an attempt was made to conduct comparative mapping using both Hymap and Hyperion [
6], and the challenges and limitations of maps recorded at different spatial resolutions were tested for several areas of interest, including: fluid and solid waste; water bodies within open pits; lixiviating ponds for ore treatment; or water supply dams. The observed parameters suggested trends which would enable routine monitoring of spectral features associated with water quality in closed environments.
The capacity of the above described methods to produce representative maps with the help of reference spectral libraries were evaluated throughout these studies. In addition, the influence of different lithologies underlying acid water precipitate crusts on the spectral response was assessed. Furthermore, substances used to mitigate the acidity of mine products were clearly present. All mapping and mineralogical identification algorithms were analyzed, along with the environments in which they were used.
Figure 2.
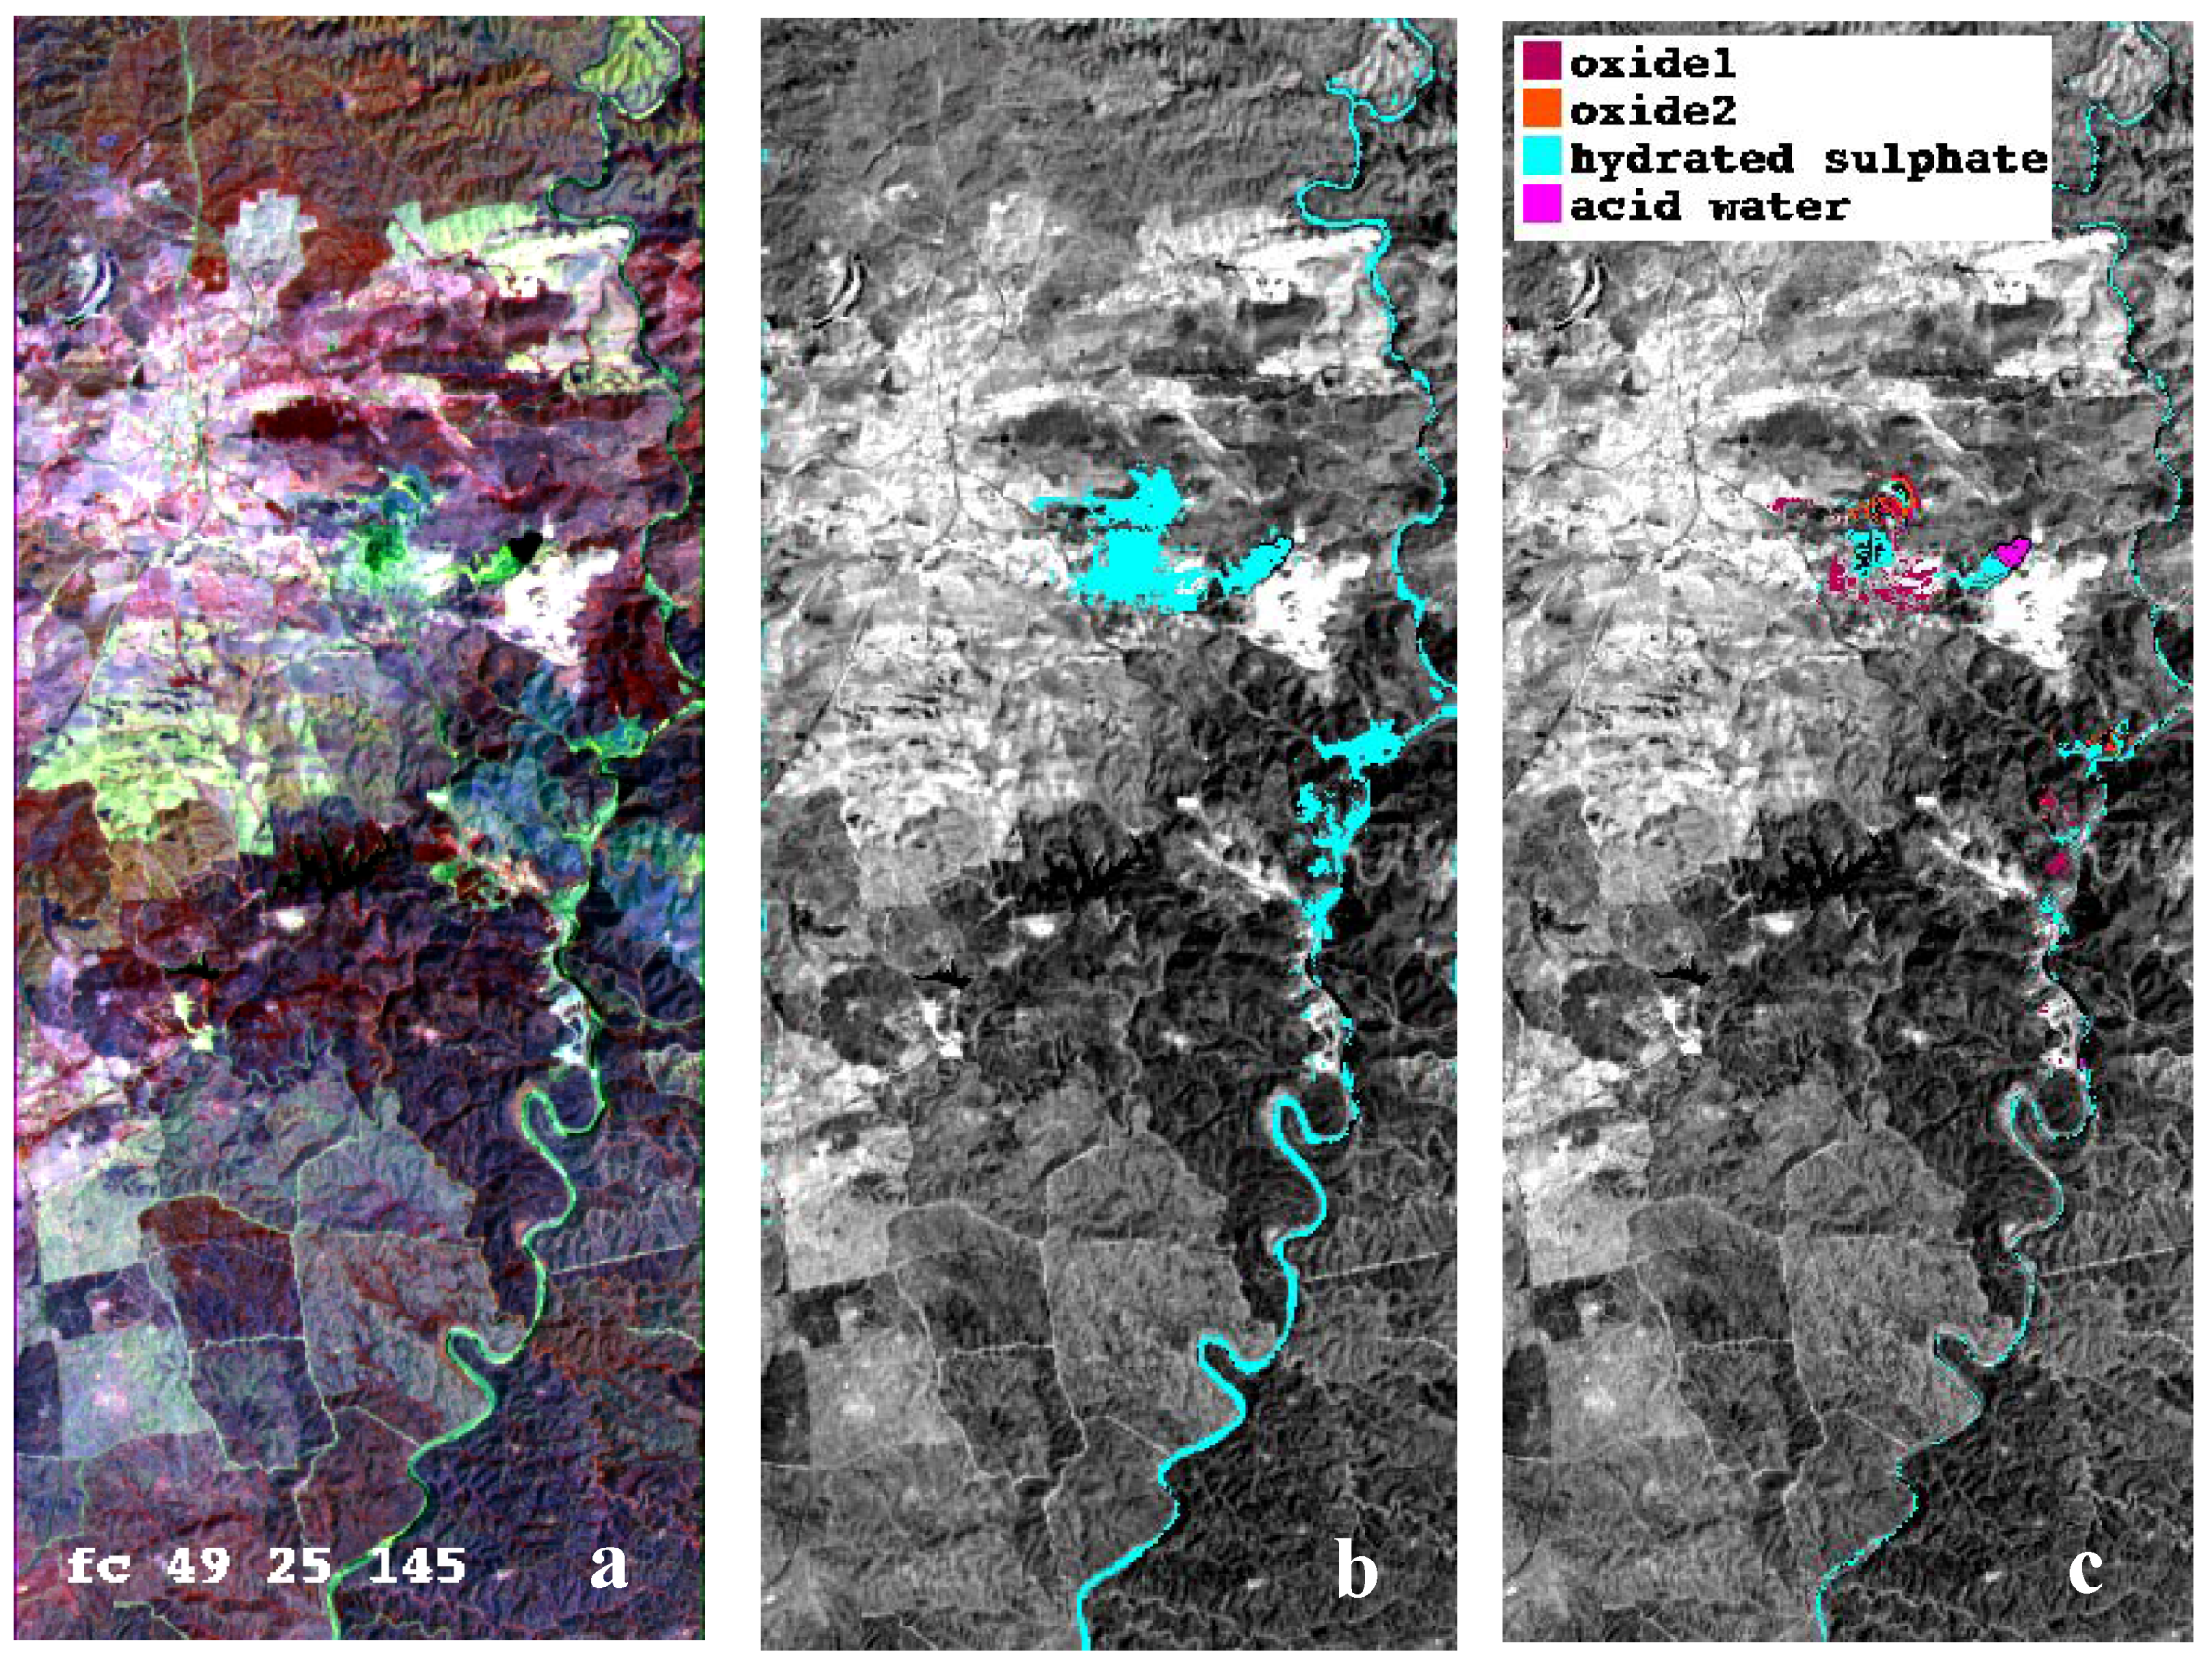
(a) False color composite of Hyperion data from August 2005 with channels 49 (844 nm), 25 (599, 8 nm) and 145 (1,598, 51 nm) channels. (b) Contaminated areas. (c) Map of the main contamination units at the Sotiel-Almagrera mine site and river sediments extracted from Hyperion imagery.
Figure 2.
(a) False color composite of Hyperion data from August 2005 with channels 49 (844 nm), 25 (599, 8 nm) and 145 (1,598, 51 nm) channels. (b) Contaminated areas. (c) Map of the main contamination units at the Sotiel-Almagrera mine site and river sediments extracted from Hyperion imagery.
5. Mapping the Presence of Contaminants in Acid Mine Drainage Areas Using Hyperspectral Data: The Challenges
Hyperspectral imagery allows for a wide range of possibilities for mapping complex features on the Earth’s surface, by providing data with high dimensionality, as long as good signal to-noise-ratio and spatial resolution are ensured [
33]. In the present work, interpreter-oriented sequential spectral unmixing was applied, using standard algorithms, to extract features for thematic purposes, enabling the display of spatial patterns and spectral identification pixels within the scene as a map. The dimensionality of the data was reduced during various image processing steps, which were tailored to the scene, yielding a map of pyrite oxidation products at the abandoned mine site [
5].
The resulting map is an image of the variable reflectance of the scene, and was constructed with the assistance of an experienced interpreter who is knowledgeable of the geological context of the contamination products. However, designing a legend which accurately describes the mapped geological units involves complex quantitative evaluation [
6].
The spectral library of the geological units mapped on the scene was compared to a reference spectral library, which was collected in the laboratory [
10], on a well-known sequence of pyrite weathering products [
34], beginning with hydrated mud and ending with complete oxidation. Additional spectra from iron hydroxides, oxides (goethite, hematite), and other critical minerals contaminating the area because of industrial processes (alunite, gypsum), were added from the United States Geological Survey spectral library [
9]. Several algorithms were used to produce a mineralogical diagnostic tool [
35], which are not uniformly efficient at detecting critical spectral features in spectra obtained for geological units [
6].
To ensure the output of a reasonable map when diagnosing spectra using a reference spectral library, the most important requirement is to restrict the map to an area which is likely to contain the substances of interest [
33]. Mine sites are small areas, even within such a widely and intensely mined region as the Iberian Pyrite Belt. Thus, low spatial resolution Hyperion hyperspectral data can easily detect contaminated areas (
Figure 2). Although airborne Hymap data provide a more detailed map of substances covering the dumps and river sediments [
5], it is convenient to get a first impression on the oxidation state of mine sites from a spaceborne sensor.
Hyperion is a hyperspectral spaceborne sensor covering the visible and near infrared regions of the electromagnetic spectrum (400–2,500 nm), and was used to test the capabilities and limitations of low spatial resolution hyperspectral sensors at providing maps for the assessment of contamination from massive sulfide mine waste.
In this chapter the challenges associated with mineralogical interpretation of such maps using available data and algorithms, and the difficulty of extracting useful geological information for temporal contamination monitoring from hyperspectral data, and field and laboratory spectra, are described.
5.1. Spectral Mineralogical Misinterpretations Using Reference Spectral Libraries
Reference spectral libraries contain laboratory spectra of the sequence of minerals which evolve from a mud mass or a solid waste via dehydration and oxidization, upon exposure to atmosphere [
10]. However, mine waste locations include surfaces which are not pyrite oxidation coatings, but can be misinterpreted as such.
During initial image processing, oxidized and hydrated areas over mine dumps and tailings appear to be spectrally different (
Figure 2(c)); while further image processing within each of the predominantly oxidized or hydrated areas results in more accurate mapping of the diverse mineralogy of coatings covering the mine dumps and river sediments [
15,
36].
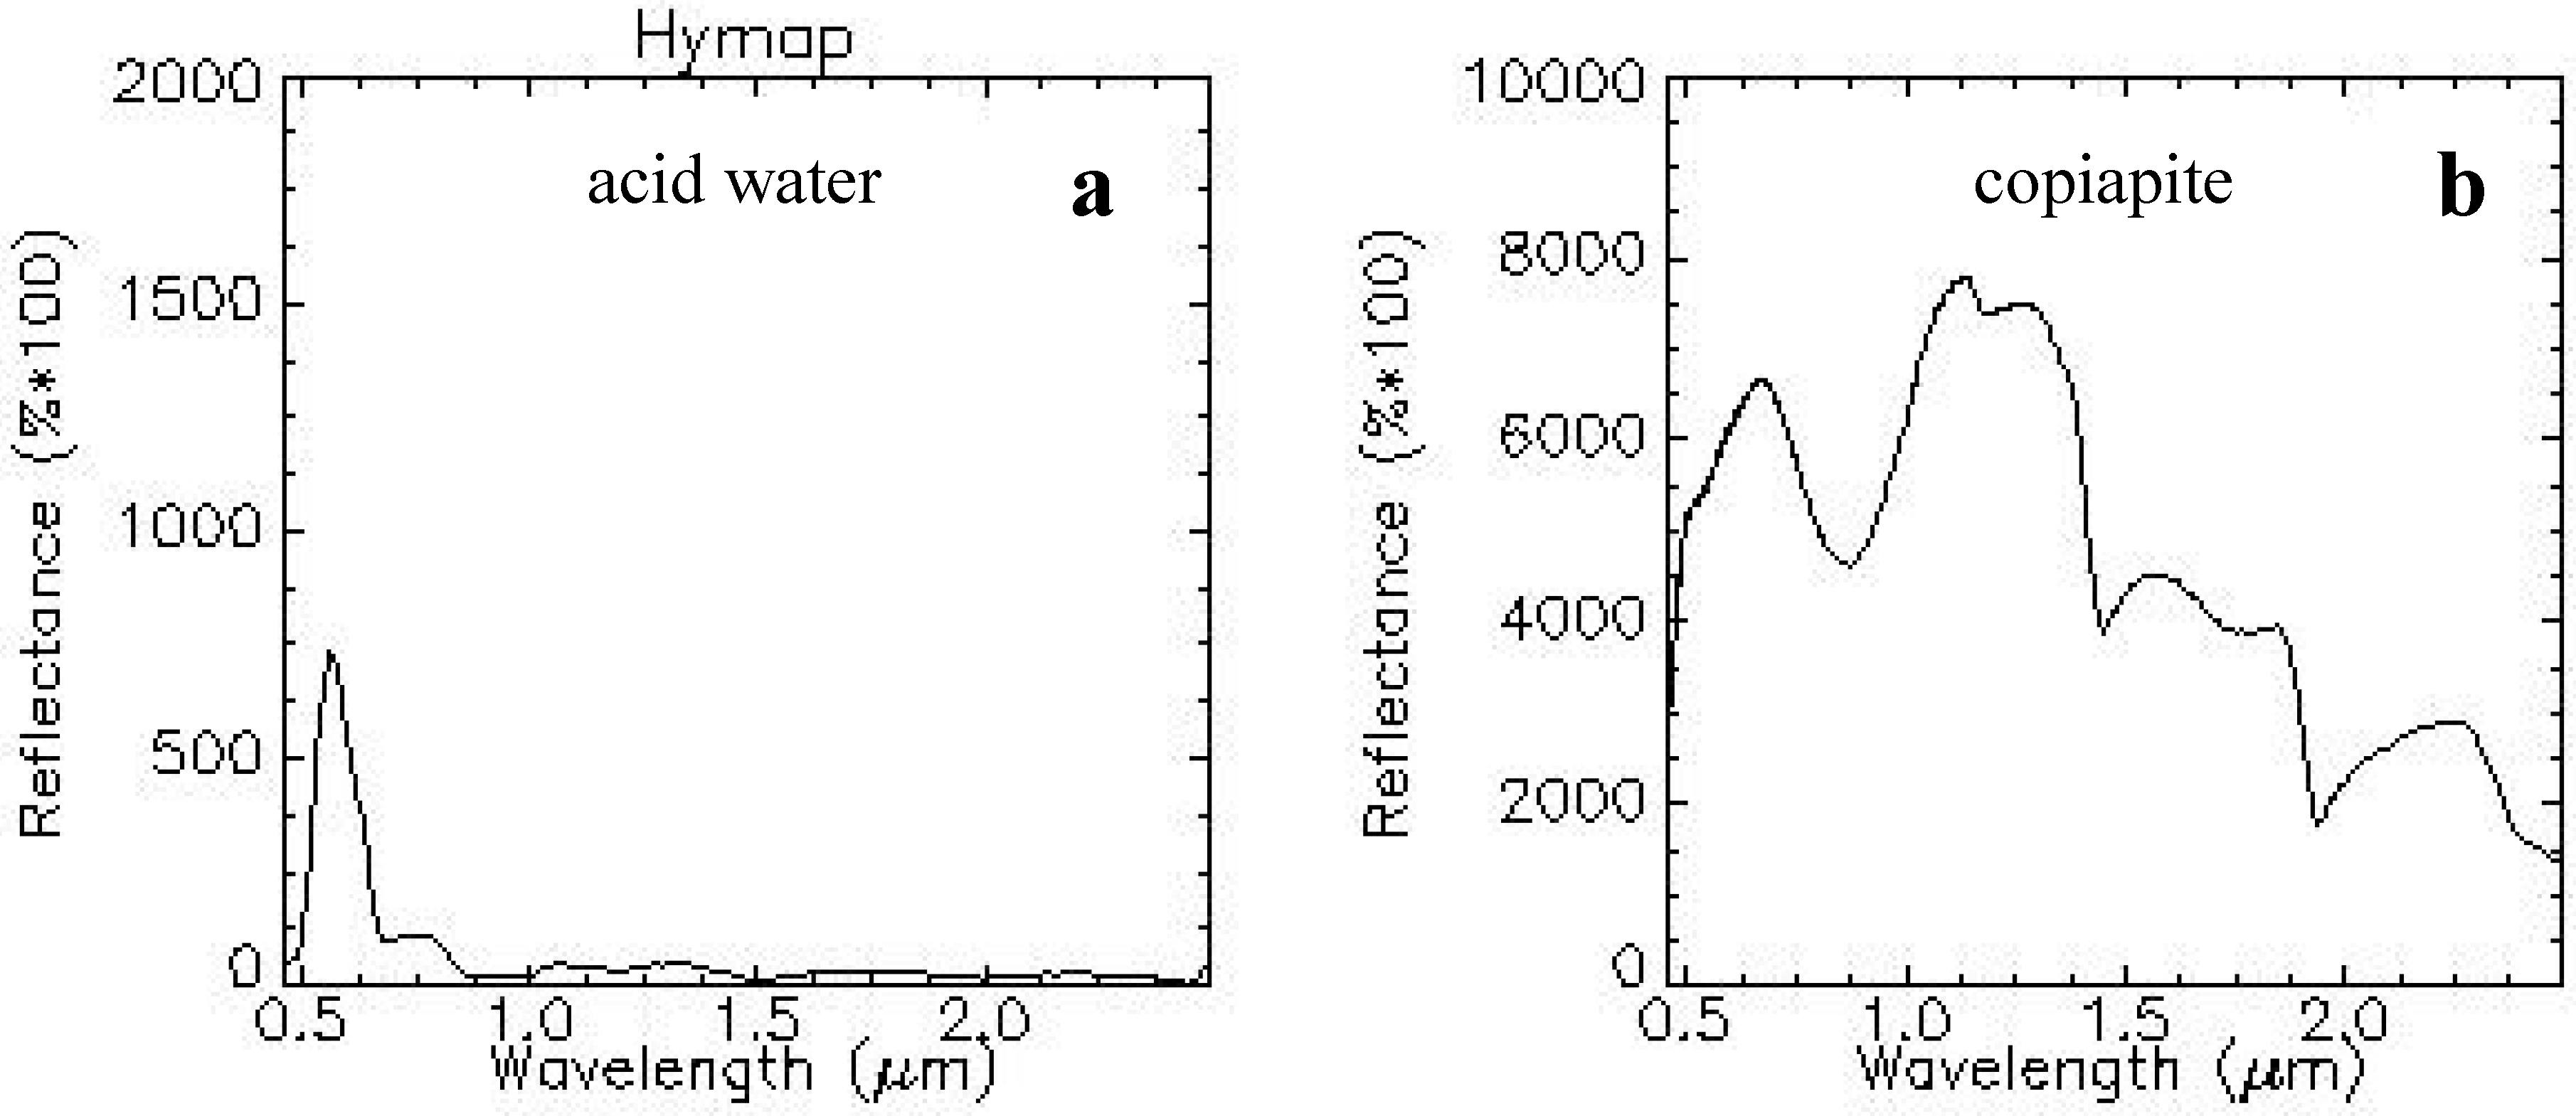
The most common spectral misinterpretation is the inadvertent mapping of acid water as several hydrated sulfate mineralogical phases (
Figure 3). Water is often difficult to distinguish from land, since it covers a small surface area at mine sites and drainages; and accurate mapping of water often requires several iterations of image processing algorithms.
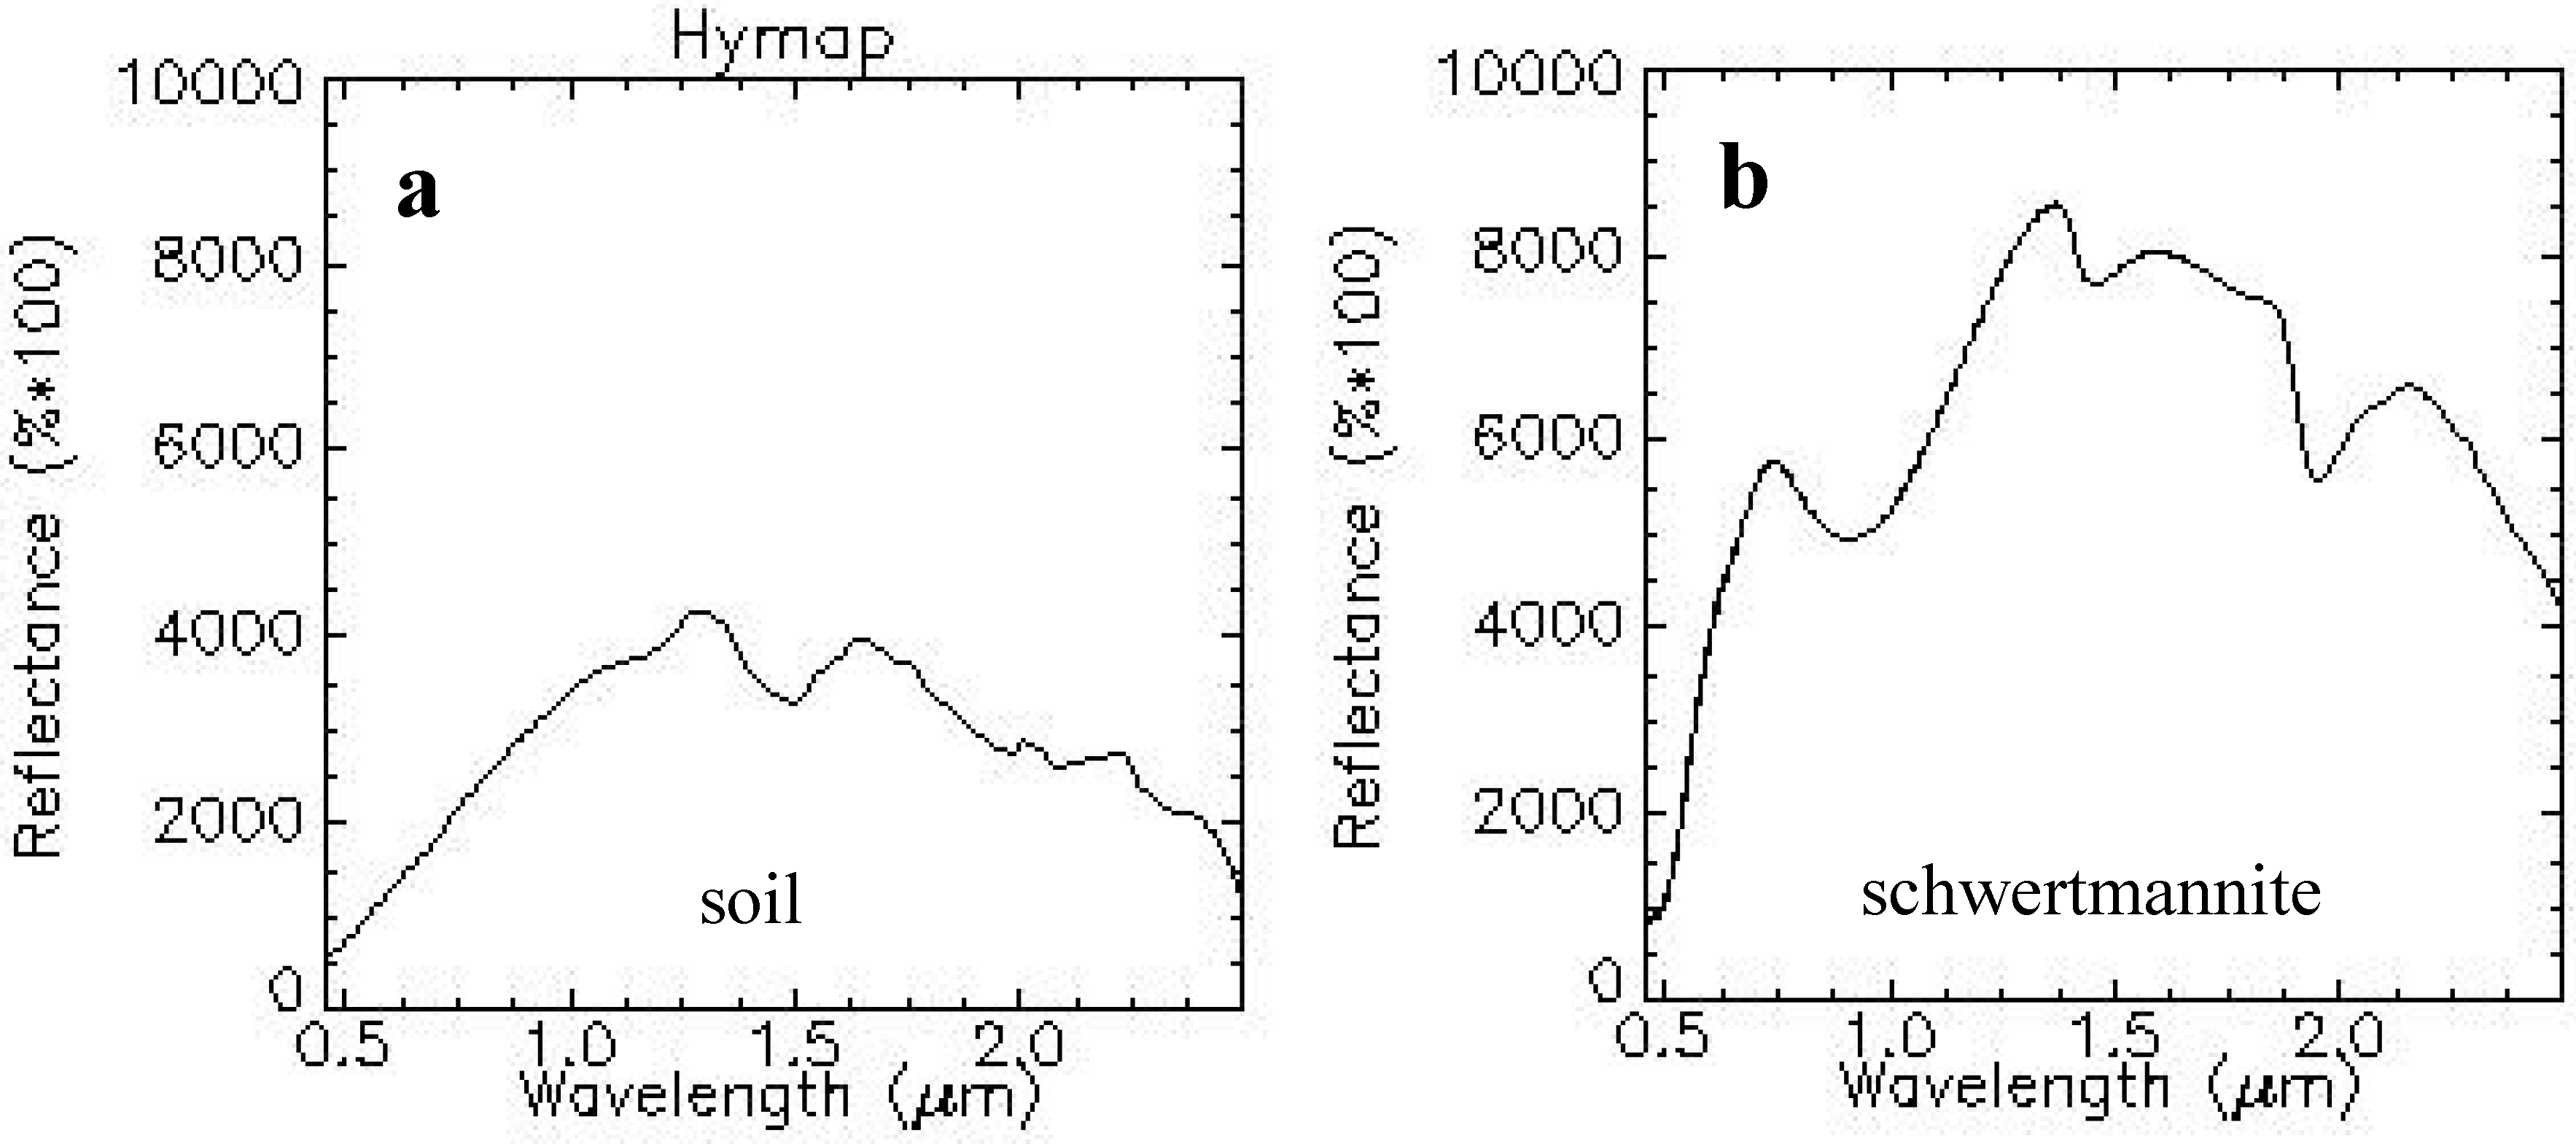
Spectra obtained for the soil covering outcrops of the Vulcano-Sedimentary Complex, which hosts the massive sulfide ore deposits, are similar to spectra obtained for the oxidized mineralogical phases of the pyrite weathering process. In contrast, the spectra of background soil reveal a typical linear ascending response in the visible region, and lack the spectral features of iron-bearing sulfate (
Figure 4(a)). Still, it is remarkably close to the spectra of schwertmannite (among the minerals included in the reference spectral library) (
Figure 4(b)), and can be misidentified if the mapped subscene is not properly isolated (e.g., spatially; through the use of a mask; or by geological context). Schwertmannite is a mineral which is generated by precipitation from acid waters associated with acid mine drainages. It also occurs in dumps, and on slopes which are more intensely washed by rain, and undergoes rapid dissolution and reprecipitation processes during the wet season.
Figure 3.
(a) Spectra from acid water extracted from Hymap data
(b) Spectra from copiapite (Fe
2+Fe
3+4(SO
4)
6(OH)
2·20(H
2O)) resampled to Hymap data [
7].
Figure 3.
(a) Spectra from acid water extracted from Hymap data
(b) Spectra from copiapite (Fe
2+Fe
3+4(SO
4)
6(OH)
2·20(H
2O)) resampled to Hymap data [
7].
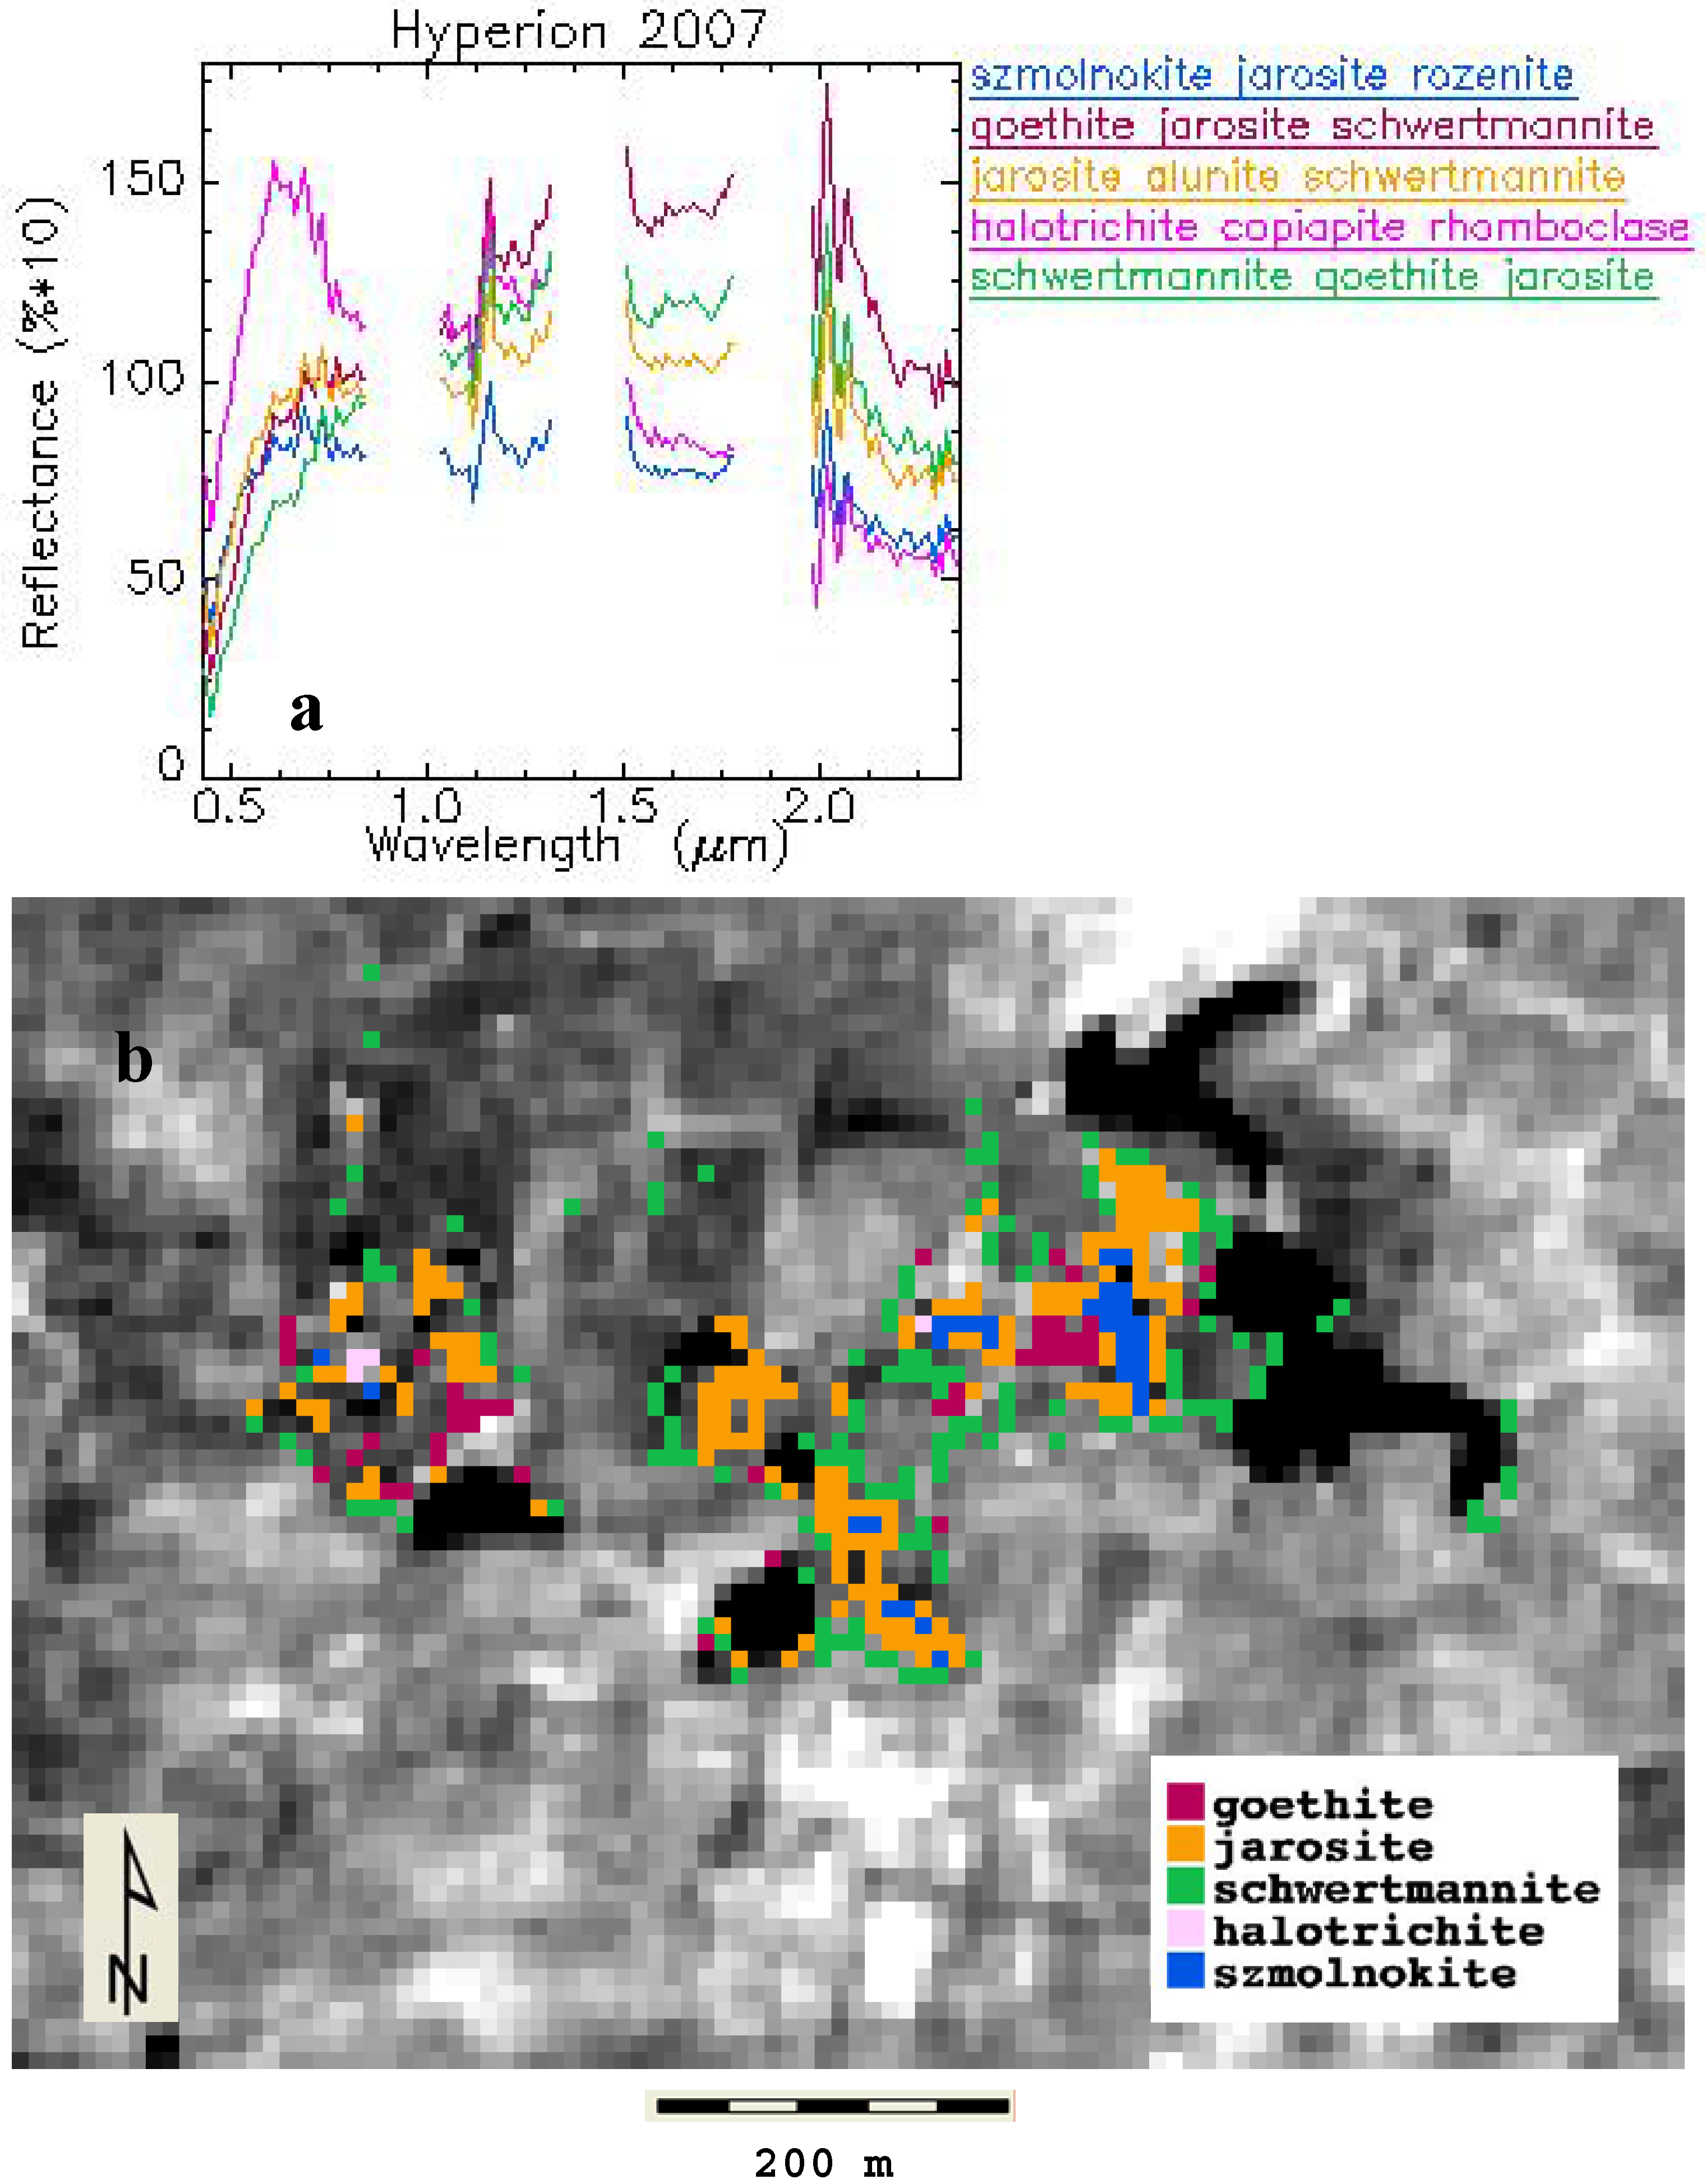
Most diagnostics made by the Spectral Analyst for the most oxidized areas identified jarosite, goethite, schwertmannite and, very rarely, hematite, regardless of whether data were obtained from airborne or spaceborne imagery, or field or laboratory spectra. Schwertmannite is not expected to be common in mine dumps, since it precipitates from acid water, and should thus be more prevalent along acid mine drainages. However, most of the slopes near the mine dumps were diagnosed as containing schwertmannite as the main mineral. This diagnosis may be a response to the presence of a mixture of minerals, and/or shade effects, which were identified as schwertmannite.
Figure 4.
(a) Spectra from soil over the host rock extracted from Hymap data
(b) Spectra from schwertmannite Fe
3+16O
16(OH)
12(SO
4)
2 resampled to Hymap data [
7].
Figure 4.
(a) Spectra from soil over the host rock extracted from Hymap data
(b) Spectra from schwertmannite Fe
3+16O
16(OH)
12(SO
4)
2 resampled to Hymap data [
7].
The most frequent diagnosis in hydrated areas was alunite, when this mineral was included in the reference spectral library. Alunite is not a product of pyrite weathering, but is present around mine sites which use potassium and aluminum-based chemical products for ore processing. However, when alunite was not included in the spectral reference library, copiapite was the most abundant diagnosis in hydrated areas, both in mine dumps and river sediments. Halotrichite and szmolnokite may occur in mill tailings, which contain huge masses of pyrite mud with a superficial crust of white sulfate.
When ascertaining the spatial area where pyrite oxidation products are likely to occur, and/or evaluating their geological pattern using mineralogical diagnostic tools and a suitable spectral library, it must be assumed that the reference library does not include all possible substances present on the mapped surface. Thus, maps should always be treated as necessarily simplified versions of reality.
Therefore, careful evaluation of both the geological context and spectral reference library is necessary to produce adequate maps of pyrite weathering stages for mine dumps and river sediments.
5.2. The Influence of the Atmospheric Correction Method
The creation of maps from the spectral properties obtained for the surface of the earth requires reflectance data. Specifically, data from airborne and spaceborne sensors is converted to reflectance by radiometrically correcting for the influence of the atmosphere, solar illumination, sensor viewing geometry, and the topography of the terrain (i.e., from elevation data), using ground spectra. Selection of homogeneous and representative calibration targets is critical for successful atmospheric correction of visible and near infrared data. The availability of spectrally homogeneous areas which are wide enough for use as calibration targets is particularly difficult when correcting low spatial resolution spaceborne data, such as from Hyperion.
As an example, data from a real life mapping case of a mine site, created using spaceborne Hyperion data collected on 10 September 2006, was radiometrically corrected using different methods. A map created using digitally processed Hymap data, collected on 13 August 2009 (
Figure 5) was used as a reference, and the influence of different atmospheric correction methods on Hyperion data was evaluated. The resulting digital map was produced through an iterative process, by extracting geological information from hyperspectral data [
5].
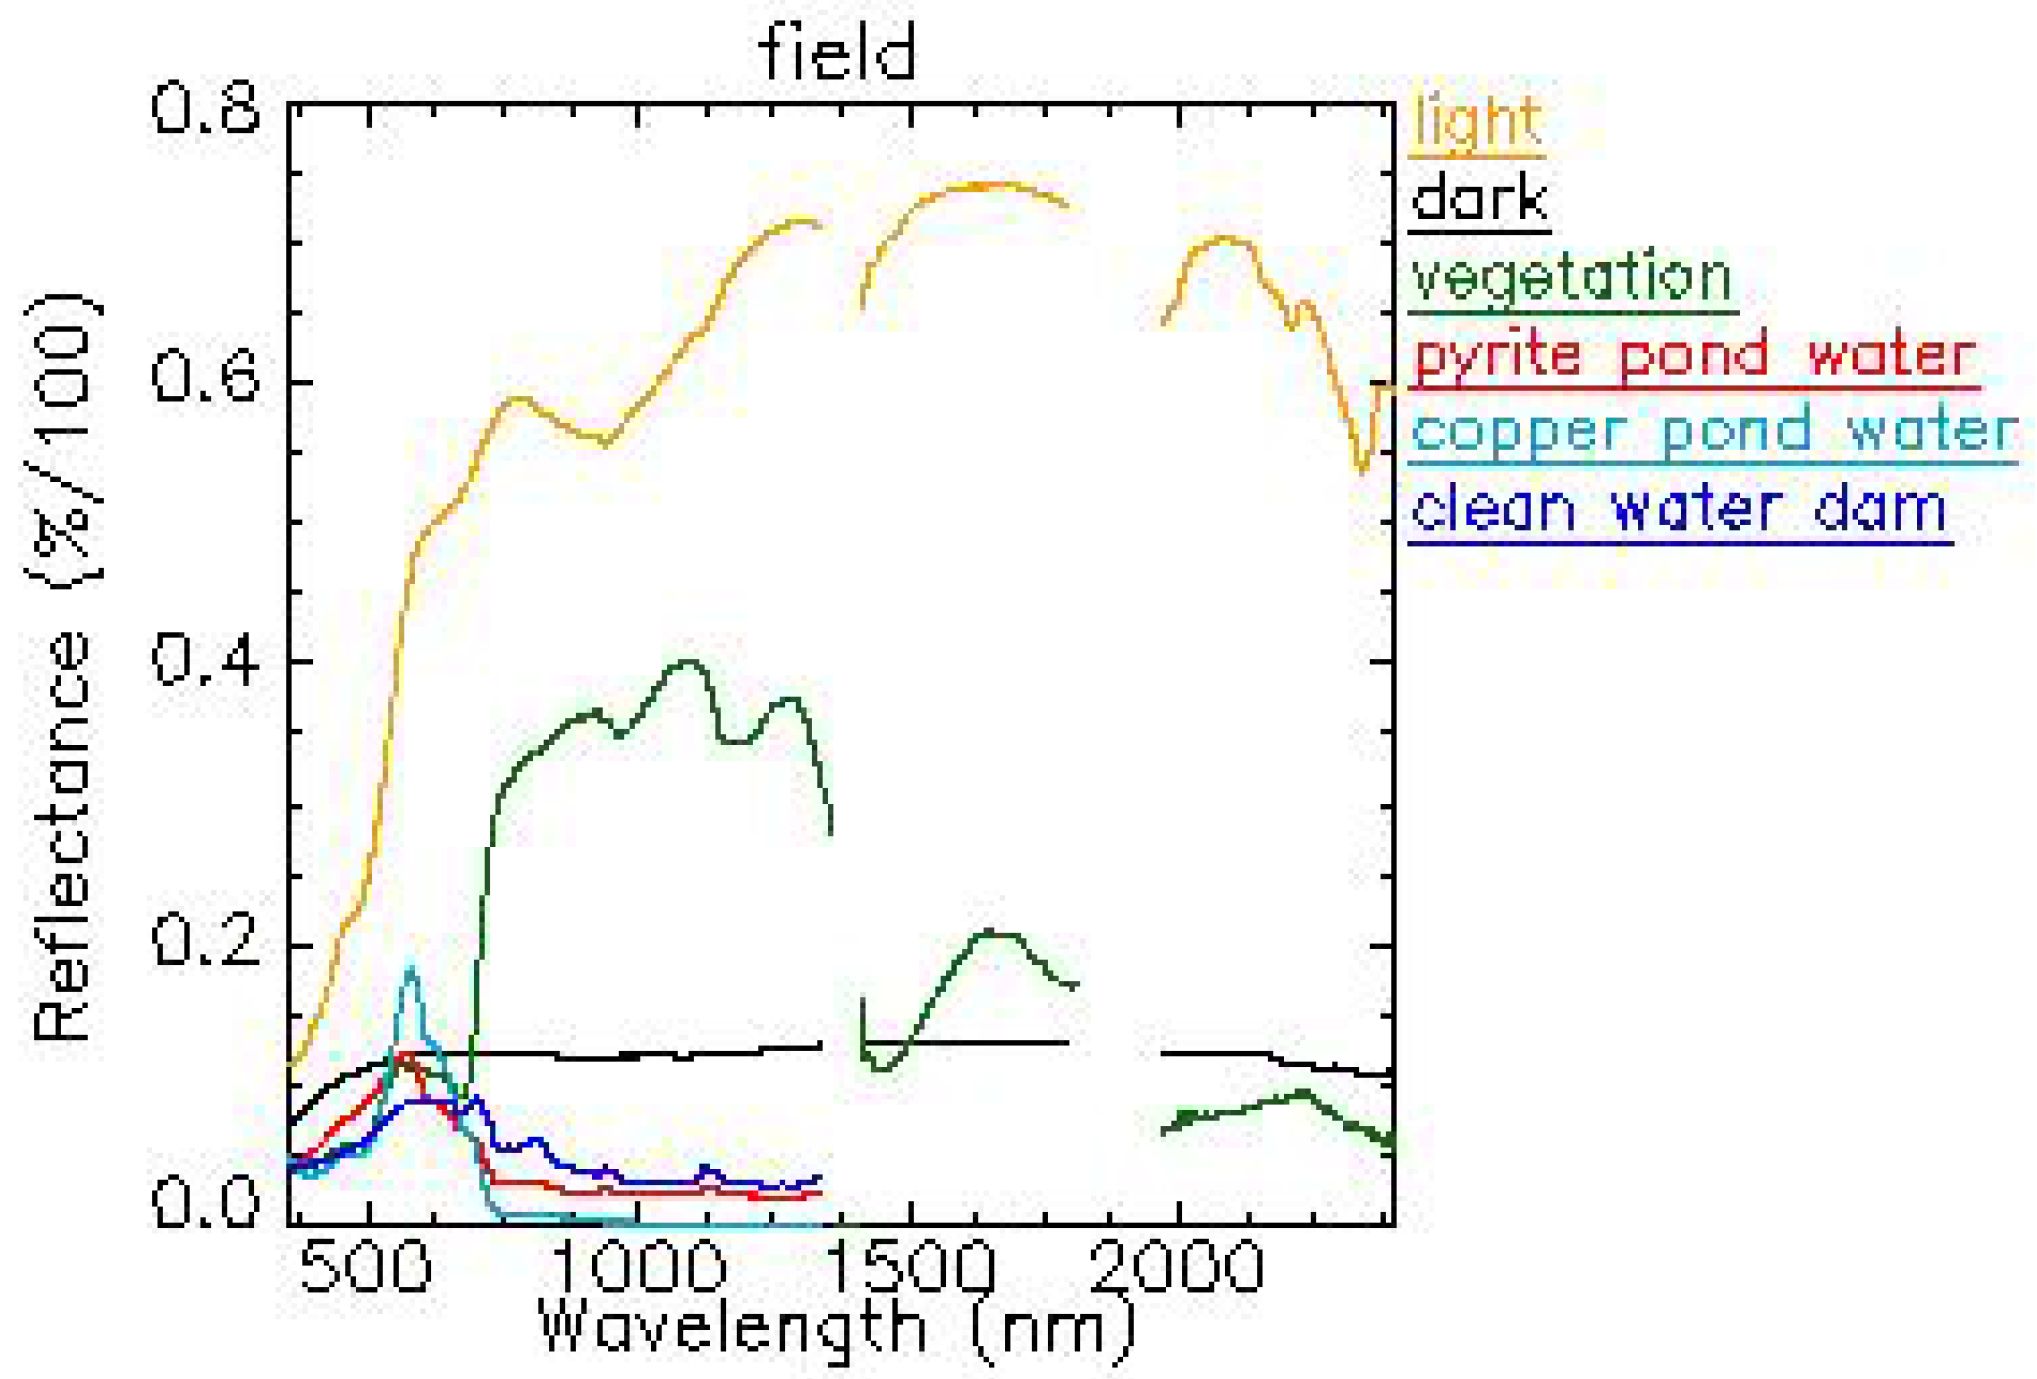
Ground spectra were collected on two light and dark targets at the edge of a small urban settlement. However, the dark target proved to be unsuccessful, because of its small size, and only the light target was not able to provide sufficient reflectance data to discriminate between mineral coatings over the mine dumps. Hence, water bodies inside the mine site, and a patch of green vegetation, were used as dark targets instead (
Figure 6).
The water bodies inside the mine site are chemically unusual. The two main open pits extracted different metals: the so-called “pyrite” open pit mined mainly iron sulfide (acid pH), and the “copper” open pit mined sulfide with abundant copper (basic pH). The water from the copper open pit drains to a series of three lixiviating ponds washing sequentially the metal contents (acid water). The remaining mill tailings ponds are now dry. Three water dams storing freshwater are located eastwards, which supplied water for mine operations. Two of them supply water to the nearby towns today (neutral pH), and the third collects sewage from them (basic pH).
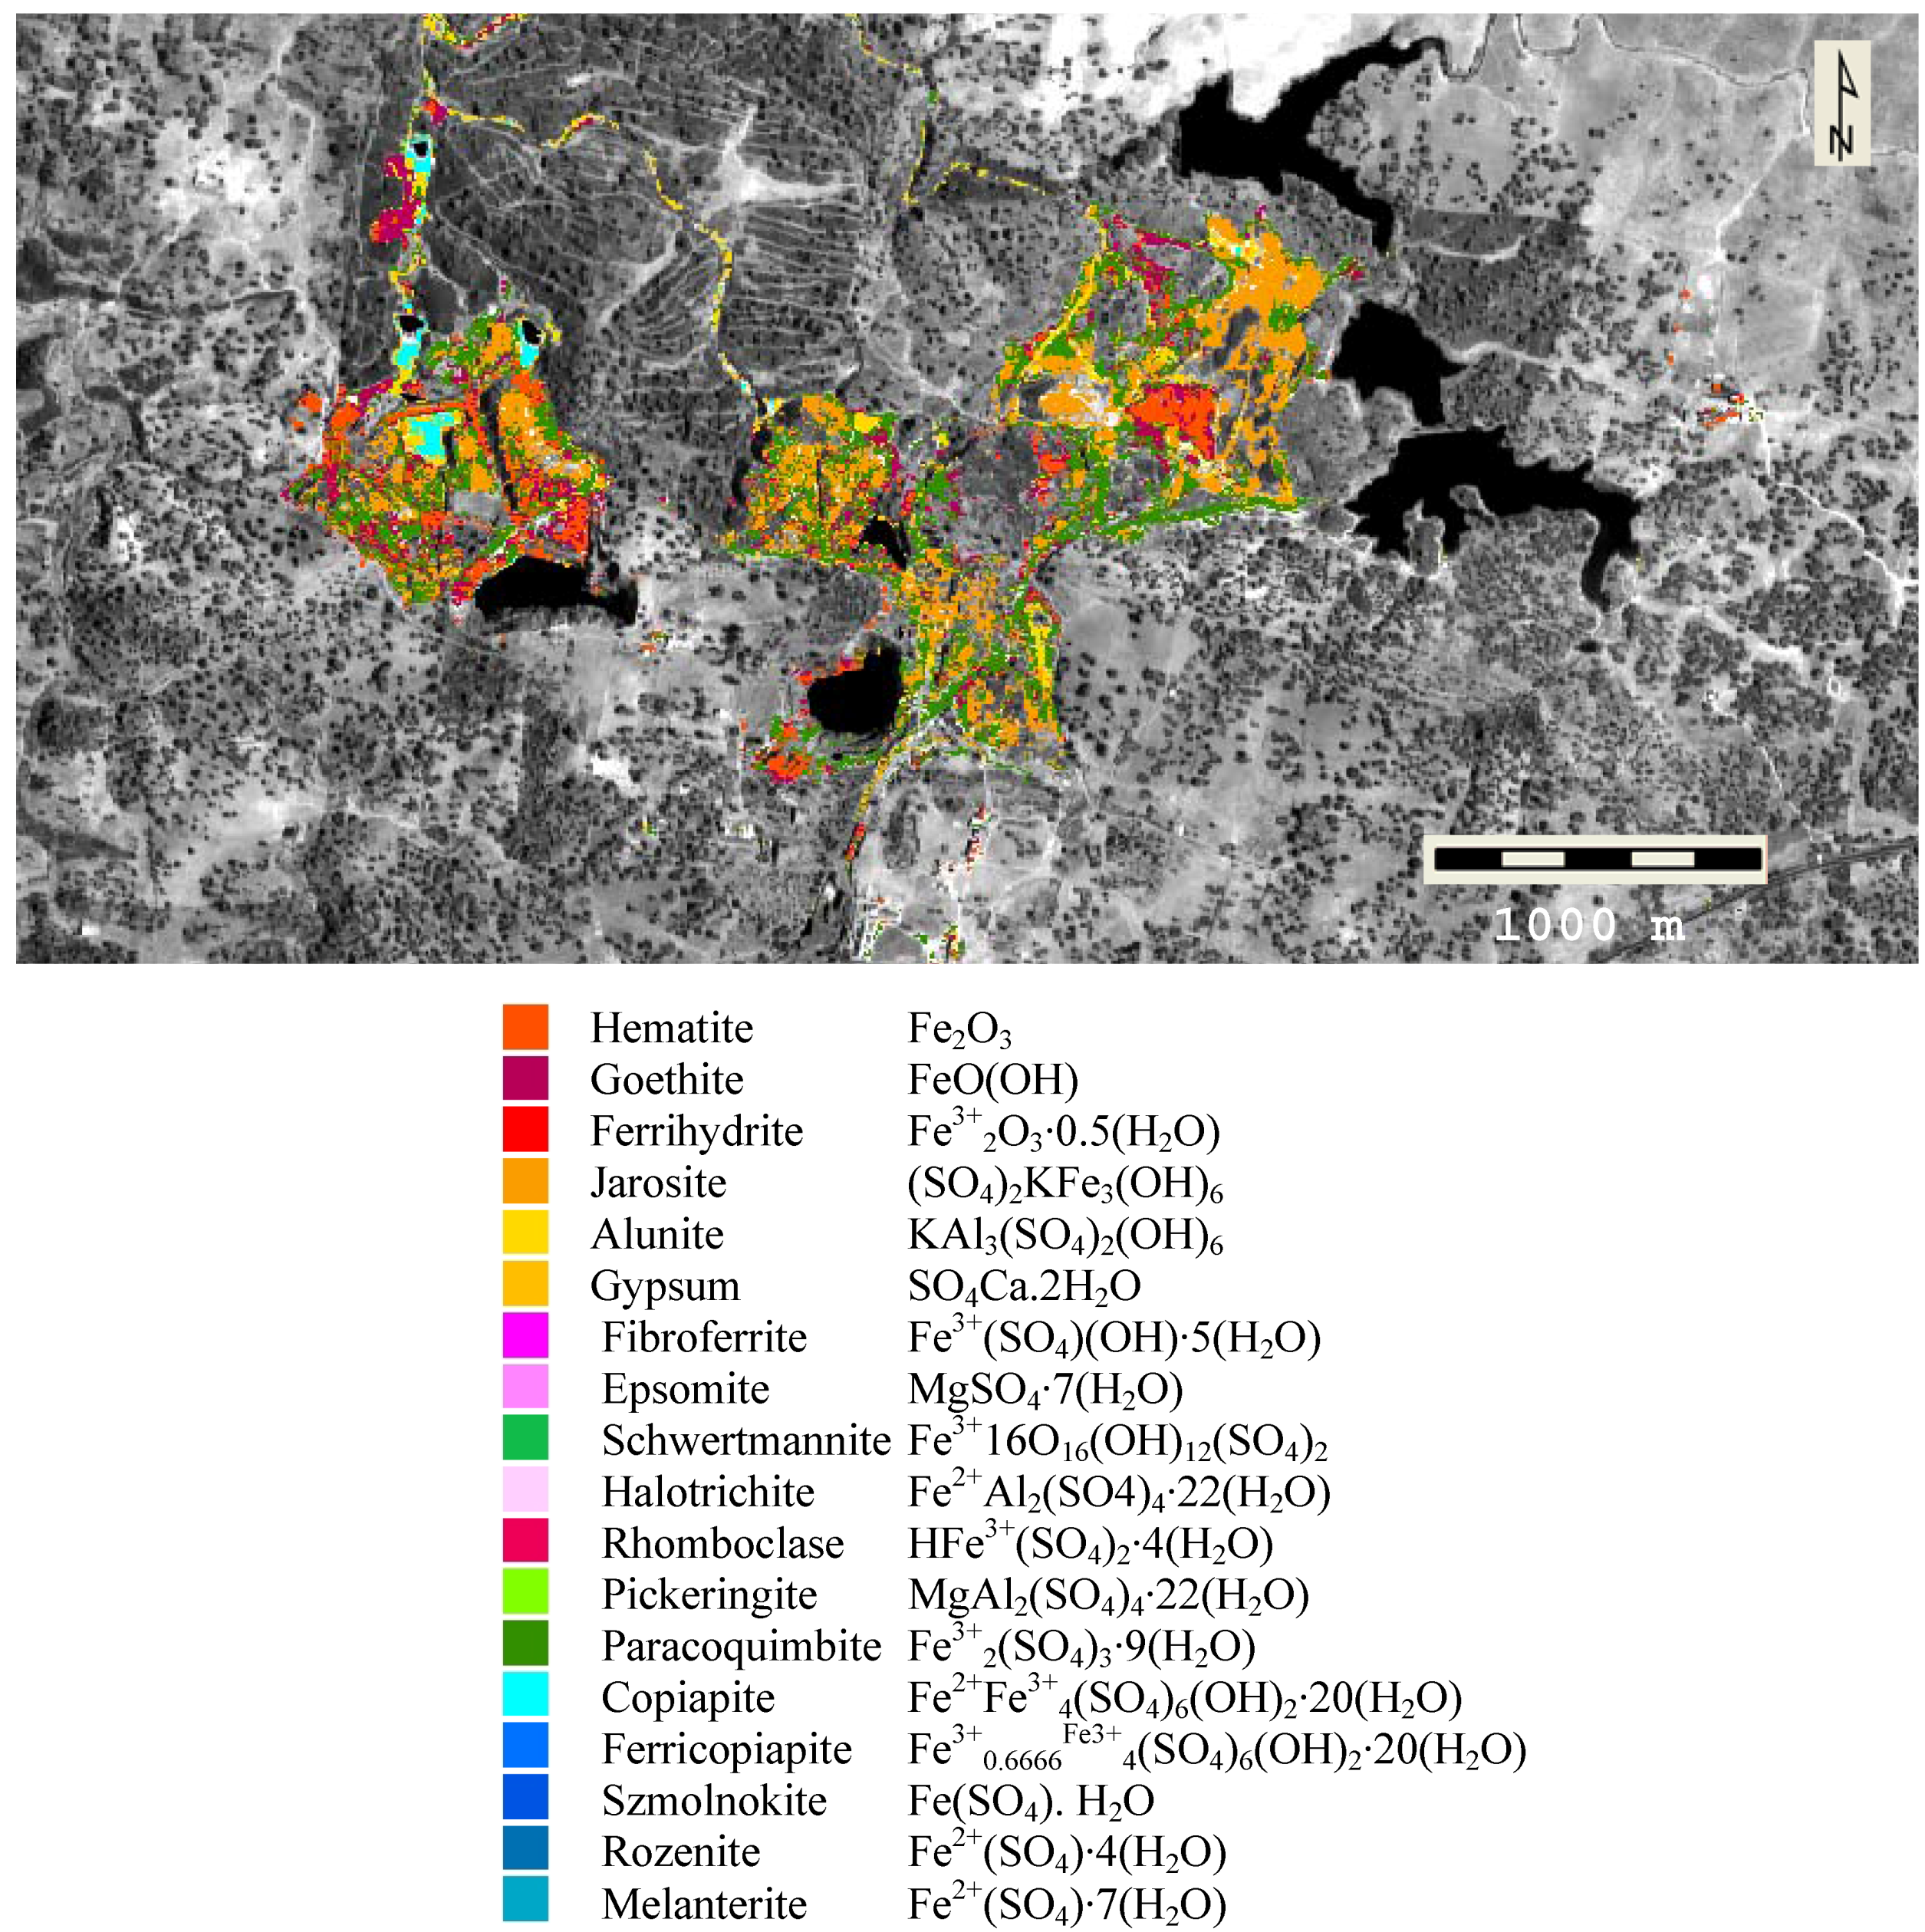
Figure 5.
Map of pyrite oxidation products from Hymap data recorded on 13 August 2009, for mine dumps from the Las Herrerias mine site. The legend includes all minerals from the reference spectral library on pyrite weathering products (Crowley
et al., [
10]).
Figure 5.
Map of pyrite oxidation products from Hymap data recorded on 13 August 2009, for mine dumps from the Las Herrerias mine site. The legend includes all minerals from the reference spectral library on pyrite weathering products (Crowley
et al., [
10]).
Figure 6.
Field spectra from calibration targets used for atmospheric corrections with the Empirical Line method.
Figure 6.
Field spectra from calibration targets used for atmospheric corrections with the Empirical Line method.
The Hyperion data was atmospherically corrected using the Empirical Line method, following a previously established iterative process [
5], and a digital map was produced. The reliability of the resulting geological units for mineralogical diagnosis of coatings over mine dumps was then tested on Hyperion data that was atmospherically corrected by various other methods (
Figure 7). Each spectrum, corresponding to a geological unit, was assigned three minerals with the highest score, based on results from the Spectral Analyst [
6], including: Spectral Angle Mapper (SAM); Spectral Feature Fitting (SFF); and Binary Encoding (BE) [
30].
Figure 7.
(a) Geological map from Hyperion data corrected with the Empirical Line method on pyrite weathering products over the mine dumps. The legend follows the trends shown on the map built from Hymap 2009 data (
Figure 5).
(b) Spectra from Hyperion data from the geological units represented on the map.
5.2.1. The Empirical Line Method
In the Empirical Line method an atmospheric correction is done [
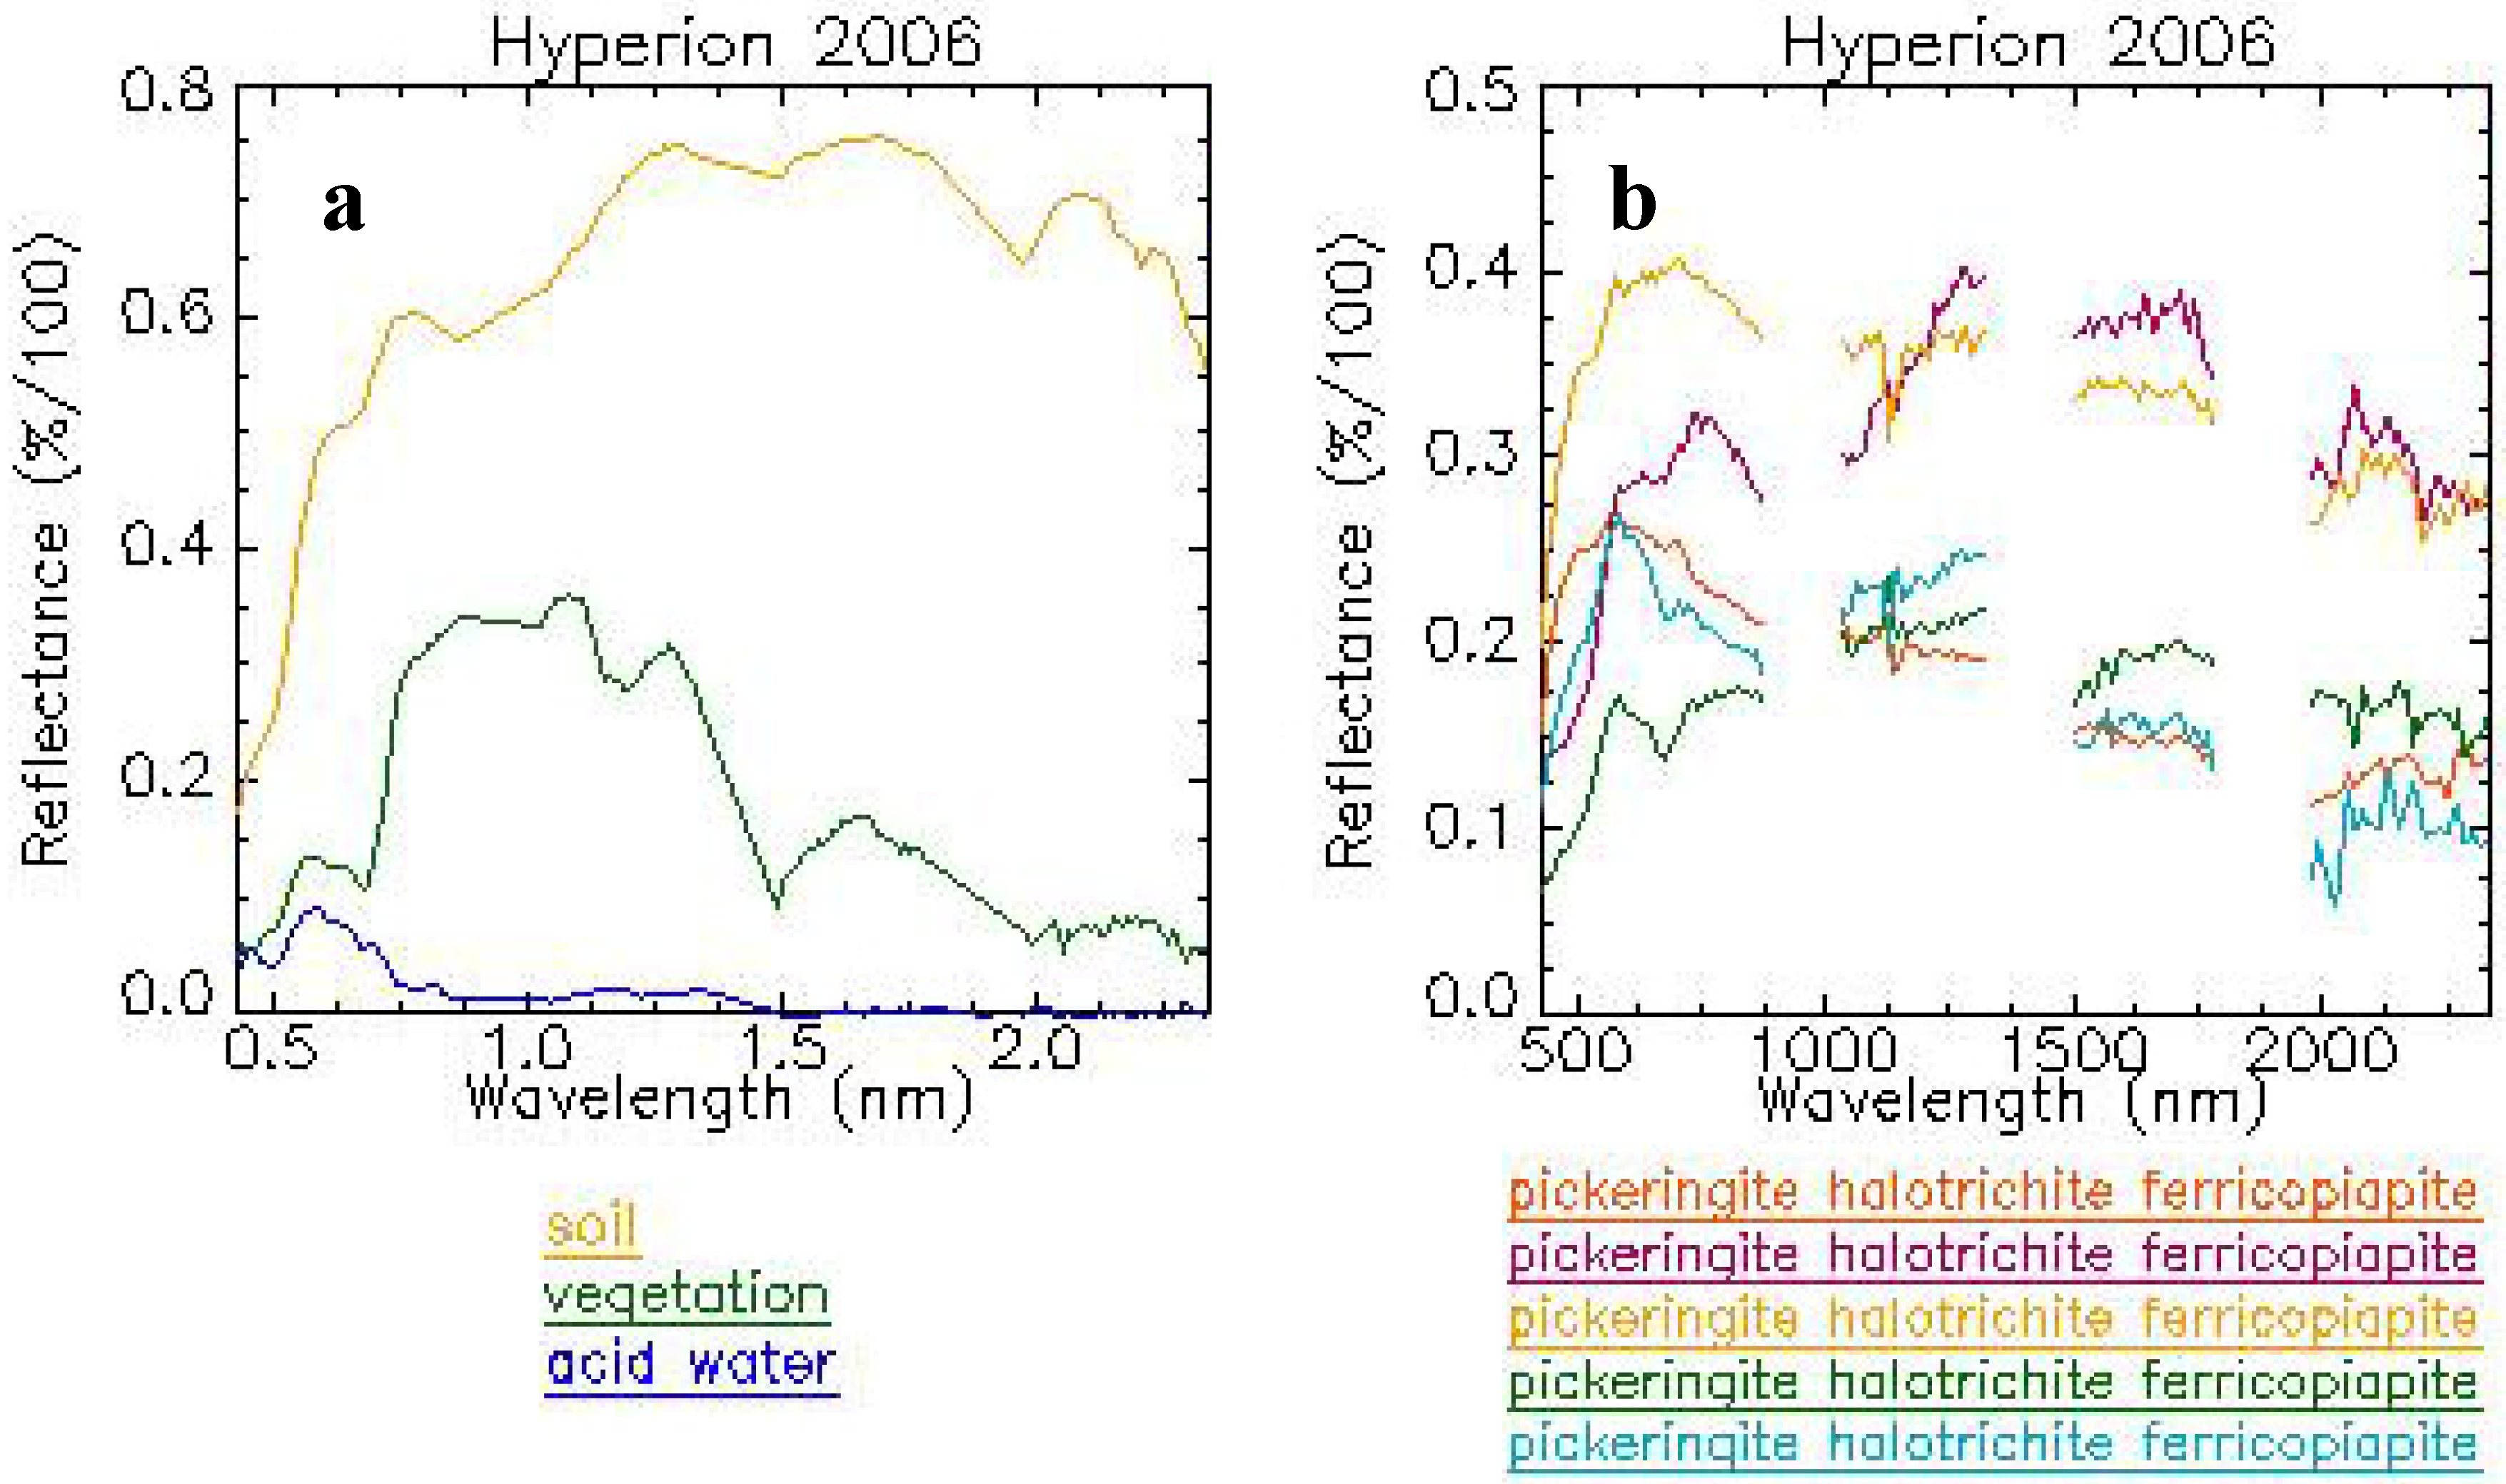
35] using five calibration targets, and produces reasonable reflectance for ordinary landcover units, such as bare soil, vegetation or water (
Figure 8(a)). However, when the Empirical Line method was used to identify minerals in Hyperion spectra from geological units, using the reference spectral library and the Spectral Analyst algorithms [
30], the entire mapped area was assigned to pickeringite, a hydrated sulfate (
Figure 8(b)). This misinterpretation is undoubtedly due to the fact that several spectra obtained for acid water bodies were used for the calibrations, since the general spectral response of acid water bodies mimics the spectral shape of hydrated sulfate [
10]. Thus, the spectral response of dehydrated sulfate and oxides are ignored when the Empirical Line method is used to atmospherically correct Hyperion data. Therefore, to quantitatively identify the minerals present in coatings over mine dumps, another radiometric correction method is necessary.
Figure 8.
(a) Spectra from corrected Hyperion data with the Empirical Line method on broad landcover units.
(b) Spectra from Hyperion data on the geological units represented on the map (
Figure 7(a)), diagnosed mineralogically with the Spectral analyst and the reference spectral library [
7].
Figure 8.
(a) Spectra from corrected Hyperion data with the Empirical Line method on broad landcover units.
(b) Spectra from Hyperion data on the geological units represented on the map (
Figure 7(a)), diagnosed mineralogically with the Spectral analyst and the reference spectral library [
7].
5.2.2. Airborne Atmospheric and Topographic Correction Model (ATCOR4)
The areas mapped with the Empirical Line method showed too uniform mineralogical diagnosis. As previously experienced with laboratory data [
6], the algorithms used on the mineralogical diagnosis are not equally efficient on their individual scores identifying one spectrum from the spectral library as the most suitable. In many cases, small spectral changes can be identified using only one of the diagnosing algorithms which appears on second or third range on the mineralogical diagnosis series [
35]. Thus, significant geological variations can be better expressed through the map, responding to the previous climatic record on the area.
This assumption encouraged the interpretation of Hyperion datasets which were atmospherically corrected with different ground spectra and different ground target areas, using the Airborne Atmospheric and Topographic Correction Model. This model, using ground spectra to correct atmospherically hyperspectral imagery, includes additional physical parameters resulting on reflectance which was expected more informative about the geological units.
The software ATCOR4 [
37] was also used for atmospheric corrections, with a midsummer rural aerosol and a visibility of 80 m, under the flat terrain correction mode. The water vapor column was 3.07 cm.
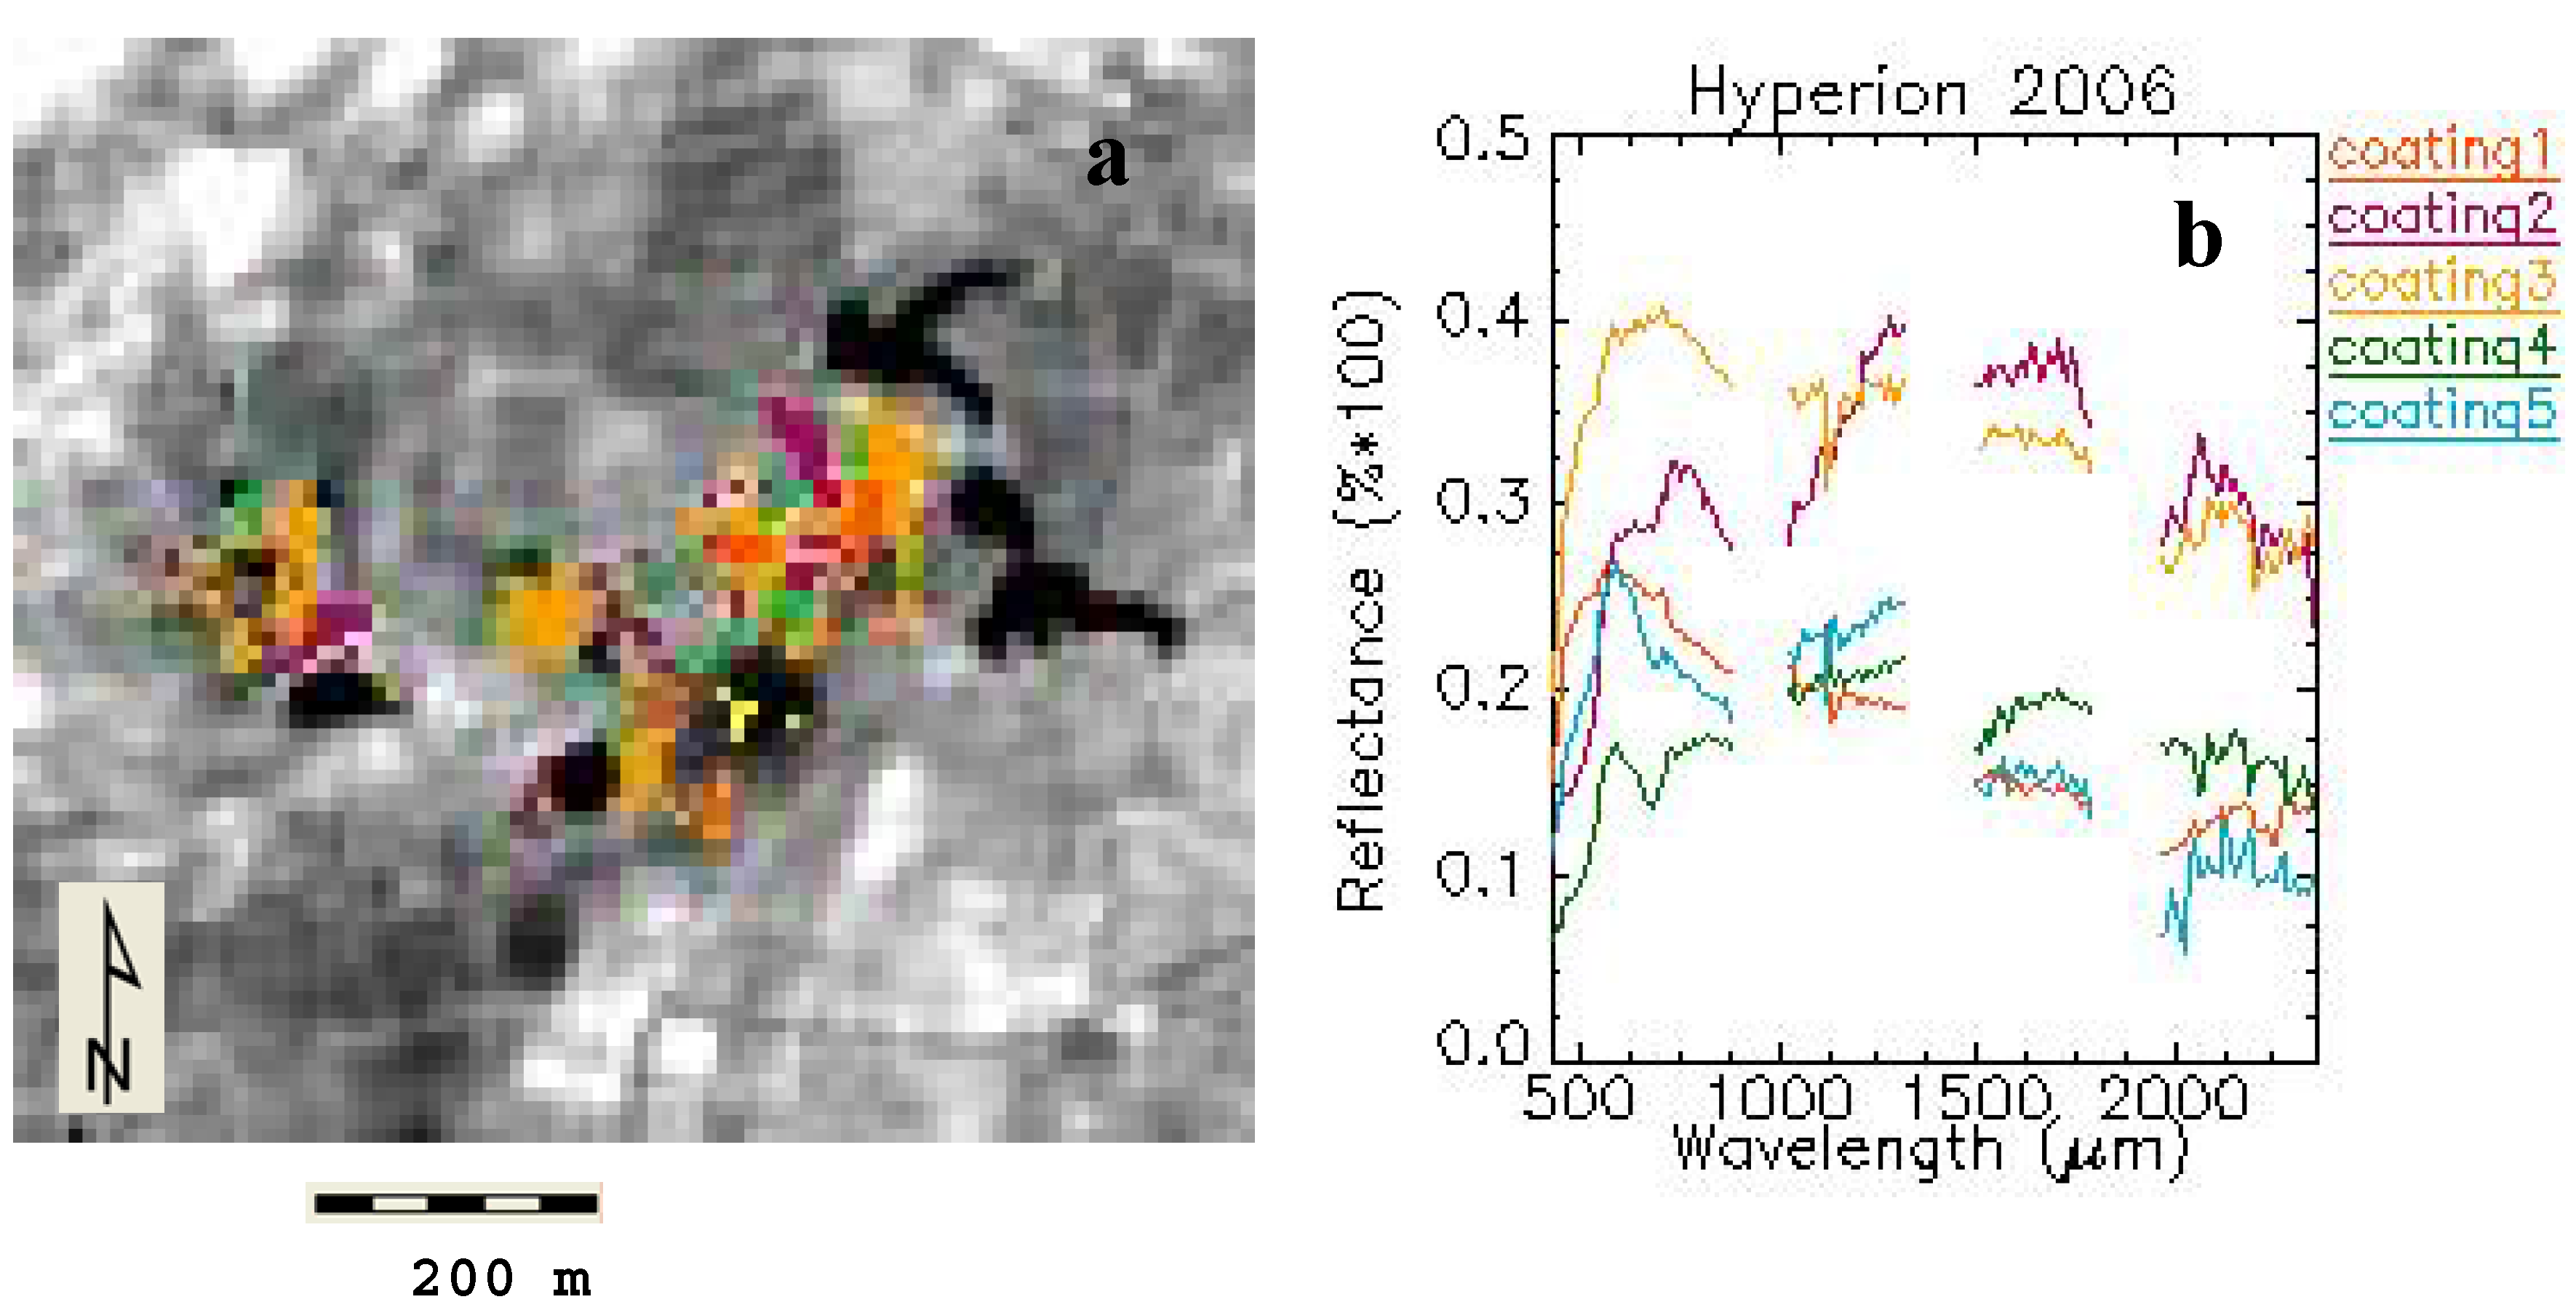
Figure 9.
(a) Spectra from Hyperion data corrected with ATCOR4 on the Las Herrerias mine site, collected on 24 August 2007, using one light and one dark calibration target and the flat terrain mode. The legend follows the trends shown on the map built from Hymap 2009 data (
Figure 5).
(b) Map built from Hyperion 2007 data corrected with ATCOR4 (one light and one dark target) with geological units diagnosed mineralogically with the Spectral Analyst (RSI, [
35]) and the reference spectral library on pyrite weathering products (Crowley
et al., [
10]), taking into account variable results from every diagnosing algorithm (Riaza
et al., [
6]).
As with the Empirical Line method, a first attempt to use the light calibration target was made (
Figure 6). The second attempt included one light and one dark target (vegetation) for calibration. Finally, 4 calibration targets, including water bodies and vegetation (
Figure 6), were used for atmospheric correction with calibration regression (
Figure 6). Mineral identifications on this corrected map were made using the Spectral Analyst [
35] and the reference spectral library [
7] aiming to interpret the mineralogical changes on the area of study (
Figure 9).
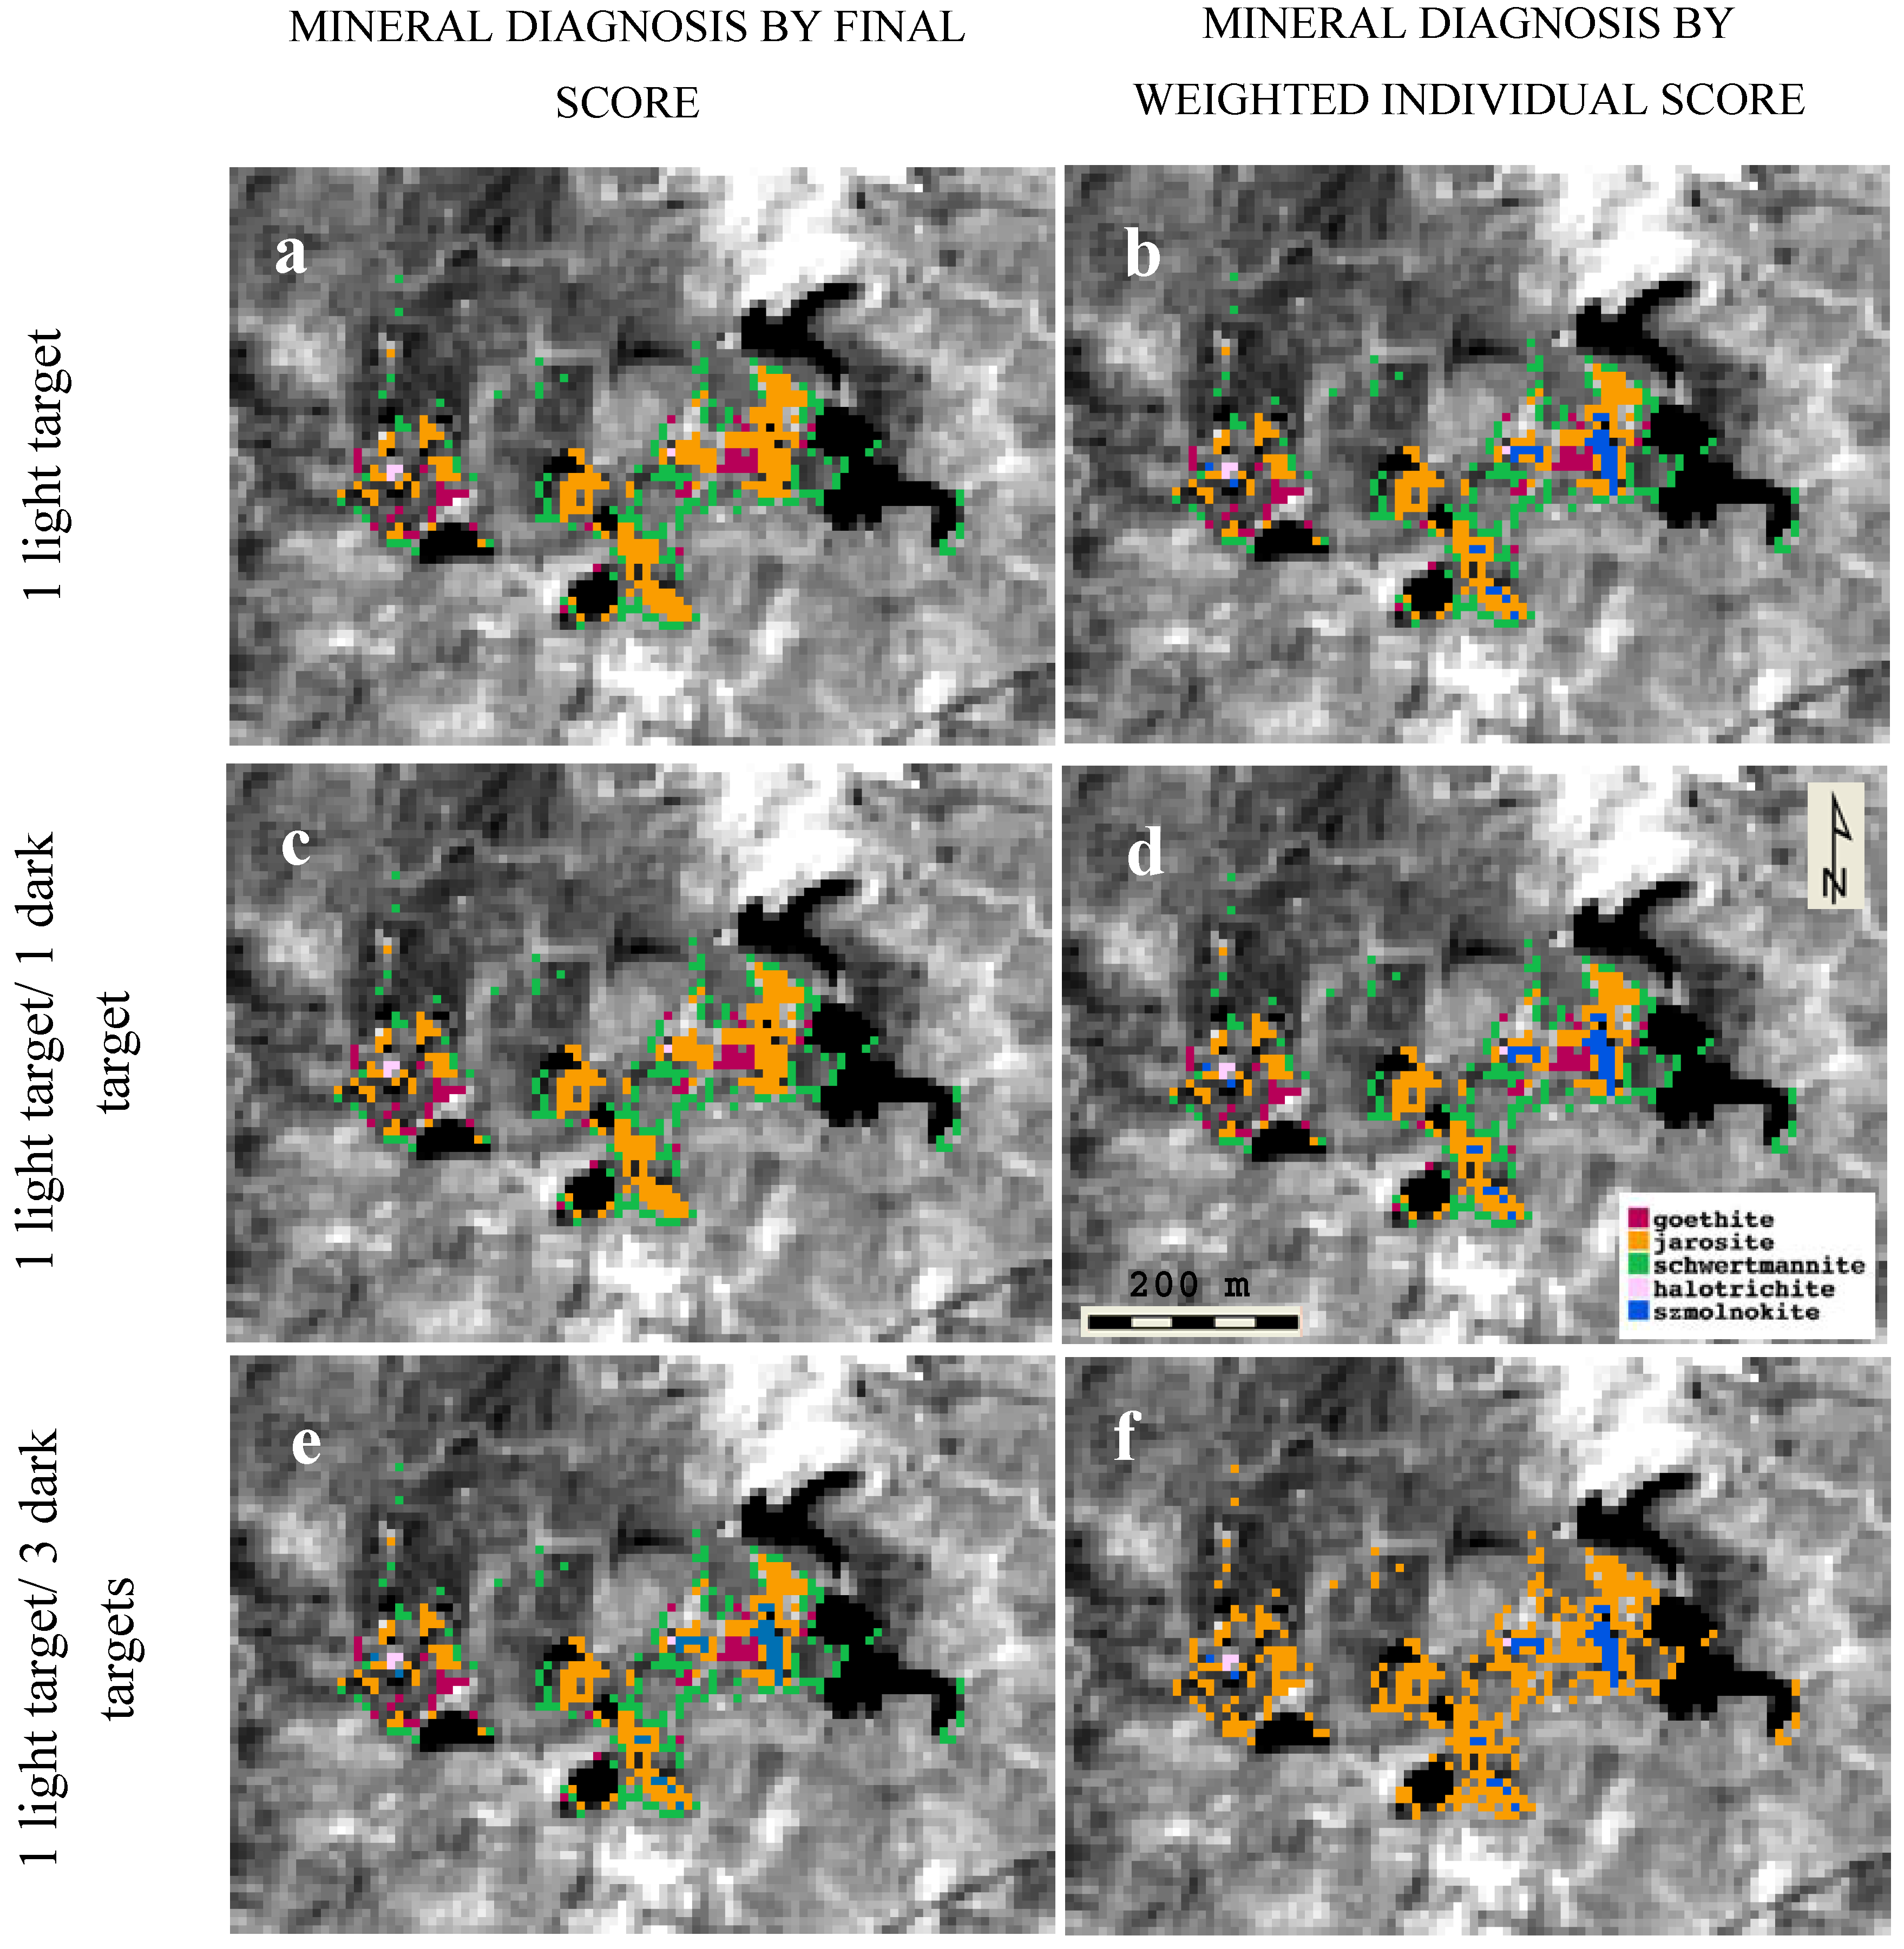
Figure 10.
Maps from Hyperion data corrected with ATCOR4 on the Las Herrerias mine site from 24 August 2007, using the flat terrain mode. The legend follows the trends shown on the map built from Hymap 2009 data (
Figure 5).
(a) and
(b) Using one light calibration target.
(c) and
(d) Using one light and one dark calibration targets.
(e) and
(f) Using one light and three dark calibration targets. (a), (c) and (e) Geological units diagnosed mineralogically with the Spectral Analyst (RSI, [
35]) and the reference spectral library on pyrite weathering products (Crowley
et al., [
10]), taking into account the diagnosing final score. (b) (d) and (f) Geological units diagnosed following weighted individual scores from every diagnosing algorithm (Riaza
et al., [
6]).
As a result, the map which was corrected using one calibration target identified only hydrated sulfate, which is lacking in the rest of the maps (
Figure 10(a)). In contrast, maps corrected using additional targets were progressively more oxidized (
Figure 10(c,e)). A quantitative evaluation of the results from the Spectral Analyst [
35], taking into account variable results from each diagnosing algorithm in addition to the final score [
6], produced different maps (
Figure 10(b,d,f)), and a far more detailed geological interpretation.
Mineral diagnoses conducted on the map produced with one light calibration target, using weighted scores from the individual diagnosing algorithms, highlighted areas with hydrated sulfate (Figure 10(b)) significantly more than mineralogical diagnoses conducted using only the final score from the Spectral Analyst (
Figure 10(a)). A higher oxidation state is shown on the map computed from data calibrated with one light and one dark target (vegetation), which also identified hydrated sulfate around small ponds (
Figure 10(c)).
Maps of geological units computed with four calibration targets were quite diverse (
Figure 10(e,f)). If mineralogical diagnoses were conducted using only the final score, the resulting map is quite varied (
Figure 10(e)) and resembles
Figure 10(d); although with slight changes to the hydration state of the most hydrated areas. When using variations of the three diagnosing algorithms (
Figure 10(e)), the maps oxidize completely, and only the most hydrated areas remain as hydrated sulfate.
Therefore, a more physically reasonable map was computed for Hyperion data that was corrected with one light target and one vegetation dark target (
Figure 10(d)), followed by mineral diagnosis using individual scores produced by the three algorithms employed by the Spectral Analyst (Spectral Angle Mapper, Spectral Feature Fitting and Binary Encoding) [
26].
Based on this dataset, the conclusion is that using four calibration targets disguises both hydrated sulfate and oxidized areas (
Figure 10(e,f)); while the use of only one light calibration target overestimates hydrated sulfate (
Figure 10(a,b)). The use of one light and one dark target gives the most balanced map (
Figure 10(d)).
5.3. The Spatial Heterogeneity of Coatings on Mine Sites and River Sediments
Mine sites in the Iberian Pyrite Belt are mostly restricted to hundreds of meters, excluding the Rio Tinto mine site. Such areas are populated with a variety of minor domains, each with a different geochemical evolution: mine dumps; water ponds and dams; mill tailings; and ore processing plants, which are also surrounded by small ponds of tailings. In most cases, each individual domain occupies a space of tens of meters.
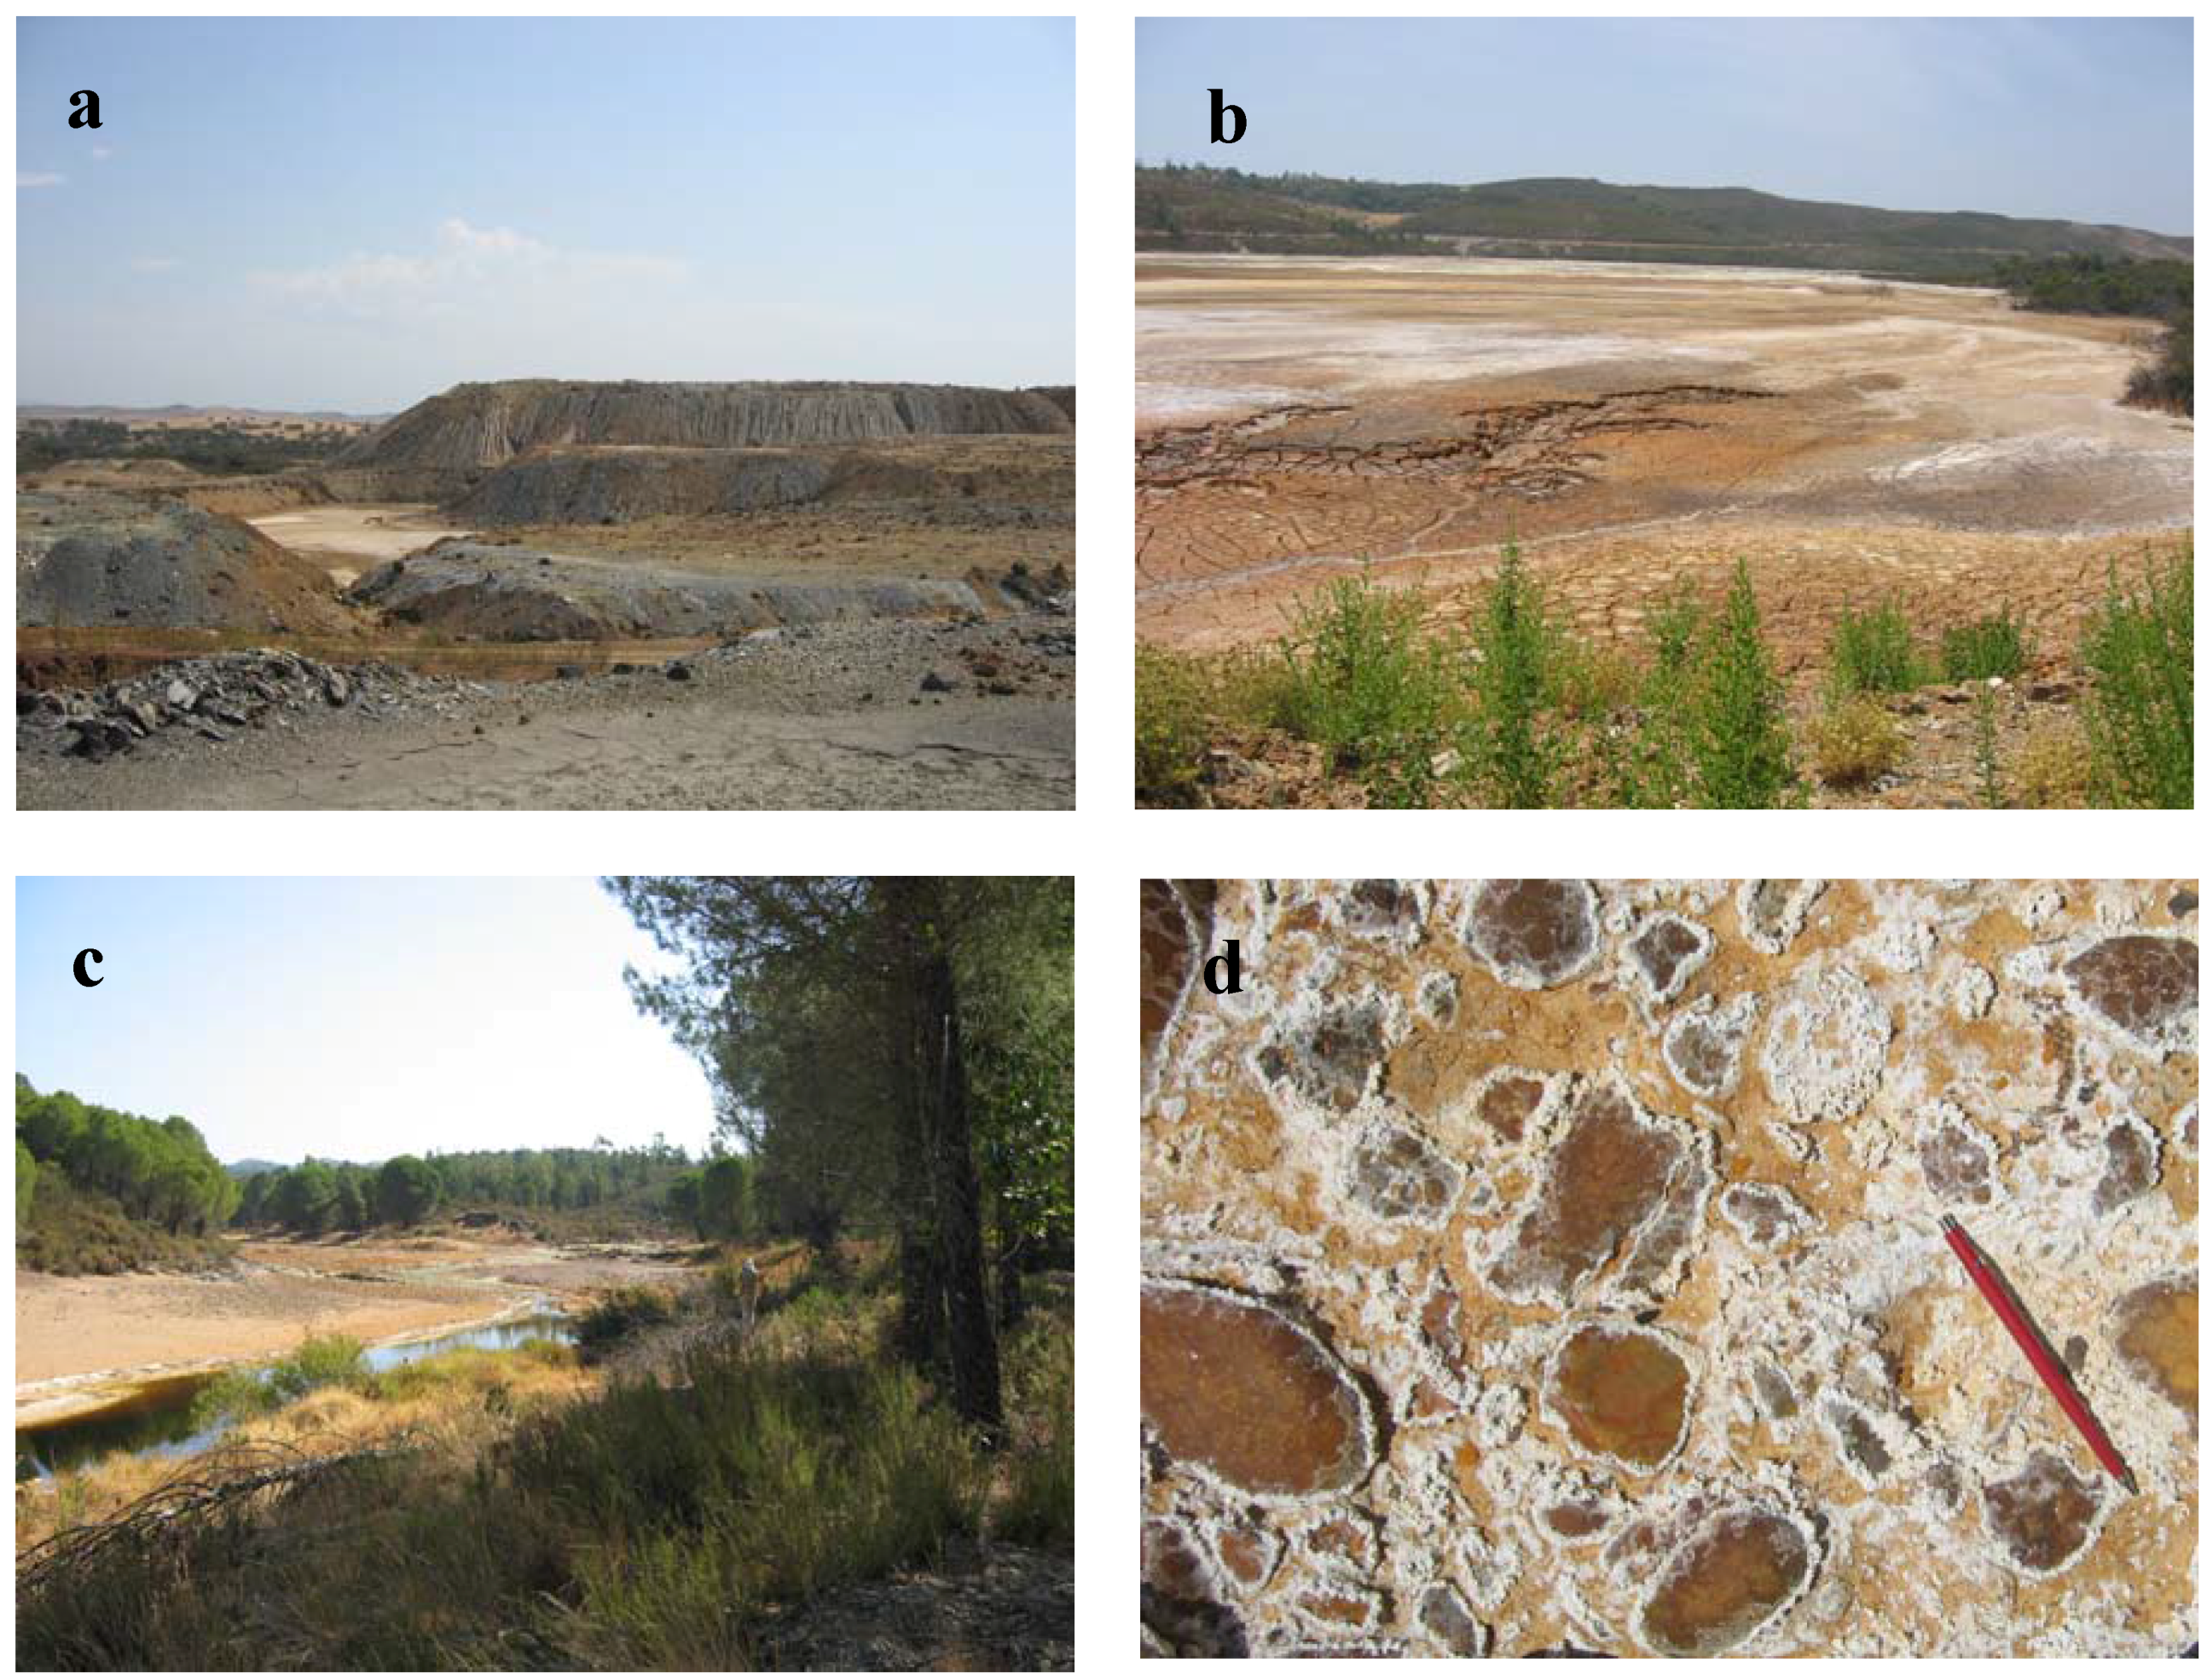
Dumps occur in piles, with a flattened summit which serves as a base for subsequent dumping piles, resulting in a pyramidal terraced geomorphology (
Figure 11(a)). Dumps with rock fragments and wide voids display a different geochemical behavior than fine grained ash dumps or mill tailings [
25]. Dumps composed of rock fragments with good water drainage dry fast after rain events and oxidize easily, particularly on the flat summits. Fine grained dumps develop gullies and rills, which concentrate hydrated sulfates, whereas slopes and elevated surfaces oxidize more rapidly. Occasionally, inner masses of hydrated sulfate burst onto the surface of the slopes, taking advantage of cracks and weak features, which occur as detrital materials slide down the slope.
Mill tailings are covered by a crust predominantly comprised of hydrated sulfate, which dries up and oxidizes during the dry season (
Figure 11(b)). The upper dry crust on mill tailings erodes, forming minor drainages with a rim of hydroxides where water flows; in addition, the water includes oxygen from the atmosphere, thus increasing its oxidizing capacity.
River sediments display typical shapes on sand bars, with coarse boulders on top and decreasing grain size toward the edge of the water (
Figure 11(c)). The upper coarse grain surfaces tend to oxidize rapidly, whereas fine grained sands and mud near the water underlie crusts with hydrated sulfate, and lose water easily during the dry season [
38]. Areas of wider crust development display high spatial mineralogical heterogeneity, related to minor topographical features, such as cracks, boulders, or ponds which can be only several centimeters wide (
Figure 11(d)). Schwertmannite tends to precipitate over knick points along the river course, where the water increases velocity and changes its geochemical balance. Minor geomorphological features along the course of the river provide critical points for regular monitoring of changes in contamination levels.
Figure 11.
(a) Panoramic view of terraced mine dumps on the Las Herrerias mining site. (b). Drainage with oxidized crusts developed on a surface of hydrated sulfate on the mill tailings dam of the Sotiel-Almagrera mine site. (c) View of sandbar development on the Odiel River, with coarse boulders on the sands, rimmed by white crusts of hydrated sulfate at the edge of the water. (d) Development of white hydrated iron sulfate crusts over oxidized boulders from sediments taken from the Odiel River.
In summary, oxidized areas are less prone to the spread of contaminants, and are found in stable flat surfaces which occur on the top of mine dumps or in river sediments. Less geomorphologically stable elements, such as slopes, or drainage bottoms, are prone to develop geochemically unstable hydrated sulfate, which dissolves at acid pH during rain events. Low areas, which collect fine grained detrital material and occur on mine sites and river sediments, are also favorable environments for the development of hydrated sulfate crusts that easily dissolve at acidic pH.
The movement of machinery at minesites during recovery processes can be recognized by an increase in hydroxides [
16]; all mechanical influence destroys the delicate hydrated sulfate coatings.
5.4. Validation
The picture described above reveals a highly spatially heterogeneous environment on all scales, which rapidly changes over time, not only yearly or seasonally, but weekly [
39]. Validation of image processing products is challenging. Systematic sampling of any of these environments involves considerable economic costs for chemical analysis [
1]. Conventional analytical methods, such as X-ray diffraction, are strongly limited by the low crystalinity of most of the mineralogical phases involved.
An understanding of the geochemical behavior of the environment by detailed geological analysis improves the accuracy of maps of mineralogical patterns, enabling assessment of the extent of contamination in a given area. In addition, such maps provide the only information about critical spatial and geochemical parameters which are necessary for continuous environmental monitoring by the authorities.
Therefore, image interpretation through digital image processing of hyperspectral data provides essential information on the mineralogical nature and extent of contamination from sulfide mine waste, which is impossible to acquire by any other method.
6. Conclusions
Image processing should be tailored per scene and per domain within a mine site; otherwise, complex spatial mineralization patterns cannot be resolved. These patterns are critical for accurate interpretation of climate change trends, metal contamination estimations or acid drainage prediction. Maps which are derived from individual subscenes, and processed using independent processing procedures, broadly agree with each other with respect to changes in oxidation and dehydration mineral phases. Areas covered by vegetation types and other obscuring land use/cover types had to be masked in order to achieve reasonable results for pyrite oxidation mineral trends.
Reference spectral libraries are useful to assess the oxidation or hydration stage of a mineral mixture. In addition, they help establish statistical evaluations of scores produced by mineralogical diagnoses, which are established by the spectral library using various algorithms. Variations in these scores can be used to improve our understanding of contaminant patterns. Many wrong mineralogical diagnoses can be prevented by considering the geochemical evolution of substances in a known geological context.
The atmospheric correction method has a strong influence on mineralogical diagnoses of spectra derived from hyperspectral imagery. However, calibration targets have to be carefully established to adjust spectral features of the substances to the map, in addition to general landcover features, such as soil, vegetation or water.
There are strong limitations to validating mapping data using conventional chemical analysis, due to its high spatial heterogeneity and fast temporal mobility. Spectral behavior trends extracted from the images, and in the laboratory from geological evaluations, can provide reliable indicators for monitoring contamination from mine wastes in river sediments.
Although all geological interpretation is based on a reference spectral library, which only includes a small number of minerals, reality is far more complex. Hence, the maps provided in this study must be understood as simplified images of mineralogical trends in a closed geological context.


