The Importance of Accounting for Atmospheric Effects in the Application of NDVI and Interpretation of Satellite Imagery Supporting Archaeological Research: The Case Studies of Palaepaphos and Nea Paphos Sites in Cyprus

 ,
, 
Abstract
:1. Introduction
2. Atmospheric Correction
2.1. Background
- Category (A): Absolute corrections (corrections that lead to surface reflectance). This category can be subdivided into two sub-categories: image-based atmospheric corrections (for example, Darkest Pixel, Covariance Matrix method) and corrections using independent data for atmospheric optical conditions (including in situ measurements or historical records) using physical-based algorithms;
- Category (B): Relative corrections (corrections that do not produce values of surface reflectance).
2.2. Spectral Reflectance (ρ)
- Lsat: apparent spectral radiance at satellite sensor (W·m2·ster1·μm1),
- Lmaxλ and Lminλ: the calibration constants, (W·m2·ster1·μm1),
- Qcalmax: the maximum quantized calibrated pixel value and
- Qcal is the digital number of the image.
- ρ: spectral reflectance at the surface (%),
- d: earth-sun distance in Aus,
- ESUNλ: solar spectral irradiance on a surface perpendicular to the sun’s ray outside of the atmosphere (W·m2·μm1) and
- cosθs: cosine of solar zenith angle.
2.3. Modified Darkest Pixel Atmospheric Correction Based on Spectroradiometric Measurements
- Ldarkest = Radiance at the darkest target.
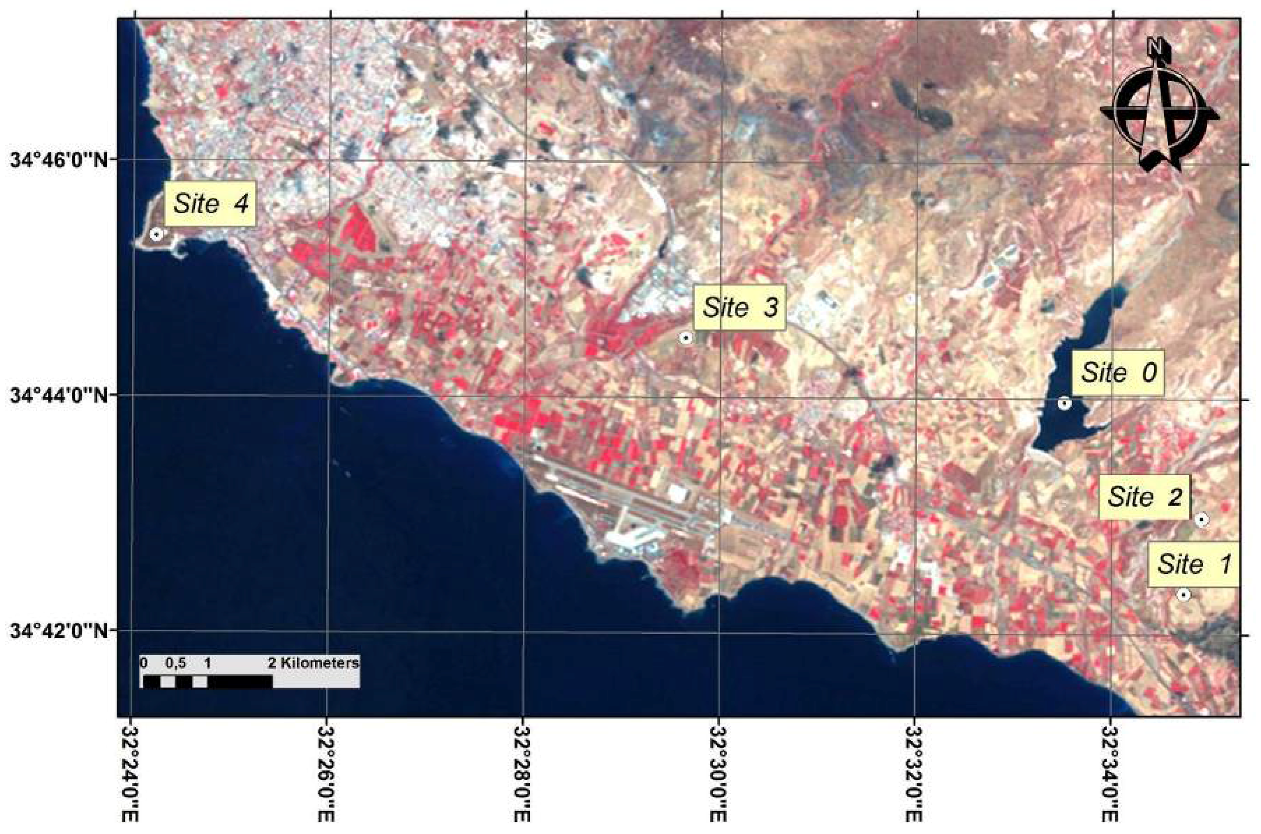
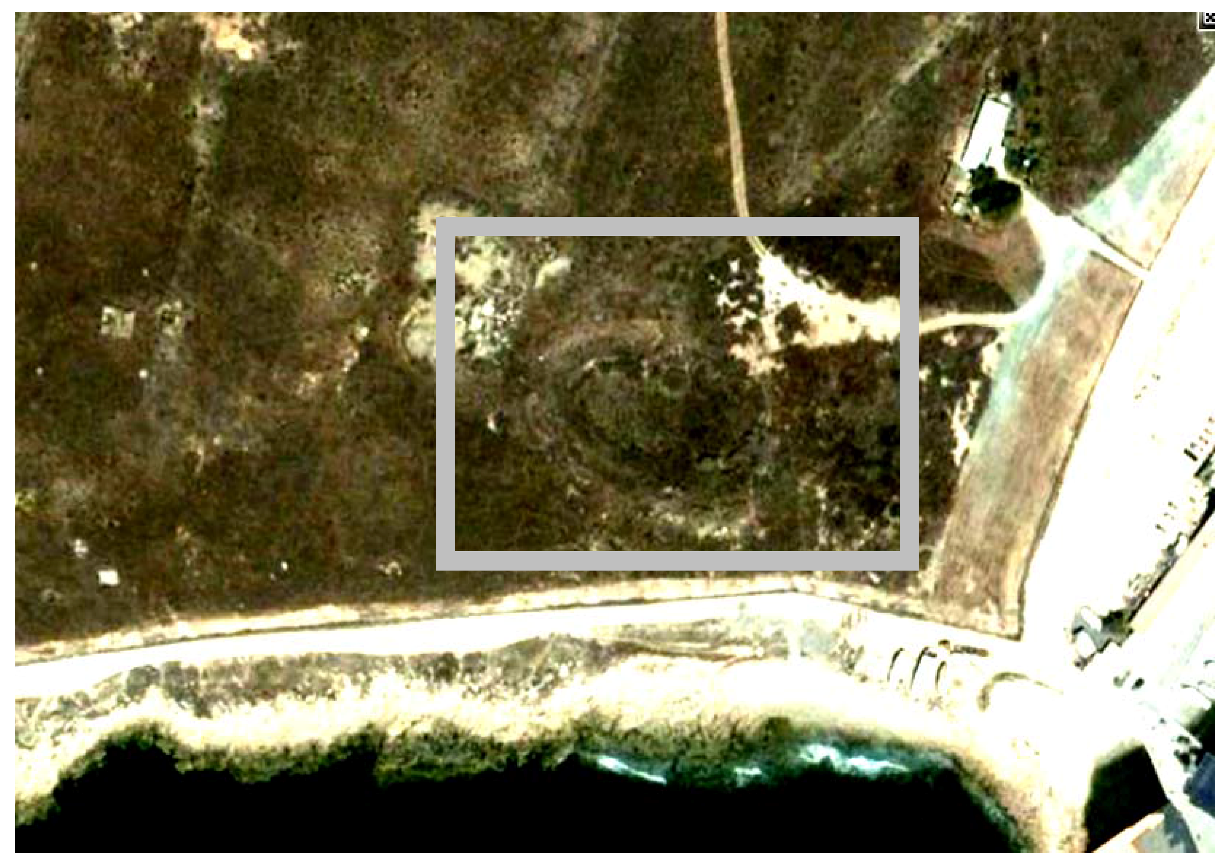
3. Study Areas

4. Methodology
4.1. Overall Methodology
4.2. Resources
4.2.1. Satellite Imagery
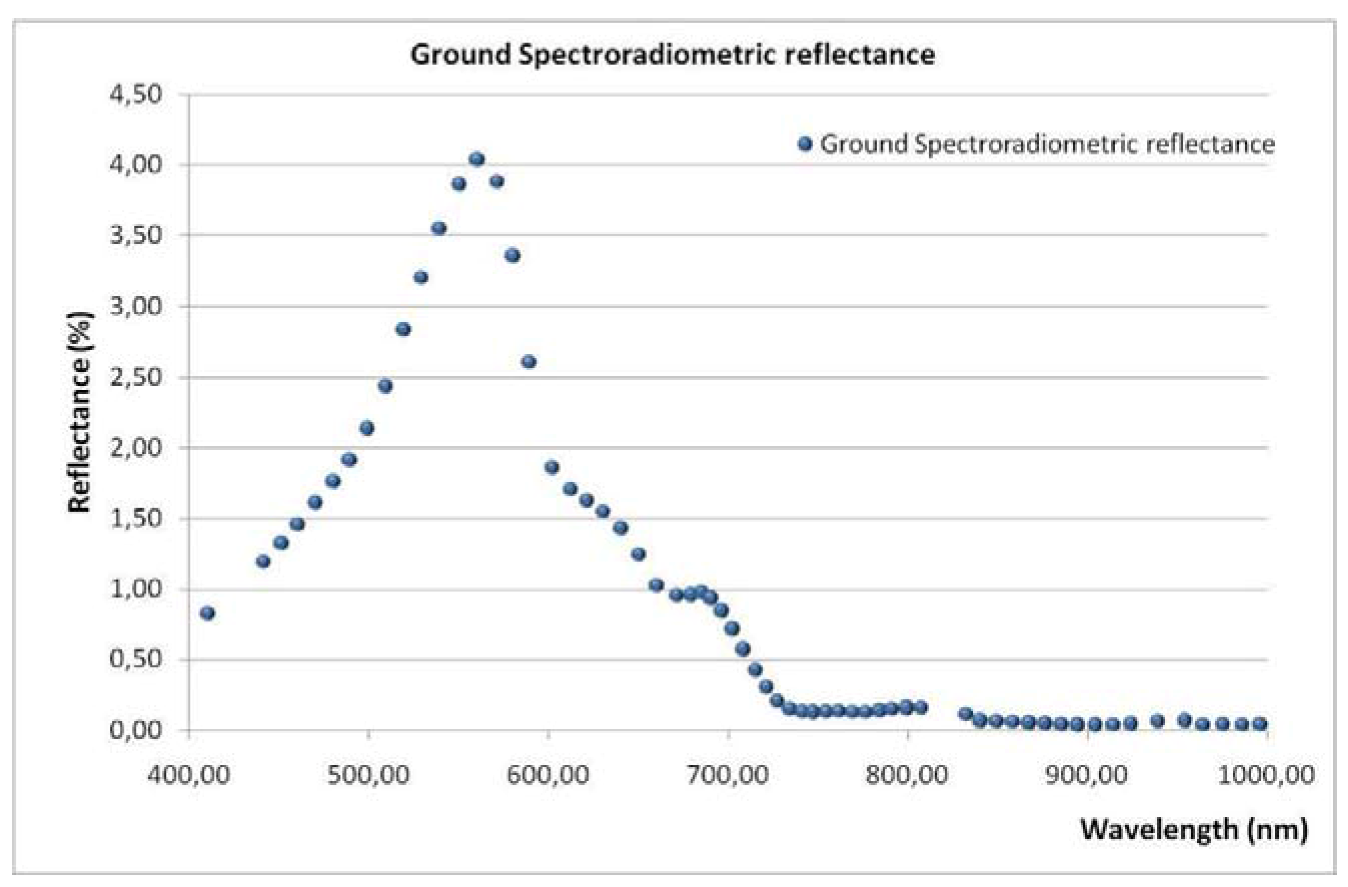
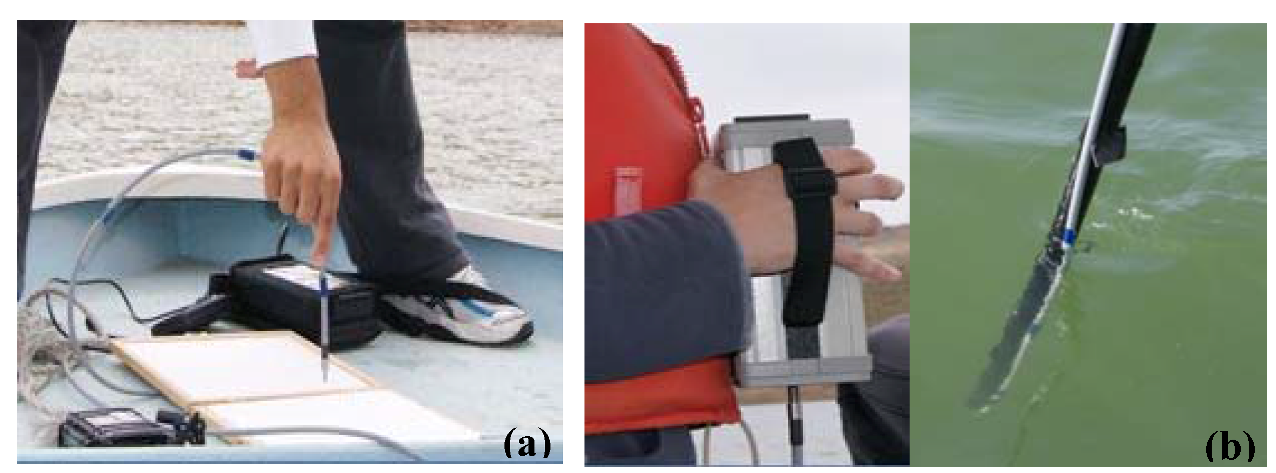
4.2.2. Field Spectroradiometric Data

| No | Satellite | Sensor | Acquisition Date | Julian Date | Sun Elevation | Sun Azimuth | |
|---|---|---|---|---|---|---|---|
| 1 | Landsat | TM | 21/06/2009 | 172 | 65.88 | 111.03 | |
| 2 | Landsat | ETM+ | 29/06/2009 | 180 | 65.77 | 111.50 | |
| 3 | Landsat | TM | 07/07/2009 | 188 | 64.84 | 111.92 | |
| 4 | Landsat | TM | 14/07/2009 | 195 | 64.16 | 113.41 | |
| 5 | Landsat | TM | 23/07/2009 | 204 | 63.10 | 116.16 | |
| 6 | Landsat | TM | 25/09/2009 | 268 | 49.04 | 145.70 | |
| 7 | Landsat | ETM+ | 22/12/2009 | 356 | 27.96 | 155.96 | |
| 8 | Landsat | ETM+ | 07/01/2010 | 7 | 28.30 | 153.70 | |
| 9 | Landsat | ETM+ | 19/03/2010 | 78 | 47.66 | 140.76 | |
| 10 | Landsat | ETM+ | 13/04/2010 | 103 | 56.66 | 134.51 | |
| 11 | Landsat | TM | 15/06/2010 | 167 | 66.48 | 112.40 |

4.2.3. Meteorological Data
| No | Acquisition Date | Max Temperature | Min Temperature | Temperature 13:00 | Rainfall (mm) | Relative Humidity 13:00 (%) |
|---|---|---|---|---|---|---|
| 1 | 21/06/2009 | 31 | 20 | 29.5 | 0.00 | 62 |
| 2 | 29/06/2009 | 28 | 18 | 27.8 | 0.00 | 68 |
| 3 | 07/07/2009 | 30 | 22 | 29.5 | 0.00 | 67 |
| 4 | 14/07/2009 | 30 | 21 | 29.4 | 0.00 | 64 |
| 5 | 23/07/2009 | 32.3 | 21 | 32.3 | 0.00 | 68 |
| 6 | 25/09/2009 | 29 | 19 | 28.3 | 0.05 | 58 |
| 7 | 22/12/2009 | 20.5 | 12.9 | 20.5 | 0.33 | 57.4 |
| 8 | 07/01/2010 | 20.0 | 9.3 | 19,6 | 0.00 | 63 |
| 9 | 19/03/2010 | 18. 9 | 7.1 | 18.5 | 0.00 | 30 |
| 10 | 13/04/2010 | 20.7 | 11.3 | 20.6 | 0.00 | 67 |
| 11 | 15/06/2010 | 27.4 | 19.4 | 26.7 | 0.00 | 77 |
| No | Acquisition Date | Equivalent Mass of Liquid Water (g/cm2) | τΗ2Ο (Optical Thickness of Water Vapor) |
|---|---|---|---|
| Band 4 (0.76–0.90 μm) | |||
| 1 | 21/06/2009 | 1.70 | 0.055 |
| 2 | 29/06/2009 | 1.80 | 0.058 |
| 3 | 07/07/2009 | 1.95 | 0.063 |
| 4 | 14/07/2009 | 1.95 | 0.063 |
| 5 | 23/07/2009 | 2.10 | 0.067 |
| 6 | 25/09/2009 | 1.50 | 0.048 |
| 7 | 22/12/2009 | 1.00 | 0.031 |
| 8 | 07/01/2010 | 1.10 | 0.034 |
| 9 | 19/03/2010 | 0.25 | 0.008 |
| 10 | 13/04/2010 | 0.30 | 0.009 |
| 11 | 15/06/2010 | 0.85 | 0.026 |
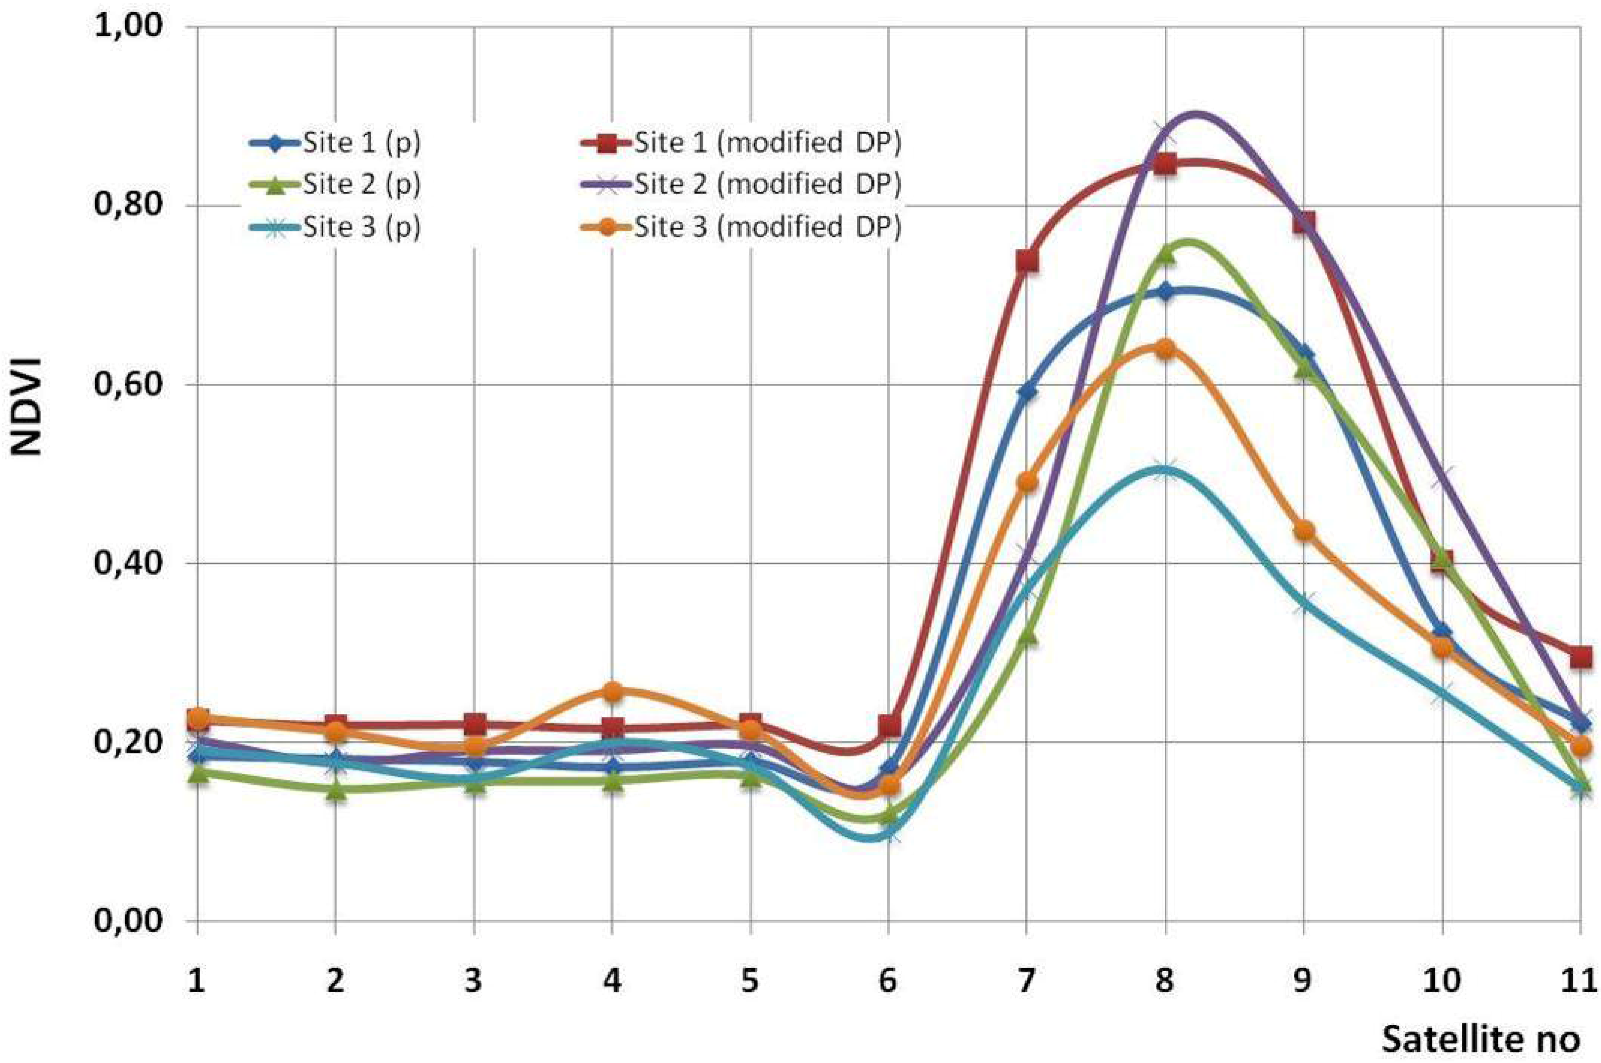
5. Results
| Campaign | Band 1 (%) | Band 2 (%) | Band 3 (%) | Band 4 (%) |
|---|---|---|---|---|
| 1 | 1.08 | 2.20 | 0.70 | 0.05 |
| 2 | 1.48 | 2.89 | 1.08 | 0.09 |
| 3 | 1.76 | 3.70 | 1.39 | 0.10 |
| 4 | 1.35 | 3.12 | 1.14 | 0.09 |
| 5 | 1.58 | 3.58 | 1.28 | 0.11 |
| 6 | 1.72 | 3.53 | 1.24 | 0.10 |
| 7 | 1.56 | 3.22 | 1.10 | 0.11 |
| 8 | 2.73 | 4.88 | 1.52 | 0.12 |
| 9 | 1.61 | 2.95 | 0.80 | 0.05 |
| 10 | 1.57 | 2.86 | 0.82 | 0.06 |
| 11 | 1.49 | 2.82 | 0.78 | 0.07 |
| 12 | 2.15 | 3.87 | 1.17 | 0.10 |
| 13 | 1.78 | 3.31 | 1.05 | 0.11 |
| 14 | 0.96 | 1.88 | 0.54 | 0.05 |
| 15 | 1.56 | 2.70 | 0.93 | 0.07 |
| 16 | 2.36 | 3.90 | 1.62 | 0.13 |
| Average | 1.67 | 3.21 | 1.07 | 0.09 |
| Max. | 2.73 | 4.88 | 1.62 | 0.13 |
| Min. | 0.96 | 1.88 | 0.54 | 0.05 |
| Std. | 0.44 | 0.72 | 0.30 | 0.03 |


| Band 1 | Band 2 | Band 3 | Band 4 | NIR-Red-Green | ||
|---|---|---|---|---|---|---|
| 21/06/2009 | Before atmospheric |  |  |  |  |  |
| After atmospheric |  |  |  |  |  | |
| 07/07/2009 | Before atmospheric |  |  |  |  |  |
| After atmospheric |  |  |  |  |  | |
| 14/07/2009 | Before atmospheric |  |  |  |  |  |
| After atmospheric |  |  |  |  |  | |
| 23/07/2009 | Before atmospheric |  |  |  |  |  |
| After atmospheric |  |  |  |  |  | |
| 25/09/2009 | Before atmospheric |  |  |  |  |  |
| After atmospheric |  |  |  |  |  | |
| 15/06/2010 | Before atmospheric |  |  |  |  |  |
| After atmospheric |  |  |  |  |  | |
| Band 1 | Band 2 | Band 3 | Band 4 | NIR-Red-Green | ||
|---|---|---|---|---|---|---|
| 21/06/2009 | Before atmospheric |  |  |  |  |  |
| After atmospheric |  |  |  |  |  | |
| 14/07/2009 | Before atmospheric |  |  |  |  |  |
| After atmospheric |  |  |  |  |  | |
| 25/09/2009 | Before atmospheric |  |  |  |  |  |
| After atmospheric |  |  |  |  |  | |
| 15/06/2010 | Before atmospheric |  |  |  |  |  |
| After atmospheric |  |  |  |  |  | |
| Band 1 | Band 2 | Band 3 | Band 4 | NIR-Red-Green | ||
|---|---|---|---|---|---|---|
| 21/06/2009 | Before atmospheric |  |  |  |  |  |
| After atmospheric |  |  |  |  |  | |
| 25/09/2009 | Before atmospheric |  |  |  |  |  |
| After atmospheric |  |  | 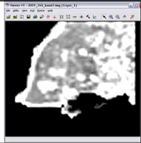 |  |  | |
| 15/06/2010 | Before atmospheric |  | 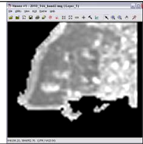 |  |  | 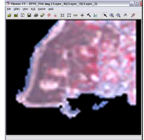 |
| After atmospheric | 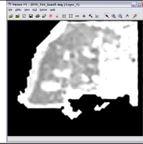 | 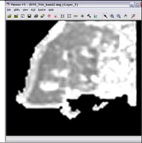 | 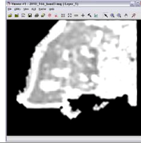 | 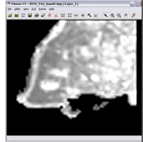 | 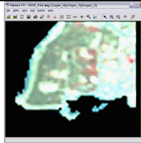 | |
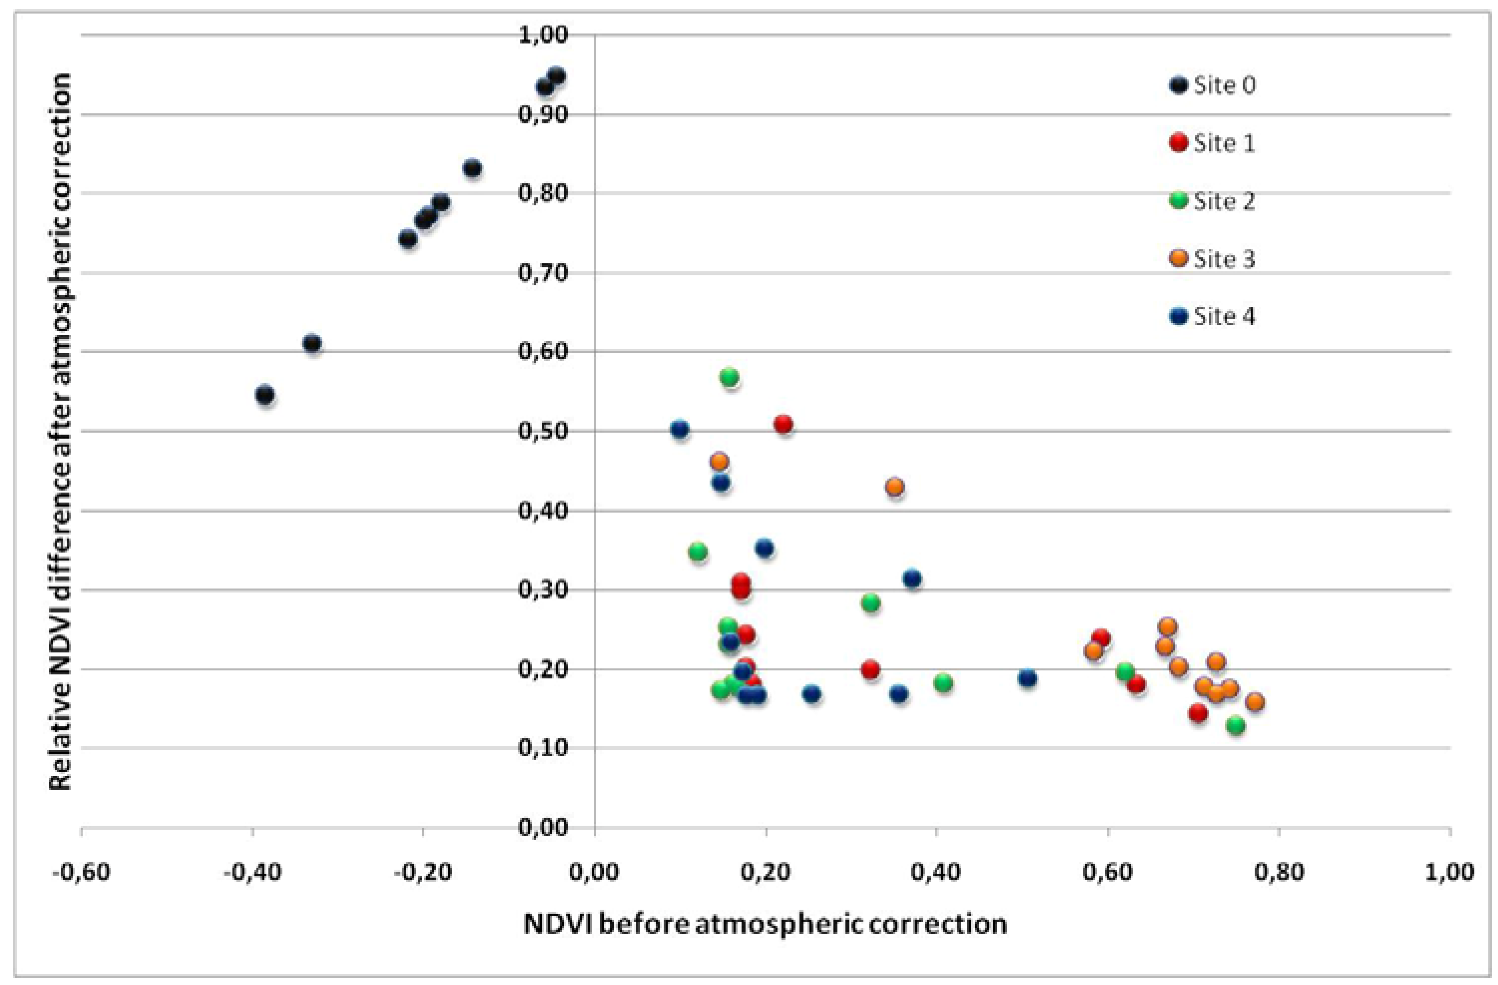
| no | Acquisition Date | Site 0 (before AC) | Site 0 (after A) | Relative Difference in % | ||||
|---|---|---|---|---|---|---|---|---|
| Site 0 | Site 1 | Site 2 | Site 3 | Site 4 | ||||
| 1 | 21/06/2009 | −0.217 | −0.845 | 0.743 | 0.180 | 0.178 | 0.169 | 0.167 |
| 2 | 29/06/2009 | −0.194 | 0.771 | 0.178 | 0.173 | 0.174 | 0.168 | |
| 3 | 07/07/2009 | −0.143 | 0.831 | 0.243 | 0.231 | 0.252 | 0.235 | |
| 4 | 14/07/2009 | −0.057 | 0.932 | 0.298 | 0.252 | 0.428 | 0.352 | |
| 5 | 23/07/2009 | −0.217 | 0.743 | 0.200 | 0.181 | 0.178 | 0.197 | |
| 6 | 25/09/2009 | −0.329 | 0.611 | 0.309 | 0.346 | 0.207 | 0.501 | |
| 7 | 22/12/2009 | −0.385 | 0.545 | 0.237 | 0.283 | 0.227 | 0.313 | |
| 8 | 07/01/2010 | −0.383 | 0.546 | 0.143 | 0.129 | 0.158 | 0.188 | |
| 9 | 19/03/2010 | −0.179 | 0.788 | 0.180 | 0.195 | 0.221 | 0.169 | |
| 10 | 13/04/2010 | −0.199 | 0.765 | 0.198 | 0.182 | 0.201 | 0.169 | |
| 11 | 15/06/2010 | −0.045 | 0.946 | 0.508 | 0.566 | 0.459 | 0.435 | |

6. Conclusions
Acknowledgments
References
- Siart, C.; Eitel, B.; Panagiotopoulos, D. Investigation of past archaeological landscapes using remote sensing and GIS: A multi-method case study from Mount Ida, Crete. J. Archaeol. Sci. 2008, 35, 2918–2926. [Google Scholar] [CrossRef]
- Masini, N.; Lasaponara, R. Investigating the spectral capability of QuickBird data to detect archaeological remains buried under vegetated and not vegetated areas. J. Cult. Herit. 2007, 8, 53–60. [Google Scholar] [CrossRef]
- Alexakis, D.; Sarris, A.; Astaras, T.; Albanakis, Κ. Detection of neolithic settlements in Thessaly (Greece) through multispectral and hyperspectral satellite imagery. Sensors 2009, 9, 1167–1187. [Google Scholar] [CrossRef] [PubMed]
- Agapiou, A.; Hadjimitsis, G.D.; Sarris, A.; Themistocleous, K.; Papadavid, G. Hyperspectral Ground Truth Data for the Detection of Buried Architectural Remains. In Proceedings of 3rd International Euro-Mediterranean Conference (EuroMed 2010), Limassol, Cyprus, 8–13 November 2010; Lecture Notes of Computer Science. Volume 6436, pp. 318–331.
- Alexakis, A.; Sarris, A.; Astaras, T.; Albanakis, K. Integrated GIS, remote sensing and geomorphologic approaches for the reconstruction of the landscape habitation of Thessaly during the neolithic period. J. Archaeol. Sci. 2011, 38, 89–100. [Google Scholar] [CrossRef]
- Alexakis, D.; Sarris, A. Environmental and Human Risk Assessment of the Prehistoric and Historic Archaeological Sites of Western Crete (Greece) with the Use of GIS, Remote Sensing, Fuzzy Logic and Neural Networks. In Proceedings of 3rd International Euro-Mediterranean Conference (EuroMed 2010), Limassol, Cyprus, 8–13 November 2010; Lecture Notes of Computer Science. Volume 6436, pp. 332–342.
- Hadjimitsis, D.G.; Themistocleous, K.; Agapiou, A.; Clayton, C.R.I. Multi-temporal study of archaeological sites in Cyprus using atmospheric corrected satellite remotely sensed data. Int. J. Archit. Comput. 2009, 7, 121–138. [Google Scholar] [CrossRef]
- Kincey, M.; Challis, K. Monitoring fragile upland landscapes: The application of airborne lidar. J. Nature Conserv. 2010, 18, 126–134. [Google Scholar] [CrossRef]
- Hadjimitsis, D.G.; Agapiou, A.; Alexakis, D.; Sarris, A. Exploring natural and anthropogenic hazard risk for cultural heritage in Cyprus using remote sensing and GIS. Int. J. Dig. Earth 2011. [Google Scholar] [CrossRef]
- Sharpe, L. Geophysical, Geochemical and Arable Crop Responses to Archaeological Sites in the Upper Clyde Valley, Scotland. Ph.D. Thesis, Department of Archaeology, Faculty of Physical Sciences, University of Glasgow, Glasgow, UK, 2004. [Google Scholar]
- Adqus, S.A.; Hanson, W.S.; Drummond, J. A Comparative Study for Finding Archaeological Crop Marks using Airborne Hyperspectral, Multispectral and Digital Photographic Data. In Proceedings of the 2007 Annual Conference of the Remote Sensing and Photogrammetry Society, Newcastle, UK, 11–15 October 2009; pp. 361–365.
- Lasaponara, R.; Masini, N. Detection of archaeological crop marks by using satellite QuickBird multispectral imagery. J. Archaeol. Sci. 2007, 34, 214–221. [Google Scholar] [CrossRef]
- Rowlands, A.; Sarris, A. Detection of exposed and subsurface archaeological remains using multi-sensor remote sensing. J. Archaeol. Sci. 2007, 34, 795–803. [Google Scholar] [CrossRef]
- Agapiou, A.; Hadjimitsis, D. Vegetation indices and field spectroradiometric measurements for validation of buried architectural remains: Verification under area surveyed with geophysical campaigns. J. Appl. Remote Sens. 2011. [Google Scholar] [CrossRef]
- Lillesand, T.M.; Kiefer, R.W.; Chipman, J.W. Remote Sensing and Image Interpretation; Wiley: Hoboken, NJ, USA, 2004. [Google Scholar]
- Duggin, M.J.; Piwinski, D. Recorded radiance indices for vegetation monitoring using NOAA AVHRR data; atmospheric and other effects in multitemporal data sets. Appl. Optics 1984, 23, 2620–2623. [Google Scholar] [CrossRef]
- Honkavaara, E.; Arbiol, R.; Markelin, L.; Martinez, L.; Cramer, M.; Bovet, S.; Chandelier, L.; Ilves, R.; Klonus, R.; Marshal, P.; Schläpfer, D.; Tabor, M.; Thom, C.; Veje, N. Digital airborne photogrammetry—A new tool for quantitative remote sensing?—A state-of-the-art review on radiometric aspects of digital photogrammetric images. Remote Sens. 2009, 1, 577–605. [Google Scholar] [CrossRef]
- Bagheri, S. Nearshore water quality estimation using atmospherically corrected AVIRIS data. Remote Sens. 2011, 3, 257–269. [Google Scholar] [CrossRef]
- Song, C.; Woodcock, E.C. Monitoring forest succession with multitemporal Landsat images: Factors of uncertainty. IEEE Trans. Geosci. Remote Sens. 2003, 41, 2557–2567. [Google Scholar] [CrossRef]
- Che, N.; Price, J.C. Survey of Radiometric calibration results and methods for visible and near infrared channels of NOAA-7, -9, and -11 AVHRRs. Remote Sens. Environ. 1992, 41, 19–27. [Google Scholar] [CrossRef]
- Hadjimitsis, D.G.; Papadavid, G.; Agapiou, A.; Themistocleous, K.; Hadjimitsis, M.G.; Retalis, A.; Michaelides, S.; Chrysoulakis, N.; Toulios, L.; Clayton, C.R.I. Atmospheric correction for satellite remotely sensed data intended for agricultural applications: Impact on vegetation indices. Natural. Hazards Earth Syst. Sci. 2010, 10, 89–95. [Google Scholar] [CrossRef]
- Bastiaanssen, W.G.M.; Molden, D.J.; Makin, I.W. Remote sensing for irrigated agriculture: Examples from research and possible applications. Agr. Water Manage. 2000, 46, 137–155. [Google Scholar] [CrossRef]
- Kaufman, Y.J.; Sendra, C. Algorithm for automatic corrections to visible and near-IR satellite imagery. Int. J. Remote Sens. 1988, 9, 1357–1381. [Google Scholar] [CrossRef]
- Courault, D.; Seguin, B.; Olioso, A. Review to Estimate Evapotranspiration from Remote Sensing Data: Some Examples from the Simplified Relationship to the Use of Mesoscale Atmospheric Models. In Presented at ICID International Workshop on Remote Sensing of ET for Large Regions, Montpellier, France, 17 September 2003.
- Hadjimitsis, D.G.; Clayton, C.R.I.; Hope, V.S. An assessment of the effectiveness of atmospheric correction algorithms through the remote sensing of some reservoirs. Int. J. Remote Sens. 2004, 25, 3651–3674. [Google Scholar] [CrossRef]
- Hadjimitsis, D.G.; Clayton, C.R.I.; Hope, V.S. The Importance of Accounting for Atmospheric Effects in Satellite Remote Sensing: A Case Study from the Lower Thames Valley Area, UK. In Proceedings of Space 2000: The Seventh International Conference and Exposition on Engineering, Construction, Operations, and Business in Space. ASCE Conference on Space and Robotics, Albuquerque, NM, USA, 27 February–2 March 2000; pp. 194–201.
- Hadjimitsis, D.G.; Clayton, C.R.I.; Retalis, A. On the darkest pixel atmospheric correction algorithm: A revised procedure for environmental applications of satellite remotely sensed imagery. Proc. SPIE 2004, 5239, 464–471. [Google Scholar]
- Lu, D.; Mausel, P.; Brondizio, E.; Moran, E. Assessment of atmospheric correction methods for Landsat TM data applicable to Amazon basin LBA research. Int. J. Remote Sens. 2002, 23, 2651–2671. [Google Scholar] [CrossRef]
- Hadjimitsis, D.G.; Clayton, C.R.I. The application of the covariance matrix statistical method for removing atmospheric effects from satellite remotely sensed data intended for environmental applications. Proc. SPIE 2004. [Google Scholar] [CrossRef]
- Hadjimitsis, D.G.; Clayton, C.R.I. The use of an improved atmospheric correction algorithm for removing atmospheric effects from remotely sensed images using an atmosphere-surface simulation and meteorological data. Meteorol. Appl. 2008, 15, 381–387. [Google Scholar] [CrossRef]
- Hadjimitsis, D.G.; Clayton, C.R.I. Field spectroscopy for assisting water quality monitoring and assessment in water treatment reservoirs using atmospheric corrected satellite remotely sensed imagery. Remote Sens. 2011, 3, 362–377. [Google Scholar] [CrossRef]
- Song, J.; Duanjun, L.; Wesely, M.L. A simplified atmospheric correction procedure for the Normalized Difference Vegetation Index. Photogramm. Eng. Remote Sensing, 2003, 69, 521–528. [Google Scholar] [CrossRef]
- Chrysoulakis, N.; Abrams, M.; Feidas, H.; Arai, K. Comparison of atmospheric correction methods using ASTER data for the area of Crete: The ATMOSAT Project. Int. J. Remote Sens. 2010, 31, 6347–6385. [Google Scholar] [CrossRef]
- Forster, C.B. Derivation of atmospheric correction procedures for LANDSAT MSS with particular reference to urban data. Int. J. Remote Sens. 1984, 5, 799–817. [Google Scholar] [CrossRef]
- Iacovou, M.; Stylianidis, E.; Sarris, A.; Agapiou, A. A Long-Term Response to the Need to Make Modern Development and the Preservation of the Archaeo-Cultural Record Mutually Compatible Operations: The GIS Contribution. In Proceedings of the 22nd CIPA Symposium, Digital Documentation, Interpretation & Presentation of Cultural Heritage, Kyoto, Japan, 11–15 October 2009.
- Agapiou, A.; Iacovou, M.; Sarris, A. Spatial Analysis of the Archaeological Sites of the Palaepaphos Region (Northwest Cyprus), during the 3rd and 2nd Millennium BC Using GIS. In Proceedings of The XXXVIII Annual Conference on Computer Applications and Quantitative Methods in Archaeology, CAA, Granada, Spain, 6–9 April 2010; in press.
- Iacovou, M. The Palaepaphos Urban Landscape Project: Theoretical Background and Preliminary Report 2006-2007; Report of Department of Antiquities Cyprus; Department of Antiquities: Nicosia, Cyprus, 2008; pp. 263–289.
- Sarris, A.; Kokkinou, E.; Soupios, P.; Papadopoulos, E.; Trigkas, V.; Sepsa, U.; Gionis, D.; Iacovou, M.; Agapiou, A.; Satraki, A.; Stylianides, St. Geophysical Investigations at Palaipaphos, Cyprus. In Proceedings of the 36th Annual Conference on Computer Applications and Quantitative Methods in Archaeology, CAA, On the Road to Reconstructing the Past, Budapest, Hungary, 2–6 April 2008.
- Maier, F.G.; Karageorghis, V. Paphos, History and Archaeology; A.G. Leventis Foundation: Nicosia, Cyprus, 1984. [Google Scholar]
- Hantson, S.; Chuvieco, E. Evaluation of different topographic correction methods for Landsat imagery. Int. J. Appl. Earth Obs. Geoinf. 2011, 13, 691–700. [Google Scholar] [CrossRef]
- Papoutsa, C.; Hadjimitsis, D.G.; Alexakis, D. Characterizing the spectral signatures and optical properties of dams in Cyprus using field spectroradiometric measurements. Proc. SPIE 2011. [Google Scholar] [CrossRef]
- McClatchey, R.A.; Fenn, W.S.; Selby, J.E.A.; Volz, F.E.; Garing, J.S. Optical Properties of the Atmosphere; Rep. AFCrl-71-0279, 85; Air Force Cambridge Res. Lab.: Bedford, MA, USA, 1984. [Google Scholar]
- Pinty, B.; Verstraete, M.M. GEMI: A nonlinear index to monitor global vegetation from satellites. Vegetation 1992, 101, 15–20. [Google Scholar] [CrossRef]
- Kaufman, Y.J.; Tanré, D. Atmospherically resistant vegetation index (ARVI). IEEE Trans. Geosci. Remote Sens. 1992, 30, 261–270. [Google Scholar] [CrossRef]
- Hadjimitsis, D.G.; Clayton, C.R.I. Assessment of temporal variations of water quality in inland water bodies using atmospheric corrected satellite remotely sensed image data. Environ. Monit. Assess. 2009, 159, 281–292. [Google Scholar] [CrossRef] [PubMed]
- Hadjimitsis, D.G.; Clayton, C.R.I.; Retalis, A. The use of selected pseudo-invariant targets for the application of atmospheric correction in multi-temporal studies using satellite remotely sensed imagery. Int. J. Appl. Earth Obs. Geoinf. 2009, 11, 192–200. [Google Scholar] [CrossRef]
© 2011 by the authors; licensee MDPI, Basel, Switzerland. This article is an open access article distributed under the terms and conditions of the Creative Commons Attribution license (http://creativecommons.org/licenses/by/3.0/).
Share and Cite
Agapiou, A.; Hadjimitsis, D.G.; Papoutsa, C.; Alexakis, D.D.; Papadavid, G. The Importance of Accounting for Atmospheric Effects in the Application of NDVI and Interpretation of Satellite Imagery Supporting Archaeological Research: The Case Studies of Palaepaphos and Nea Paphos Sites in Cyprus. Remote Sens. 2011, 3, 2605-2629. https://doi.org/10.3390/rs3122605
Agapiou A, Hadjimitsis DG, Papoutsa C, Alexakis DD, Papadavid G. The Importance of Accounting for Atmospheric Effects in the Application of NDVI and Interpretation of Satellite Imagery Supporting Archaeological Research: The Case Studies of Palaepaphos and Nea Paphos Sites in Cyprus. Remote Sensing. 2011; 3(12):2605-2629. https://doi.org/10.3390/rs3122605
Chicago/Turabian StyleAgapiou, Athos, Diofantos G. Hadjimitsis, Christiana Papoutsa, Dimitrios D. Alexakis, and George Papadavid. 2011. "The Importance of Accounting for Atmospheric Effects in the Application of NDVI and Interpretation of Satellite Imagery Supporting Archaeological Research: The Case Studies of Palaepaphos and Nea Paphos Sites in Cyprus" Remote Sensing 3, no. 12: 2605-2629. https://doi.org/10.3390/rs3122605