Article

Integrated Landsat Image Analysis and Hydrologic Modeling to Detect Impacts of 25-Year Land-Cover Change on Surface Runoff in a Philippine Watershed

1
Applied Geodesy and Space Technology Research Laboratory, The Training Center forApplied Geodesy and Photogrammetry, College of Engineering, University of the Philippines,Diliman, Quezon City 1101, Philippines
2
College of Engineering and Information Technology, Caraga State University, Ampayon,Butuan City 8600, Philippines
*
Author to whom correspondence should be addressed.
Remote Sens. 2011, 3(6), 1067-1087; https://doi.org/10.3390/rs3061067
Submission received: 4 March 2011 / Revised: 4 May 2011 / Accepted: 6 May 2011 / Published: 26 May 2011
(This article belongs to the Special Issue 100 Years ISPRS - Advancing Remote Sensing Science)

Abstract

:
Landsat MSS and ETM+ images were analyzed to detect 25-year land-cover change (1976–2001) in the critical Taguibo Watershed in Mindanao Island, Southern Philippines. This watershed has experienced historical modifications of its land-cover due to the presence of logging industries in the 1950s, and continuous deforestation due to illegal logging and slash-and-burn agriculture in the present time. To estimate the impacts of land-cover change on watershed runoff, land-cover information derived from the Landsat images was utilized to parameterize a GIS-based hydrologic model. The model was then calibrated with field-measured discharge data and used to simulate the responses of the watershed in its year 2001 and year 1976 land-cover conditions. The availability of land-cover information on the most recent state of the watershed from the Landsat ETM+ image made it possible to locate areas for rehabilitation such as barren and logged-over areas. We then created a “rehabilitated” land-cover condition map of the watershed (re-forestation of logged-over areas and agro-forestation of barren areas) and used it to parameterize the model and predict the runoff responses of the watershed. Model results showed that changes in land-cover from 1976 to 2001 were directly related to the significant increase in surface runoff. Runoff predictions showed that a full rehabilitation of the watershed, especially in barren and logged-over areas, will be likely to reduce the generation of a huge volume of runoff during rainfall events. The results of this study have demonstrated the usefulness of multi-temporal Landsat images in detecting land-cover change, in identifying areas for rehabilitation, and in evaluating rehabilitation strategies for management of tropical watersheds through its use in hydrologic modeling.

1. Introduction

1.1. Motivations

The negative impacts of land-cover change to the natural environment especially in watershed ecosystems have been a widely recognized problem throughout the world. Changes such as forest cover reduction through deforestation and conversion for agricultural purposes can alter a watershed’s response to rainfall events, that often leads to increased volumes of surface runoff and greatly increase the incidence of flooding and sedimentation of receiving water bodies [1,2]. The detection of these changes is crucial in providing information as to what and where the changes have occurred and to analyzing these changes in order to formulate proper mitigation measures and rehabilitation strategies.
In Philippines, the Taguibo Watershed in Northeastern Mindanao (Figure 1) exemplifies the case of severe impacts of land-cover change due to watershed runoff as well as upland soil erosion. This watershed has experienced extensive alteration of its land-cover due to the presence of several logging industries with Timber License Agreements (TLAs) in the 1950s until the early 1980s [3]. Its forest cover was severely reduced by logging and clear-felling, and the former logged-over areas were opened up to intensive farming, thereby accommodating the influx of farmers who were intent in cultivating high value vegetables. These historical changes in the watershed’s land-cover and the continuous illegal logging activities have led to a very serious condition of the watershed. Significant increase in runoff volume during rainfall events, and extensive sedimentation of rivers and streams due to severe soil erosion in the watershed’s landscape had taken place [3]. As the surface water of Taguibo Watershed is the main source for domestic and agricultural needs of the people living nearby, the alarming situations have prompted the Department of Environment and Natural Resources (DENR) to come up with rehabilitation efforts such as reforestation of formerly logged areas and agro-forestation in highly eroded landscapes to mitigate the problem of increased runoff generation and high rate of sedimentation. While these efforts to address the negative impacts of land-cover change are necessary, they can only be fruitful if information on the location and extent of the areas that need rehabilitation is available. Moreover, relevant information that portrays space-time relationships of land-cover to hydrological functions is often required to properly formulate and evaluate mitigation measures and rehabilitation strategies.

1.2. Remote Sensing and GIS in Watershed Research

Remote sensing (RS) techniques have been used extensively to provide accurate and timely information describing the nature and extent of land resources and changes over time. In watershed research and hydrological sciences, RS has played a major role because of its ability to provide spatially continuous data, its potential to provide measurements of hydrological variables not available through traditional techniques, and its ability to provide long term, global data, even for remote and generally inaccessible regions of the Earth [4]. It is perhaps for land-cover data derivation that RS has made its largest impact and comes closest to maximize its capabilities in watershed research [5]. This has prompted researchers and watershed planners to exploit land-cover information derived from remotely-sensed images in a variety of hydrological modeling studies, most especially in surface runoff predictions [6,7,8]. The addition of Geographic Information System (GIS) technology further enhanced these capabilities and increased confidence in the accuracy of modeled watershed conditions, improved the efficiency of the modeling process and increased the estimation capability of hydrologic models [9].
Figure 1. Series of maps showing the study area, the Taguibo Watershed in Agusan del Norte province, Northeastern Mindanao Island, Philippines. Each sub-watershed is identified by a number enclosed in a circle.
Remotesensing 03 01067 g001
A common approach in integrated RS-GIS-Modeling for event-based watershed runoff predictions usually involves (i) the derivation of land-cover related parameters of the models from remotely-sensed images, (ii) the use of GIS to prepare the model and to extract additional parameters, (iii) calibration and validation of the model using field measured data to test its efficiency, and then (iv) using the model to simulate runoff and use the simulated information to characterize the conditions of the watershed [10,11]. For land-cover change impact predictions in watersheds, the same approach is generally followed, except that the model is run first for an initial land-cover condition, then the land-cover related parameters of the models are altered to reflect the change, and the model is re-run [10]. The effect of the change is estimated based on the differences between the runoff hydrographs simulated in the initial and “changed” conditions, respectively. Several studies have utilized the RS-GIS-Modeling approach for assessing the impacts of land-cover change to the hydrologic response of watersheds to rainfall events (e.g., [1,12,13,14]). However, the majority of studies focus on modeling the hydrological response of watersheds to future changes in land-cover. Very few studies relate the hydrological responses of watershed to its past and present conditions. In watershed management, this is of paramount importance as the information derived from modeling can be directly related to the changes in land-cover as well as to the overall condition of the modeled watershed. Proper mitigation measures and efficient conservation strategies can then be formulated upon examination of the root causes of watershed problems, and hence, may lead to its rehabilitation.

1.3. Objectives

This paper aims to exemplify the importance of land-cover change detection by RS image analysis in providing relevant information on past and recent conditions of a watershed. Specifically, we applied post-classification comparison analysis of classified Landsat MSS and ETM+ images to detect 25-year land-cover change in the critical Taguibo Watershed in Mindanao Island, Southern Philippines. We then related the changes in land-cover to the responses of the watershed to rainfall events using a GIS-based hydrologic model. The model is also used to test planned rehabilitation measures and strategies to approximate their success or failure in addressing the problems of the Taguibo Watershed.

2. Study Area

The Taguibo Watershed has a drainage area of 75.532 km2. Plain, steep hills and mountains describe the study area, with the majority of land being above 100 meter elevation and the slope ranging from about 50% upwards. According to the Taguibo River Watershed Management Plan [3], the majority of the soils in the watershed belongs to hydrologic soil group B (loamy and silty-loamy soils) which indicates medium runoff potential [15]. This texture indicates an almost sufficient water saturation capacity (53–70% by weight) to sustain the water requirements of most of the forest species present in the watershed. Clayey and shallow soils belonging to hydrologic soil group D (high runoff potential) are generally observed in areas with 50% or more slope. These are usually found in rugged mountainous areas where meteoric water runs off rapidly to creeks and streams because of steep slopes. This condition gives minimal span for the rainwater to infiltrate into the ground. Thus, little ground water is expected in the upland [3]. The study area falls under Type II of the Corona Climate Classification System, signifying no distinct dry season with a pronounced rainfall from November to January, and sometimes until February. From the years 1981–2001, the maximum monthly rainfall recorded by the nearest Philippine Atmospheric, Geophysical and Astronomical Services Administration (PAGASA) Weather Station (~15 km from the study area) was 595 mm during the month of January 1996. The maximum 10-year average annual rainfall was 2,098 mm (1992–2001). The watershed is below the typhoon belt. The geological formation of the study area has the general composition of underground sedimentary, igneous and metamorphic rocks. The parent material originated from the degradation of sandstone, shale, limestone, ultra basics and accumulation of volcanic ash.

3. Methods

3.1. RS Change Detection

The location and nature of change which has occurred in a watershed can be explicitly recognized using a post-classification comparison approach of land-cover change detection from RS images [16]. This approach uses separate classifications of images acquired at different times to produce difference maps from which ‘‘from–to’’ change information can be generated [17]. Among the several classifiers available, the Maximum Likelihood Classifier (MLC) has been widely used to classify RS data and successful results of applying this classifier for land-cover mapping have been numerous (e.g., [18,19,20]) despite the limitations due to its assumption of normal distribution of class signatures [21]. Its use has also been effective in a number of post-classification comparison change detection studies (e.g., [12,22,23,24]).While recent studies have indicated the superiority of newly developed image classification techniques based on Decision Trees (DT), Neural Networks (NN) and Support Vector Machines (SVM) over MLC (e.g., [25,26,27,28]), the advantage of MLC over these classifiers is significant owing to its simplicity and lesser computing time. This is crucial, especially for rapid land-cover mapping and change detection analysis of numerous multi-temporal images in a situation where time and computing resources are sorely limited. Moreover, the accuracy of any classifier is affected by the number of training samples and by selecting which bands to use during the classification. As reported by Huang et al. [25], improved classification accuracies of MLC, DT, NN and SVM can be achieved when training data size is increased and when more bands are included. In the case of Landsat image classification, improvements due to the inclusion of all bands exceeded those due to the use of a better classifier or increased training data size, underlining the need to use as much information as possible in deriving land-cover classification from RS images [25]. All these aspects were considered in the detection and analysis of land-cover change in the Landsat images of the study area.

3.2. Landsat Image Pre-Processing

Orthorectified Landsat MSS and ETM+ images covering the study area acquired on 17 April 1976 (path 120, row 54) and 22 May 2001 (path 112, row 54), with pixel resolutions of 57-m and 28.5-m, respectively, were obtained from the Global Land-cover Facility (GLCF), University of Maryland (http://glcf.umiacs.umd.edu). These images are part of the GLCF GeoCover collection which consists of decadal Landsat data which has been orthorectified and processed to a higher quality standard. Documentations on the orthorectification process can be found in the GLCF GeoCover website at http://glcf.umiacs.umd.edu/research/portal/geocover/. All four bands of the 1976 Landsat MSS image and the seven bands of the 2001 Landsat ETM+ image were downloaded from the GLCF website.
Prior to any image pre and post processing, the geometric accuracy of the images were first assessed. For the Landsat ETM+ image, a total of thirty eight (38) points identifiable on both the image and 1:50,000 topographic maps of the same area published by the National Mapping and Resource Information Authority (NAMRIA) were used for the geometric accuracy assessment. These points were mostly road intersections and bridges. The Universal Transverse Mercator Zone 51 World Geodetic System 1984 (UTM 51 WGS84) grid coordinates of each point were determined both on the image and on the maps. Comparison of grid coordinates of these points in the 2001 Landsat image with those in the NAMRIA maps showed that the geometric accuracy of the image is acceptable with a global Root Mean Square Error (RMSE) of 10.25 meters and average local RMSE of 10.05, which are both less than half a pixel (<14.25 m).
The co-registration of the 1976 Landsat image to the 2001 Landsat image was next performed. In this case, the 2001 Landsat image is the reference image where the UTM coordinates of points on the 1976 Landsat image were compared. Based on 22 points common in both images, the global RMSE was computed as 16.62 m, with average local RMSE of 15.20 m. This indicates that the geometric accuracy of the 1976 Landsat image is acceptable and its co-registration with the 2001 Landsat image is good. Furthermore, as the global RMSE and average local RMSE is less than half a pixel (or 28.5 m), the 28.5-m resolution land-cover map derived from the 2001 Landsat image after undergoing resampling to 57-m resolution, will correctly align with the land-cover map derived from this 1976 Landsat image. This minimizes the error due to image misregistration in the change detection and analysis.
The Landsat images were then radiometrically corrected to at-sensor radiance using the standard Landsat image calibration formulas and constants [29,30]. A fast atmospheric correction using dark-object subtraction using band minimum [31] was also implemented. Normalized Difference Vegetation Index (NDVI) images were also computed from the radiometrically and atmospherically-corrected radiance images and used as an additional band during image classification. Only the portions of the images covering the study area were subjected to image analysis. All image processing was done using Environment for Visualizing Images (ENVI) Version 4.3 software.

2.3. Image Classification and Land-Cover Change Detection

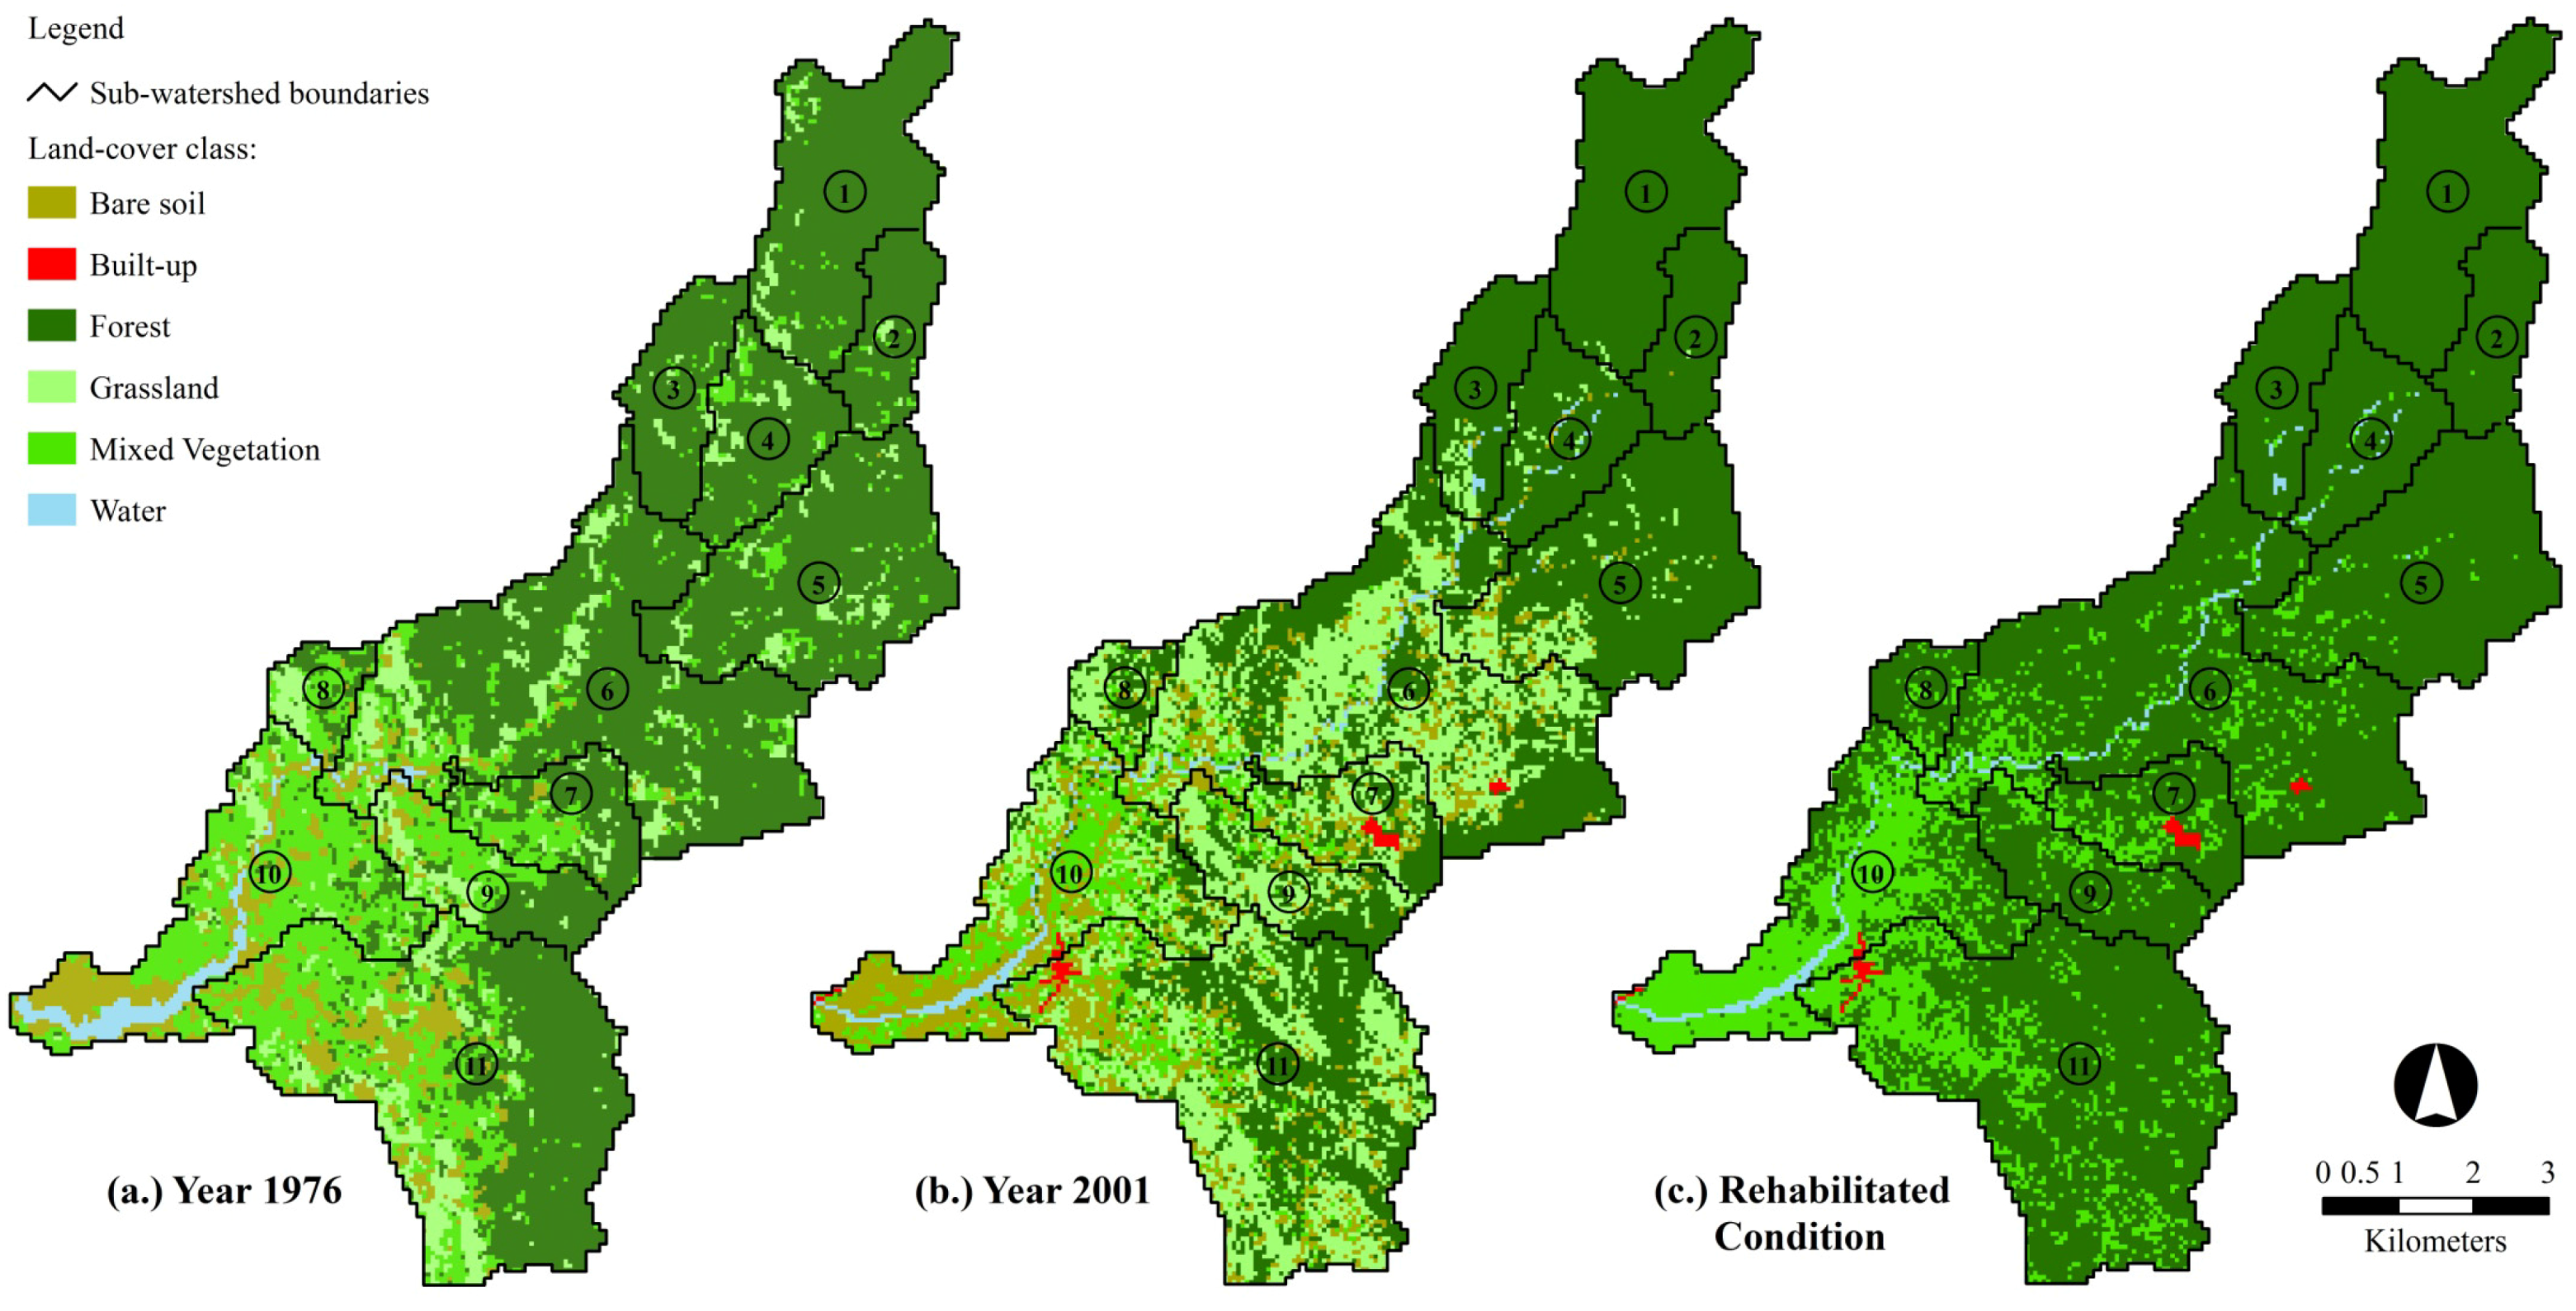
Six (6) land-cover classes were identified from the images through visual interpretations with the aid of ancillary datasets such as 1:50,000 NAMRIA topographic maps with map information obtained in 1977 (through aerial photography campaigns), Google Earth Images, and 1:250,000 2003 DENR land-cover and forest cover maps. This study acknowledges the limitation introduced by the absence of ground truth land-cover data necessary for the interpretation of the 1976 Landsat MSS image. Hence, the use of old topographic maps was imperative as a source of information for interpreting major land-cover classes in the 1976 Landsat image.
The land-cover classes include barren areas, built-up areas, forest, grassland, mixed vegetation (combination of forest, tree plantation, shrub land and grassland) and water bodies. In this study, each land-cover class is identified as closely as possible to the definitions by Anderson et al. [32]. Barren areas are defined as those portions of the watershed with exposed soil and in which less than half of an areal unit has vegetation or other cover while built-up areas are those portions of intensive human use with much of the land covered by structures. The forest class is defined as a parcel of land having a tree-crown areal density of 10% or more, and is stacked with trees capable of producing timber or other wood products. Grasslands are those portions where the natural vegetation is predominantly grasses and/or grass-like plants.
Built-up areas within the study area were only detected on the 2001 Landsat ETM+ image. We assumed that built-up areas in the 1976, although present, were limited in extent and sparsely distributed so that they were not visible in the Landsat MSS images primarily because of the sensor’s low spatial resolution. Representative samples of each class were collected from the images for supervised image classification (Table 1). The training set comprised, as a minimum, a sample of typically 10–30 pixels per class per band [33], and were collected in such a way that the assumption of normal distribution of the MLC is satisfied and can provide an appropriate summary of the data’s distribution from which a representative estimate of the mean and variance may be derived [28]. It was also ensured that the separability of the classes, computed using the Jeffries-Matusita Distance [34], is ≥1.7. Another independent set of samples were likewise collected for accuracy assessment. A minimum number of 30 ground truth pixels were randomly chosen for each class, following the guidelines of Van Genderen et al. [35] to obtain a reliable estimate of classification accuracy of at least 90%.
Table 1. Land-cover classes identified from the Landsat MSS and ETM+ images of the study area with number of samples collected for classifier training and accuracy assessment.
Land-Cover ClassNumber of Pixels for Classifier TrainingNumber of Pixels for Accuracy Assessment
1976 Landsat MSS2001 Landsat ETM+1976 Landsat MSS2001 Landsat ETM+
Barren Areas1821704054
Built-up Areas-52-30
Forest2223716496
Grassland1222206291
Mixed Vegetation1391495854
Water
(along rivers and streams)
168923048
The MLC was used to classify the two Landsat images. For the 1976 Landsat image classification, all the four bands and the derived NDVI image were subjected to classification. The same was done for the classification of the 2001 Landsat ETM+ image where all the seven bands and the NDVI were utilized.
The accuracies of each classified image were independently assessed. Four measures were used to assess the accuracy of the classified images namely, the overall classification accuracy, kappa statistic, producer’s accuracy (PA) and user’s accuracy (UA) [36]. Initial trials were done to classify the input images using the Minimum Distance, Mahalanobis Distance and Parallepiped classifiers. However, the accuracies of each classified image using these classifiers were significantly lower (<90%) than those of the MLC-classified images. The two resulting land-cover maps were then subjected to post-classification comparison change detection analysis to examine the location, extent and distribution of land-cover change in the study area. The 2001 land-cover map was first re-sampled to 57-m resolution using nearest neighbor method prior to change detection.

3.2. Hydrologic Modeling

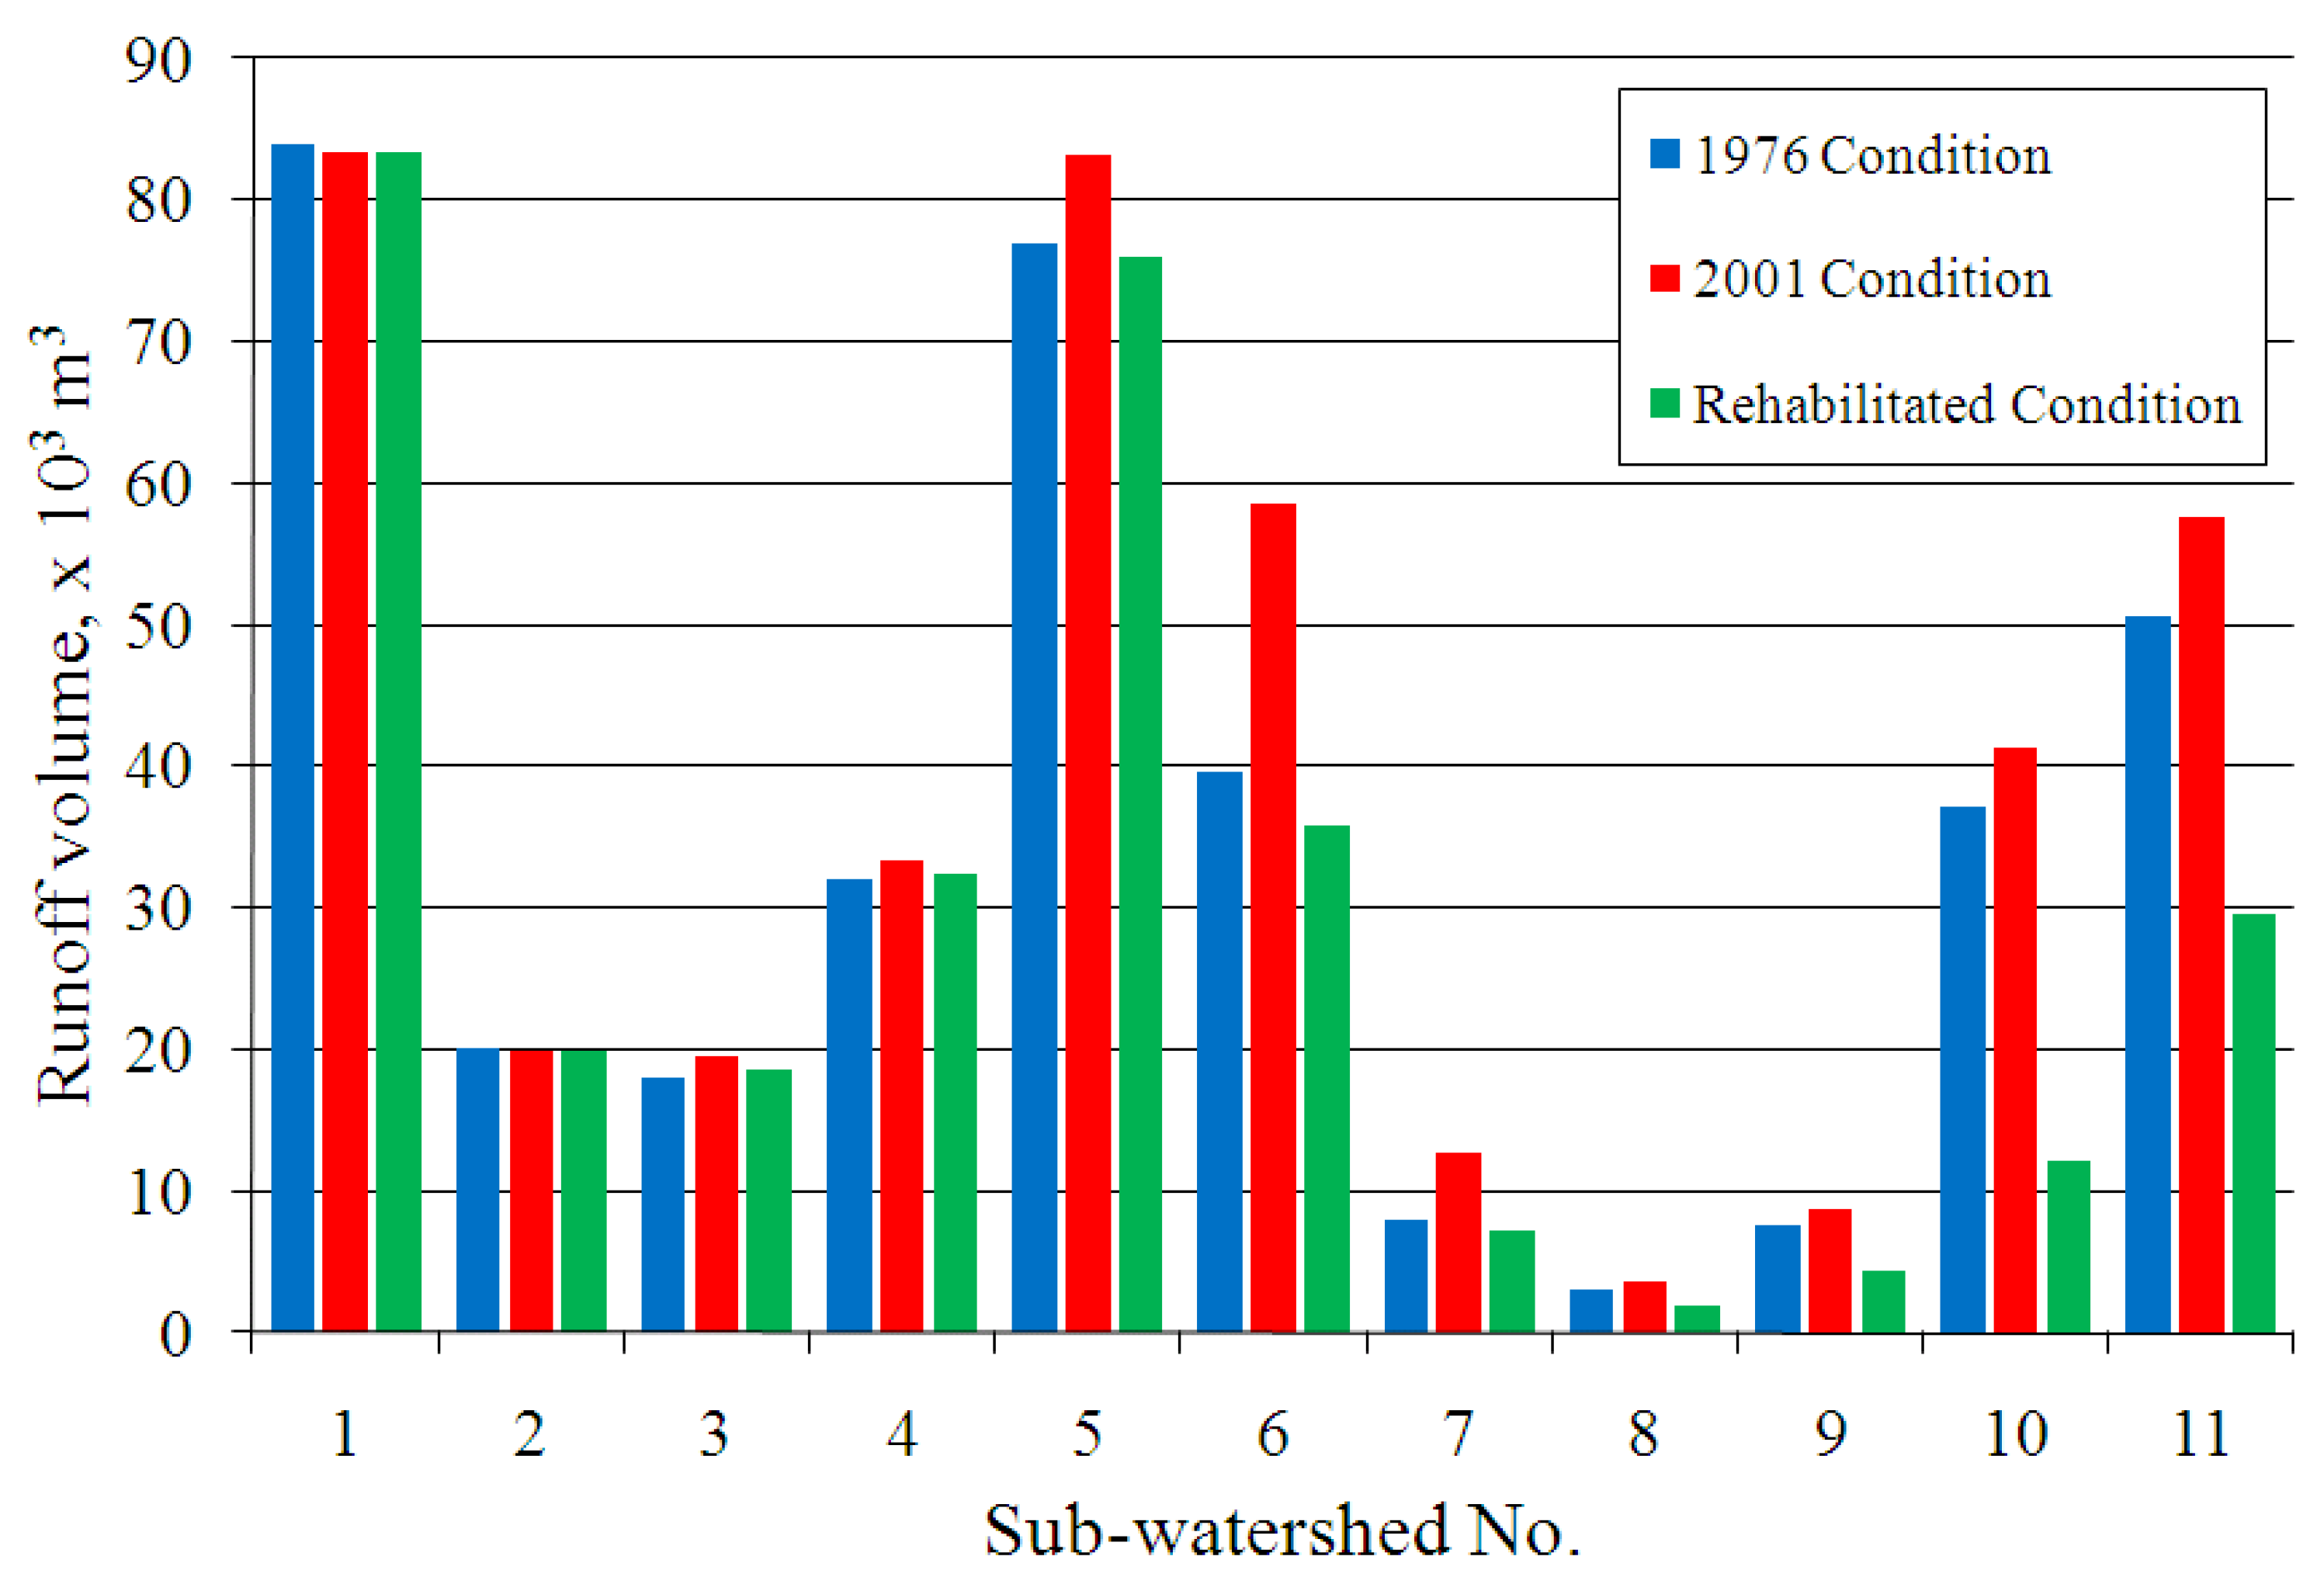
The land-cover information derived from the analysis of the Landsat images were integrated into a hydrologic model as a means of estimating the impacts of the differences in land-cover conditions to the hydrological processes of the watershed, specifically in the generation of runoff during rainfall events.
Hydrologic modeling was performed using the Soil Conservation Service-Curve Number (SCS-CN) model [15]. The SCS-CN model, also called the runoff curve number method, for the estimation of direct runoff from storm rainfall is a well established method in hydrologic engineering and environmental impact analyses and has been very popular because of its convenience, simplicity, authoritative origins, and its responsiveness to four readily grasped watershed properties: soil type, land-use/land-cover and treatment, surface condition, and antecedent moisture condition [37]. The popular form of the SCS-CN model is:
Q = ( P I a ) 2 P I a + S  for  I a P ,  otherwise  Q = 0
I a = λ S
S = 25400 C N 254
where P is total rainfall, Ia is initial abstraction, Q is direct runoff, S is potential maximum retention which can range (0, ∞), and λ is initial abstraction coefficient or ratio. All variables are in millimeters (mm) except for λ which is unitless. The initial abstraction Ia includes short-term losses due to evaporation, interception, surface detention, and infiltration and its ratio to S describes λ which depends on climatic conditions and can range (0, ∞). The SCS has adopted a standard value of 0.2 for the initial abstraction ratio [15] but this can be estimated through calibration with field measured hydrologic data. The potential maximum retention S characterizes the watershed’s potential for abstracting and retaining storm moisture, and therefore, its direct runoff potential [37]. S is directly related to land-cover and soil infiltration through the parameter CN or “curve number”, a non-dimensional quantity varying in the range (0–100) and depends on the antecedent moisture condition of the watershed. Higher CN values indicate high runoff potential. For normal antecedent moisture conditions (AMCII, 5-day antecedent rainfall (AR) is 12.7–27.94 mm), the CN values for land-cover types and soil textures (hydrologic soil groups B and D) prevalent in the study area are shown in Table 2. Spatially distributed soil texture data converted into a hydrologic soil group (HSG) map was obtained from the 1:150,000 soil map of the Philippines published by the Philippines’ Bureau of Soils and Water Management of the Department of Agriculture.
The AMCII CN values can be converted to AMCI (dry condition, AR < 12.7 mm) and AMCIII (wet condition, AR > 27.94 mm) using the formulas of Chow et al. [38] as
C N ( I ) = 4.2 C N ( I I ) 10 0.058 C N ( I I )
C N ( I I I ) = 23 C N ( I I ) 10 + 0.13 C N ( I I )
where CN(I), CN(II) and CN(III) are the CN values under AMC I, II and III, respectively.
The SCS-CN model was implemented using the Hydrologic Engineering Center-Hydrological Modeling System or HEC-HMS Version 3.3 [39]. The SCS-CN model was co-implemented with the Clark Unit Hydrograph method (for sub-watershed routing of runoff), the Exponential Baseflow Recession model, and the Muskingum-Cunge model for channel routing. A thorough discussion of these three additional models can be found in Chow et al. [38]. Model parameterizations were done using HEC-GeoHMS [
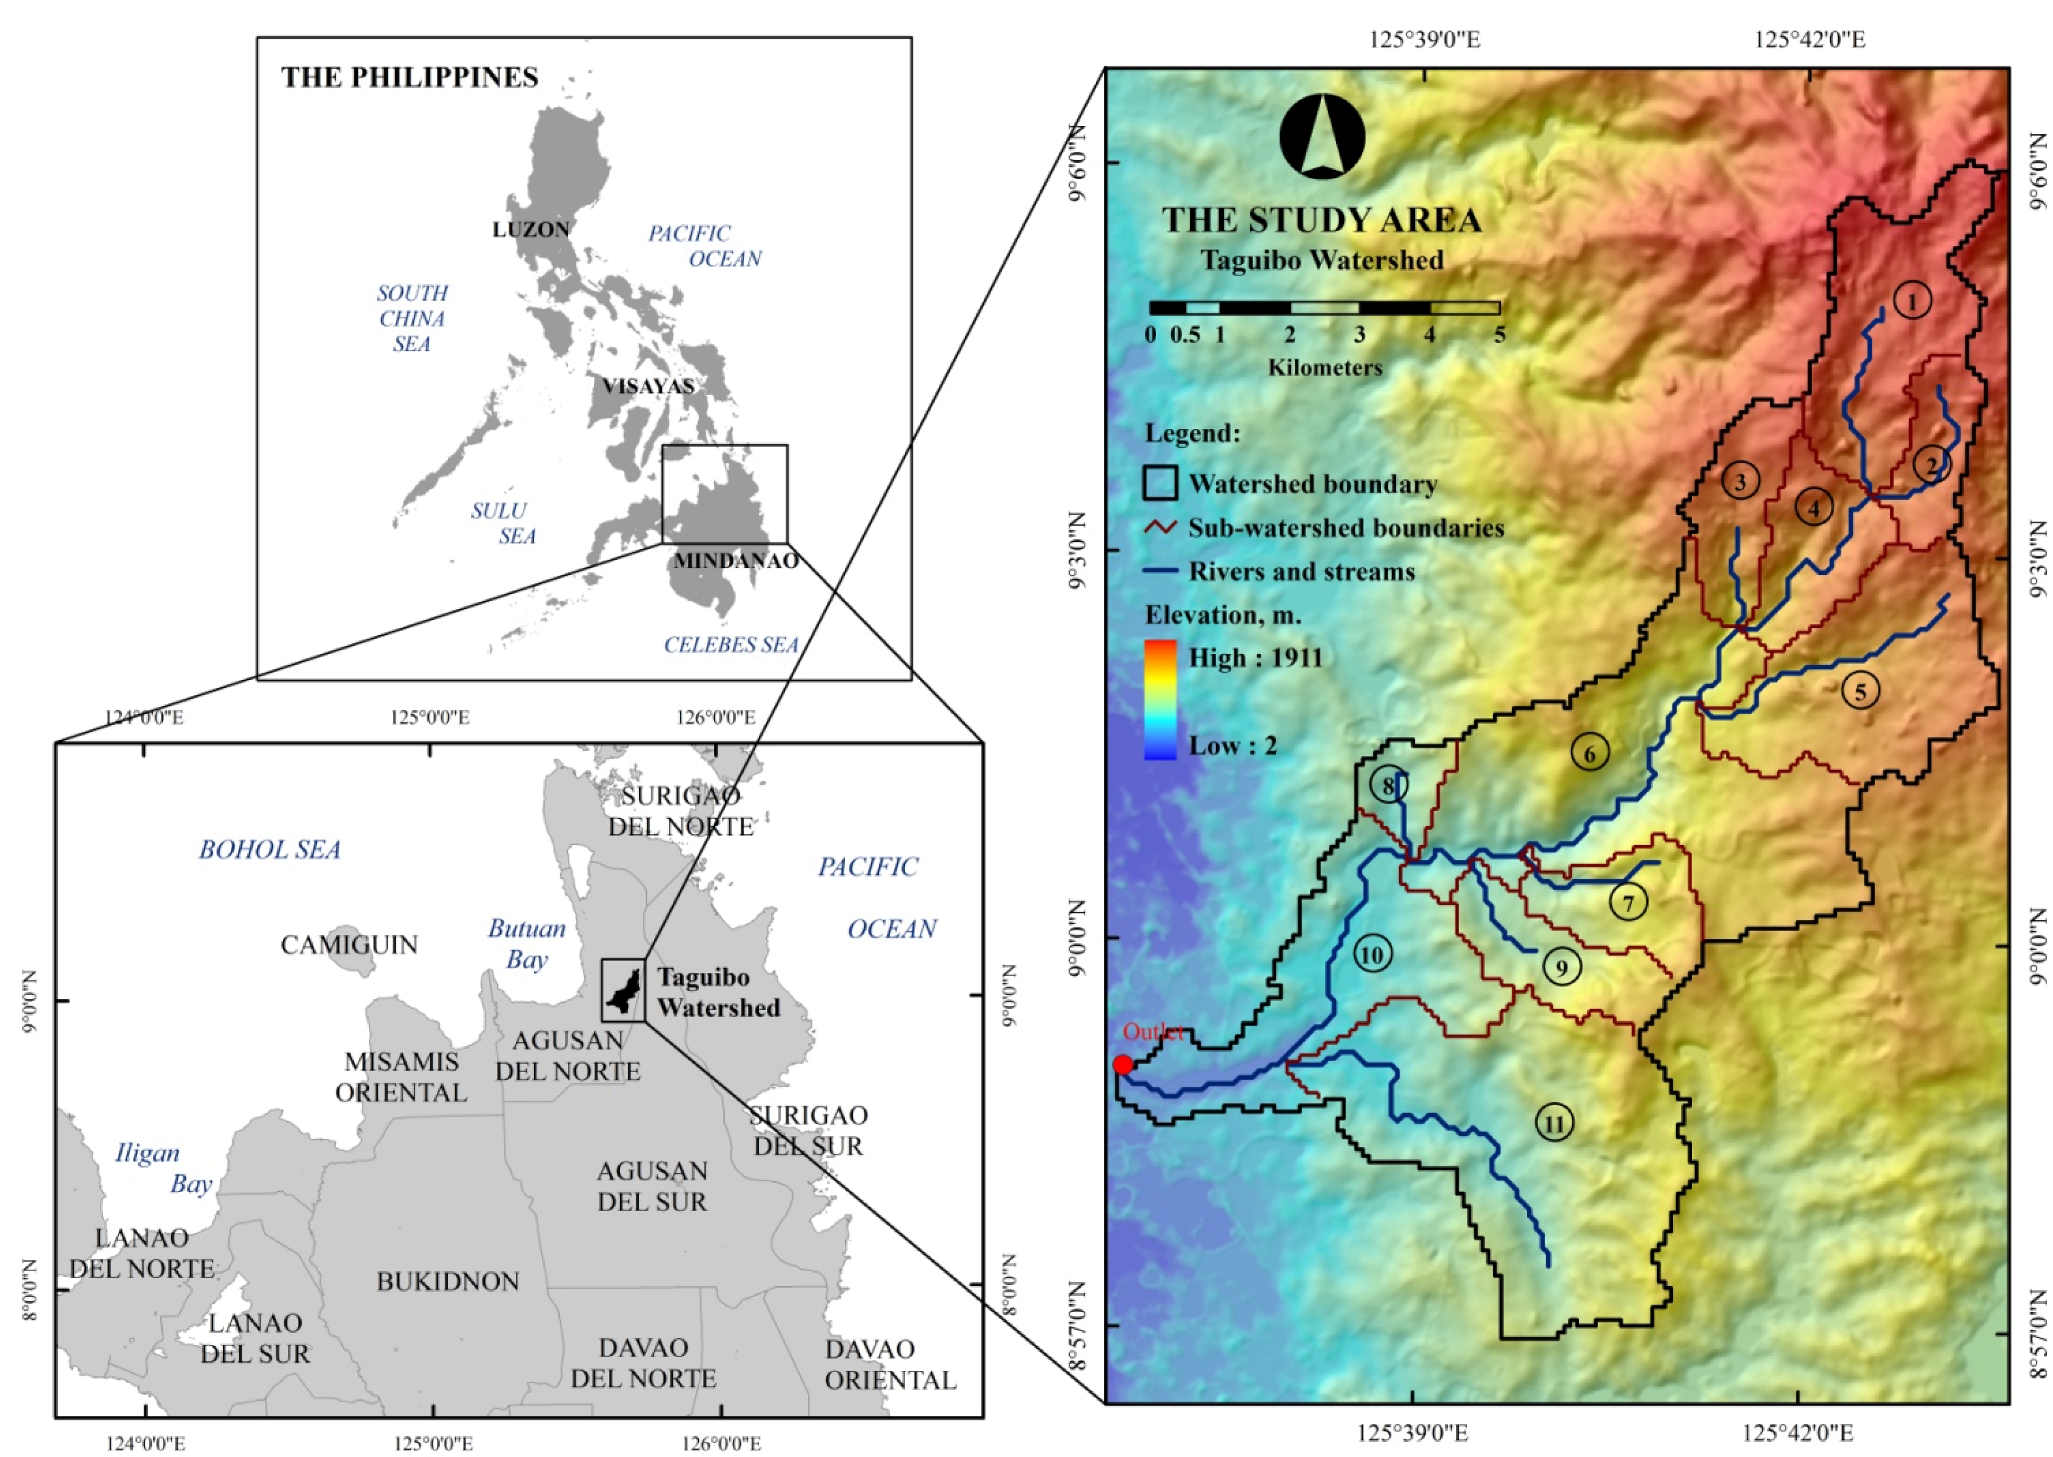
40], the ArcView GIS-based pre-processor of HEC-HMS. HEC-GeoHMS was used to delineate 11 sub-watershed boundaries and reproduce topologically-correct stream networks through a series of steps collectively known as terrain pre-processing, by utilizing the surface topography information from a 90 m spatial resolution Shuttle Radar Topography Mission Digital Elevation Model (SRTM DEM) as the origin of the boundaries and stream network.
Average CN values for each sub-watershed were computed based on the 2001 and 1976 land-cover maps. Sub-watershed time of concentration and storage coefficient parameters of the Clark Unit Hydrograph model as well as initial values of the baseflow recession constant in each sub-watershed were first assumed but these values were later optimized during the calibration stage. Muskingum-Cunge model parameter values were obtained from profile and cross-section surveys of the major streams conducted on April 2007.
Table 2. AMCII CN values for different land-cover types under hydrologic soil groups B and D which are prevalent in the study area. (Source: SCS National Engineering Handbook [15]).
Land-CoverAMCII Curve Number (CN)
Soil Group BSoil Group D
Barren areas8694
Built-up areas7486
Forest5577
Grassland6180
Mixed Vegetation5879
Water9898
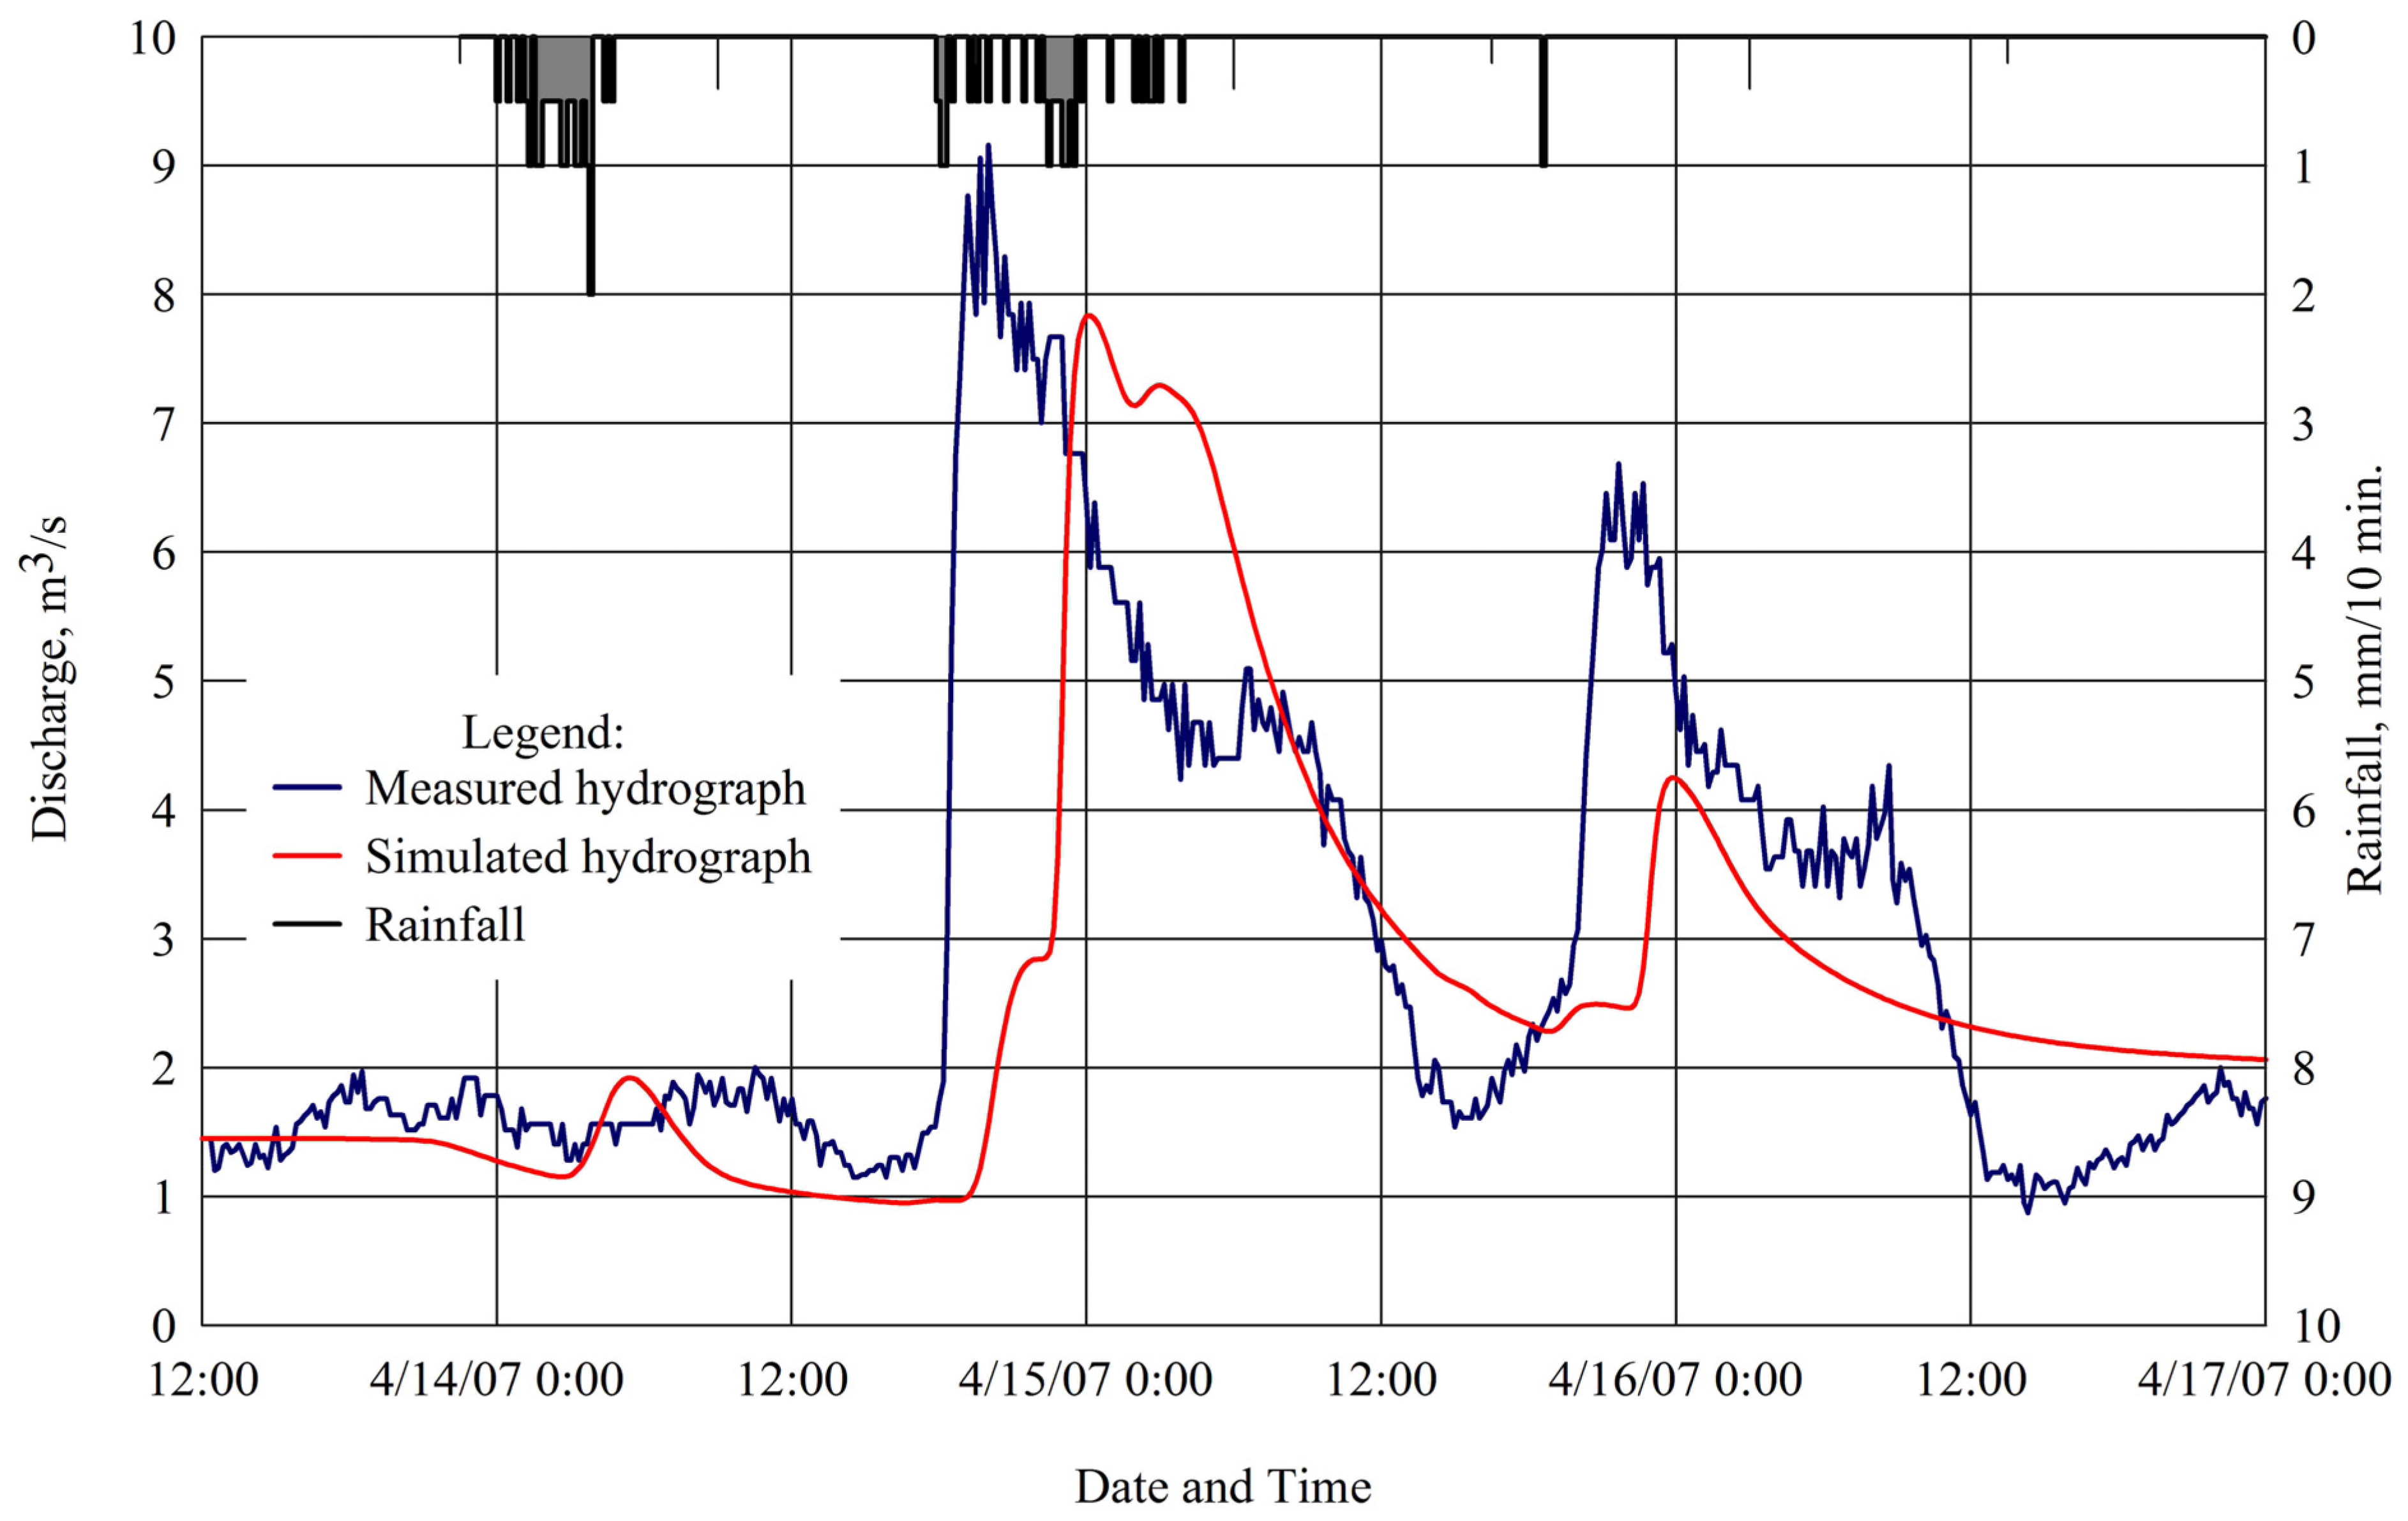
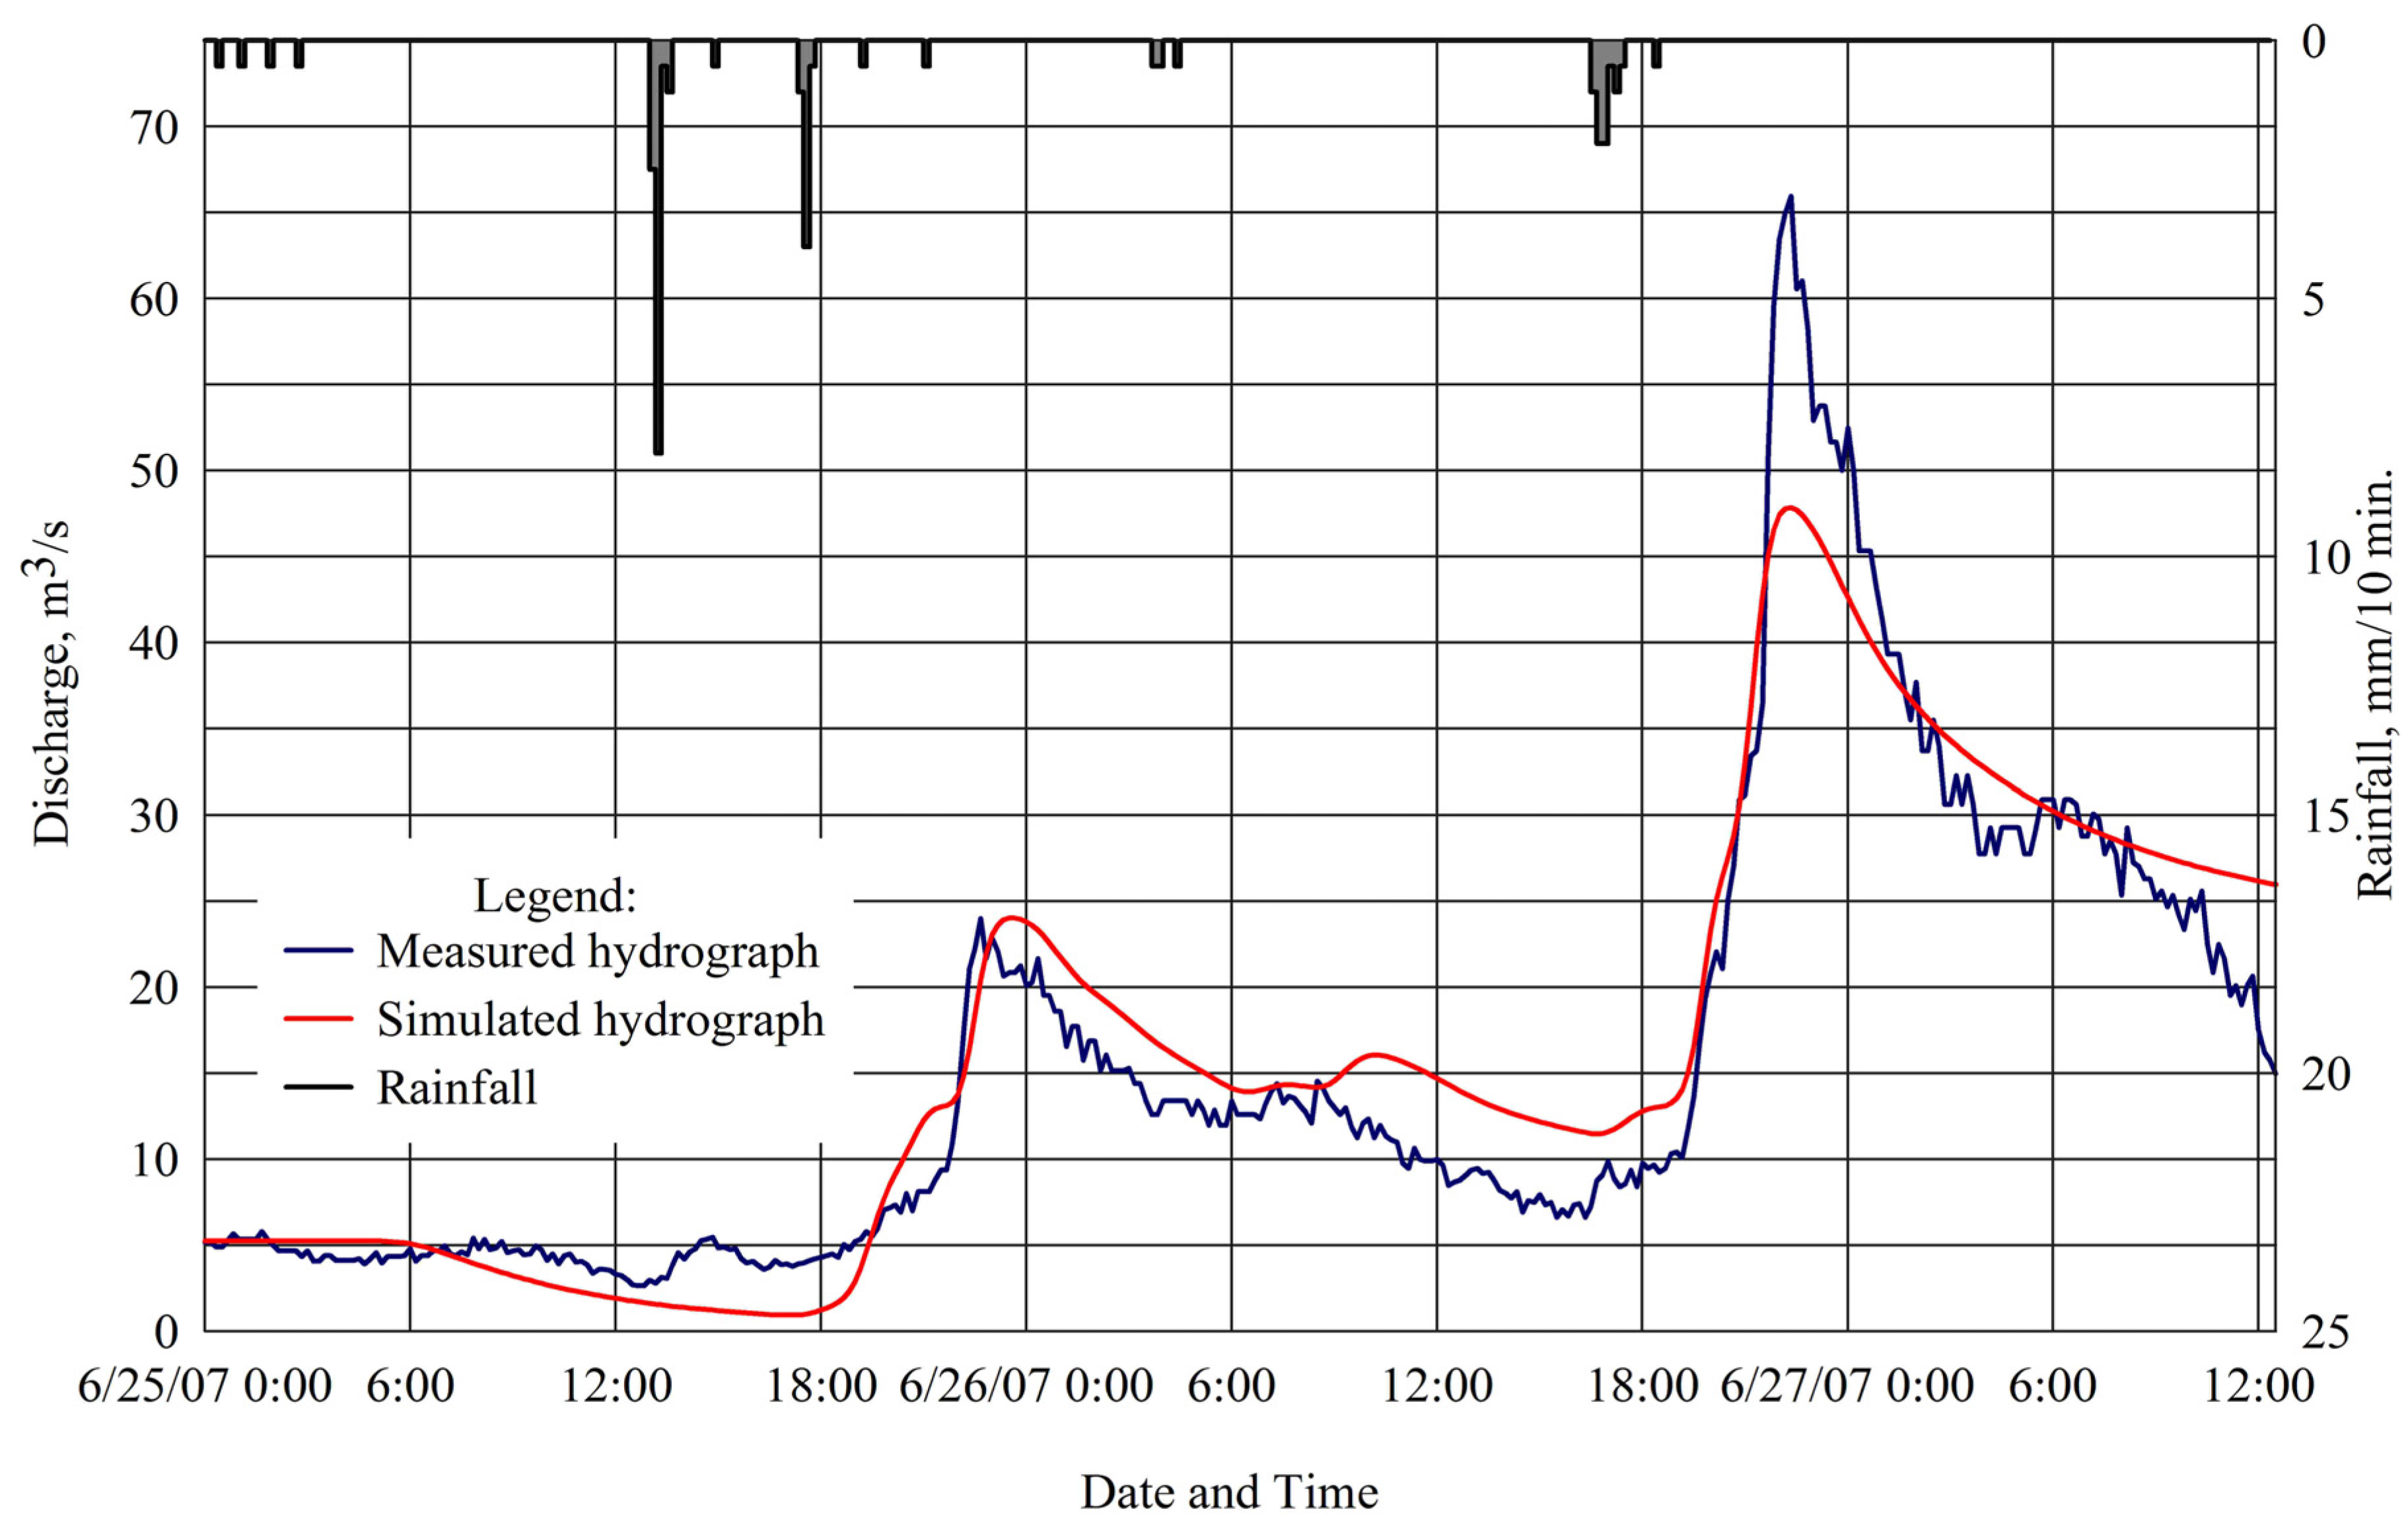
The HEC-HMS model was calibrated using rainfall events recorded at the middle portion of the watershed, and 10-minute discharge hydrographs measured at the main outlet for the 25–27 June 2007 period. Records of 5-day accumulated rainfall depths before the simulation showed an AR > 27.94 mm, indicating AMCIII. Hence, the AMCII CN values were transformed to AMCIII CN using Chow et al.’s formula [38]. The absence of sources of land-cover information for the state of the watershed when the calibration data were collected prompted us to parameterize the model using the 2001 land-cover map. During this period, available satellite images were all covered with a significant amount of cloud (>20% of scene) that totally hindered the derivation of accurate and complete land-cover information.
The hydrologic model calibration made use of the available automatic calibration utility in HEC-HMS. This procedure was done to simultaneously fine-tune the λ parameter of the SCS-CN model, and the time-related parameters of the Exponential Baseflow Recession model and Clark Unit Hydrograph model, which were initially assumed. This step includes adjustments or optimizations of the initial values of these parameters until the overall model results acceptably match the measured discharge data.
HEC HMS uses the peak-weighted root mean square error (PWRMSE) as the objective function to minimize during calibration. Parameters of the model were adjusted iteratively until the PWRMSE is minimized. PWRMSE is implicitly a measure of the comparison of the magnitudes of the peaks, volumes, and times of peak of the simulated and measured hydrographs. The Nelder and Mead (NM) algorithm [41] was used to minimize the PWRSME by identifying the most reasonable parameter values that will yield the best fit of computed to the observed hydrograph.
The model was then validated with 10-minute discharge data measured on 13–17 April 2007 where the watershed is in AMC II. Only the CN, Ia, baseflow recession constant and time-related parameters of the hydrologic model were changed to reflect the actual condition of the watershed during this period.
The Nash-Sutcliffe Coefficient of Model Efficiency, E [42], was used to evaluate the performance of the hydrologic model after calibration and during the validation process. E is a normalized, dimensionless statistic that determines the relative magnitude of the residual variance (“noise”) compared to the measured data variance and indicates how well the plot of observed versus simulated data fits the 1:1 line. E ranges between −∞ and 1.0 (1 included) with E = 1 being the optimal value. Values between 0.0 and 1.0 are generally viewed as accepted levels of performance while values ≤ 0.0 indicates that the mean observed value is a better predictor than the simulated value, which indicates unacceptable model performance [43].

3.3. Runoff Predictions in Three Land-Cover Conditions

The calibrated and validated hydrologic model was then used to simulate surface runoff in the 11 sub-watersheds under three land-cover conditions namely, 2001, 1976 and a “rehabilitated” condition. The latter was derived from the analysis of the 2001 image, where areas in urgent need of rehabilitation were identified. This includes areas classified as grassland and barren. In the “rehabilitated” land-cover map, grassland areas were re-classified as “forest” while barren areas were converted to “agro-forested areas” which is composed of mixed vegetation. This is in accordance with the rehabilitation strategy planned by the DENR that aims to reduce runoff that is generated during rainfall events.
In using the calibrated hydrologic model for predicting the impacts of land-cover change, as emphasized by the use of the three land-cover condition scenarios, only the CN parameter of the model that has a direct relationship with land-cover was altered. The same rainfall events used previously for model calibration were utilized again in the simulations. The results of the simulations were then analyzed (1) to determine the runoff responses of the watershed in 3 land-cover conditions, (2) to identify how different these responses are from one other, and (3) to verify if rehabilitation strategies could help in the reduction of runoff in the watershed under the assumption that the same rainfall events will take place. The general assumption here is that the physical and climatological conditions of the study area are constant for the three scenarios except for the land-cover.

4. Results and Discussion

4.1. Image Classification Results

The land-cover maps of the study area for 1976 and 2001 derived from classified Landsat images are shown in Figure 2(a,b). The 1976 land-cover map has an overall classification accuracy of 96.06% and kappa statistic of 0.95 while the 2001 land-cover map obtained 96.79% accuracy and kappa statistic of 0.96. Producer’s and User’s Accuracy for each land-cover type are listed in Table 3.
It can be observed that the land-cover maps derived from the classifications are highly accurate, with more than 90% Producer’s and User’s Accuracy for each land-cover class. This may be mainly due to the satisfaction of the assumptions of the MLC for class signatures to be normally distributed, and to the high degree of separability of the class signatures. While this holds true in the present study, in some cases, the number of training samples to obtain class signatures is limited and/or may not have normal distributions, which restricts the MLC to get the ideal result. The use of other classifiers such as DT, NN and SVM can solve this problem but at the cost of an increase in computation time.
Figure 2. The land-cover maps derived from the analysis of the Landsat MSS and ETM+ images through Maximum Likelihood classification. (a) 1976 land-cover map; (b) 2001 land-cover map; and (c) rehabilitated land-cover map. In (c), the watershed is in a condition where barren areas and grasslands detected from the 2001 Landsat ETM+ image as consequences of anthropogenic disturbances, were rehabilitated through their conversion to mixed vegetation and reforestation, respectively.
Remotesensing 03 01067 g002
Table 3. Producer’s (PA) and User’s Accuracy (UA) of the land-cover maps (in %).
Land-Cover Classes1976 Land-Cover Map2001 Land-Cover Map
PAUAPAUA
Barren areas92.5094.8798.1592.98
Built-up areas--100.00100.00
Forest100.0092.7598.9695.00
Grassland98.3998.3994.51100.00
Mixed Vegetation93.1098.18100.00100.00
Water93.3396.5591.67100.00

4.2. Land-Cover Change in the Taguibo Watershed

Comparing the two land-cover maps, we were able to determine changes in land-cover from 1976 to 2001 with respect to the total area of the watershed (Table 4). The analysis showed a 6.52% reduction in forest cover, a 13.69% reduction in mixed vegetation, a 4.46% increase in barren areas and 15.54% increase in grassland in the study area in the span of 25 years. The 4.46% increase in barren areas may be attributed to more recent human-induced alterations of the watershed, such as an increase in agricultural areas, forest denudation due to illegal logging and slash-and-burn farming and harvesting of planted trees [3]. A portion of the 6.52% reduction in forest cover maybe also due to these activities.
Table 4. 1976–2001 land-cover change statistics for the study area.
Land-Cover Classes1976 Area (km2)2001 Area (km2)% Change from 1976 with respect to total watershed area
Barren areas5.2018.569+4.46
Built-up areas-0.300+0.40
Forest46.28741.366−6.52
Grassland7.27119.008+15.54
Mixed Vegetation15.7035.359−13.69
Water1.0700.930−0.19
On the other hand, the reduction in mixed vegetation cover and increased in grassland areas may be the result of the historical modification of the watershed landscape by logging industries and the influx of farmers who were intent on cultivating the logged-over areas by planting high-valued vegetables and rice crops. When the potential for agricultural productivity of these areas have lessened through time, these were left over for grasses to grow [3]. A very good basis of this is the 15.54% increase in grassland areas.
The Landsat image analysis showed that drastic change happened in the mixed vegetation and grassland classes but not in forest cover. The reduction in forest cover in 25-year period is minimal, with more than 50% of the watershed’s forest cover still intact. Clearly, this indicates that majority of forest cover reduction due to commercial logging activities occurred earlier than 1976 and what remains to be mixed vegetation and grasslands in 1976 were already logged-over areas that have either been re-planted with trees or cultivated with plantation crops. This situation is similar in characteristics to what have been reported in the literature regarding deforestation in post-war Philippines: of almost 15 million hectares of the Philippine’s natural dipterocarp forest in 1950 only 4 million remained in 1992 [44,45]. A large part of these 4 million hectares is heavily logged-over forest of varying quality. From 1992 onwards, logging became officially prohibited in virgin forests, in areas over 1,000 meters in elevation and in areas with slopes of 50% and above. This shift in commercial logging policy may have saved the remaining forest cover in the study area.
A limitation with regards to detecting the severity of deforestation and other types of vegetative cover change in the study area is the unavailability of cloud-free remotely-sensed image between 1976 and 2001. There is a greater possibility that the recovery of vegetative cover in the study area had taken place in years earlier than 2001 and that drastic changes have occurred in the years prior to 1992.
The land-cover change statistics derived from the analysis of Landsat images is important and confirmed reports by the DENR that significant changes in the watershed’s land-cover had taken place. As shown in the next sections, these changes definitely will have an effect on the watershed’s runoff response to rainfall events.

4.2. Hydrologic Model Calibration and Validation Results

Figure 3 shows the simulation results of the hydrologic model parameterized with land-cover information from the 2001 Landsat images and calibrated with field measured discharge data for the 25–27 June 2007 period. The calibrated λ values for all the sub-watersheds that were obtained from the parameter optimizations range from 0.11 to 0.22, which indicates that the applicability of the standard values of λ = 0.20 set by SCS is not applicable to the Philippine setting. This conforms to the results of other studies on the SCS-CN methodology (e.g., [37,46]).
Figure 3. Results of hydrologic model calibration. The graph shows a comparison between the actual (measured) hydrograph simulated by the model and the measured hydrograph 25–27 June 2007.
Remotesensing 03 01067 g003
The computed E value after comparing the simulated hydrograph by the calibrated model to the measured hydrograph is 0.92, indicating a highly acceptable performance. However, there are portions of the simulated hydrograph that overestimate the outflow and underestimate the peak discharge, with an average residual of 2.95 m3/s. The total volume simulated by the model overestimated the observed value by only 5.52%. One of the plausible explanations for these slight differences in the simulated and measured hydrographs is the fact that the land-cover information used to parameterize during model calibration may be different to the actual land-cover of the study area when the field data were collected. Nevertheless, as the computed E value is very close to 1, the model could be used with modest efficiency for runoff predictions under different land-cover conditions of the watershed.
Figure 4 shows the results of the validation of the calibrated hydrologic model using discharge data collected on 13–17 April 2007. The model’s performance was found to be generally acceptable [43], with E = 0.21. It is apparent that the simulated hydrograph generally followed the shape of the measured hydrograph. The peak flows were underestimated and the timings were delayed. In terms of total outflow volume, the model underestimated by 10.90%.
Figure 4. Results of hydrologic model validation. The graph shows a comparison between the actual (measured) hydrograph simulated by the model and the measured hydrograph for the 13–17 April 2007 period.
Remotesensing 03 01067 g004
At this point, a hydrologic model of the study area has already been prepared through the GIS-based integration of Landsat image analysis with widely accepted methods in hydrologic modeling. The model has also been calibrated and validated with measured data, and could be used with modest efficiency for assessment of land-cover change impacts on runoff. The changes in land-cover could be incorporated by manipulating the CN parameter of the SCS-CN component of the model. By setting an initial land-cover distribution, computing the mean CN for the sub-watersheds, and setting a value for Ia using the calibrated λ, an outflow hydrograph could be simulated to estimate runoff resulting from a specific rainfall event. This simulated hydrograph could easily be compared to another hydrograph that resulted from the same rainfall event falling on the watershed with a different land-cover condition. From this, both quantitative and visual assessment could be made to determine the magnitude of the impacts of the changes in the land-cover on runoff.

4.3. Runoff Predictions in 3 Land-Cover Conditions

The “rehabilitated” land-cover map of the watershed is shown in Figure 2(c). In this map, the watershed is in a condition where barren areas and grasslands detected from the 2001 Landsat ETM+ image as consequences of anthropogenic disturbances, were rehabilitated through their conversion to mixed vegetation and reforestation, respectively.
Model predicted accumulated runoff volume at each outlet of the 11 sub-watersheds under 3 land-cover conditions are summarized in Table 5 and shown in Figure 5. It can be observed that there were minimal differences in the accumulated runoff volumes in sub-watersheds 1, 2, 3 and 4 for the three land-cover conditions. This means that these sub-watersheds experienced minimal changes in land-cover, as confirmed by the results of Landsat image analysis and change detection (Table 6). The graph also illustrates the high runoff potential of these particular sub-watersheds. Although the majority of land-cover in these areas is forest, the runoff generated during rainfall events is high. This demonstrates the effects of steep slopes and the shallowness of the soil in these areas that give minimal span for the rainwater to infiltrate the ground.
Table 5. Sub-watershed (SW) accumulated runoff volumes for the three land-cover scenarios simulated by the model (25–27 June 2007 period).
SW1976 Condition2001 ConditionRehabilitated Condition
Runoff% ChangeRunoffRunoff% Change
VolumeFrom 2001VolumeVolumeFrom 200
(x103 m3)Condition(x103 m3)(x103 m3)Condition
183.9380.7383.33283.292−0.05
220.0971.1119.87619.854−0.11
318.055−7.1619.44718.626−4.22
431.948−3.9633.26732.390−2.64
576.882−7.6183.21775.977−8.70
639.588−32.3558.52035.866−38.71
77.868−37.7012.6317.106−43.74
83.078−12.893.5331.895−46.36
97.632−12.878.7594.433−49.39
1037.138−10.2141.36312.061−70.84
1150.547−12.2457.59629.494−48.79
Total376.771421.540320.996
Pronounced variation in runoff volumes were observed for the remaining watersheds in the 1976 and 2001 land-cover conditions, most especially in sub-watersheds 5, 6, 7, 9, 10 and 11. It can be stated that changes in major land-cover types in these areas, specifically the increase of barren areas and grasslands and the decrease in forest and mixed vegetation covers (Table 6) have directly affected the hydrologic response of the watershed to rainfall events. In this scenario, rainfall interception and infiltration have been affected such that huge volumes of surface runoff are generated.
Figure 5. Model predicted accumulated runoff volume for the 11 sub-watersheds from 25 to 27 June 2007 under 3 land-cover conditions (25–27 June 2007 period).
Remotesensing 03 01067 g005
Table 6. Major land-cover change from 1976 to 2001 in sub-watersheds (SW). Percentage of change is computed with respect to the area of the sub-watershed. Negative values indicate reduction in percentage area from the 1976 condition. Highlighted are those SW where significant land-cover change has taken place.
SW No.Area (km2)% Change in Barren Areas% Change in Forest% Change in Grassland% Change in Mixed Vegetation
17.160.006.385−4.065−2.32
22.5190.136.923−2.236−4.815
33.1750.64−2.4914.688−4.634
43.6371.798.868−4.332−8.823
58.7483.803.6825.9076.204
616.4837.2826.94627.0538.964
73.22412.5218.21825.9323.512
81.5312.908.10217.828.146
93.4592.711.91224.05127.818
109.0569.013.37913.63921.119
1116.542.395.65823.83721.204
In terms of total surface runoff accumulated at the main outlet of the watershed (Table 7), model predictions showed that accumulated runoff volume in 1976 was 10.62% less than in 2001. Rehabilitation of the sub-watersheds through planting of mixed vegetation and reforestation was found effective; it reduced the accumulated runoff volume in 2001 by 23.85%. These results provide quantitative estimations that rehabilitation strategies proposed by the DENR, should they be 100% implemented, are most likely to reduce the volume of runoff generated during rainfall events in the Taguibo Watershed.
The results of the hydrologic model simulations show that the scale of the observed change in runoff volumes during rainfall events is consistent with deforestation and mixed vegetation conversion, and that these specific changes in land-cover are most likely the cause of the observed change. These results are consistent with those of Costa et al. [47] and Siriwaderna et al. [48].
Table 7. Accumulated runoff volumes in 3 land-cover conditions (total for 11 sub-watersheds) for the 25–27 June 2007 period.
Land-cover conditionAccumulated watershed runoff volume, ×103 m3% Difference from the 2001 condition
1976376.771−10.62%
2001 (reference)421.540
Rehabilitated320.996−23.85%

5. Conclusions

We have presented an analysis of 25-year land-cover change in the critical Taguibo Watershed in Mindanao, Philippines using post-classification comparison analysis of Maximum Likelihood-classified Landsat images. We expanded our analysis by incorporating the detected changes in land-cover to a GIS-based hydrologic model. This allowed us to better understand the impacts of the land-cover change to the increase in surface runoff during rainfall events in the Taguibo Watershed. The Landsat image analysis also provided us with a very quick identification of areas that need rehabilitation. Using the hydrologic model, we tested planned rehabilitation strategies that were aimed to reduce surface runoff, and we were able to express the effectiveness of these strategies. One of the most important results of this study is that we were able to establish the direct relationship between forest and mixed vegetation cover reduction (and their subsequent conversion to grassland and barren areas) to increases in surface runoff. Although no evidence is available to show that a large change in runoff volume has occurred during the 25-year period, the model simulations indicate that with the land-cover changes that have occurred, there is a change in the simulated runoff.
This study has demonstrated the usefulness of multi-temporal Landsat images in detecting land-cover change, in identifying areas for rehabilitation, and in evaluating rehabilitation strategies for the management of tropical watersheds through its use in hydrologic modeling. Although the methods used in this study was applied in a relatively small watershed, its applicability to large watersheds and river basins is also possible as long as there are available Landsat images to derive land-cover information needed for detecting and locating the changes, and for hydrologic modeling. Since Landsat images acquired since 1972 are now available over the internet, the methods employed in this study can be readily applied for watershed land-cover change monitoring, management and rehabilitation.

Acknowledgements

The authors wish to thank the Philippine Council for Advanced Science and Technology Research and Development of the Department of Science and Technology (PCASTRD-DOST) for funding this research, Engrs. Alexander S. Caparas, Jessie Linn P. Ablao (of University of the Philippines-Diliman) and Michelle V. Japitana (Caraga State University) who assisted us during the field surveys, and the Field Operations Center of the Philippine Atmospheric Geophysical and Astronomical Services Administration (PAGASA) for providing the tipping bucket rain gauge used in this study. We also thank the two anonymous reviewers for their comments and suggestions that improved the clarity of the paper.

References

  1. McColl, C.; Aggett, G. Land-use forecasting and hydrologic model integration for improved land-use decision support. J. Environ. Manage. 2007, 84, 494–512. [Google Scholar] [CrossRef] [PubMed]
  2. Cebecauer, T.; Hofierka, J. The consequences of land-cover changes on soil erosion distribution in Slovakia. Geomorphology 2008, 98, 187–198. [Google Scholar] [CrossRef]
  3. DENR. Taguibo River Watershed Management Plan; Department of Environment and Natural Resources: Butuan City, Agusan del Norte, Philippines, 2003. [Google Scholar]
  4. Engman, E.T. Remote sensing applications to hydrology: Future impact. Hydrol. Sci. 1996, 41, 637–647. [Google Scholar] [CrossRef]
  5. Engman, E.T. The use of remote sensing data in watershed research. J. Soil Water Conserv. 1995, 50, 438. [Google Scholar]
  6. Bach, H.; Braun, M.; Lampart, G.; Mauser, W. Use of remote sensing for hydrological parameterisation of Alpine catchments. Hydrol. Earth Syst. Sci. 2003, 7, 862–876. [Google Scholar] [CrossRef]
  7. Melesse, A.M.; Shih, S.F. Spatially distributed storm runoff depth estimation using Landsat images and GIS. Comput. Electron. Agric. 2002, 37, 173–183. [Google Scholar] [CrossRef]
  8. Pandey, A.; Chowdary, V.M.; Mal, B.C.; Billib, M. Runoff and sediment yield modeling from a small agricultural watershed in India using the WEPP model. J. Hydrol. 2008, 348, 305–319. [Google Scholar] [CrossRef]
  9. Bhuyan, S.J.; Koelliker, J.K.; Marzen, L.J.; Harrington, J.A. An integrated approach for water quality assessment of a Kansas watershed. Environ. Model. Softw. 2003, 18, 473–484. [Google Scholar] [CrossRef]
  10. O’Connell, P.E.; Ewen, J.; O’Donnell, G.; Quinn, P. Is there a link between agricultural land-use management and flooding? Hydrol. Earth Syst. Sci. 2007, 11, 96–107. [Google Scholar] [CrossRef]
  11. Vafeidis, A.T.; Drake, N.A.; Wainwright, J. A proposed method for modelling the hydrologic response of catchments to burning with the use of remote sensing and GIS. Catena 2007, 70, 396–409. [Google Scholar] [CrossRef]
  12. Helmschrot, J.; Flügel, W. Land use characterisation and change detection analysis for hydrological model parameterisation of large scale afforested areas using remote sensing. Phys. Chem. Earth 2002, 27, 711–718. [Google Scholar] [CrossRef]
  13. LeBlanc, M.J.; Favreau, G.; Massuel, S.; Tweed, S.O.; Loireau, M.; Cappelaere, B. Land clearance and hydrological change in the Sahel: SW Niger. Glob. Planetary Change 2008, 61, 135–150. [Google Scholar] [CrossRef]
  14. Niehoff, D.; Fritsch, U.; Bronstert, A. Land-use impacts on storm-runoff generation: Scenarios of land-use change and simulation of hydrological response in a meso-scale catchment in SW-Germany. J. Hydrol. 2002, 267, 80–93. [Google Scholar] [CrossRef]
  15. SCS. National Engineering Handbook, Section 4: Hydrology; US Department of Agriculture, Soil Conservation Service: Washington, DC, USA, 1985.
  16. Coppin, P.; Jonckheere, I.; Nackaerts, K.; Muys, B. Digital change detection methods in ecosystem monitoring: A review. Int. J. Remote Sens. 2004, 25, 1565–1596. [Google Scholar] [CrossRef]
  17. Jensen, J.R. Introductory Digital Image Processing: A Remote Sensing Perspective; Prentice-Hall: Upper Saddle River, NJ, USA, 2004. [Google Scholar]
  18. Cherill, A.J.; Lane, A.; Fuller, R.M. The use of classified Landsat 5 Thematic Mapper imagery in the characterization of landscape composition: A case study in Northern England. J. Environ. Manage. 1994, 40, 357–377. [Google Scholar] [CrossRef]
  19. Cingolani, A.M.; Renison, D.; Zak, M.R.; Cabido, M.R. Mapping vegetation in a heterogeneous mountain rangeland using Landsat data: An alternative method to define and classify land-cover units. Remote Sens. Environ. 2004, 92, 84–97. [Google Scholar] [CrossRef]
  20. Hagner, O.; Reese, H. A method for calibrated maximum likelihood classification of forest types. Remote Sens. Environ. 2007, 110, 438–444. [Google Scholar] [CrossRef]
  21. Swain, P.H.; Davis, S.M. Remote Sensing: The Quantitative Approach; McGraw-Hill: New York, NY, USA, 1978. [Google Scholar]
  22. Muttitanon, W.; Tripathi, N.K. Land use/land cover changes in the coastal zone of Ban Don Bay, Thailand using Landsat 5 TM data. Int. J. Remote Sens. 2005, 26, 2311–2323. [Google Scholar] [CrossRef]
  23. Chowdhury, R. Landscape change in the Calakmul Biosphere Reserve, Mexico: Modeling the driving forces of smallholder deforestation in land parcels. Appl. Geogr. 2006, 26, 129–152. [Google Scholar] [CrossRef]
  24. Vagen, T.G. Remote sensing of complex land use change trajectories—A case study from the highlands of Madagascar. Agr. Ecosyst. Environ. 2006, 115, 219–228. [Google Scholar] [CrossRef]
  25. Huang, C.; Davis, L.S.; Townshend, J.R.G. An assessment of support vector machines for land cover classification. Int. J. Remote Sens. 2002, 23, 725–749. [Google Scholar] [CrossRef]
  26. Shuying, J.; Deren, L.; Jingwen, W. A Comparison of Support Vector Machine with Maximum Likelihood Classification Algorithms on Texture Features. In Proceedings of IEEE International Geoscience and Remote Sensing Symposium, Soeul, Korea, 25–29 July 2005; Volume 5, pp. 3717–3720.
  27. Otukei, J.R.; Blaschke, T. Land cover change assessment using decision trees, support vector machines and maximum likelihood classification algorithms. Int. J. Appl. Earth Obs. Geoinf. 2010, 12, S27–S31. [Google Scholar] [CrossRef]
  28. Foody, G.M.; Mathur, A. Relative evaluation of multiclass image classification by Support Vector Machines. IEEE Trans. Geosci. Remote Sens. 2002, 42, 1335–1343. [Google Scholar] [CrossRef]
  29. Markham, B.L.; Barker, J.L. Landsat MSS and TM Post-Calibration Dynamic Ranges, Exoatmospheric Reflectances and at-Satellite Temperatures; EOSAT Landsat Technical Notes No. 1; EOSAT: Lanham, MD, USA, 1986. [Google Scholar]
  30. NASA. Landsat-7 Science Data User’s Handbook. Available online: http://landsathandbook.gsfc.nasa.gov/handbook.html (accessed on 15 April 2008).
  31. Schowengerdt, R.A. Remote Sensing: Models and Methods for Image Processing; Academic Press: San Diego, CA, USA, 1997. [Google Scholar]
  32. Anderson, J.R.; Hardy, E.E.; Roach, J.T.; Witmer, R.E. A Land Use and Land Cover Classification System for Use with remote Sensor Data; USGS Professional Paper 964; US GPO: Washington, DC, USA, 1976.
  33. Mather, P.M. Computer Processing of Remotely-Sensed Images, 2nd ed.; Wiley: New York, NY, USA, 1999. [Google Scholar]
  34. Richards, J.A.; Jia, X. Remote Sensing Digital Image Analysis: An Introduction; Springer: Berlin, Germany, 1999. [Google Scholar]
  35. Van Genderen, J.L.; Lock, B.F.; Vass, P.A. Remote sensing: statistical testing of thematic map accuracy. Remote Sens. Environ. 1978, 7, 3–14. [Google Scholar] [CrossRef]
  36. Congalton, R.G.; Green, K. Assessing the Accuracy of Remotely Sensed Data: Principles and Practices; Lewis Publishers: Boca Rotan, FL, USA, 1999. [Google Scholar]
  37. Ponce, V.M.; Hawkins, R.H. Runoff curve number: Has it reached maturity? J. Hydrol. Eng. 1996, 1, 11–19. [Google Scholar] [CrossRef]
  38. Chow, V.T.; Maidment, D.R.; Mays, L.W. Applied Hydrology; McGraw-Hill: New York, NY, USA, 1988. [Google Scholar]
  39. USACE. Hydrologic Modeling System HEC-HMS Technical Reference Manual; US Army Corps of Engineers, Hydrologic Engineering Center: Davis, CA, USA, 2000.
  40. USACE. Geospatial Hydrologic Modelling Extension HEC-GeoHMS User’s Manual; Version 1.1; US Army Corps of Engineers, Hydrologic Engineering Center: Davis, CA, USA, 2003.
  41. Nelder, J.A.; Mead, R. A simplex method for function minimization. The Comput. J. 1965, 7, 308–313. [Google Scholar] [CrossRef]
  42. Nash, J.E.; Sutcliffe, J.V. River flow forecasting through conceptual models, I—A discussion of principles. J. Hydrol. 1970, 10, 282–290. [Google Scholar] [CrossRef]
  43. Moriasi, D.N.; Arnold, J.G.; Van Liew, M.W.; Bingner, R.L.; Harmel, R.D.; Veith, T.L. Model evaluation guidelines for systematic quantification of accuracy in watershed simulations. Trans. ASABE 2007, 50, 885–900. [Google Scholar] [CrossRef]
  44. Van den Top, G.M. The Social Dynamics of Deforestation in the Sierra Madre, Philippines; NIASS Press: Amsterdam, The Netherlands, 1998. [Google Scholar]
  45. Verburg, P.H.; Veldkamp, A. Projecting land use transitions at forest fringes in the Philippines at two spatial scales. Landscape Ecol. 2004, 19, 77–98. [Google Scholar] [CrossRef]
  46. Mishra, S.K.; Sahu, R.K.; Eldho, T.I.; Jain, M.K. An improved Ia-S relation incorporating antecedent moisture in SCS-CN methodology. Water Resour. Manage. 2006, 20, 643–660. [Google Scholar] [CrossRef]
  47. Costa, M.H.; Botta, A.; Cardille, J.A. Effects of large-scale changes in land cover on the discharge of the Tocantins River, Southeastern Amazonia. J. Hydrol. 2003, 283, 206–217. [Google Scholar] [CrossRef]
  48. Siriwardena, L.; Finlayson, B.L.; McMahon, T.A. The impact of land use change on catchment hydrology in large catchments: The Comet River, Central Queensland, Australia. J. Hydrol. 2006, 326, 199–214. [Google Scholar] [CrossRef]

