1. Introduction
Biological soil crusts are organo-mineral complexes resulting from the colonisation of the soil surface by communities of micro-organisms,
i.e., cyanobacteria, bacteria, algae, lichens and mosses. They are widespread in arid and semi-arid environments where they perform a number of important functions [
1,
2,
3,
4,
5,
6]. The ability of these organisms to colonize bare substrates is due to their ability to withstand high temperatures, radiation, low water potential, and their capability to move up and down the soil surface as a response to changes in soil moisture availability [
7]. They also have the ability to remain dormant in a dry state for long periods of time.
Biological soil crusts (BSC) that occur within the Sahelian zone are associated with various types of physical soil crusts in sandy soils that have been left fallow and in soils of a “tiger bush ecosystem” (landscape with a typical pattern consisting of alternating densely vegetated bands, comprising small trees and shrubs, and bare soil bands) [
5,
8,
9]. Their appearance at the soil surface was interpreted as the first sign of soil degradation [
10,
11]. Their beneficial impact on ecological processes has been observed on degraded soil in Sahel in Western Niger [
5,
9,
12,
13]. Undisturbed BSCs enhance the quality of degraded soil by providing a more stable structure and water retaining substratum [
5,
9,
12] and increasing fertility by N and C fixations [
13].
Monitoring the location, extension and/or degradation of BSC is worth studying in order to evaluate ecological functions of such crusts at regional scale. This study is a part of the BioCrust project (Biological soil crusts’ vulnerability and soil surface disturbance in Sahelian zone), a project on microbiotic crust vulnerability and soil degradation in Sahelian zone. The purpose of BioCrust is to improve the understanding of the temporal and spatial dynamics of BSCs in Sahelian ecosystems and to provide tools for management in assessing soil degradation due to future changes in land uses and climate.
The direct mapping of biological soil crusts from satellite imagery is not possible in Sahelian areas. Mapping by optical imagery should determine the areas of potential presence and development of biological crusts, based on favourable criteria to their development (in particular on the land occupation such as fallow and plateaus). Moreover, as the presence and the development of biological crusts is supposededly dependent on soil moisture content, a relationship between radar signal and crusts presence could be possible. Indeed, the radar signal is strongly dependent on the soil moisture and it seems that the biological crusts need a certain moisture level for their development. With the radar imagery, the soil moisture maps could be used to add supplementary information in the research of areas favorable to crusts development.
Radar sensors allow mapping irrespective of meteorological conditions (clouds, fog,
etc.), both day and night. This is not the case with optical sensors, which are not possible if there is cloud cover, a frequent situation in rainy season. The Soil Surface Characteristics can be estimated from microwave remote sensing sensors due to the sensitivity of the radar signal to soil characteristics such as the soil’s roughness and dielectric constant [
14,
15,
16]. In addition, the radar signal depends on various radar parameters such as polarization, incidence angle and frequency. The penetration depth of a radar wave in vegetation cover is more important at a high than a low radar wavelength (L-band rather than X-band) [
16]. Baghdadi
et al. [
17] used TerraSAR-X data to show that, after strong rains, the soil contribution to the backscattering of sugarcane fields can be important for canes with heights of less than 30 cm. Thus, only bare soils or soils covered by a thin herbaceous layer could be used for estimating soil moisture content.
The study concerns two study sites in Niger where Synthetic Aperture Radar (SAR) images of TerraSAR-X sensor were acquired simultaneously to ground measurements. These results will contribute to the implementation of a soil degradation and biocrust vulnerability monitoring tool. The possibility of retrieving these soil parameters was widely investigated from C-band Synthetic Aperture Radar [
18,
19,
20,
21,
22]. A radar configuration that minimizes the effects of surface roughness is recommended for a better estimate of soil moisture when using only one incidence angle. The optimal radar incidences in C-band for the retrieval of soil moisture are weaker than 35° [
21]. However, the use of only one image is limited only to study areas with homogeneous values of surface roughness. The use of two images acquired at two different incidence angles (low and high) allows the precision on the estimated moisture to be markedly improved because both surface roughness and soil moisture can be estimated [
18,
19,
21]. This configuration is not possible with current SAR sensors. Indeed, the time separating two SAR images acquired at two different incidences is several days, which limits the use of this inversion procedure. Another solution involves the use of two SAR images, one in dry season and one in rainy season. This method is easily applicable in Sahelian region where the soil roughness remains unchanged except for in cultivated areas. Moreover, the soil moisture in dry season could be supposed to be equal to zero [
22]. Many studies showed that, with SAR imagery, it is possible to estimate the soil moisture with an accuracy of 2 to 6% (RMSE) [
19,
21,
22].
The objective of this study is to examine the potential of TerraSAR-X data for retrieving volumetric soil moisture over Sahelian areas. This work evaluates whether the use of two SAR images at X-band (one reference image “dry season” and one image of interest “rainy season”) improves the accuracy of the estimate of surface soil moisture in comparison to only one image (without reference image). In
Section 2, the study sites, the database including satellite images and experimental measurements are described.
Section 3 presents the proposed methodology for the retrieval of soil moisture. Finally, conclusions and perspectives are presented in
Section 4.
2. Study Sites and Database
2.1. Study Sites Description
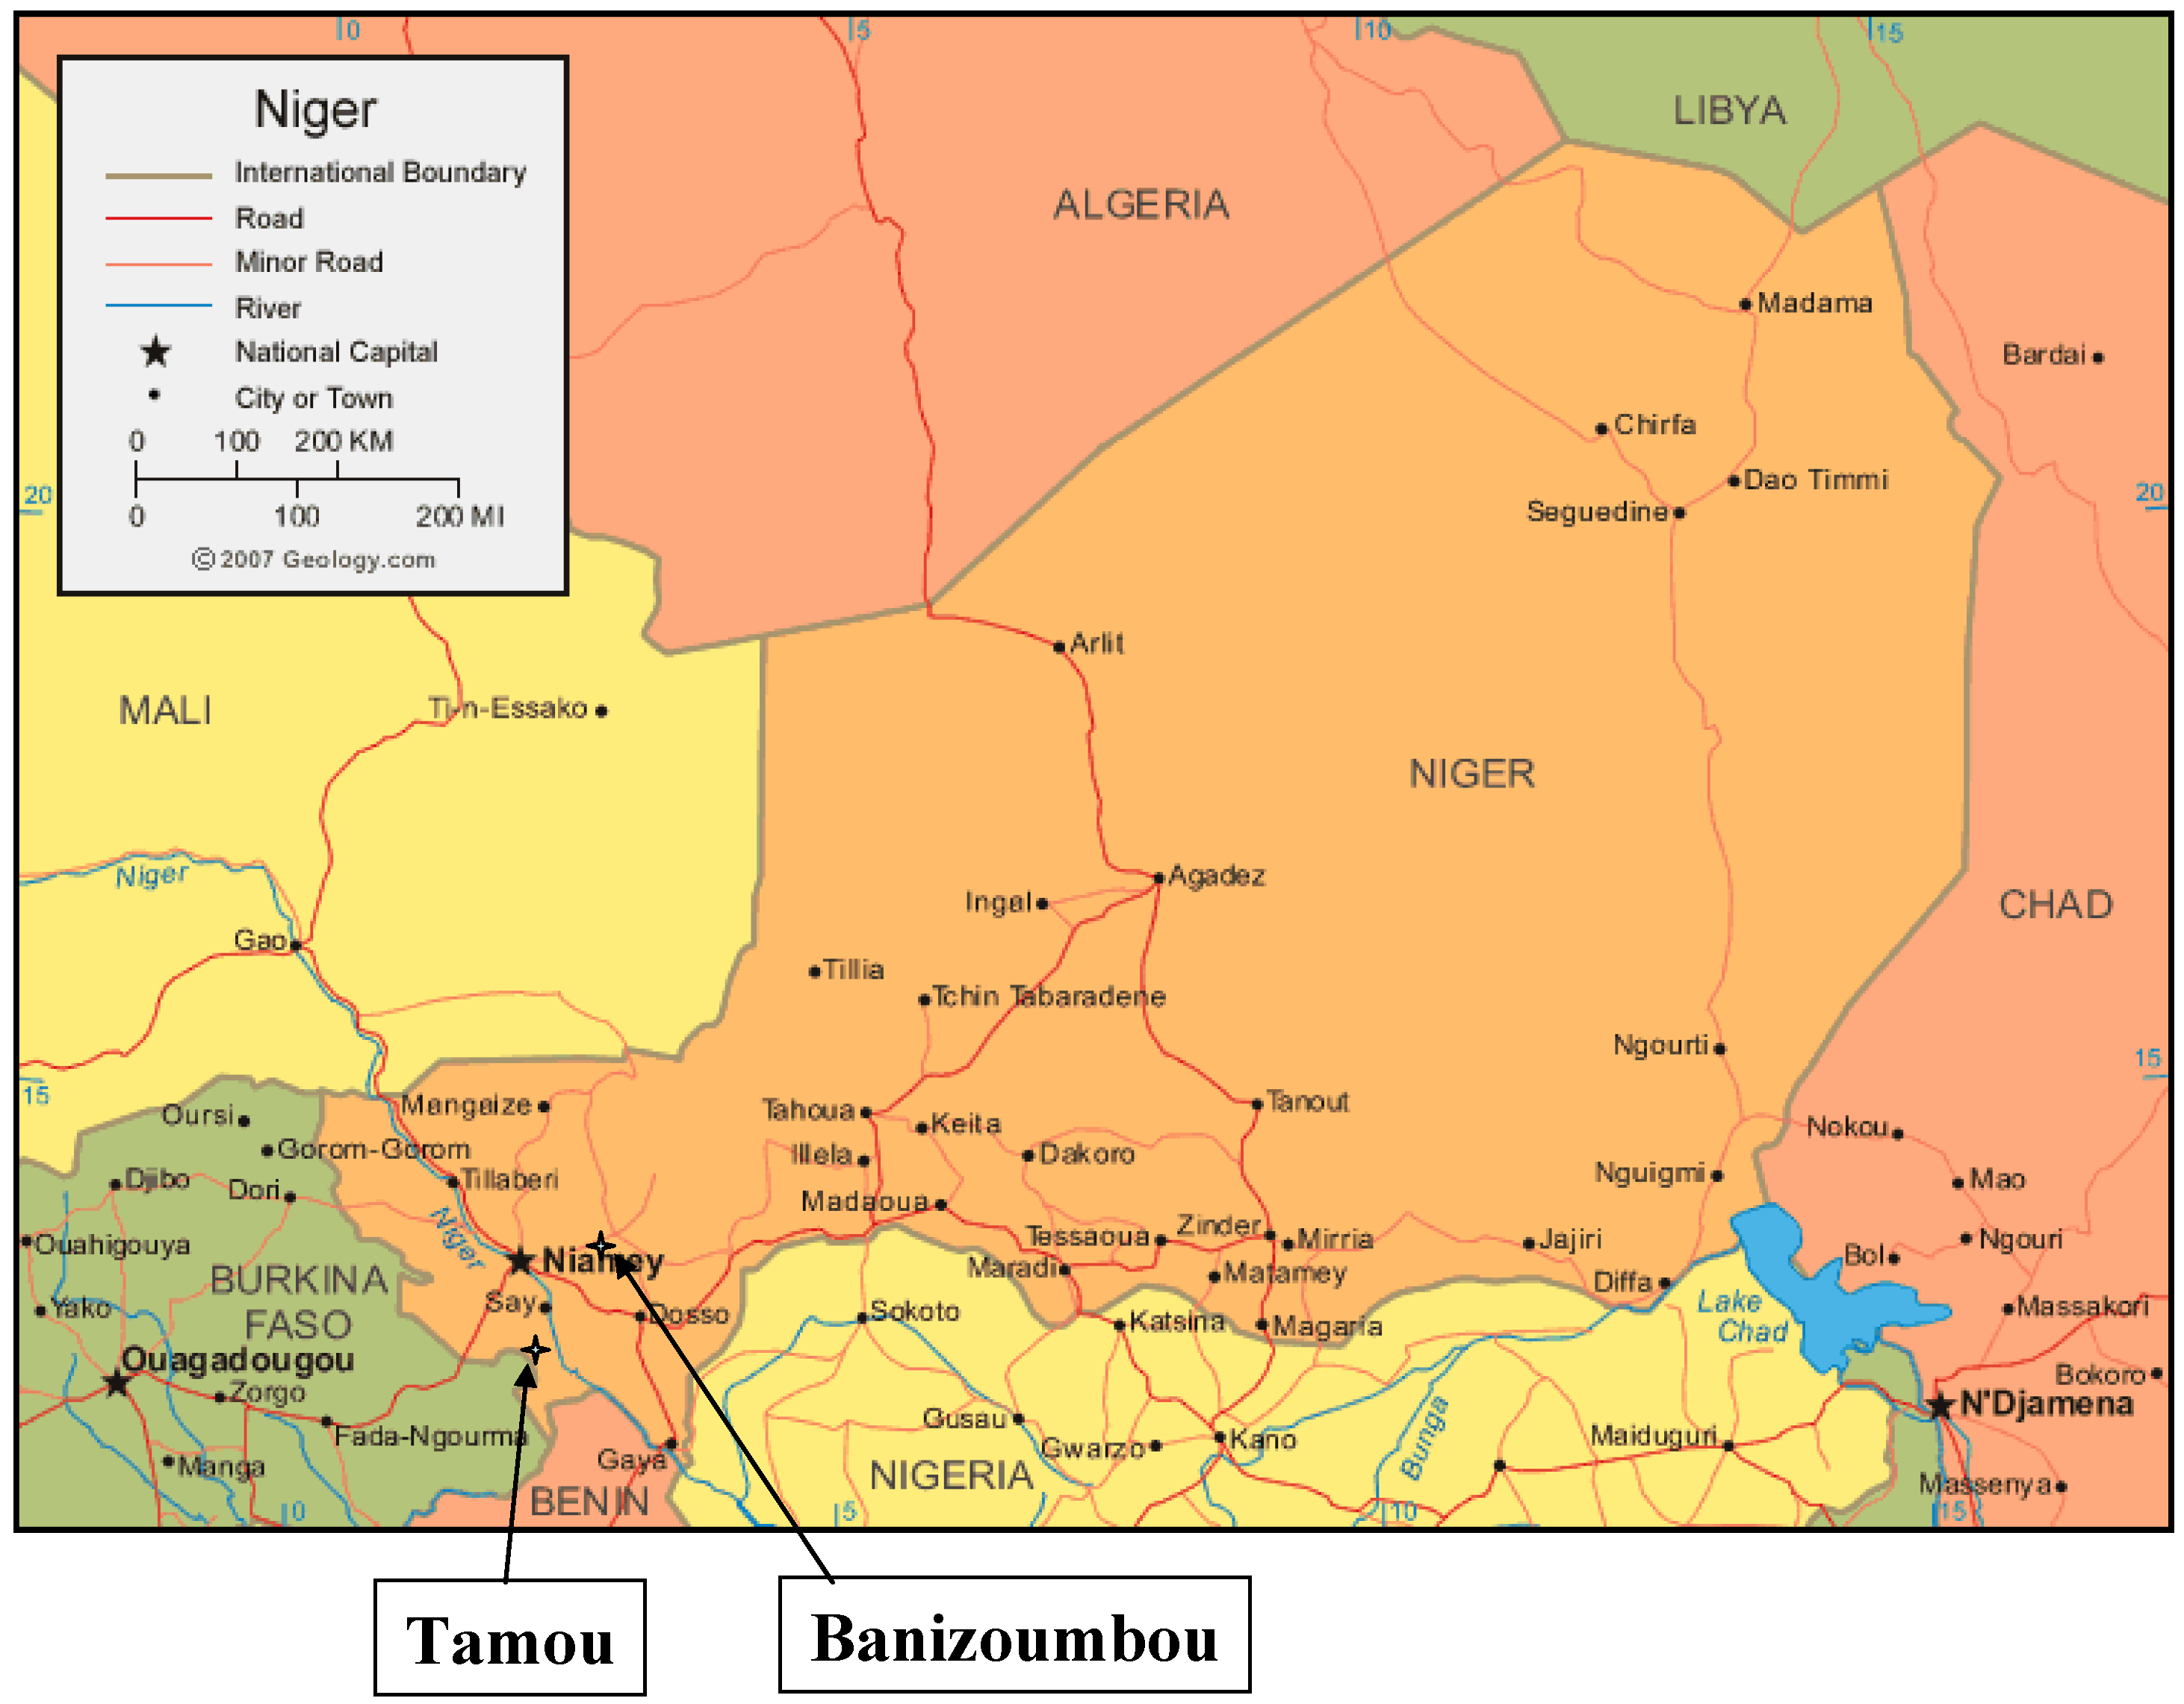
Two study sites were chosen in the south-west part of Niger: Banizoumbou (13,53°N ; 2,67°E) and Tamou (12.80°N; 2.14°E) (
Figure 1). The climate is semi arid with a rainy season between June and October and an annual rainfall ranges from 140 mm in the North to 720 mm in the South with a pluviometric gradient of 1 mm/km for the whole of western Niger. Average rainfalls of 500 mm and 650 mm are observed for Banizoumbou and Tamou, respectively [
23]. The landscape is composed of two major geomorphic units [
24,
25]:
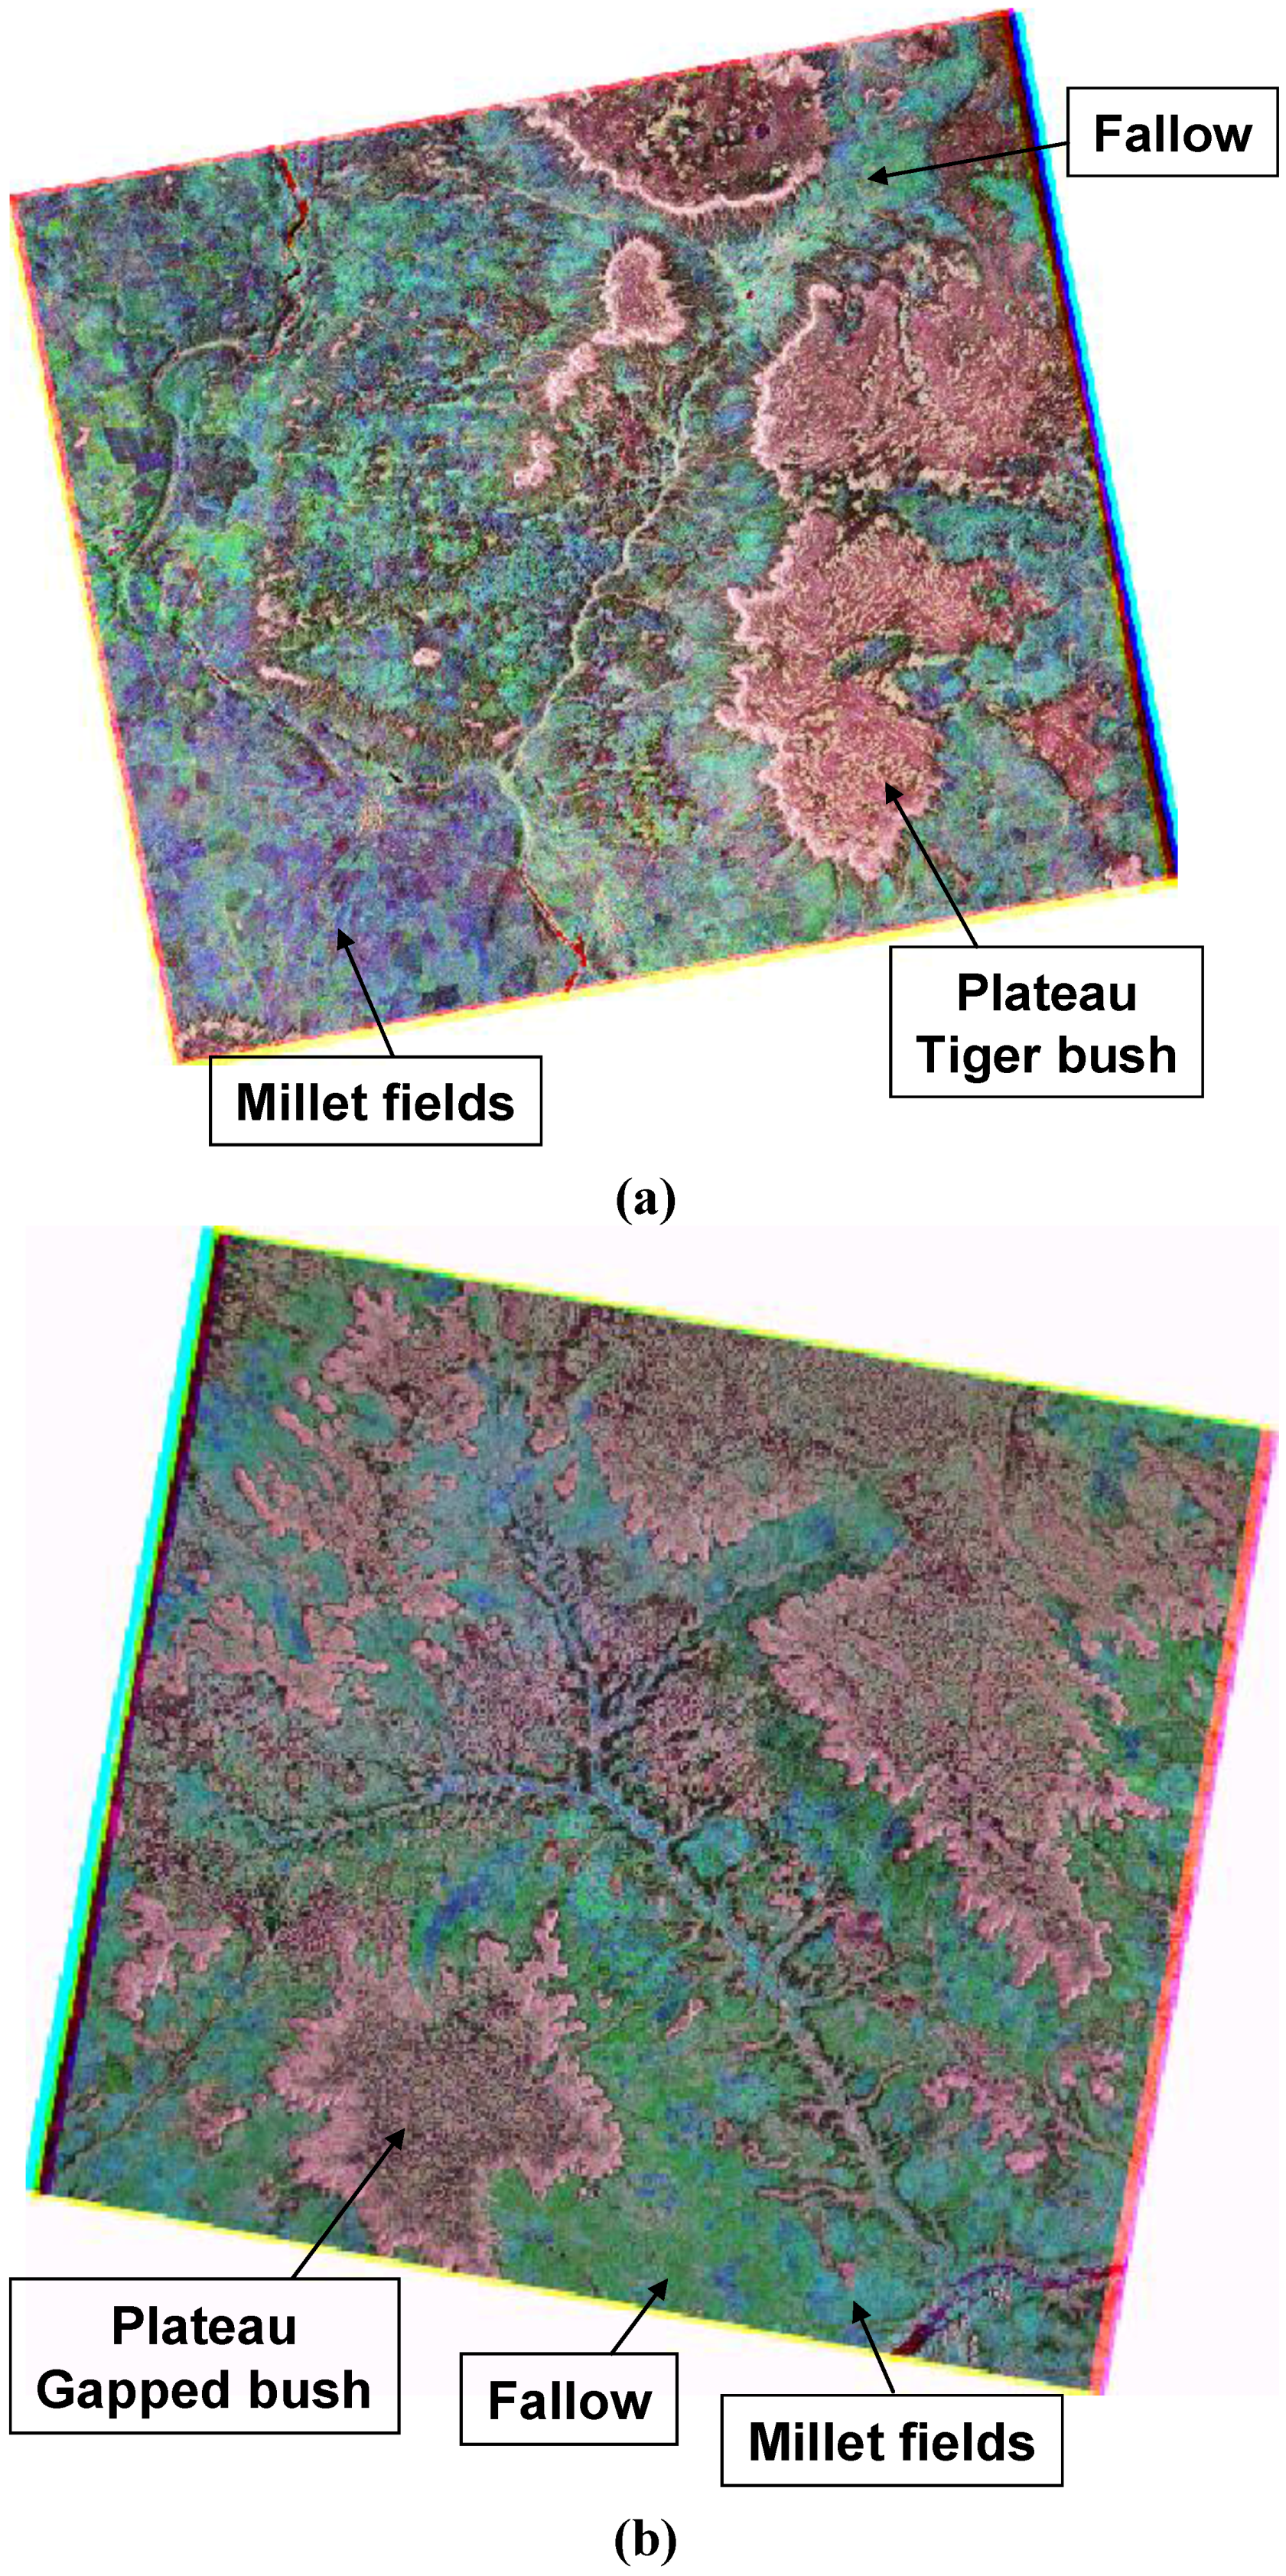
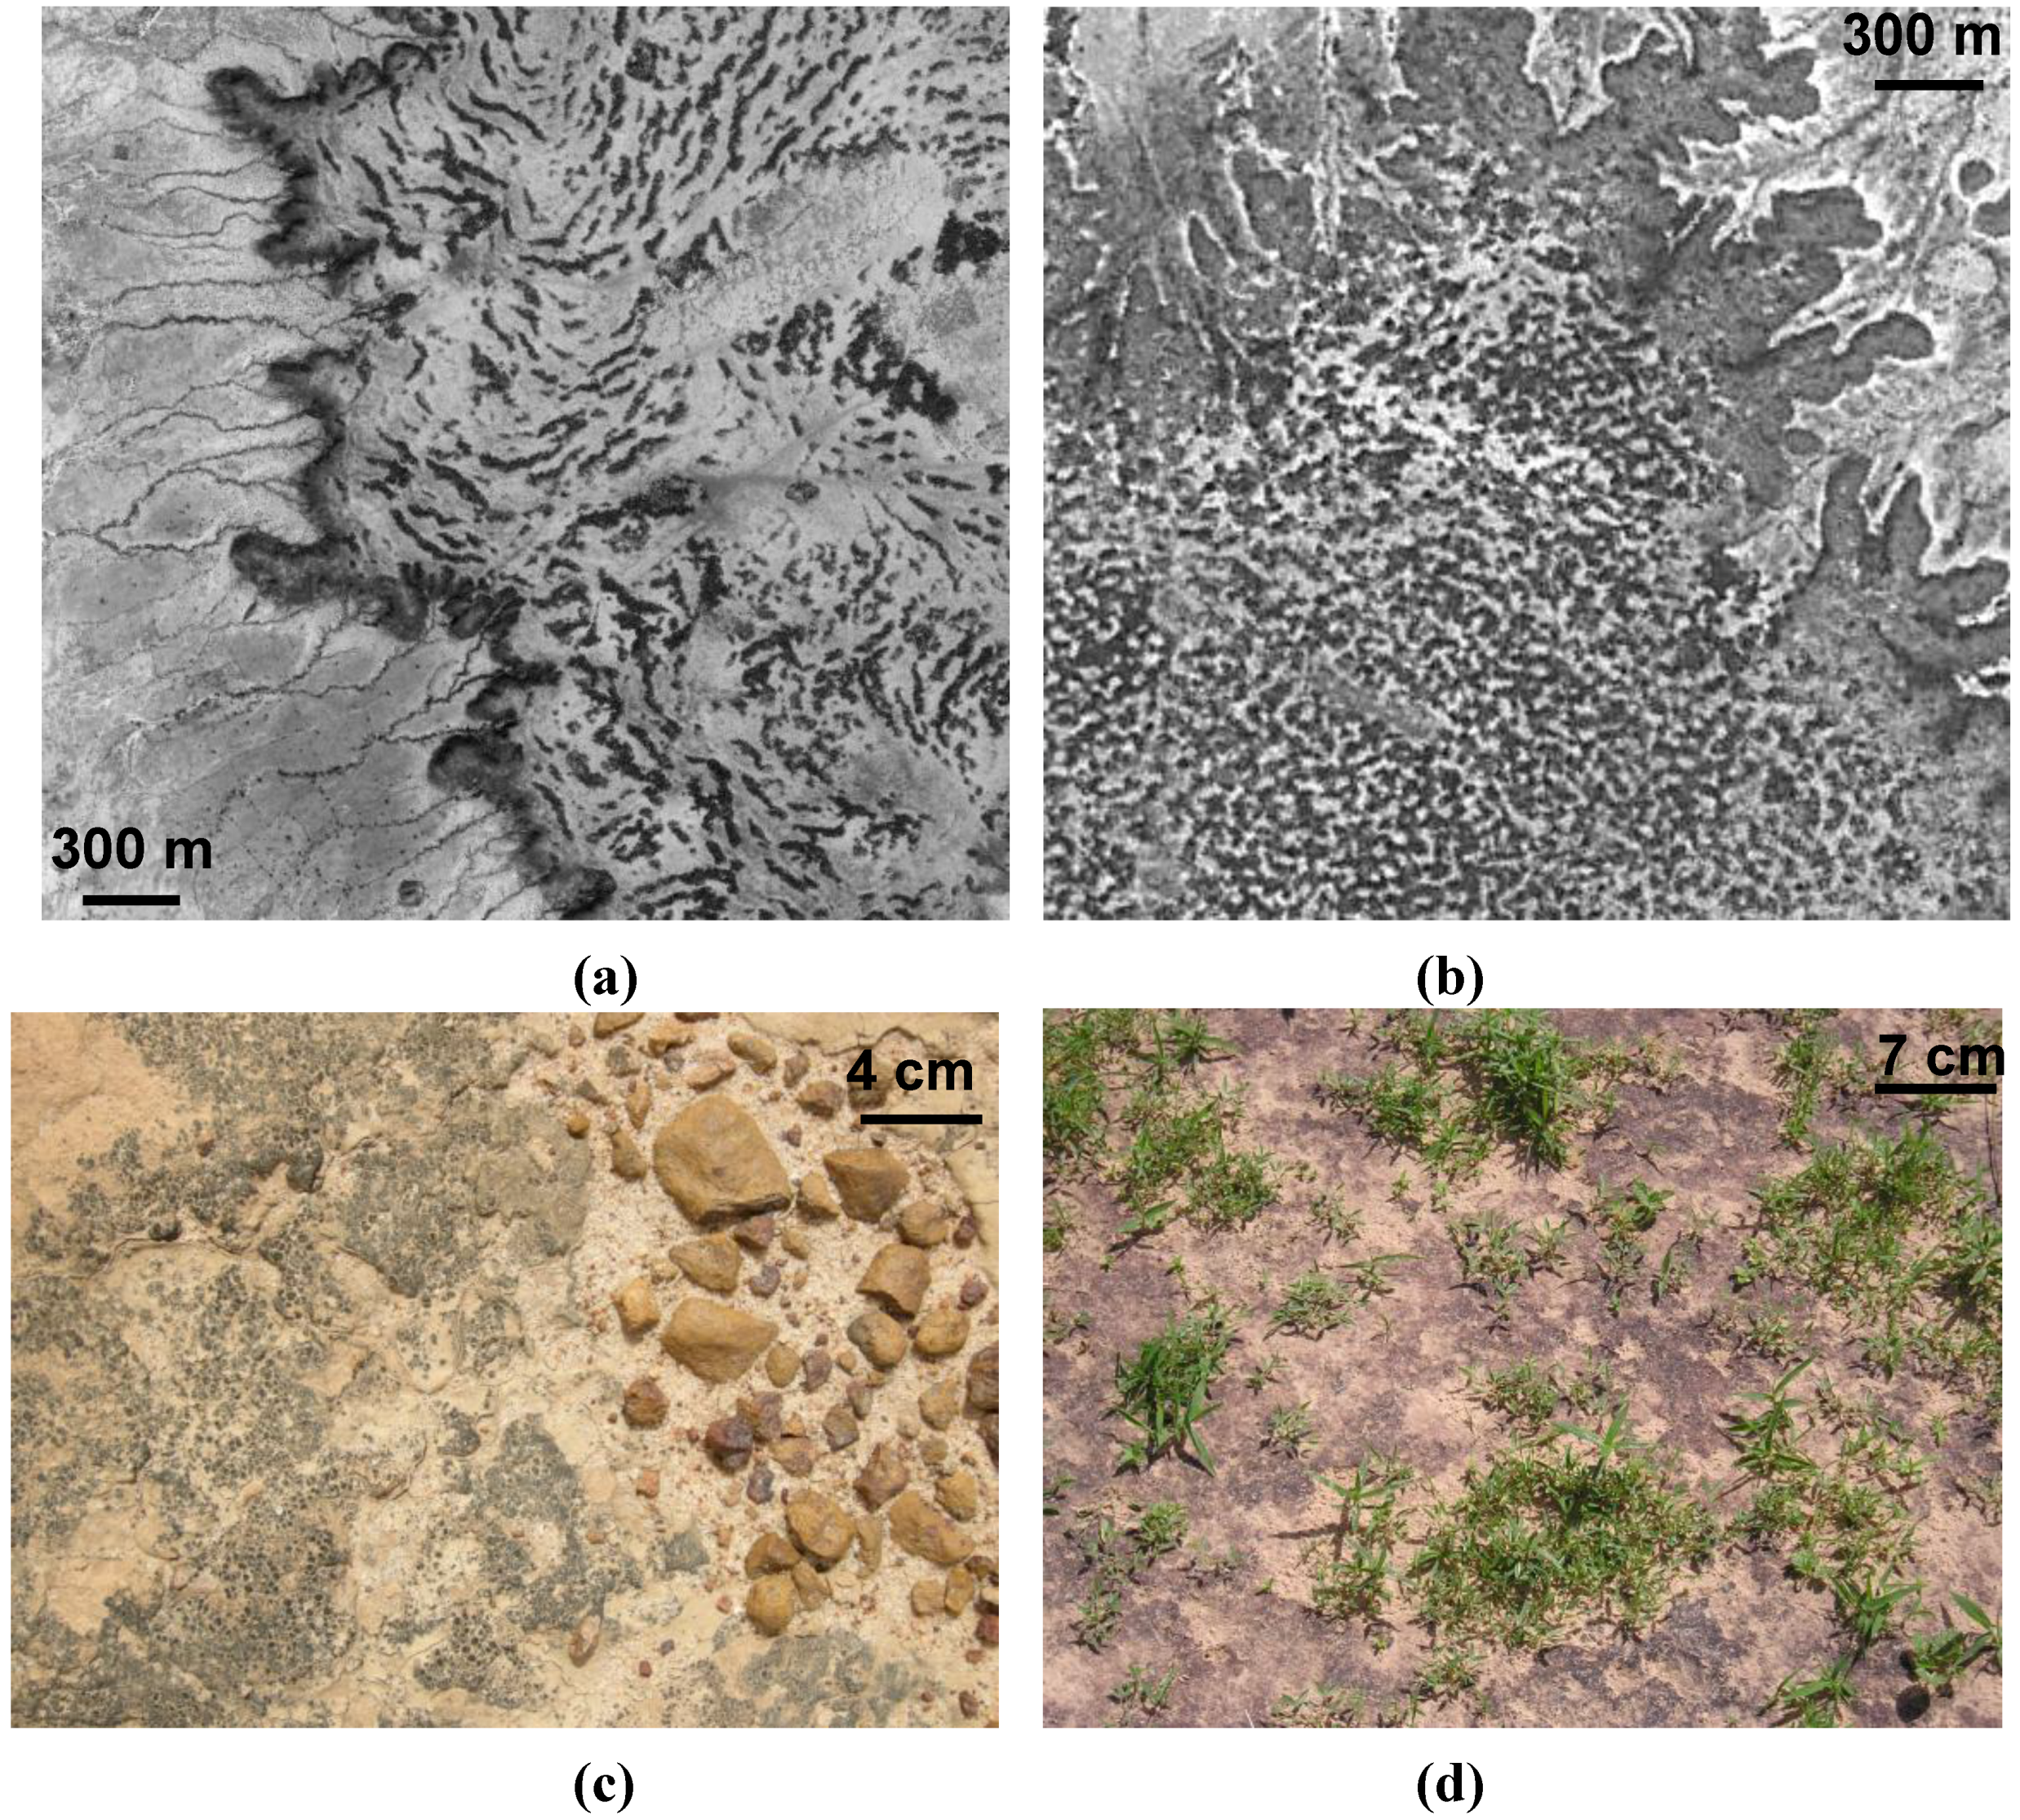
(1) Plateaus formed by Tertiary fluvio-lacustrine deposits, capped by a thick laterite cuirass with slight slopes of a maximum of one percent. They are dissected into several sections by erosion and covered with tiger bush (
brousse tigrée) or gapped bush (
brousse tachetée), depending on the distribution of bare soil and small trees that formed the bush [
26]. The bush corresponds to tiger bush (
Figure 2(a)) when the bare soil and trees form long arcs or bands. The tiger bush pattern consists of alternating lines of small trees about 4 m high and strips of bare or sparsely vegetated ground [
27,
28] (
Figure 2(a)). The distance between successive vegetated bands varies between 60 and 120 m. When the vegetation is not structured in gaps rather than bands, the bush is called gapped (
Figure 2(b)). The mean distance between two consecutive gaps is about 50 m for gapped bush. The bare soil of plateaus is characterized by an important crusting due to strong precipitations in the rainy season which run off the surface. Water infiltrates the vegetated bands and thus plays an important role in the maintenance of these vegetated areas [
29]. Three main classes are identified on plateau: bare soil (with gravel), sparse vegetation, and dense vegetation.
(2) Sand dunes correspond to a transitional geomorphic unit between plateaus and the valley systems. They are formed by Pleistocene stabilised-sand with a mean slope of approximately 2 to 5%. These are used for cropping pearl millet and cowpea, and support vegetation areas used for pasture during fallow periods.
(3) Valley systems, formed by Aeolian and colluvial sands, comprise broad sand plains or sand-filled stream beds with a mean slope of three to five percent. The vegetation in the valleys is dominated by cultivated fields (mainly millet) and fallow land. Fallows are temporarily not cultivated. They contribute to the regeneration of soil. Old fallows contain relatively dense woody coverage while recent fallows are covered by an herbaceous with sparse small trees.
Figure 1.
Location of Banizoumbou and Tamou study sites in Niger.
Figure 1.
Location of Banizoumbou and Tamou study sites in Niger.
The soil moisture measurements described below were performed along a transect from the plateaus to the valley systems. The sites of the measurements were located on fallow lands and bare areas of the plateau where soil surface is characterised by the presence of biological and physical soil crusts. No measurements were performed among the vegetated areas of the plateaus.
Figure 2.
Tiger bush (Brousse tigrée) plateau in Banizoumbou (a), Gapped bush plateau in Tamou (b), view of biological crusts on lateritic soil of plateaux (c), view of biological crusts on sandy soil of valley (d). In (a) and (b), vegetation appears in dark while lighter pixels represent bare soil (optical images).
2.2. TerraSAR Images
Fifteen TerraSAR-X images (X-band ~ 9.65 GHz) were acquired between 29 May and 30 October 2009 with incidence angles of 27° for the Banizoumbou site and 39° for the Tamou site. All images were acquired in HH polarization and in Spotlight imaging mode (pixel spacing of 1 m). Characteristics of TerraSAR images used in this study are summarized in
Table 1. Examples of TerraSAR images are presented in
Figure 3.
Radiometric calibration using MGD (Multi Look Ground Range Detected) TerraSAR images was carried out using the following equation [
30]:
This equation transforms the amplitude of backscattered signal for each pixel (
DNi) into a backscattering coefficient (
) in decibels. The calibration coefficient
Ks (scaling gain value) depends on radar incidence angle (θ
i) and polarization. It is given in the section “calibration” of the TerraSAR data delivery package. NEBN is the Noise Equivalent Beta Naught. It represents the influence of different noise contributions to the SAR signal. The NEBN is described using a polynomial scaled with
Ks. The polynomial coefficients are derived from the TerraSAR product file (section “noise” of SAR data delivery package). The absolute radiometric accuracy of TerraSAR data is better than 0.6 dB [
30]. All TerraSAR images were then georeferenced using GPS points (cubic convolution resampling algorithm). The RMS georeferencing accuracy varies from 1.5 to 1.9 pixels.
Table 1.
List of TerraSAR-X images. Universal time (TU) = Local time − 1 hour.
Table 1.
List of TerraSAR-X images. Universal time (TU) = Local time − 1 hour.
| Study site | Acquisition date | Acquisition hour (TU) | Season |
|---|
| Banizoumbou | 29 May 2009 | 17:51 | Dry |
| 01 July 2009 | |
| 23 July 2009 | Rainy |
| 14 August 2009 |
| 25 August 2009 |
| 16 September 2009 |
| 08 October 2009 |
| 30 October 2009 |
| Tamou | 04 June 2009 | 05:44 | Dry |
| 07 July 2009 | Rainy |
| 29 July 2009 |
| 31 August 2009 |
| 11 September 2009 |
| 22 September 2009 |
| 14 October 2009 |
Speckle noise, due to the coherent interference of waves reflected from many elementary scatterers, is present on SAR images and makes the pixel-by-pixel interpretation of TerraSAR images extremely difficult. This explains why the analysis of radar signals is generally carried out on homogeneous areas with several pixels or at field scale (which helps reduce speckle). In practice, the mean backscattering coefficients are calculated from calibrated TerraSAR images by averaging the linear σ° values of all pixels within reference fields or over cells of N pixels (kernels of N pixels).
Figure 3.
TerraSAR images on Banizoumbou and Tamou. The size of each study site is 10 km × 10 km. (a) Banizoumbou, RGB = 29 May, 14 August and 08 October 2009; (b) Tamou, RGB = 04 June, 29 July and 14 October 2009.
Figure 3.
TerraSAR images on Banizoumbou and Tamou. The size of each study site is 10 km × 10 km. (a) Banizoumbou, RGB = 29 May, 14 August and 08 October 2009; (b) Tamou, RGB = 04 June, 29 July and 14 October 2009.
2.3. Optical Images
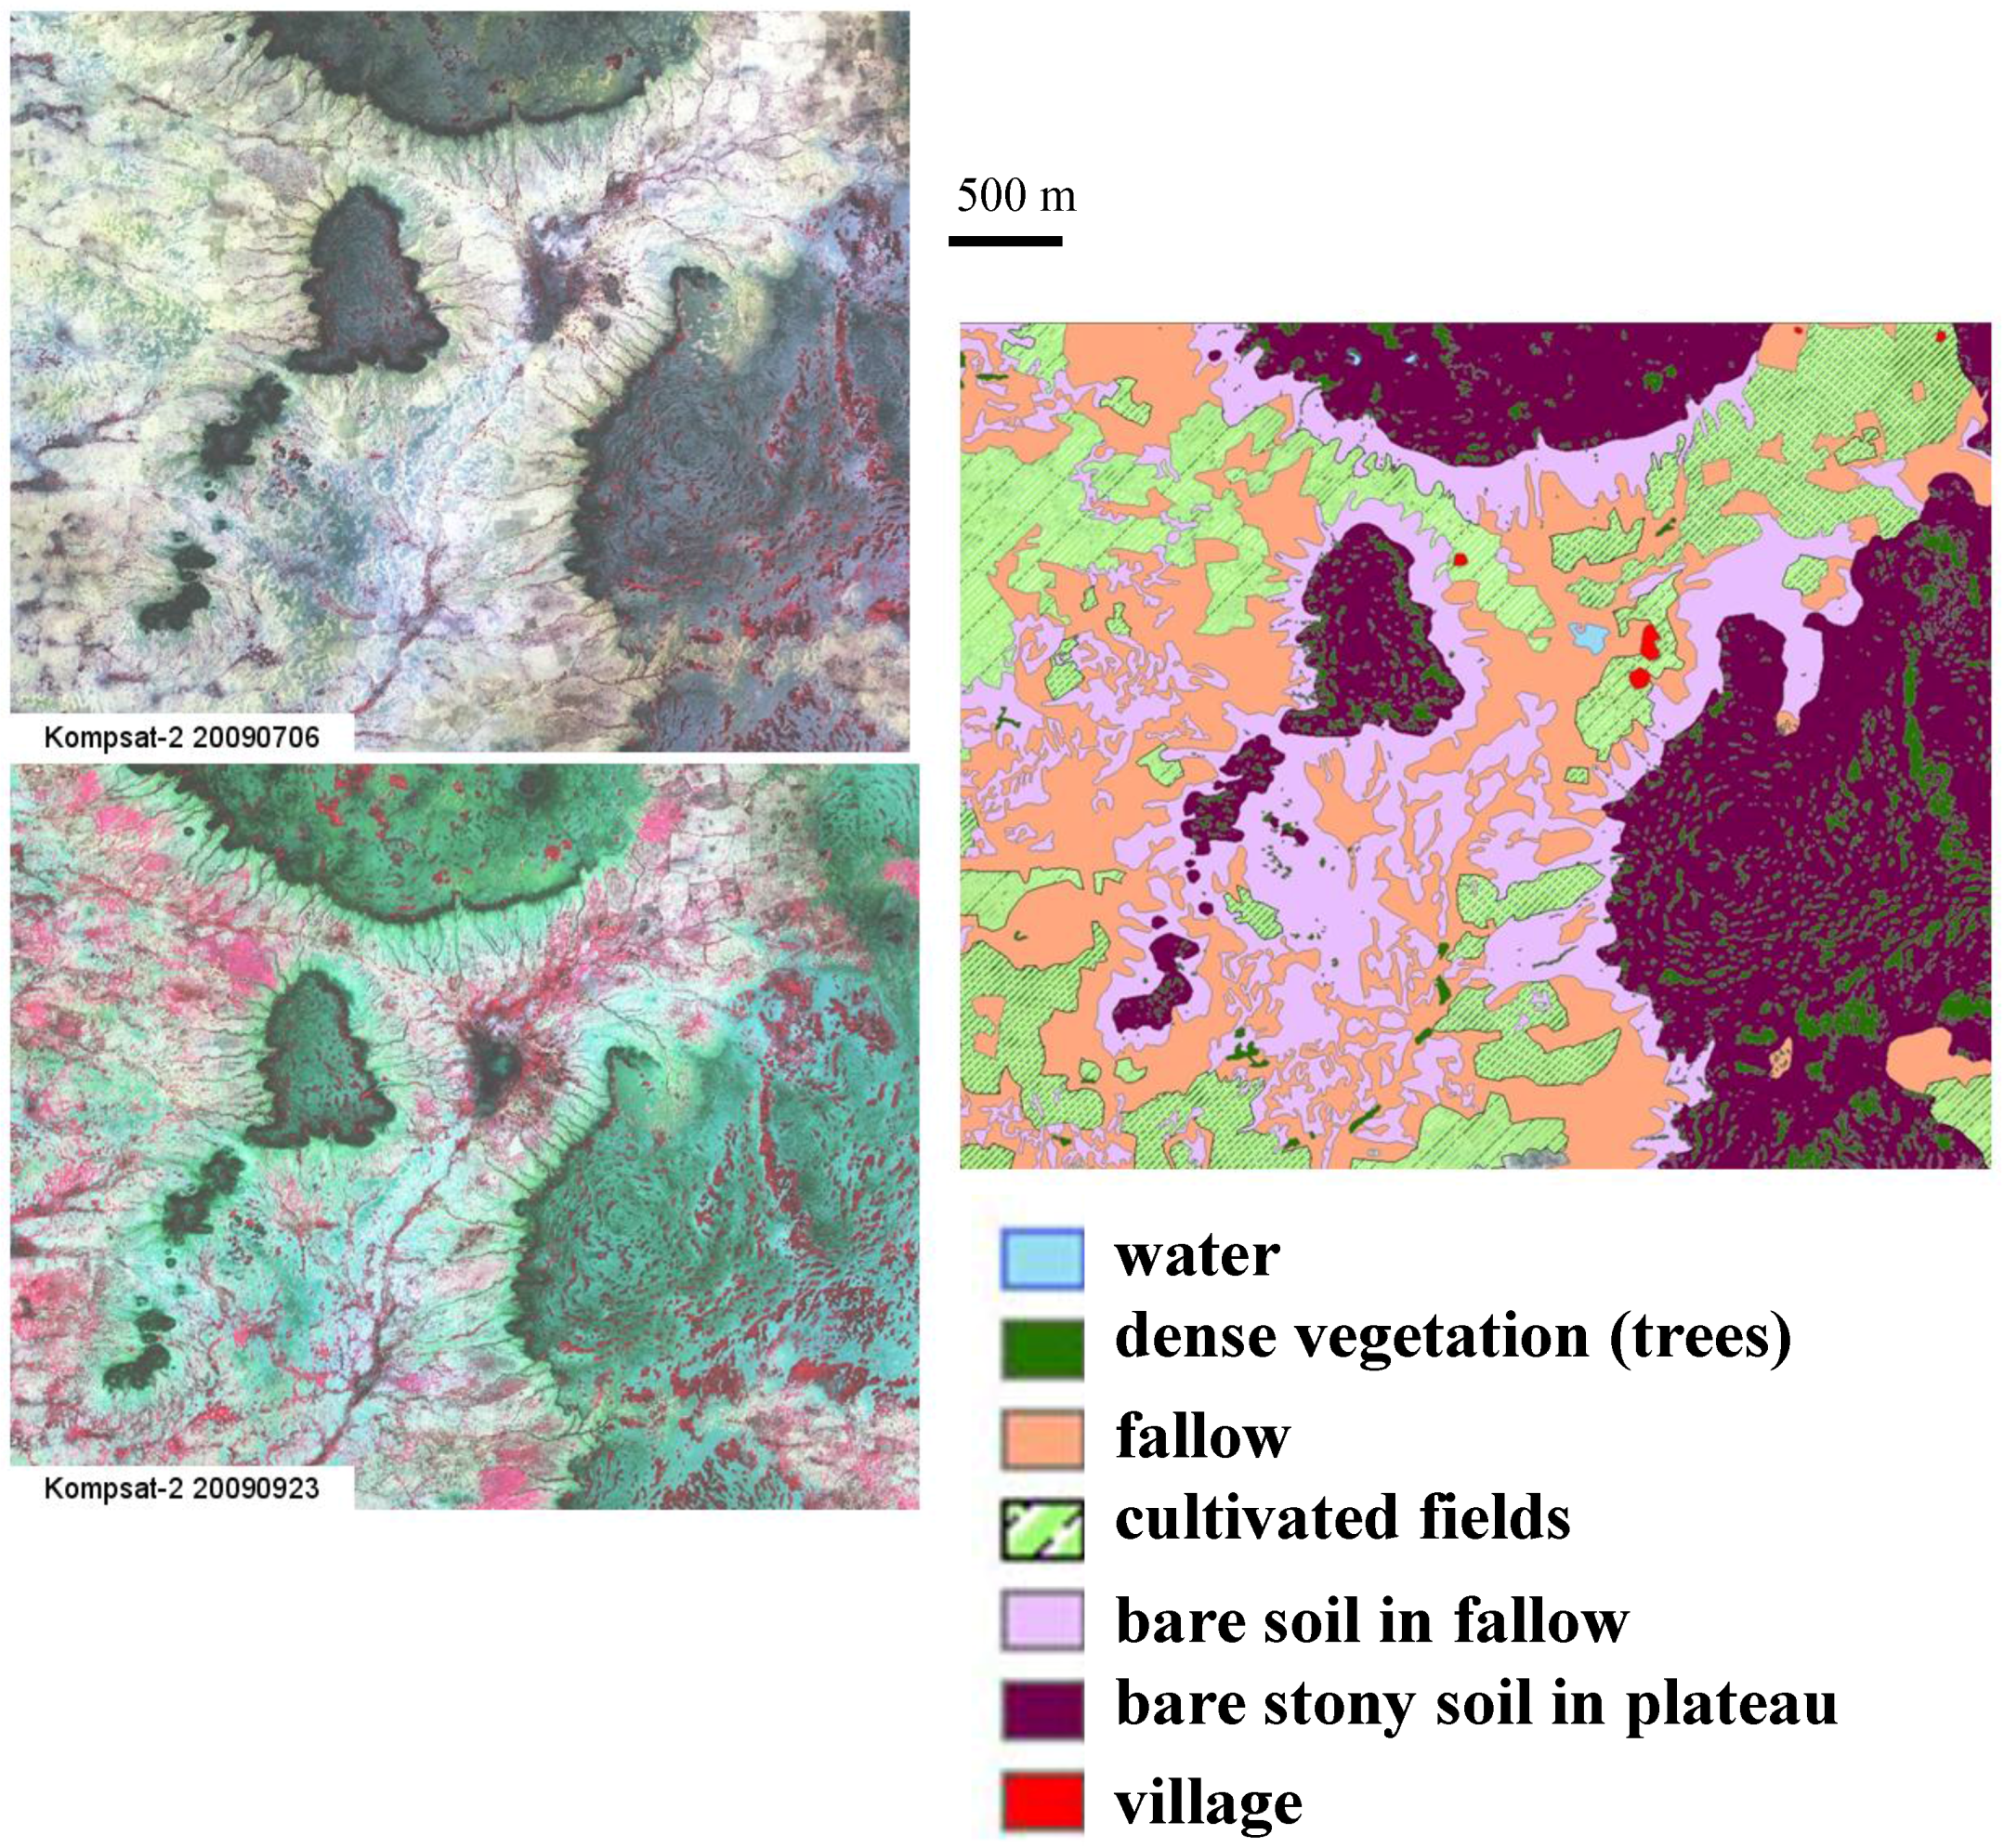
Very high spatial resolution optical images were also collected on Banizoumbou (July and September 2009) and Tamou (June, August, September and November 2009) from Kompsat-2 sensor (
http://www.kari.re.kr/eng/). Images have spatial resolutions of 1 m in panchromatic mode and 4 m in multispectral mode (blue, green, red, infrared). These images were used to allow a reliable mapping of land surface types: water, forest thickets (
fourré), fallow, cultivated fields, bare soil mainly in fallow, bare stony soil mainly on plateau, and village (
Figure 4). The class “forest thicket” mainly represents the vegetation situated on plateaus. The detailed land use maps were produced by Computer Assisted Photo-Interpretation (CAPI). The analysis of diachronic images between dry and rainy seasons was particularly useful for differentiating land use, especially bare soil and cultivated areas. CAPI was preferred to other classification techniques because the information contained in the Kompsat imagery was used to its maximum.
The estimation of soil moisture will be realized only on bare soils or soil with thin herbaceous layer. The Normalized Difference Vegetation Index (NDVI) was computed from the optical image in the red and infrared bands (NIR-Red/NIR+Red), and NDVI values under an empirical threshold of 0.25 were found using photo interpretation for mapping bare soils and thin herbaceous areas. The bare soil (herbaceous areas of fallows and laterite cuirass soils without vegetation of plateaus) represents approximately 36% of the Banizoumbou study site and 41% of the Tamou site. As the development of BSCs requires the absence of tillage and trampling, the cultivated areas were excluded of the soil moisture mapping.
Figure 4.
Illustration of landuse/landcover conditions in 2009 on Banizoumbou (on a segment of Kompsat image).
Figure 4.
Illustration of landuse/landcover conditions in 2009 on Banizoumbou (on a segment of Kompsat image).
2.4. Soil Moisture Measurements
Simultaneously to TerraSAR acquisitions,
in situ measurements of volumetric soil moisture have been carried out on the first top 5 cm using a 5-cm-long vertically installed TDR probe (Time Domain Reflectometry). The radar signal penetration depth is only a few centimetres at X-band [
16]. The soil moisture content ranges from 0% to 21.5% (
Table 2), with single-field standard deviation between 0.5% and 2%. Due to high evaporation rates, only
in situ measurements collected within a time window of 2 hours were used. However, the logistic difficulties, in particular ease of access to study site and the absence of support facilities, did not allow for the collection of
in situ soil moisture measurements simultaneously to each radar acquisition.
Six to twenty one training areas were chosen for each ground campaign. The volumetric water content on a training area scale is assumed to be equal to the mean value of five to eight soil moisture measurements collected on the training area. The surface of our training areas is variable but the minimal size is of approximately 100 m2. In situ observations show that the laterite soils of plateaus, covered with erosion crusts, have soil moistures nulls.
Table 2.
Characteristics of in situ measurements mainly on fallows. The soil moisture content on plateaus is null.
Table 2.
Characteristics of in situ measurements mainly on fallows. The soil moisture content on plateaus is null.
| | TerraSAR images (2009) | Ground measurements (2009) | |
| Site | Date | Acquisition Time (TU) | Date | Time (TU) | Training areas | Soil moisture content (%) | Comment |
| Banizoumbou | 29 May | 17:51 | - | - | - | <1 | - |
| 01 July | 17:51 | - | - | 7 | <1 | Rainfall rate = 7 mm from 02:20 to 05:50 |
| 23 July | 17:51 | 23 July | 10:30–11:30 | 21 | 0–5.3 | In situ measurements seven hours before SAR acquisition |
| 14 August | 17:51 | 14 August | 17:15–18:30 | 9 | 7.4–10.7 | - |
| 25 August | 17:51 | 25 August | 17:30–19:00 | 11 | 4.1–9.6 | - |
| 16 September | 17:51 | 16 September | 17:40–18:40 | 9 | 2.7–5.4 | - |
| 08 October | 17:51 | 08 October | 17:35–18:35 | 10 | 0–3.8 | - |
| 30 October | 17:51 | 30 October | 17:35–18:35 | 11 | 1.7–3.7% | - |
| Tamou | 04 June | 05:44 | - | - | - | <1 | - |
| 07 July | 05:44 | 07 July | 04:30–05:45 | 6 | 3–3.1 | Rainfall rate = 18mm from 23:25 to 23:59 |
| 29 July | 05:44 | 30 July | 05:10–06:35 | 14 | 9.4–12.6 | - |
| 31 August | 05:44 | 01 September | 05:25–06:45 | 13 | 16.9–21.5 | Rainfall rate = 49 mm from 09:13 on 31 August to 02:35 on 1 September
Data not exploitable |
| 11 September | 05:44 | - | - | - | - | Rainfall rate = 1 mm from 01:51 to 02:36 |
| 22 September | 05:44 | 23 September | 05:20–06:30 | 9 | 5.2–9.8 | - |
| 14 October | 05:44 | 14 October | 05:30–06:40 | 7 | 0–3.2 | - |
The soil moisture content measurements on Banizoumbou were carried out within less than one hour of TerraSAR acquisitions, except for the image acquired on 23 July where seven hours separate
in situ measurements from SAR acquisition (
Table 2) (measurements not used). On the Tamou site, some ground campaigns were carried out after one day of TerraSAR acquisitions. Thus, only data acquired simultaneously to SAR acquisitions (±2 hours) would be used in the definition of a relationship between the backscattering coefficient and soil moisture.
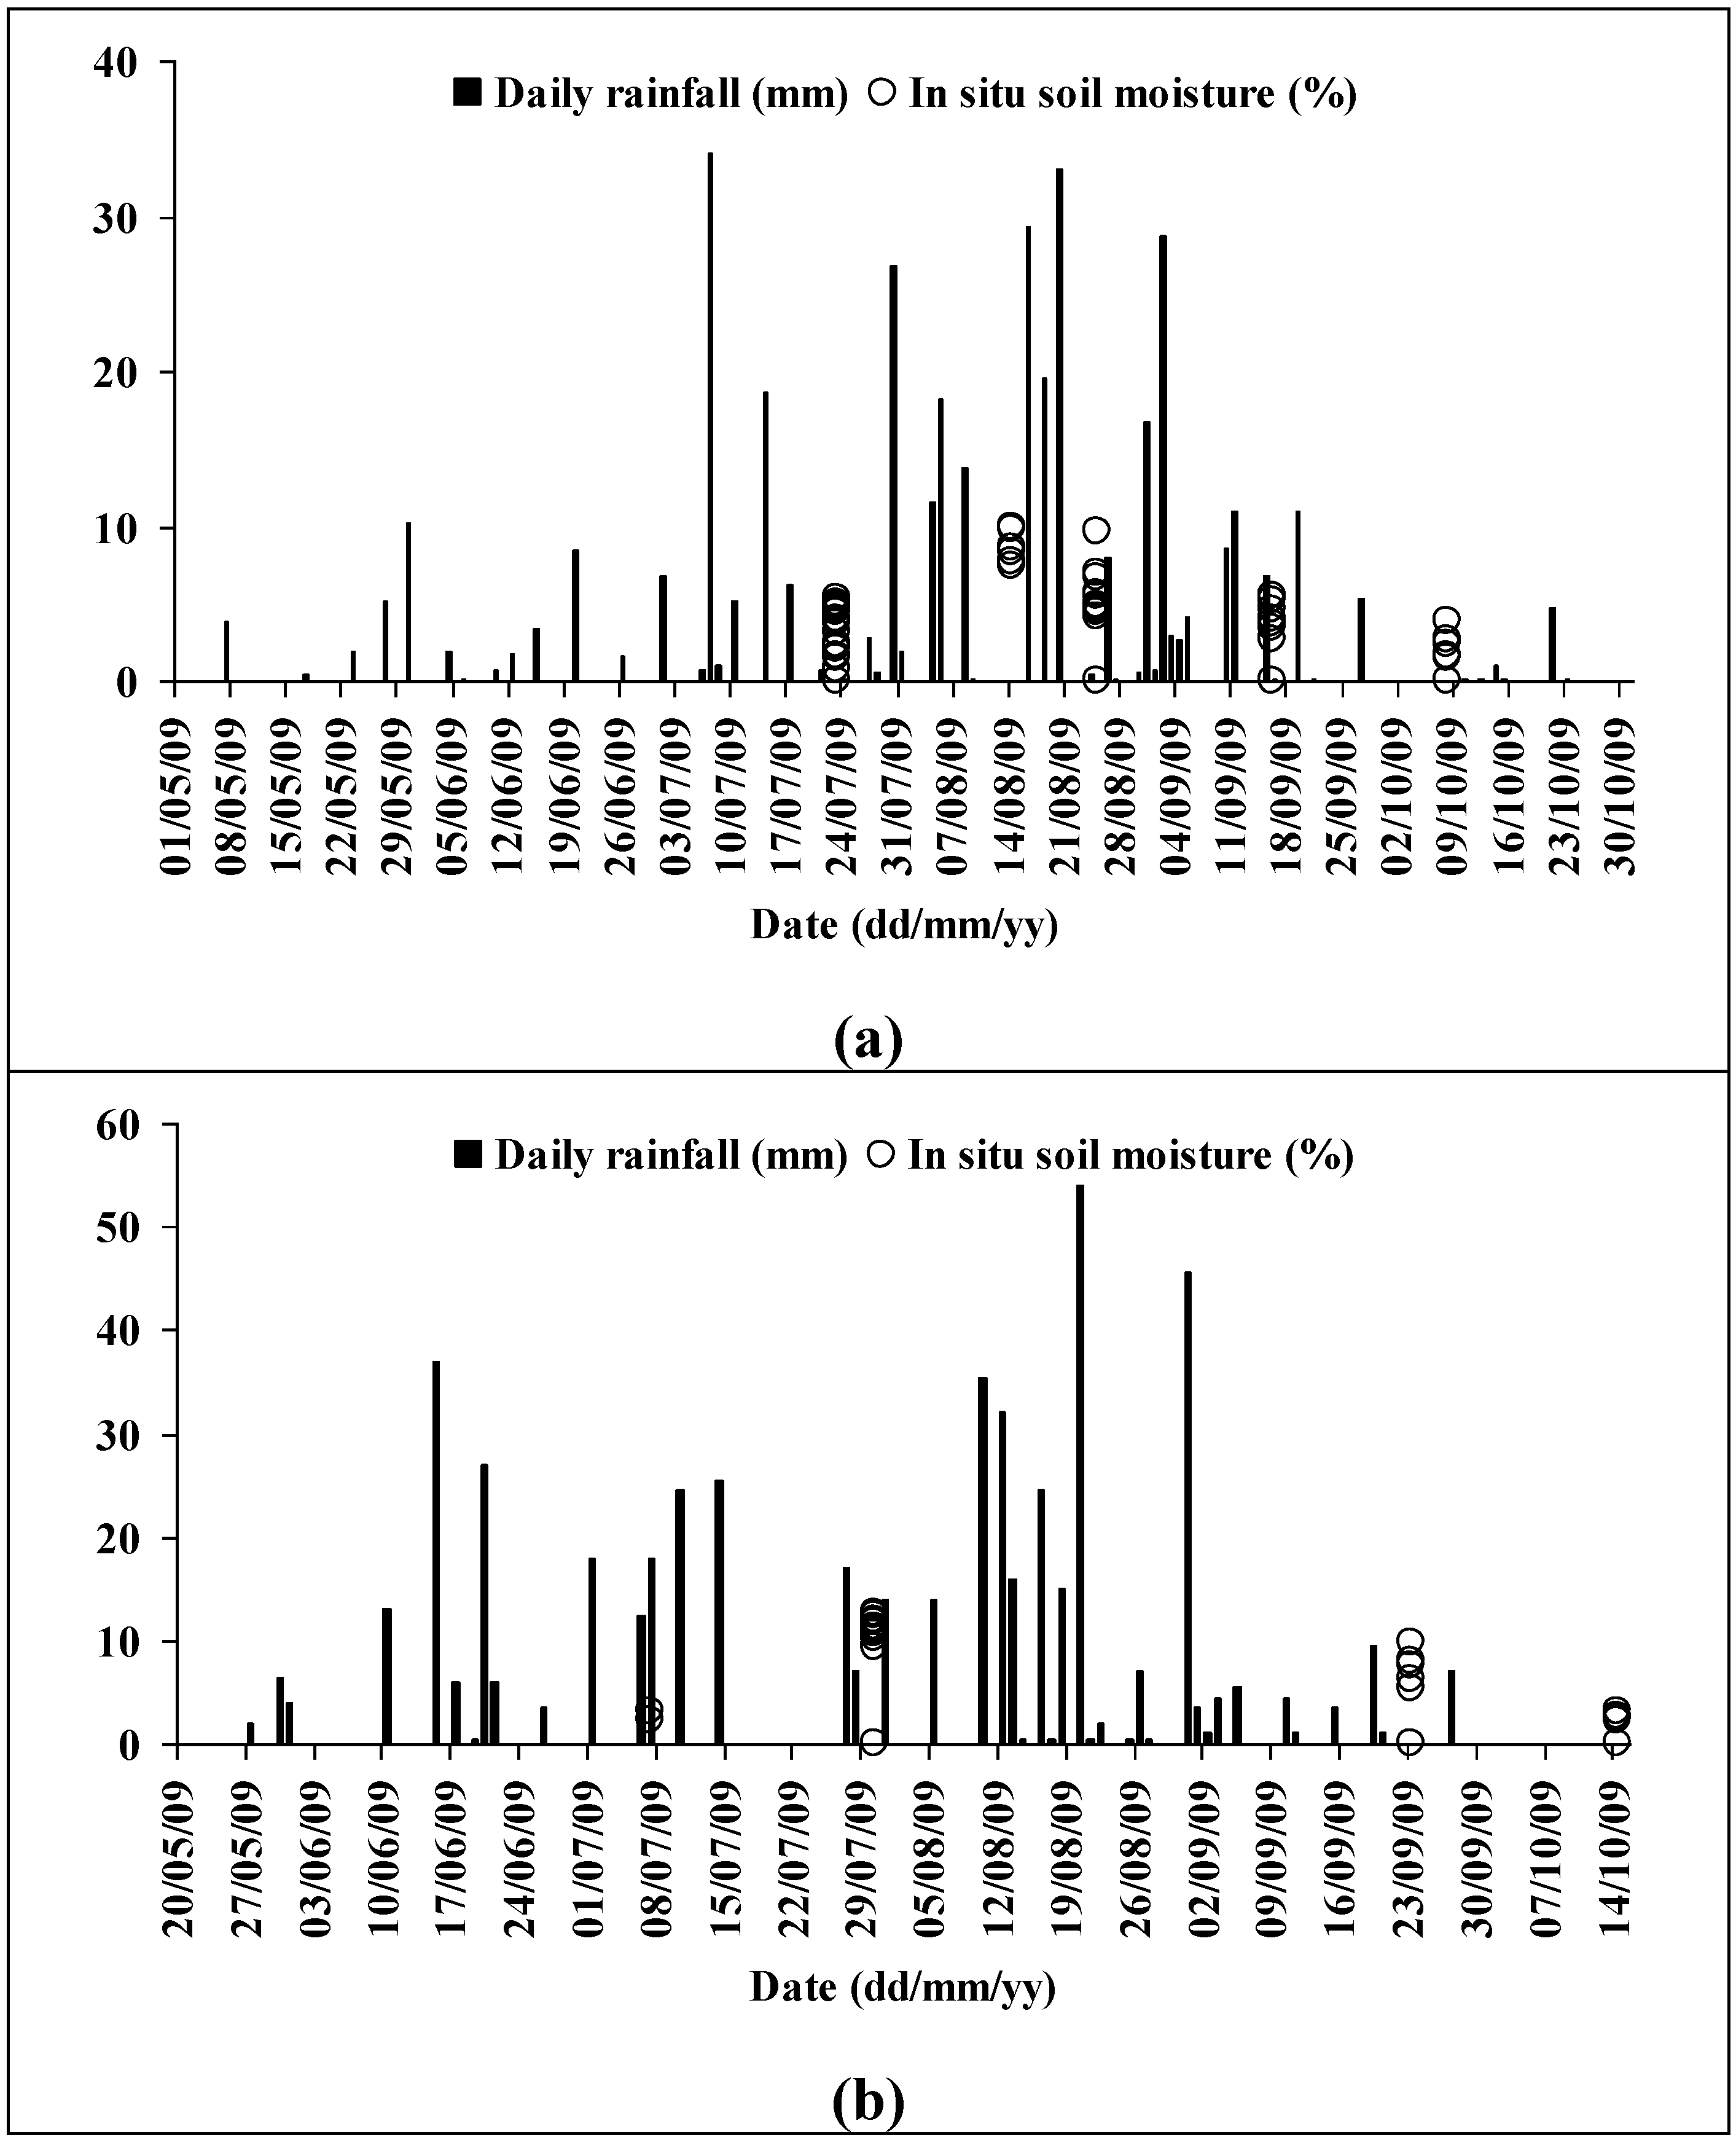
Climatological data were available from the nearest meteorological station including daily mean temperature for the Banizoumbou site and rainfall rates for both the Banizoumbou and Tamou sites. The meteorological station used for Banizoumbou is located in the square of TerraSAR image whereas that for Tamou is located 20 km northeast of Tamou (at Dyabou) (
Figure 5).
Figure 5.
Meteorological data recorded close to the study site and in situ soil moisture content for our training areas: Banizoumbou (a) and Tamou (b).
Figure 5.
Meteorological data recorded close to the study site and in situ soil moisture content for our training areas: Banizoumbou (a) and Tamou (b).
3. Soil Moisture Mapping
3.1. Relationship between Radar Signal and Soil Moisture
For bare soils, the radar backscattering coefficient in decibels can be written as the sum of two functions, a linear function to describe the dependence of radar signal on volumetric surface soil moisture (for values between 5% and 35%), and an exponential function to illustrate the dependence of σ° on surface roughness [
16,
18,
21,
31]:
where
k is the wave number (≈2 cm
−1 for X-band), and
rms is the root mean square surface height (surface roughness). For a given radar wavelength, the coefficients
a,
b, and
c are observed to be dependent on both radar incidence angle and polarization [
19,
21,
31]. To retrieve soil moisture (
mv) from a single radar configuration, it is necessary to establish a relationship between the radar backscattering coefficient (
σ°) and
mv alone, without having any knowledge of the
rms surface height. As a first approximation, the radar backscattering coefficient (in dB) may be expressed as follows [
16,
21]:
This simplified relationship ignores the surface roughness. The coefficient a is dependent on both incidence angle and polarization. The coefficient d is primarily controlled by incidence angle, polarization and surface roughness (for a given radar wavelength).
To eliminate the soil roughness effects, a reference image acquired in dry season could be used. The difference between one image acquired during the rainy season (soil moisture =
mv) and the reference image (Δσ°) can be expressed as [
22]:
This approach assumes that the soil roughness is unchanged between the two SAR acquisition dates. This condition is valuable for bare soils, except for cultivated fields. Moreover, the assumption that the soil moisture in dry season is null is verified by ground measurements.
The development of biological crusts requires wet soil and little anthropic disturbance. Moreover, their presence is limited mainly to fallows and plateaus. Thus, the approaches for mapping soil moisture as defined in Equations (3) and (4) will be applied using TerraSAR imagery to bare soils and areas with a short herbaceous layer. Firstly, the relationship defined in Equation (3) between the radar backscattering coefficient and the in situ soil moisture content was established for one part of the database (25% of 91 points σ° and mv). A mean backscattering coefficient was calculated for each soil moisture measurement using pixels around the location of moisture content measurements (on homogeneous areas around GPS location).
However, TerraSAR images acquired on 29 July, 31 August and 22 September had not been used in the calibration phase of relationships between σ° and
mv (Equations (3) and (4)) because the associated ground measurements of moisture content were carried out one day after acquisitions (
Table 2). Moreover, strong rains were recorded on the night of 31 August, making it impossible to use the data from 31 August and 1 September. Finally, the SAR image on 11 September cannot be exploited for lack of ground measurements.
The coefficients
a and
d of Equation (3) were then calculated as a function of incidence angle, regardless of soil roughness.
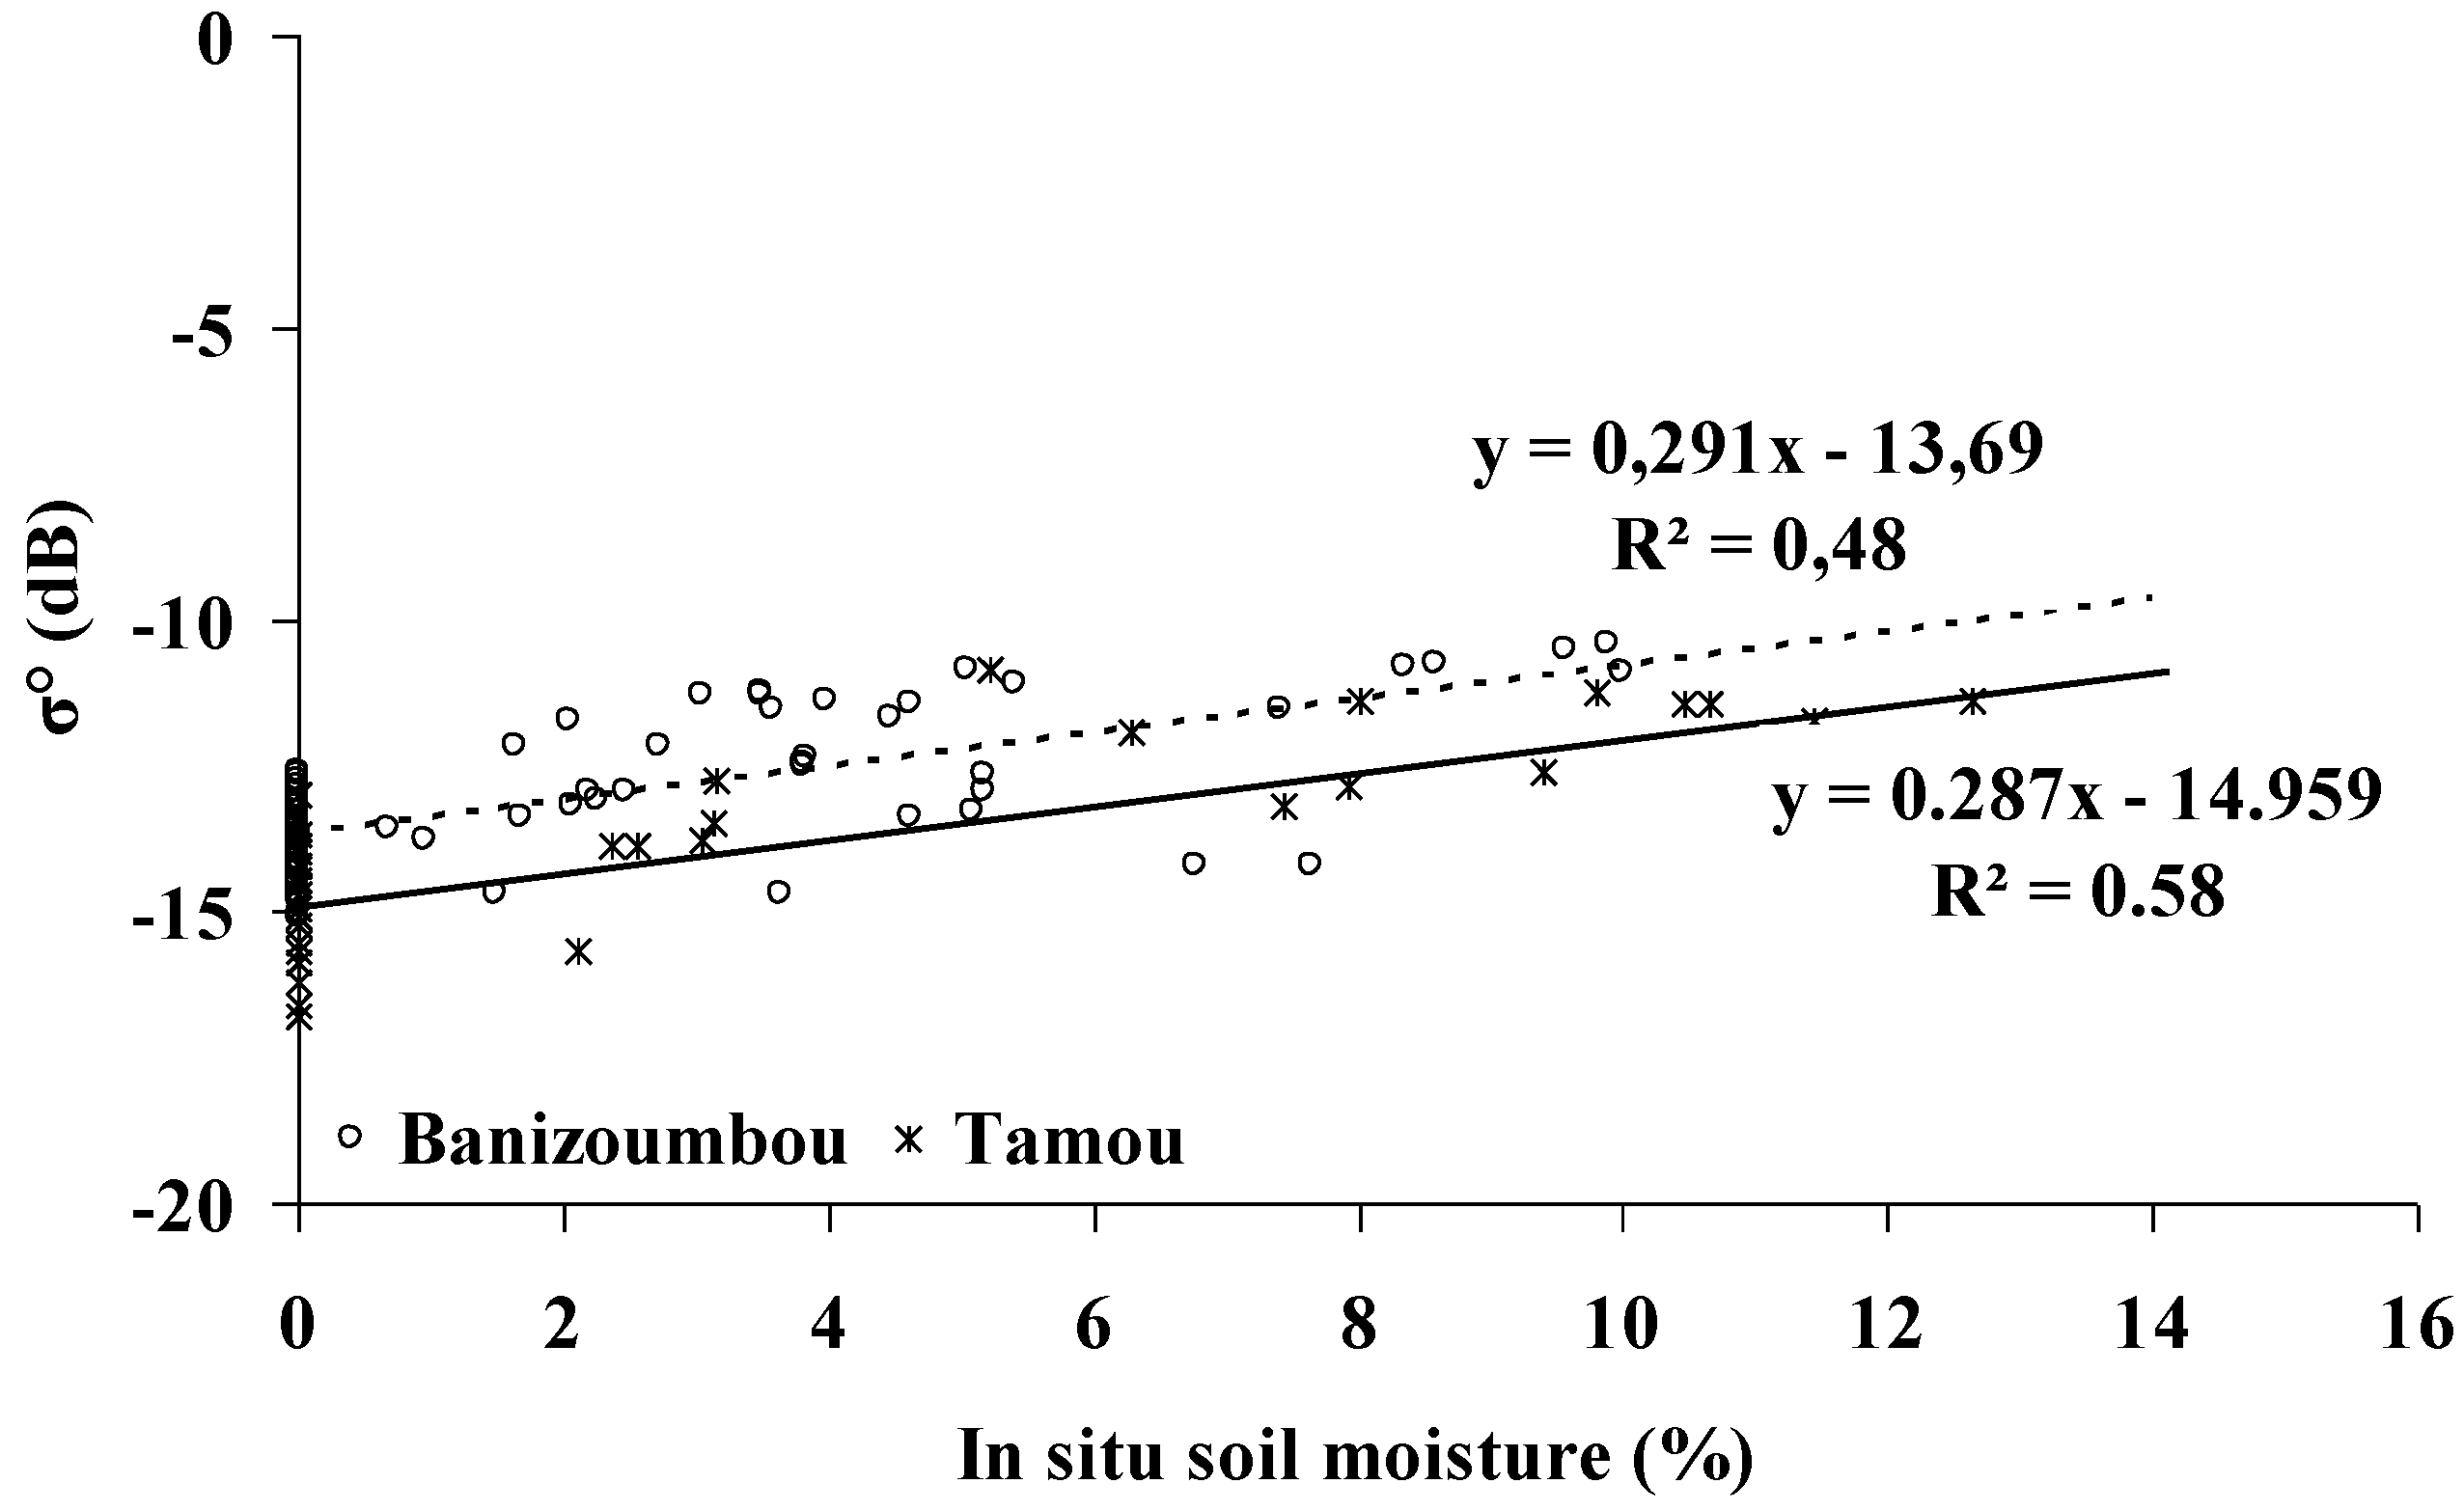
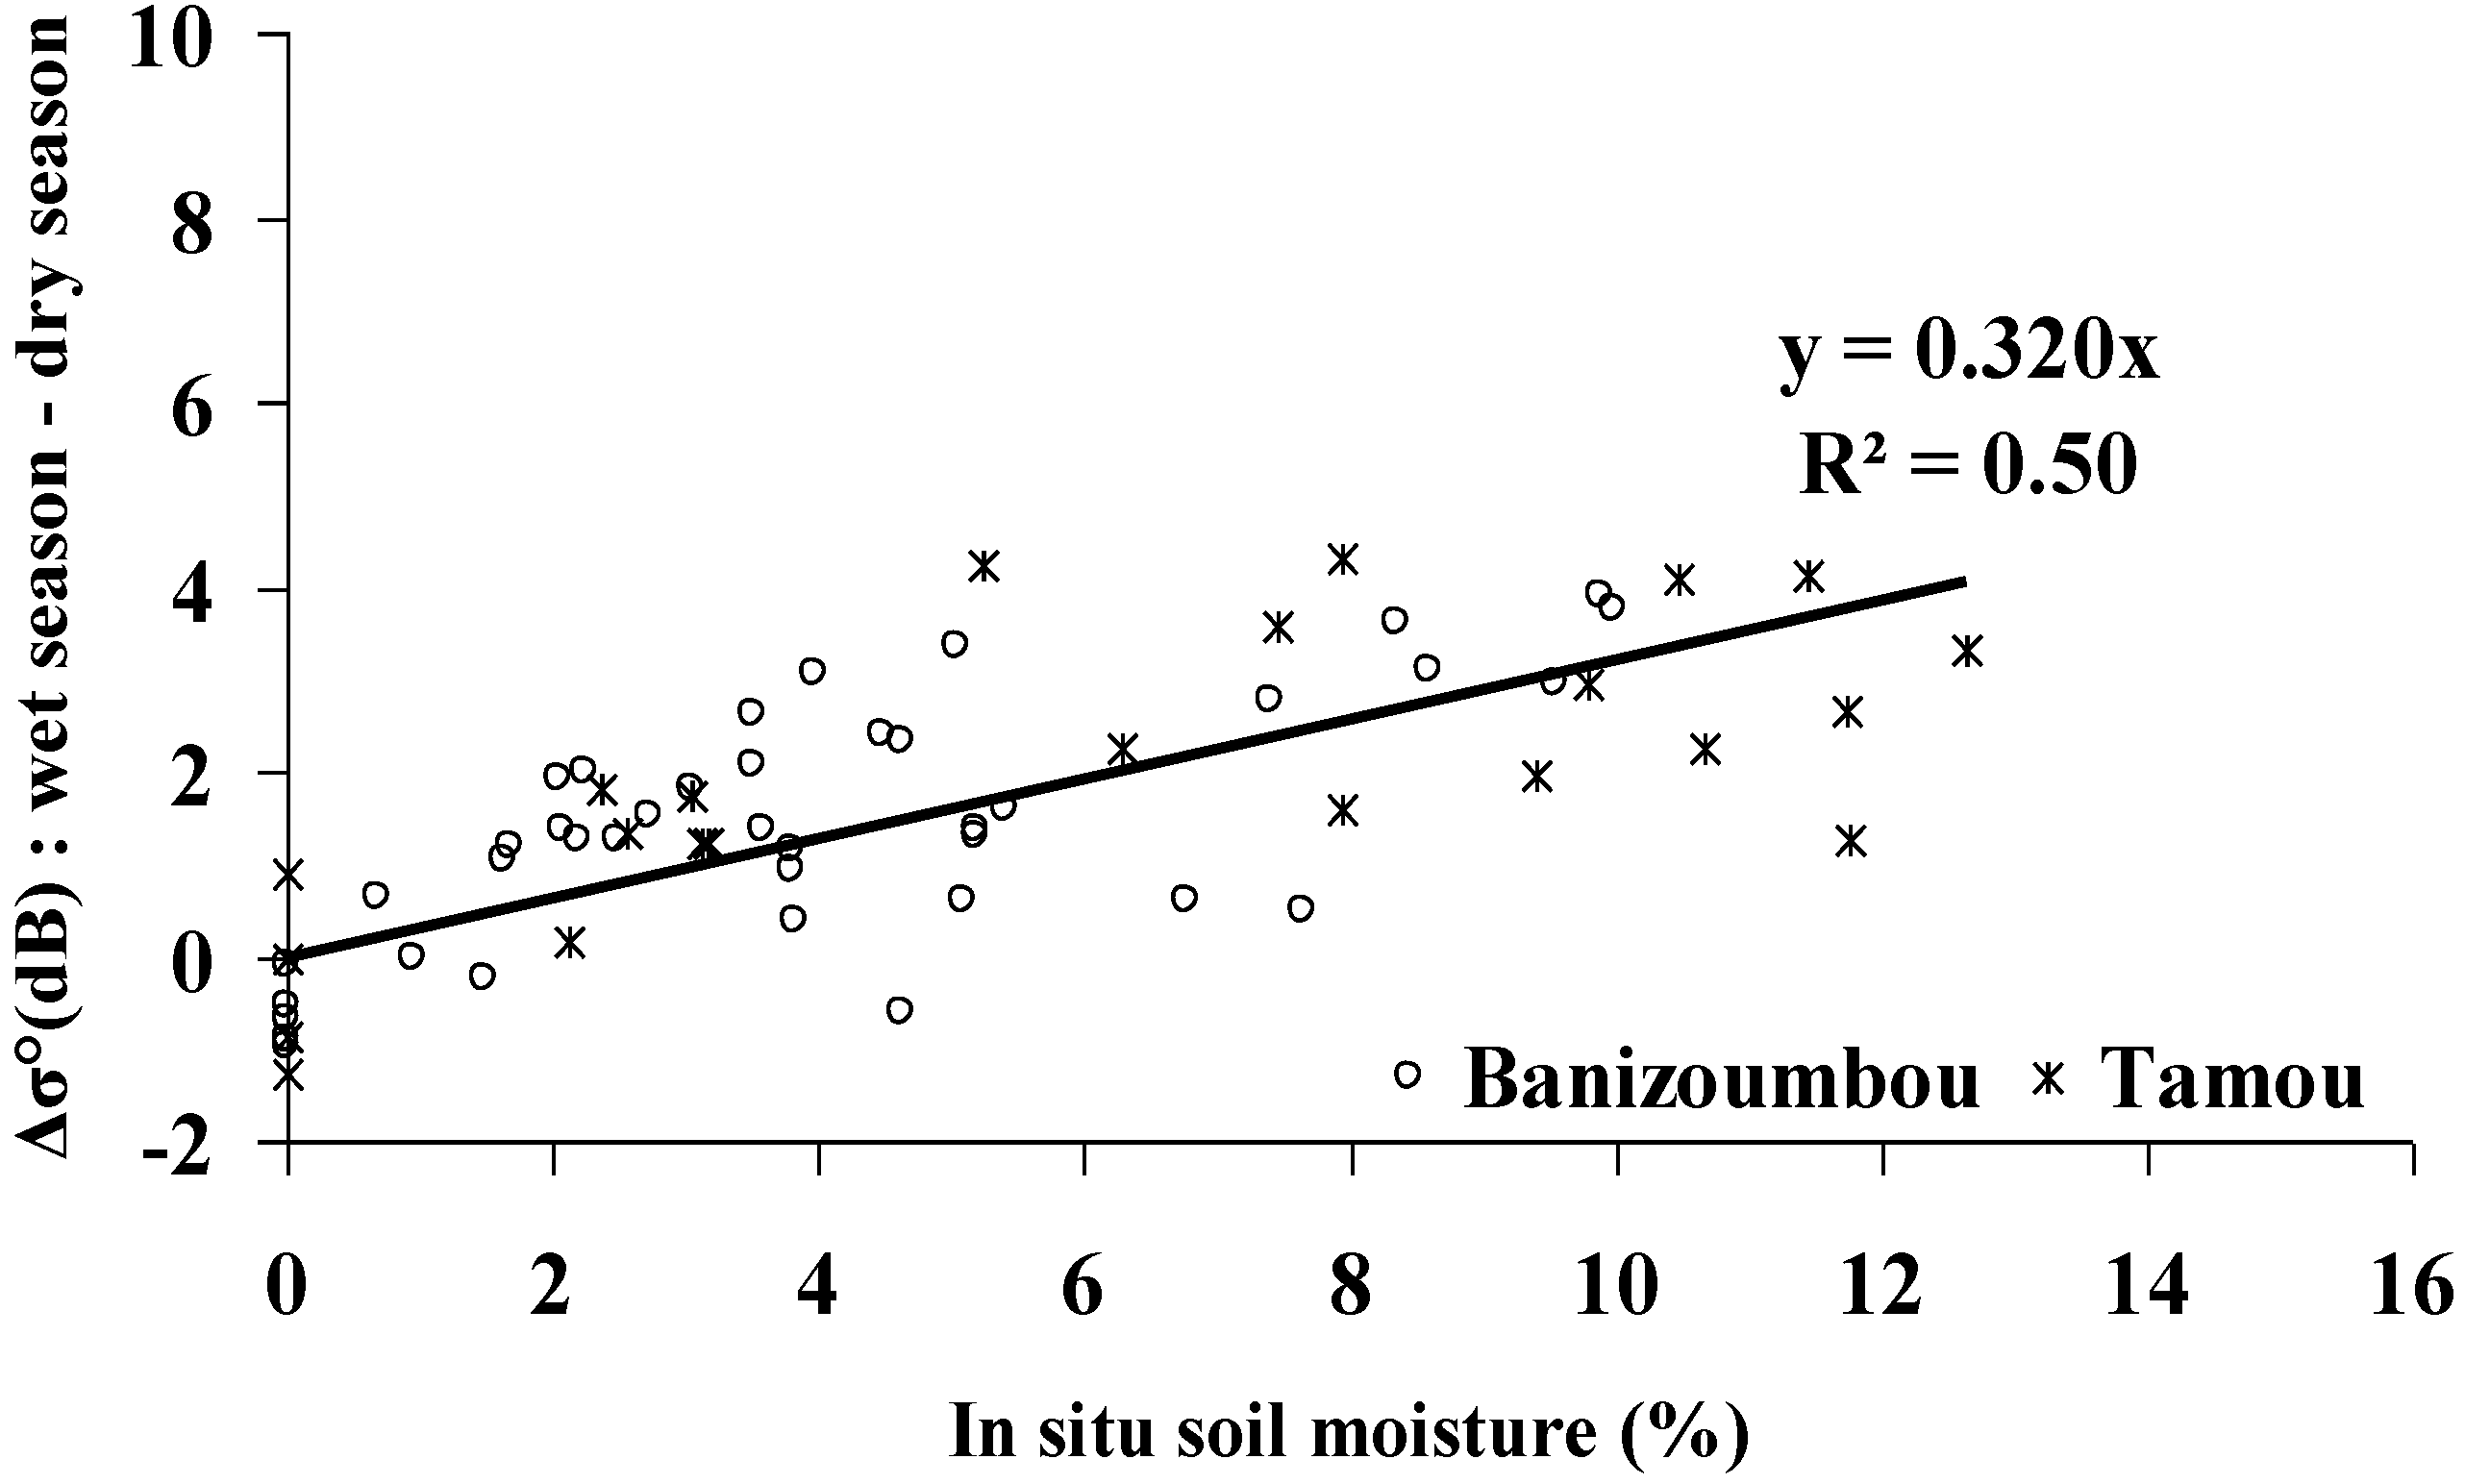
Figure 6 shows the linear relationships between radar signal and soil moisture for each study site. An offset of about 1.3 dB between the two relationships shows the effect of radar incidence angle, with higher σ° for Banizoumbou images than for Tamou images (27° for Banizoumbou and 39° for Tamou). Results show that the sensitivity of the radar signal to soil moisture is of the same order for 27° and 39° (0.292 dB/% for 27° and 0.287dB/% for 39°. These results therefore show that moisture mapping is optimal at low and medium incidence angles. In the case where two TerraSAR images with the same incidence angle were used, one in dry season and one in rainy season (Equation (4)), the sensitivity of the difference Δσ° (dB) to soil moisture is about 0.32 dB/% (
Figure 7).
Figure 6.
Sensitivity of TerraSAR-X signal to surface soil moisture for each study site (27° for Banizoumbou and 39° for Tamou). Each point corresponds to the average backscattering coefficient in decibels of pixels around in situ measurements of soil moisture.
Figure 6.
Sensitivity of TerraSAR-X signal to surface soil moisture for each study site (27° for Banizoumbou and 39° for Tamou). Each point corresponds to the average backscattering coefficient in decibels of pixels around in situ measurements of soil moisture.
Figure 7.
The difference between TerraSAR images acquired in rainy season and one reference image acquired in dry season according to soil moisture.
Figure 7.
The difference between TerraSAR images acquired in rainy season and one reference image acquired in dry season according to soil moisture.
3.2. Soil Moisture Mapping
Soil moisture estimates are obtained by inverting the relationships between radar signal and the soil moisture (Equations (3) and (4)). The two simple procedures defined above were applied for mapping the surface soil moisture. Only bare soils or soil with a thin herbaceous layer (NDVI < 0.25) were used for soil moisture mapping. The study sites were divided into contiguous cells/areas of 500 m × 500 m before calculating the mean backscattering coefficient on every bare soil pixel belonging to each class in each cell and for each land surface class. So, in each cell, we will have as many values of mean σ° as of classes present in the cell. This approach for soil moisture mapping in each cell and for each class is justified by the difference in the soil type of each class (different soil moisture levels).
The soil moisture retrieval approach using radar images with a georeferencing accuracy of about 2 m (1.5 to 1.9 pixels) is compatible with optical images having a pixel spacing of 4 m (used to extract the bare soils). Indeed, the georeferencing accuracy of radar images is smaller than the pixel spacing of optical images. Moreover, the soil moisture mapping will be made in cells gathering several pixels.
The
in situ soil moisture in each cell and for each land surface class is assumed to be equal to the mean value of all moisture measurements present in each cell. Validation of the soil moisture retrieval algorithm was carried out in comparing
in situ data and estimations derived from TerraSAR-X using the inversion model (Equations (3) and (4)). The use of a single TerraSAR image (method 1) overestimates the moisture content on plateaus of about 6.3% (with RMSE = 6.6%). This overestimation of soil moisture on plateaus is due to a stronger soil roughness (cuirass) whereas the soil of fallows is relatively smoother (sandy). Moreover, the limit between low lands and plateaus also appears very wet, that is in relation to important slopes at these areas.
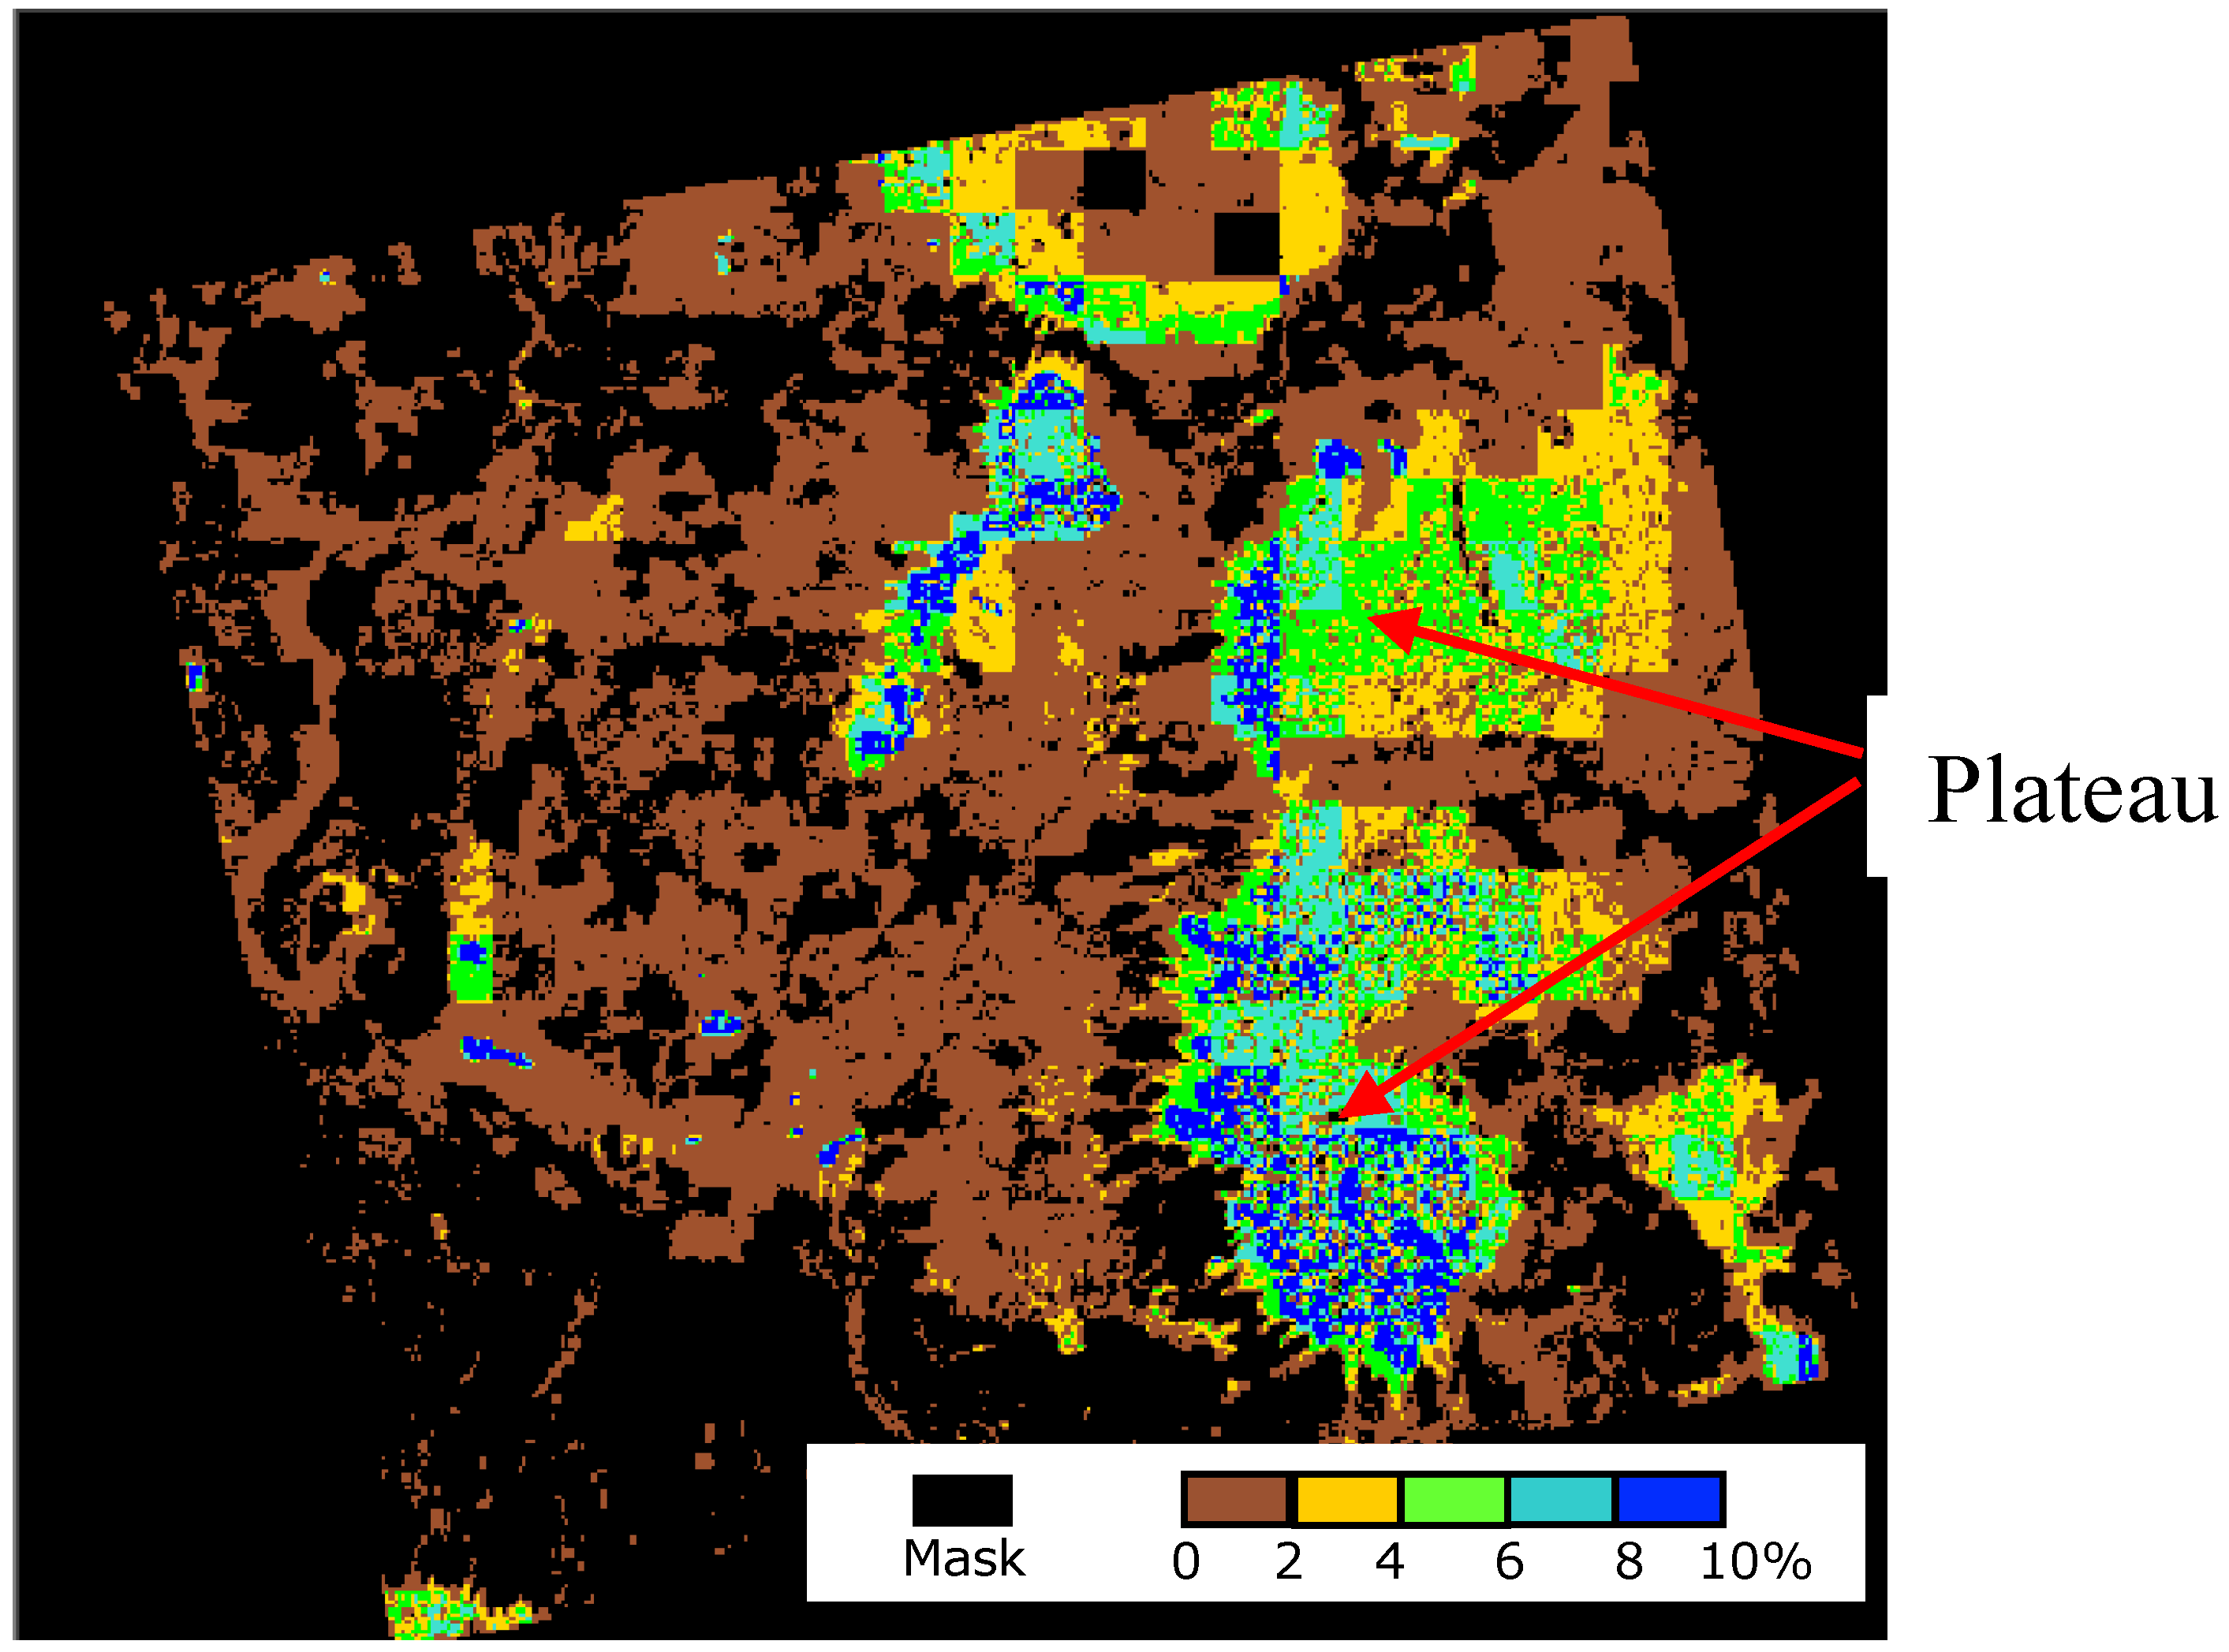
Figure 8 shows the soil moisture map on 29 May (dry season) over Banizoumbou. At this date, the estimated soil moisture is almost null on the whole of the site, except on the plateaus where strong erroneous values are observed (reach 8%).
Figure 8.
Soil moisture mapping over Banizoumbou on 29 May by method 1 (cells of 500 × 500 pixels). The image covers 10 km × 10 km.
Figure 8.
Soil moisture mapping over Banizoumbou on 29 May by method 1 (cells of 500 × 500 pixels). The image covers 10 km × 10 km.
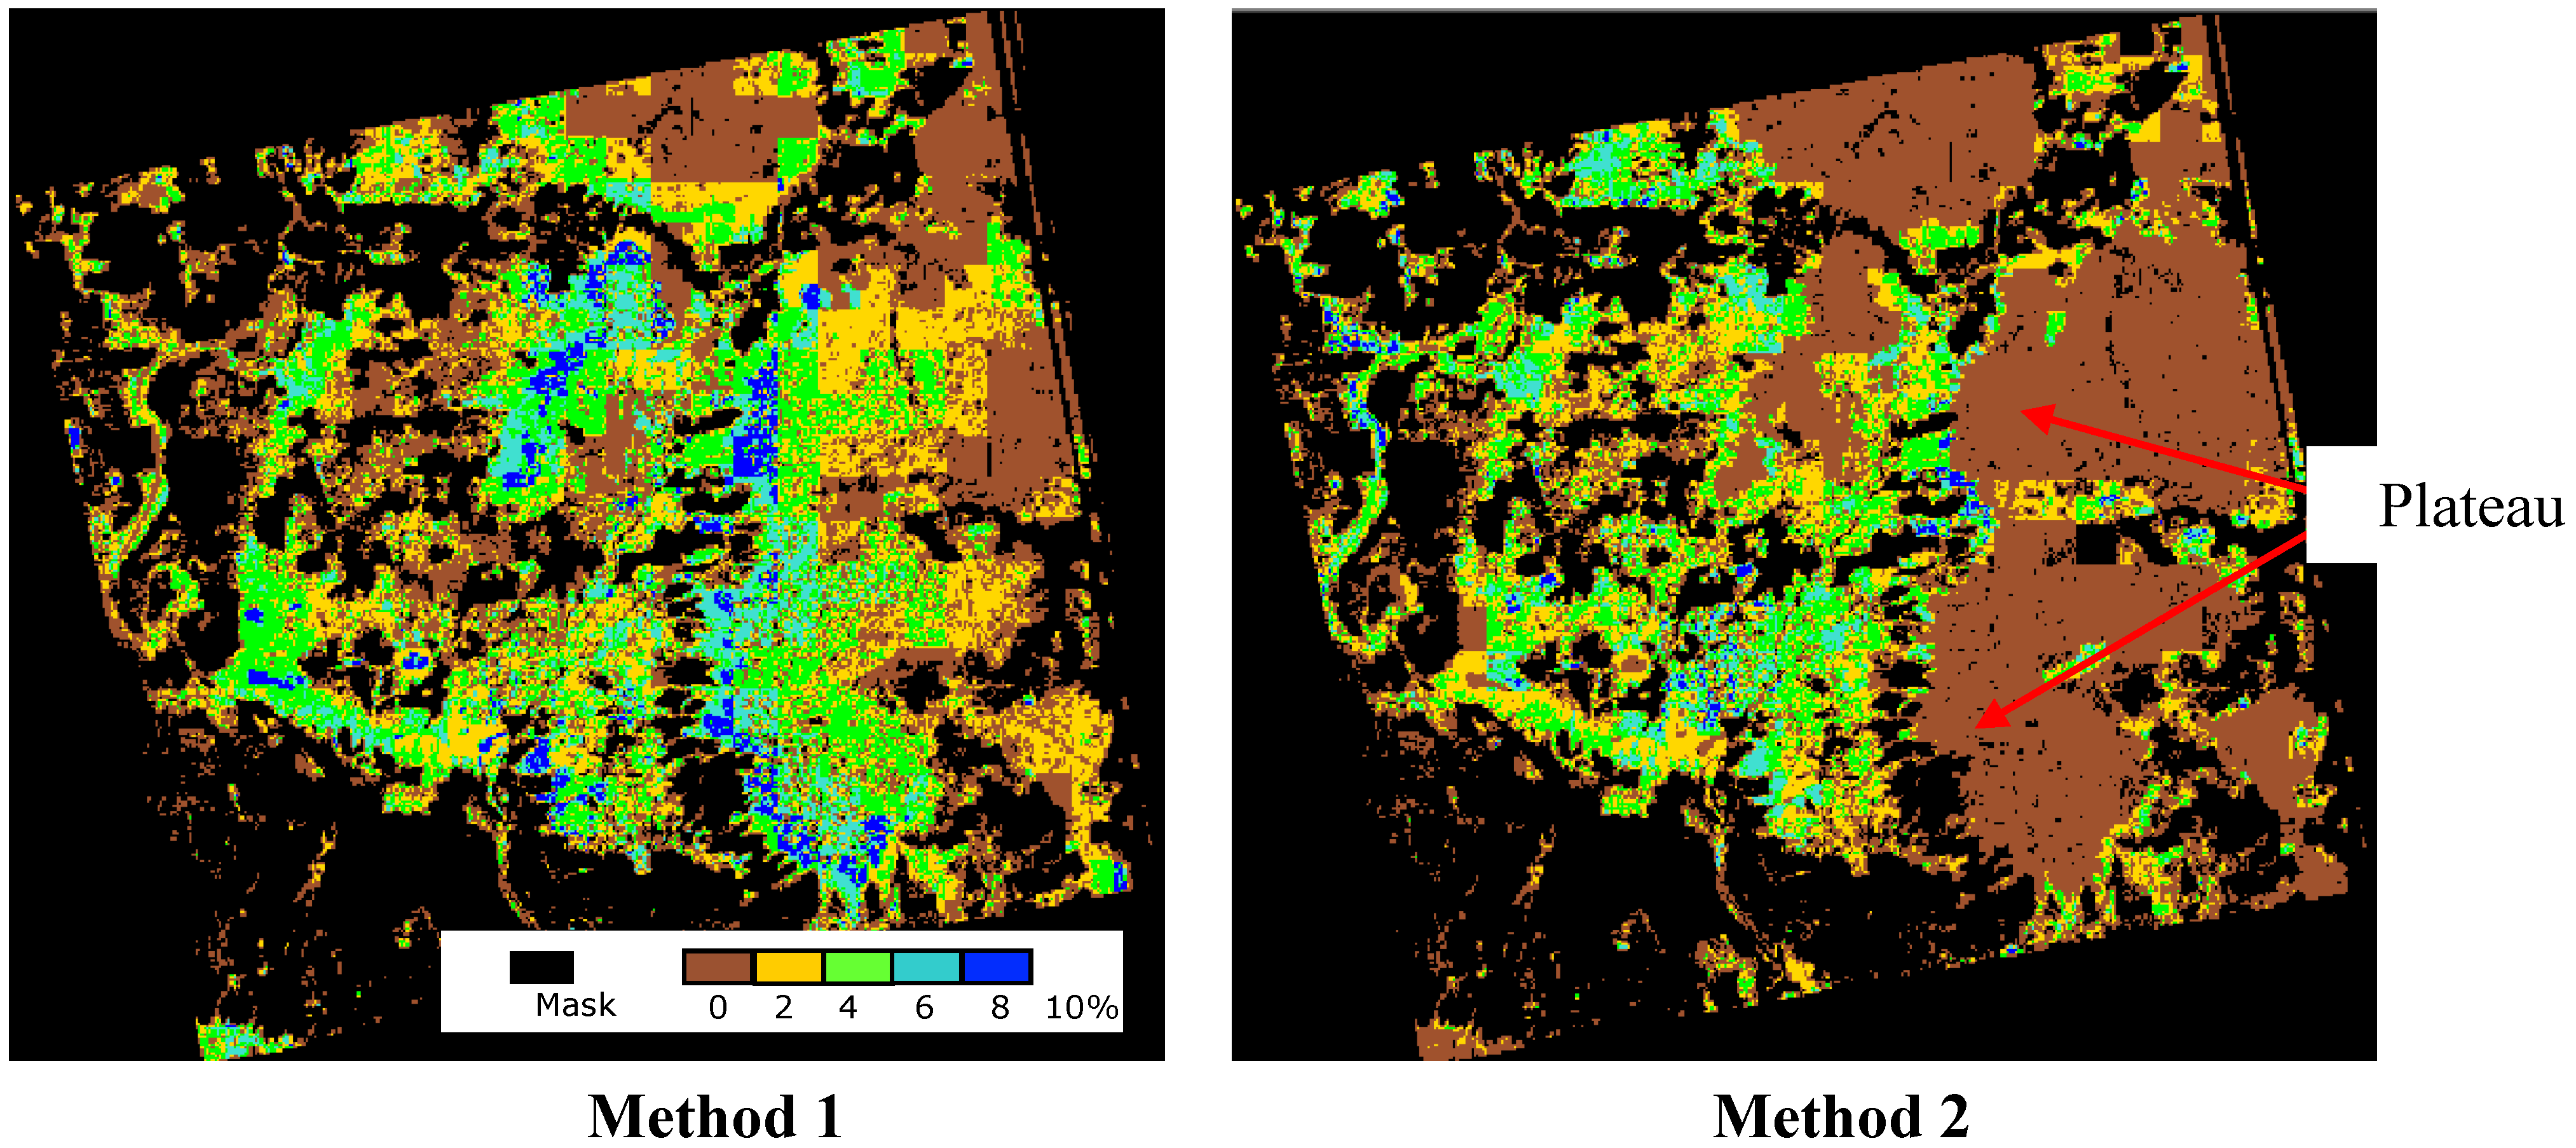
The mapping of soil moisture is much more coherent by using the difference between two images, one acquired in the dry season (29 May for Banizoumbou and 4 June for Tamou) and one in the rainy season (method 2), since this difference eliminates the surface roughness effect.
Figure 9 shows on the estimated soil moisture map of 25 August (Banizoumbou) low soil moisture values on plateaus in using method 2. Indeed, the estimated moisture on plateaus is close to 0 with method 2, which is closer to the ground observations. Finally, the analysis of soil moisture temporal evolution during the year, on Tamou for example (
Figure 10), shows that moisture content remains stable on the plateaus (0–2% over the whole year) and it changes in low lands.
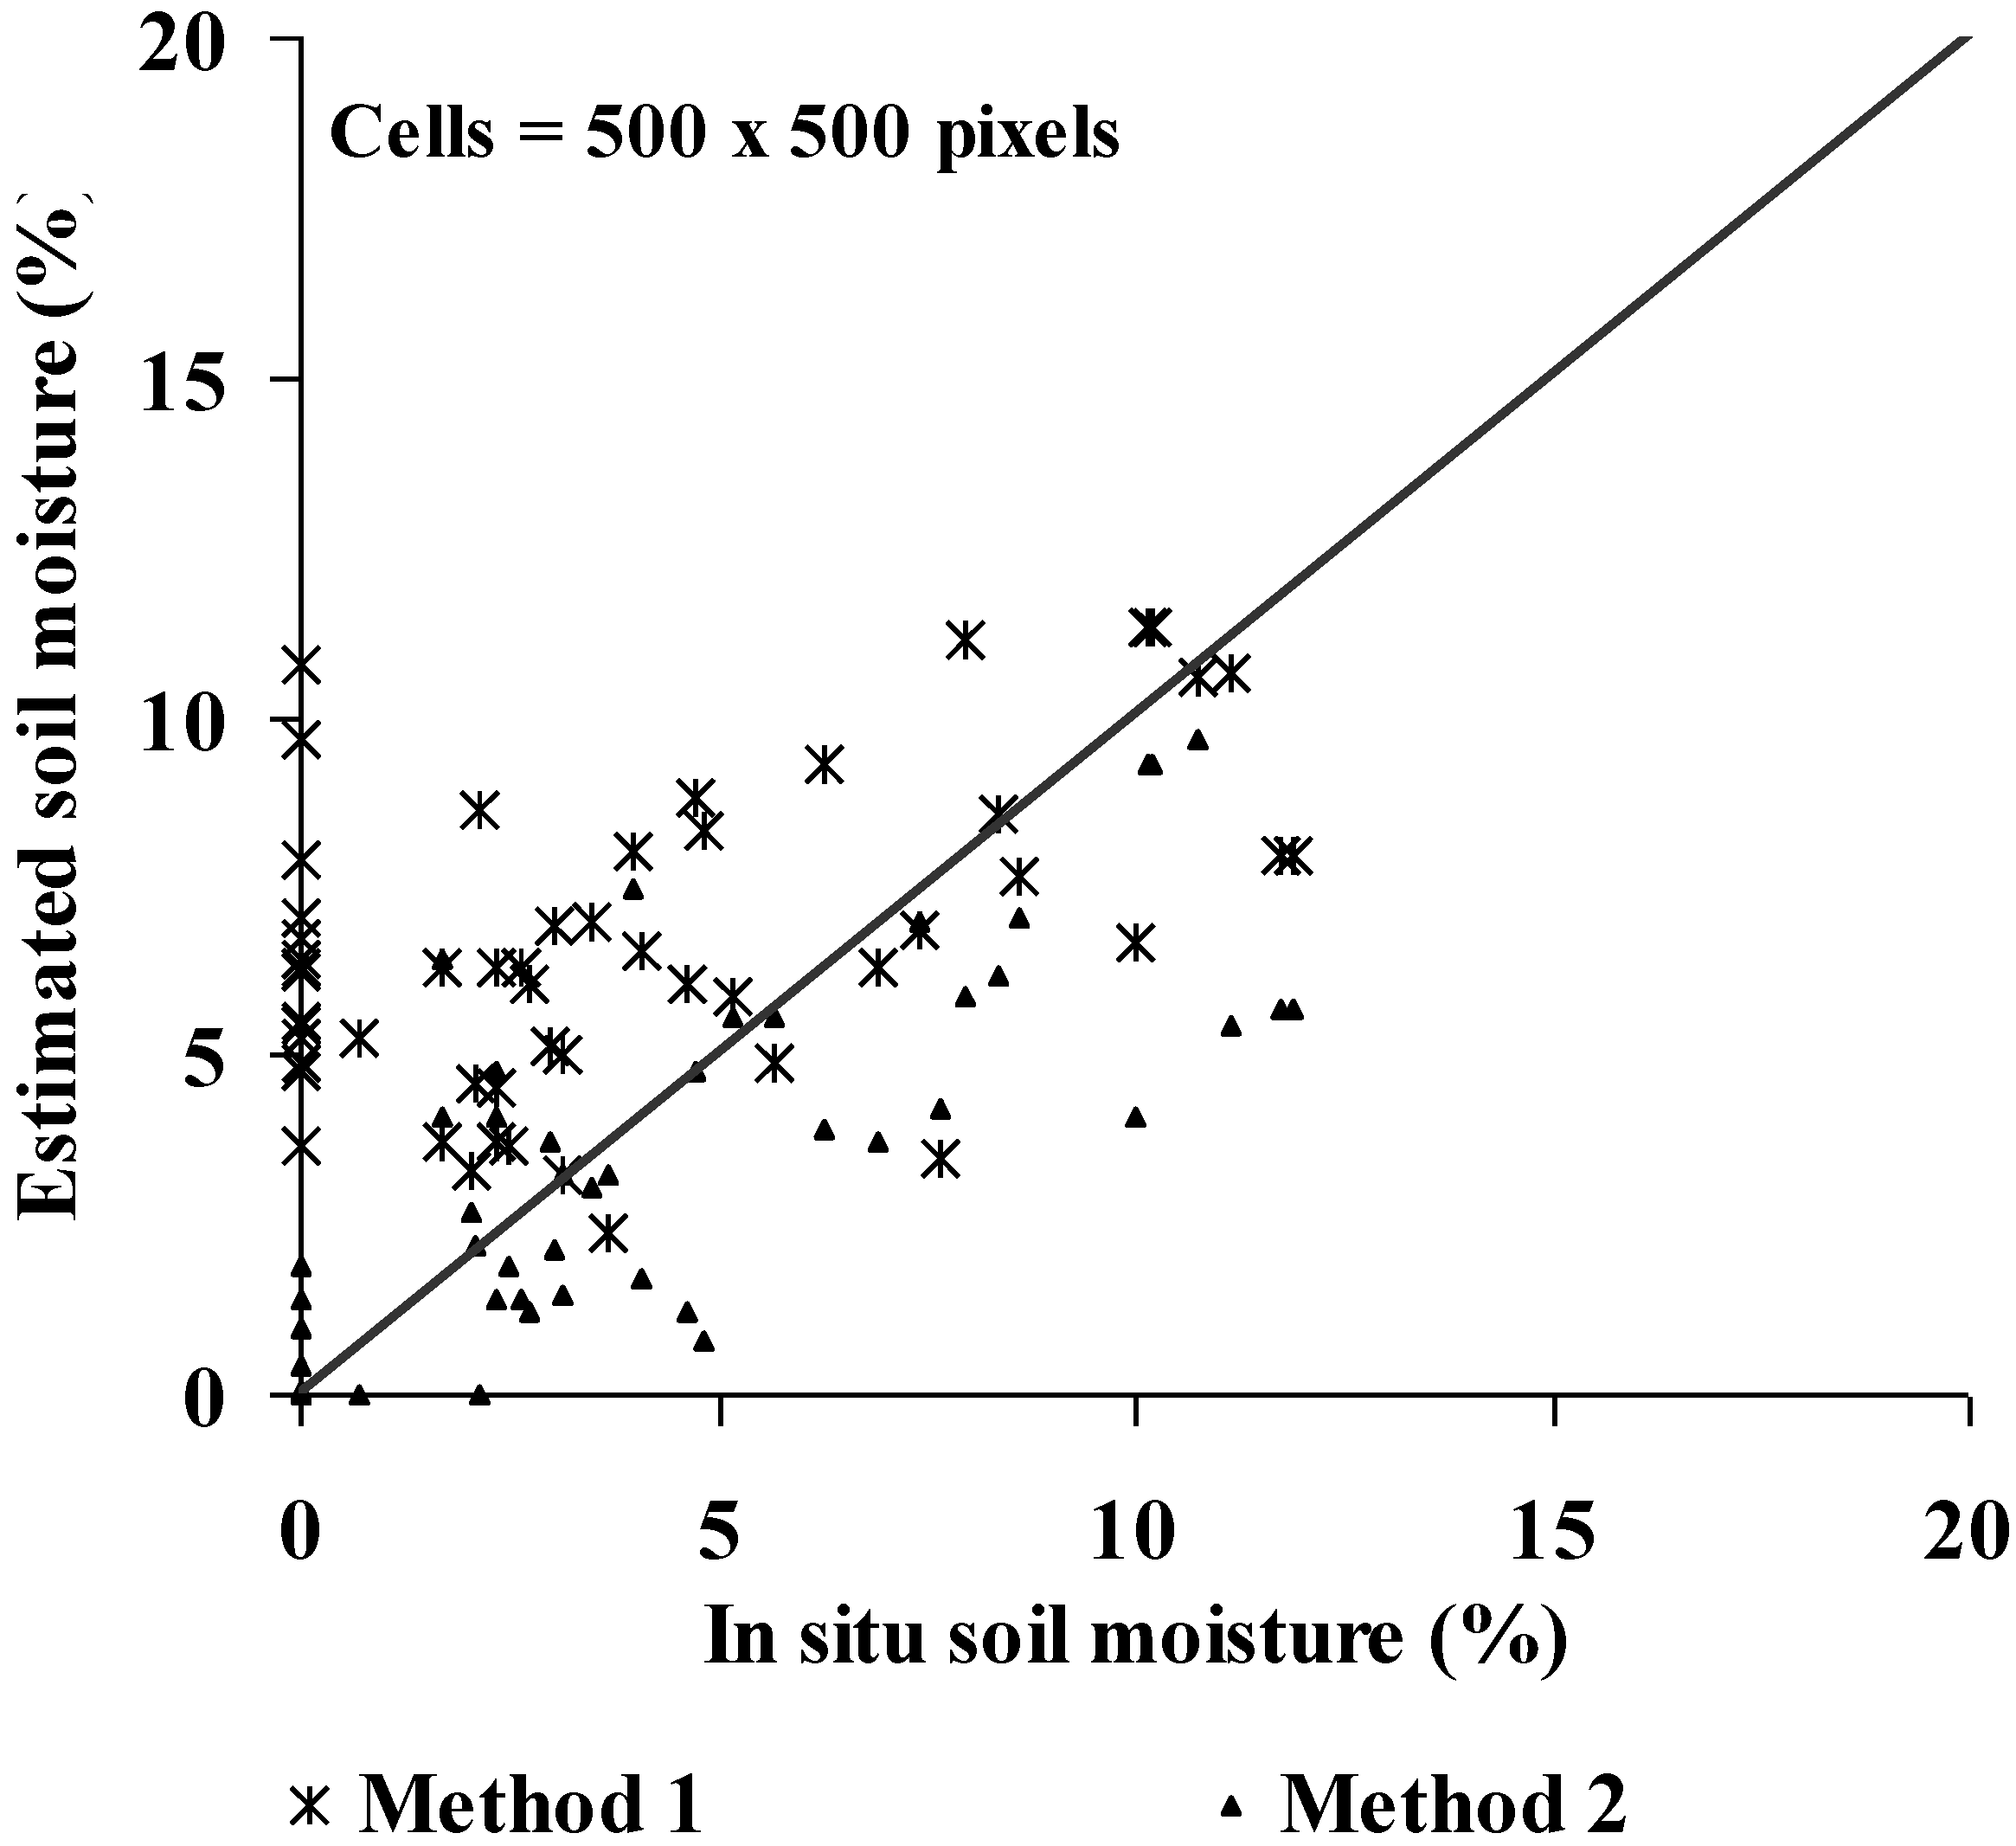
Figure 11 and
Table 3 show the comparison between estimated and measured soil moistures. Method 1 overestimates the soil while method 2 provides better results. The
in situ moistures null correspond to strong values of estimated moistures (up to 11%) with the method 1 which neglects the effect of roughness. That relates mainly to samples located on the plateaus. With the method 2, these moistures are estimated at values close to 0. The mean difference between estimated and measured soil moisture is lower than 1% with method 2 and about 3% with method 1. The resulting RMSE is about 2% with method 2 and 4% with method 1.
Figure 9.
Result of soil moisture mapping in using methods 1 and 2 on August 25 (cells of 500 × 500 pixels). The image covers 10 km × 10 km.
Figure 9.
Result of soil moisture mapping in using methods 1 and 2 on August 25 (cells of 500 × 500 pixels). The image covers 10 km × 10 km.
4. Conclusions and Perspectives
The objective of this work was to propose a methodology for mapping soil moisture in semi arid areas (Sahel). Soil moisture maps were estimated on the two study sites of Banizoumbou and Tamou in Niger. The results show the need for using two SAR images, one acquired in rainy season and one acquired in dry season, in order to eliminate the roughness effects. Estimated soil moisture values are almost null throughout the year on soils of plateaus covered with erosion crusts, but they change in the low lands. Moreover, the bare soils of fallows show strong moisture contents throughout the rainy season. Finally, soil moistures could be estimated with a RMSE of 2.3% in comparison with in situ measurements.
In perspective, it would be necessary to use the soil moisture maps to analyze a possible correlation between the soil moisture values and the presence of biological crusts. We might wonder whether high moisture values in the rainy season will condition the development of crusts, and if the presence of crusts is limited to areas with low annual variations of moisture.
Figure 10.
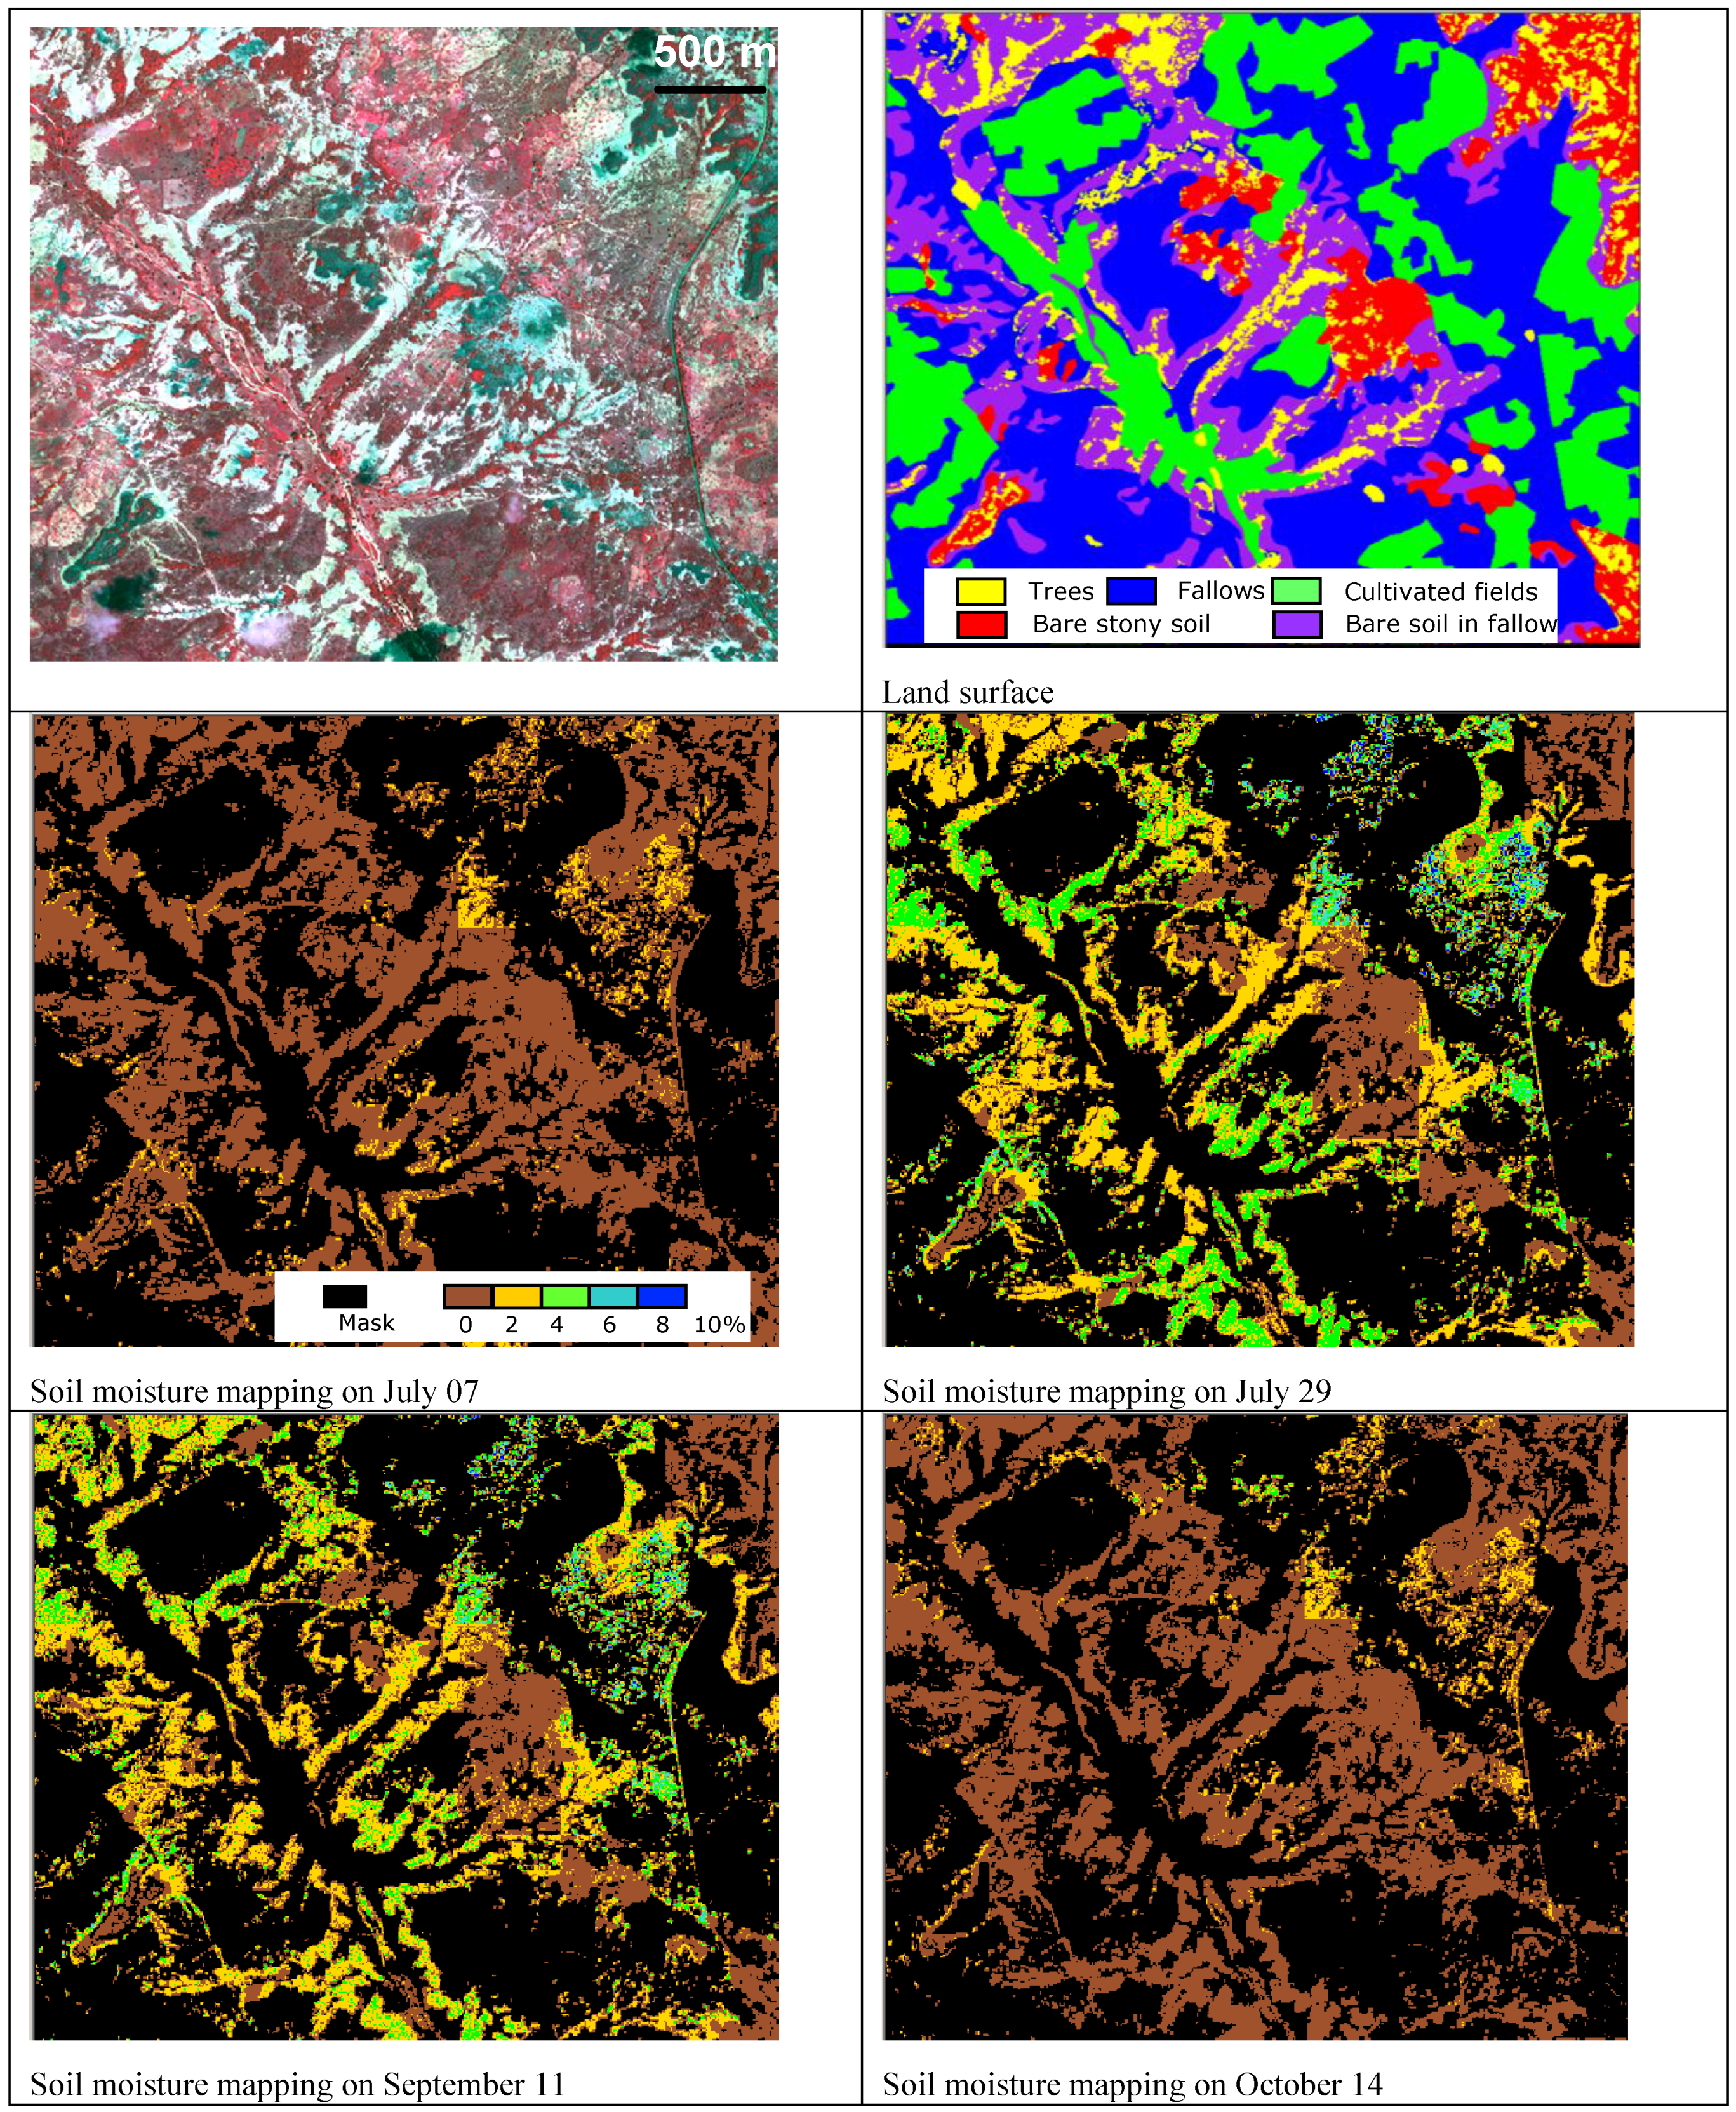
Temporal evolution of soil moisture map on Tamou (method 2, cells of 500 × 500 pixels) (on a segment of TerraSAR image).
Figure 10.
Temporal evolution of soil moisture map on Tamou (method 2, cells of 500 × 500 pixels) (on a segment of TerraSAR image).
Figure 11.
Comparison between estimated and in situ soil moisture contents. The overestimate of soil moisture on plateaus (very low mv) is due to a stronger soil roughness (cuirass).
Figure 11.
Comparison between estimated and in situ soil moisture contents. The overestimate of soil moisture on plateaus (very low mv) is due to a stronger soil roughness (cuirass).
Table 3.
Analysis of differences between estimated and measured soil moisture. The test with cells of 500 × 500 pixels use the land surface condition (in each cell, there are as many moisture values as of land surface classes).
Table 3.
Analysis of differences between estimated and measured soil moisture. The test with cells of 500 × 500 pixels use the land surface condition (in each cell, there are as many moisture values as of land surface classes).
| Method | 1 | 2 |
|---|
| Bias | +2,7 | −0.8 |
| Standard deviation | 3,3 | 2,2 |
| RMSE | 4,2 | 2,3 |

 ,
, 

