A Multi-Resolution Multi-Temporal Technique for Detecting and Mapping Deforestation in the Brazilian Amazon Rainforest

Abstract
:1. Introduction
2. Materials
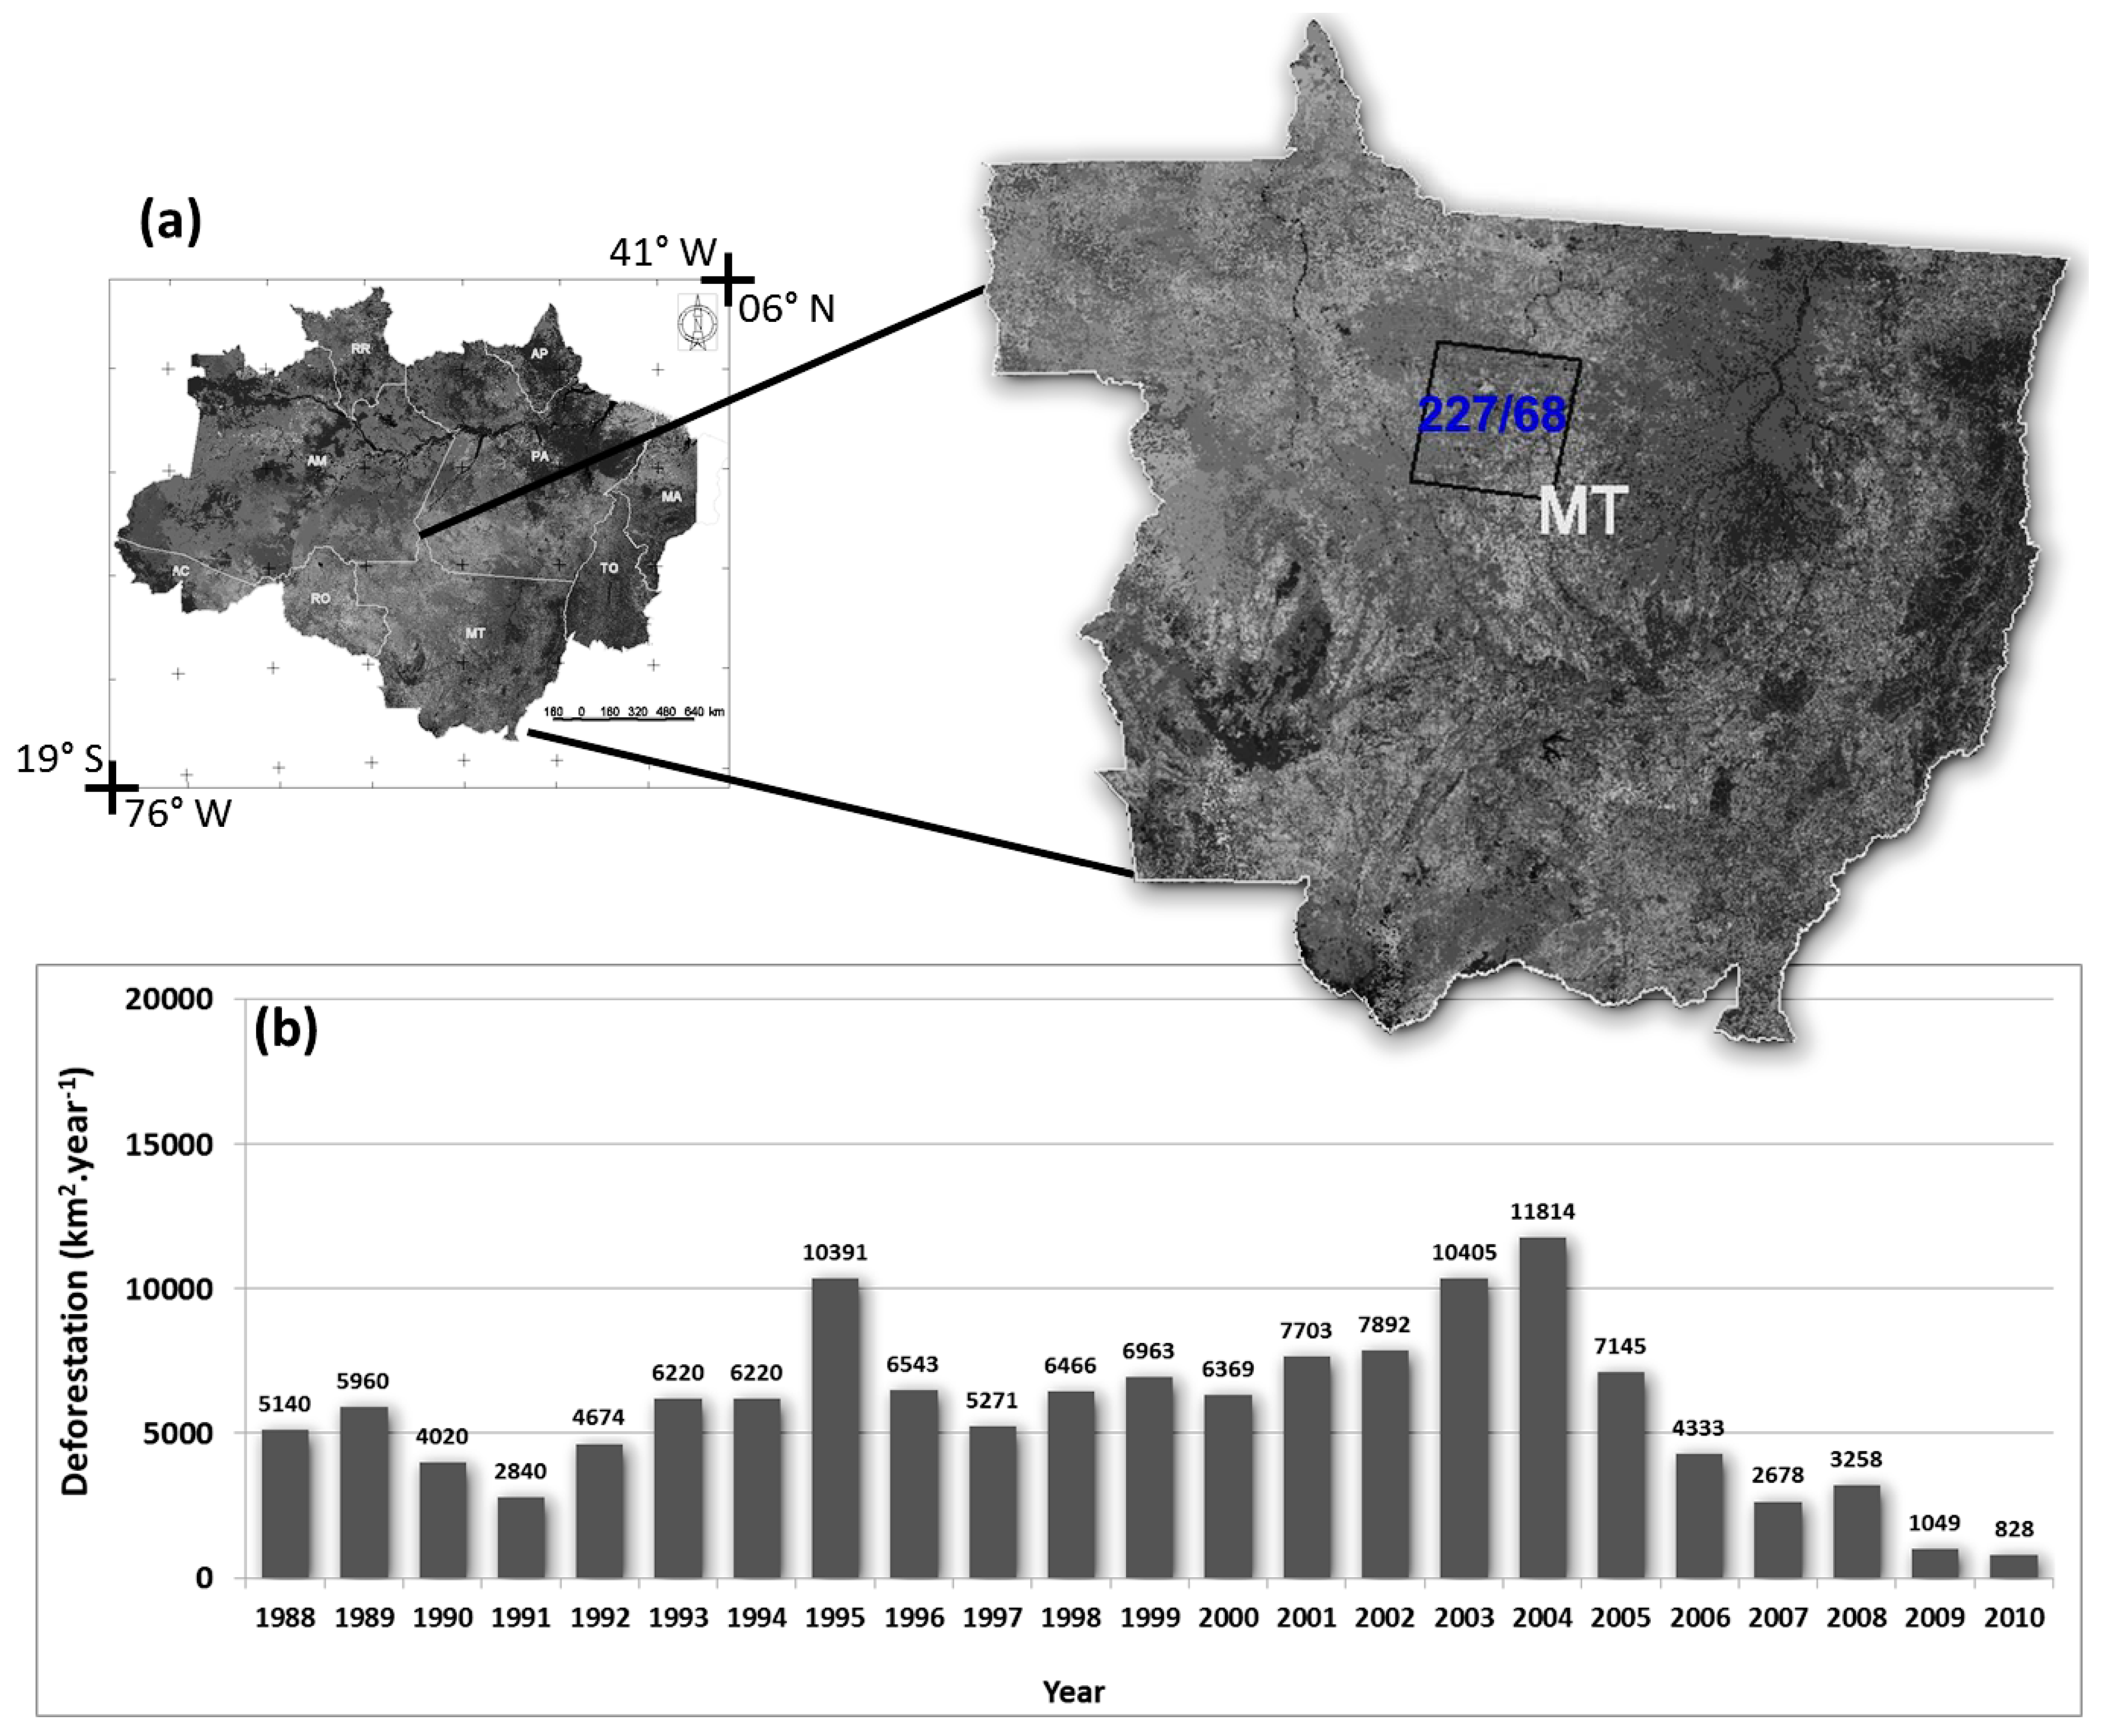
2.1. Study Site
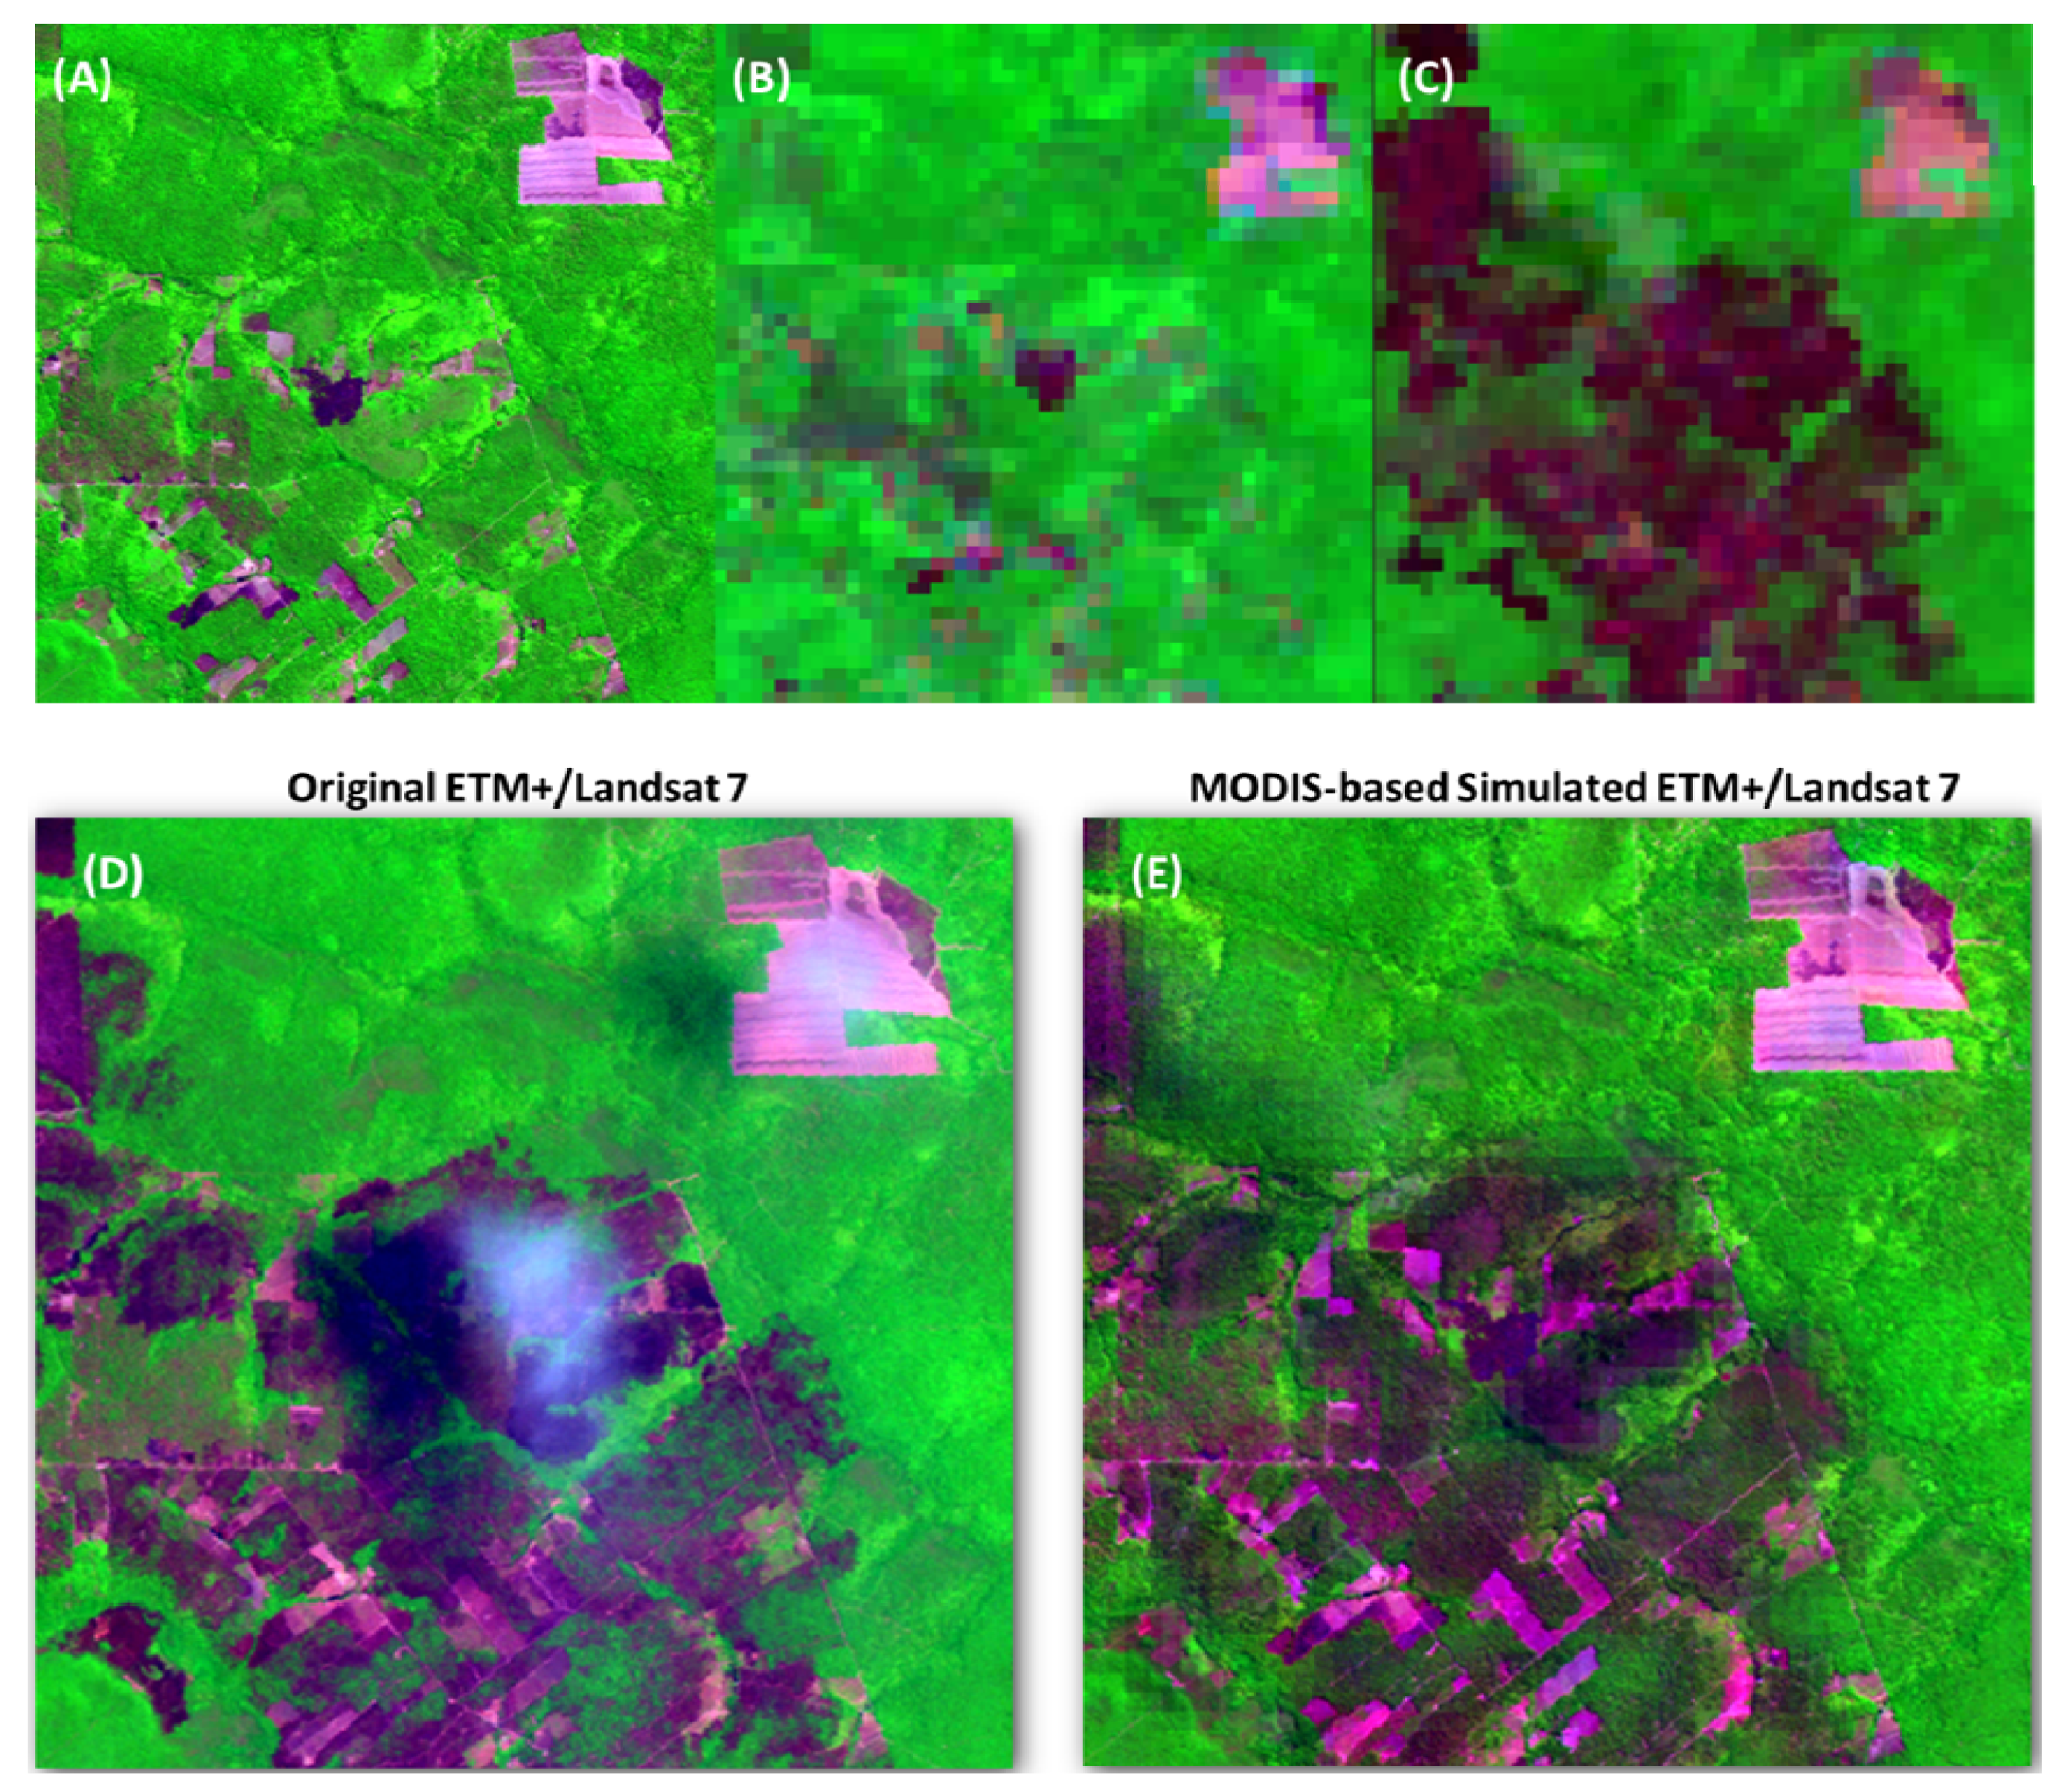
2.2. Remote Sensing Images

| ETM+/L7 Band | ETM+/L7 bandwidth (nm) | MODIS/Terra Band | MODIS/Terra bandwidth (nm) | ETM+/L7 spatial resolution (m) | MODIS/Terra spatial resolution (m) |
|---|---|---|---|---|---|
| 1 | 450–515 | 3 | 459–479 | 30 | 500 |
| 2 | 525–605 | 4 | 545–565 | 30 | 500 |
| 3 | 630–690 | 1 | 620–670 | 30 | 250 |
| 4 | 775–900 | 2 | 841–876 | 30 | 250 |
| 5 | 1,550–1,750 | 6 | 1,628–1,652 | 30 | 500 |
| 7 | 2,090–2,350 | 7 | 2,105–2,155 | 30 | 500 |
3. Methods
3.1. Pre-Processing
3.2. Methodological Approach
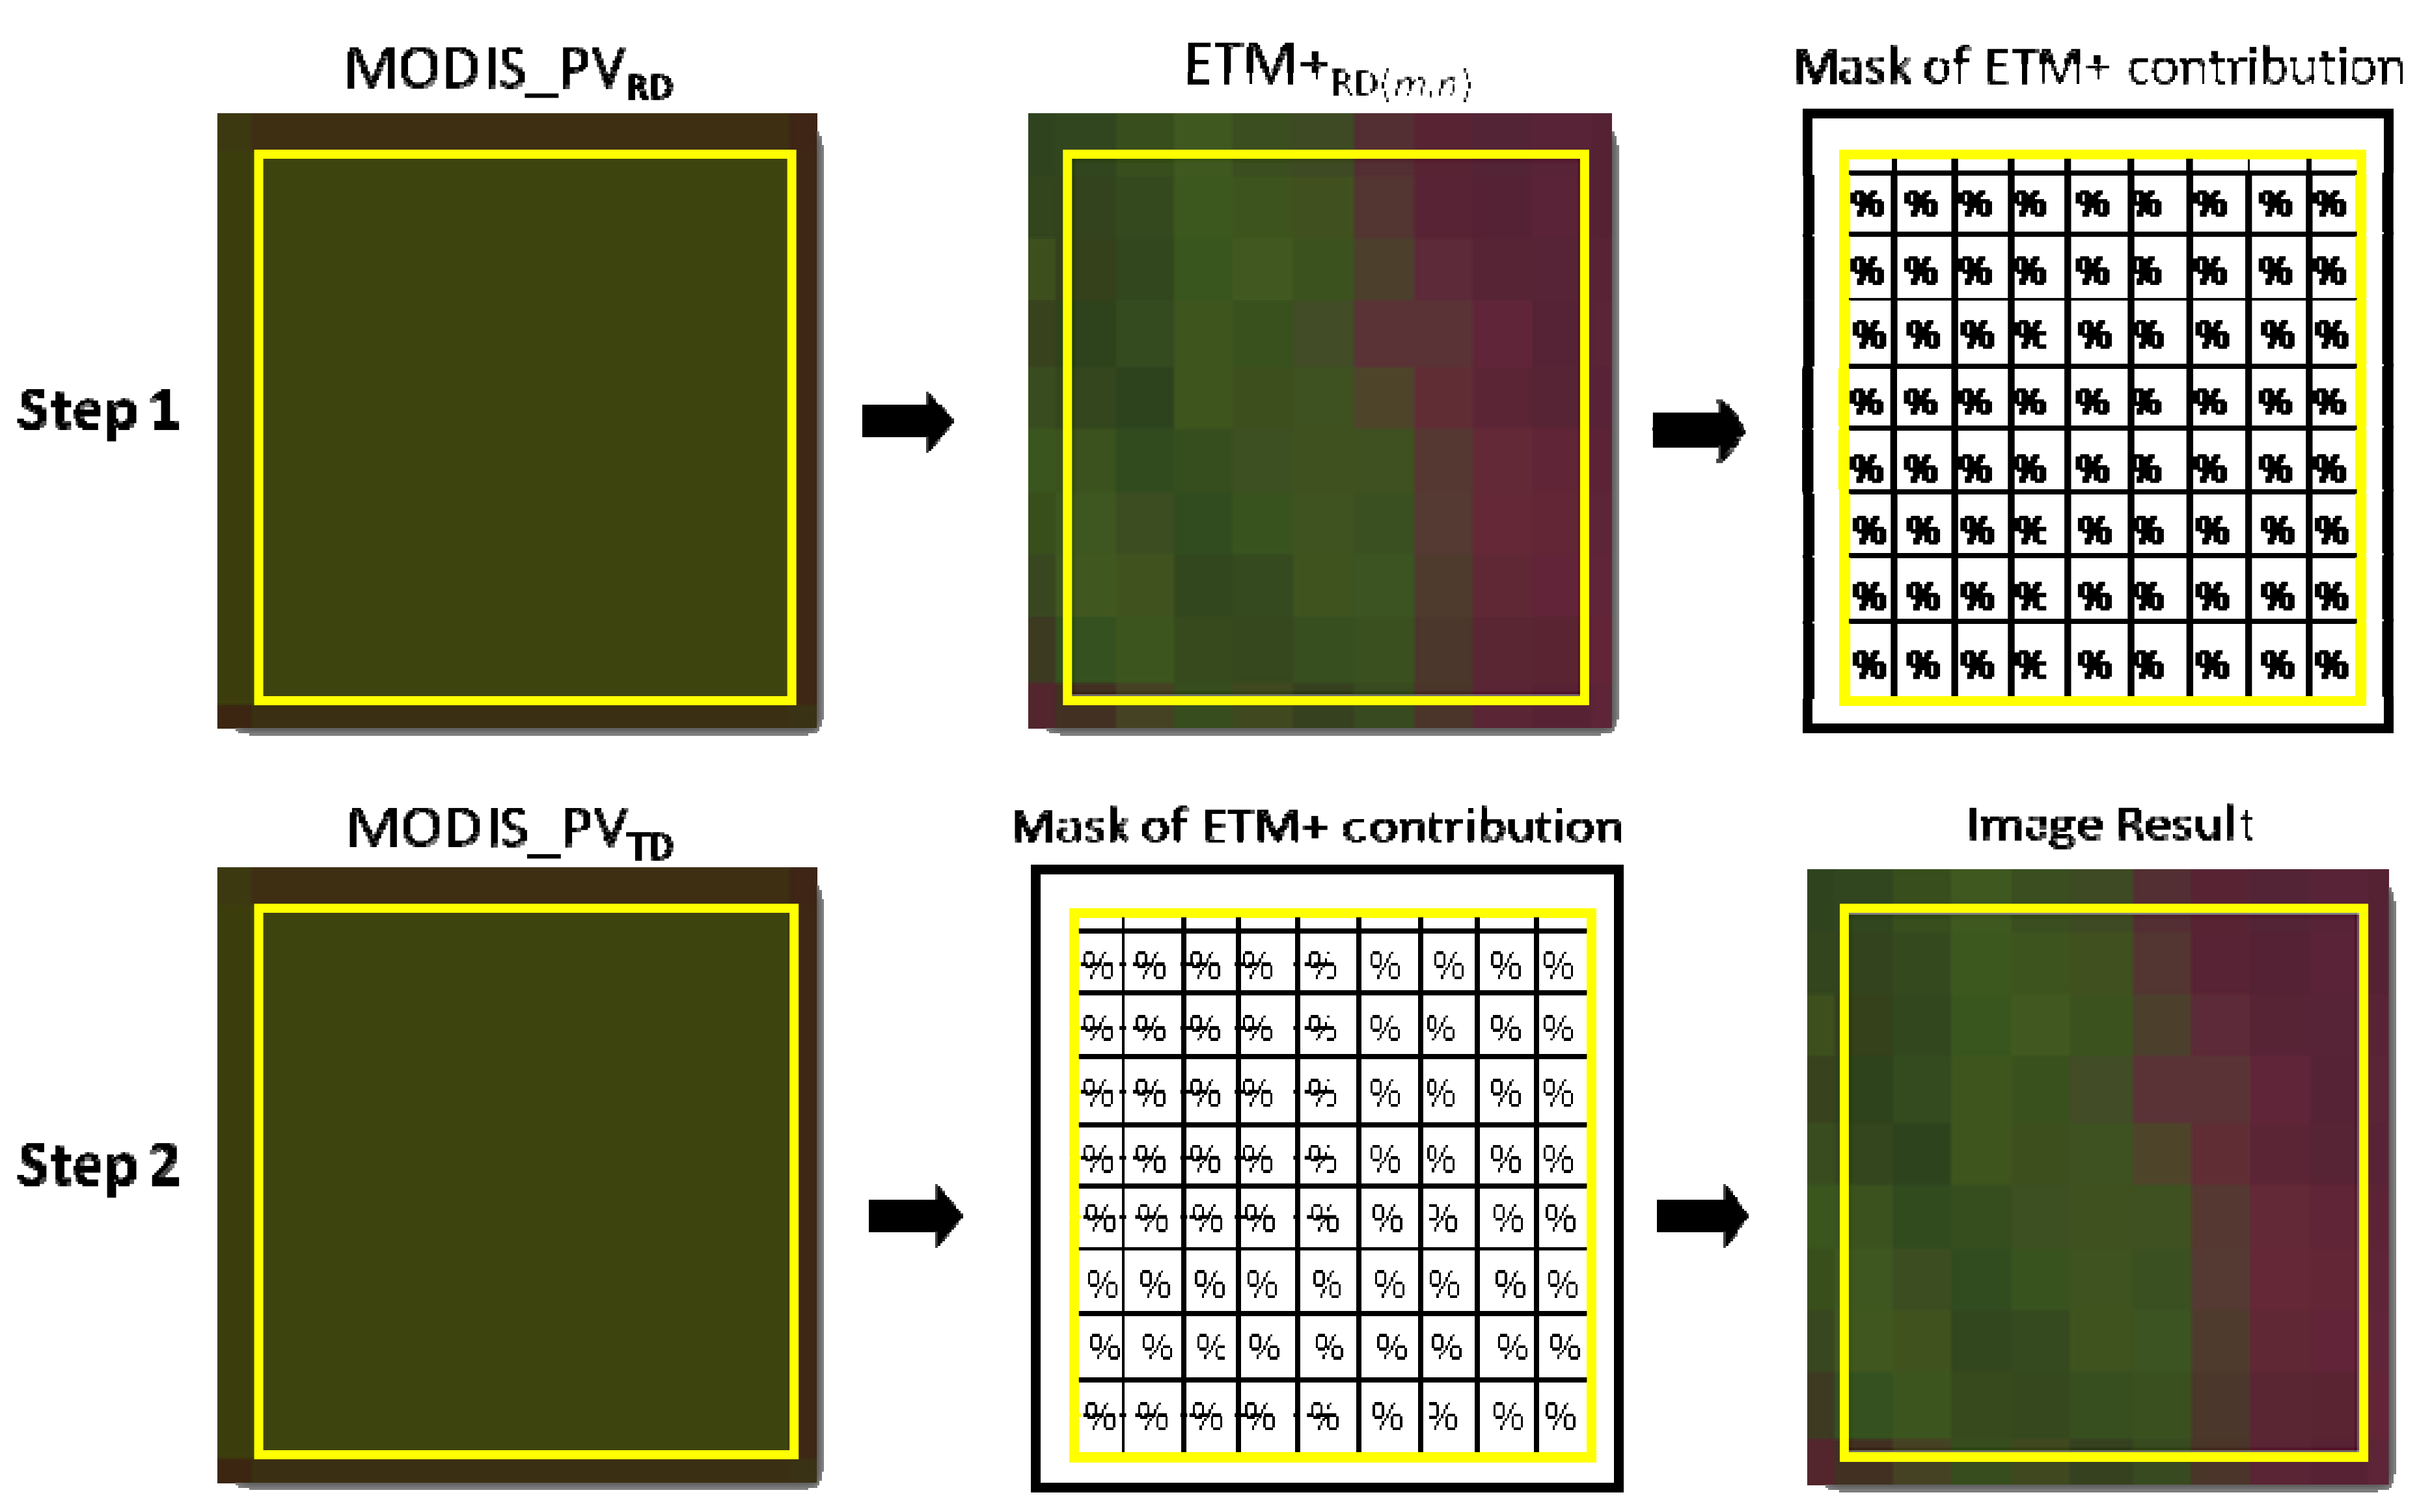
3.3. Linear Spectral Mixing Model (LSMM)
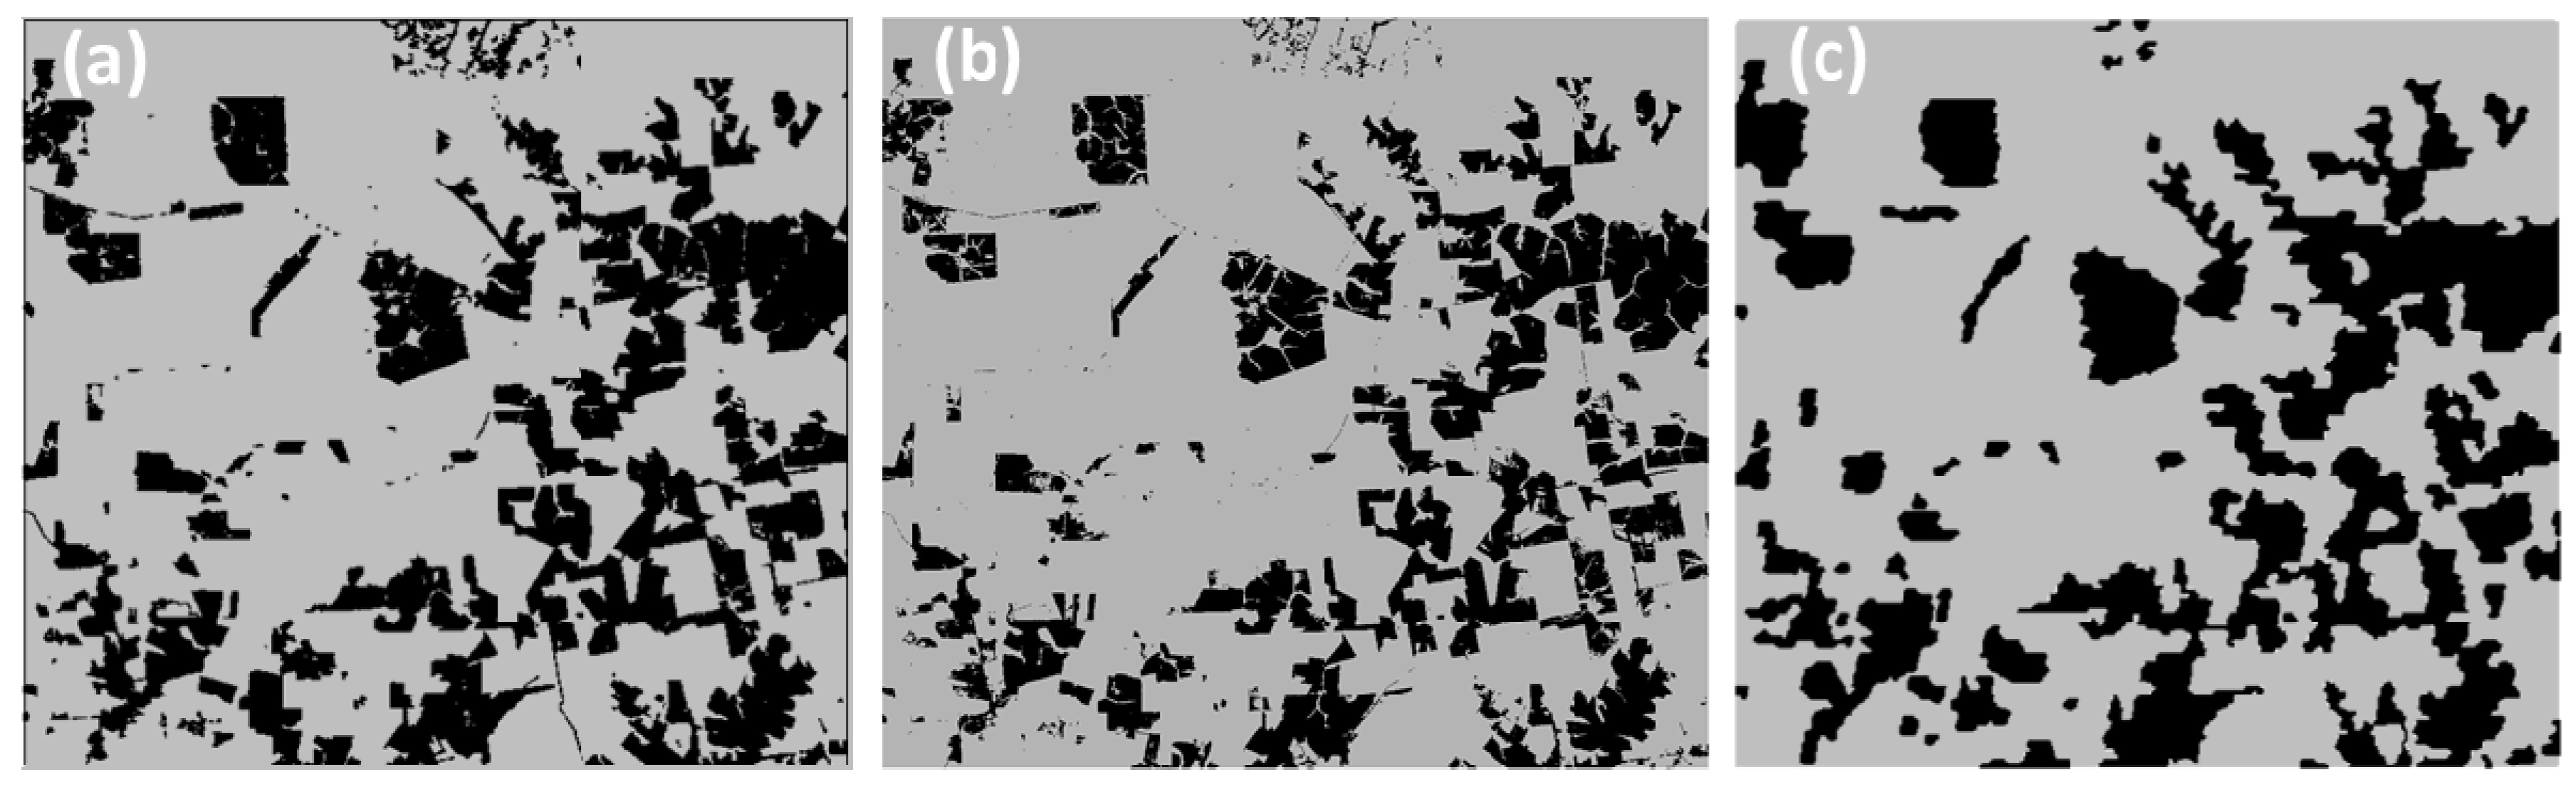
3.4. Image Classification and Statistical Analysis
4. Results and Discussion


| Sensor/Classification | ETM+/L7 (km2) | MODIS/Terra (km2) | Simulated Image (km2) |
|---|---|---|---|
| Deforestation | 4,700.8 | 4,410.3 | 4,768.6 |
| Vegetated areas | 1,440.3 | 1,730.8 | 1,372.5 |
| Omission | - | 10% | 6% |
| Commission | - | 9% | 1% |
5. Conclusions
Acknowledgments
References
- Myneni, R.B.; Keeling, C.D.; Tucker, C.J.; Asrar, G.; Nemani, R.R. Increased plant growth in the northern high latitudes from 1981 to 1991. Nature 1997, 386, 698–702. [Google Scholar] [CrossRef]
- Shimabukuro, Y.E.; Batista, G.T.; Mello, E.M.K.; Moreira, J.C.; Duarte, V. Using shade fraction image segmentation to evaluate deforestation in Landsat Thematic Mapper images of the Amazon Region. Int. J. Remote Sens. 1998, 19, 535–541. [Google Scholar] [CrossRef]
- Rogan, J.; Franklin, J.; Roberts, D.A. A comparison of methods for monitoring multitemporal vegetation change using Thematic Mapper imagery. Remote Sens. Environ. 2002, 80, 143–156. [Google Scholar] [CrossRef]
- Hess, L.L.; Melack, J.M.; Filsos, S.; Wang, Y. Delineation of inundated area and vegetation along the Amazon floodplain with the SIR-C synthetic aperture radar. IEEE Trans. Geosci. Remote Sens. 1995, 334, 896–904. [Google Scholar] [CrossRef]
- Sakamoto, T.; Nguyen, N.V.; Kotera, A.; Ohno, H.; Ishitsuka, N.; Yokozawa, M. Detecting temporal changes in the extent of annual flooding within the Cambodia and the Vietnamese Mekong Delta from MODIS time-series imagery. Remote Sens. Environ. 2007, 109, 295–313. [Google Scholar] [CrossRef]
- Mcvicar, T.R.; Bierwirth, P.N. Rapidly assessing the 1997 drought in Papua New Guinea using composite AVHRR imagery. Int. J. Remote Sens. 2001, 22, 2109–2198. [Google Scholar] [CrossRef]
- Singh, R.P.; Roy, S.; Kogan, F. Vegetation and temperature condition indices from NOAA AVHRR data for drought monitoring over India. Int. J. Remote Sens. 2003, 24, 4393–4402. [Google Scholar] [CrossRef]
- Roy, D.P.; Giglio, L.; Kendall, J.D.; Justice, C.O. A multitemporal active-fire based burn scar detection algorithm. Int. J. Remote Sens. 1999, 20, 1031–1038. [Google Scholar] [CrossRef]
- Giglio, L.; Descloitres, J.; Justice, C.O.; Kaufman, Y. An enhanced contextual fire detection algorithm for MODIS. Remote Sens. Environ. 2003, 87, 273–282. [Google Scholar] [CrossRef]
- Pereira, G.; Freitas, S.R.; Moraes, E.C.; Ferreira, N.J.; Shimabukuro, Y.E.; Rao, V.B.; Longo, K.M. Estimating trace gas and aerosol emissions over South America: Relationship between fire radiative energy released and aerosol optical depth observations. Atmos. Environ. 2009, 43, 6388–6397. [Google Scholar] [CrossRef]
- Tucker, C.J.; Choudhury, B.J. Satellite remote sensing of drought conditions. Remote Sens. Environ. 1987, 243–251. [Google Scholar] [CrossRef]
- Nemani, R.R.; Keeling, C.D.; Hashimoto, H.; Jolly, W.M.; Piper, S.C.; Tucker, C.J.; Myneni, R.B.; Running, S.W. Climate-driven increases in global terrestrial net primary production from 1982 to 1999. Science 2003, 300, 1560–1563. [Google Scholar] [CrossRef] [PubMed]
- Thomas, N.; Hendris, C.; Congalton, R.G. A comparison of urban mapping methods using high-resolution digital imagery. Photogramm. Eng. Remote Sens. 2003, 69, 963–972. [Google Scholar] [CrossRef]
- Emery, W.J.; Yu, Y. Satellite sea surface temperature patterns. Int. J. Remote Sens. 1997, 18, 323–334. [Google Scholar] [CrossRef]
- Hirosawa, Y.; Marsh, S.E.; Kliman, D.H. Application of standardized principal component analysis to land-cover characterization using multitemporal AVHRR data. Remote Sens. Environ. 1996, 58, 267–281. [Google Scholar] [CrossRef]
- Bajjouk, T.; Populus, J.; Guillaumont, B. Quantification of subpixel cover fractions using principal component analysis and a linear programming method: Application to the coastal zone of Roscoff (France). Remote Sens. Environ. 1998, 64, 153–165. [Google Scholar] [CrossRef]
- Tatem, A.J.; Lewis, H.G.; Atkinson, P.M.; Nixon, M.S. Super-resolution land cover pattern prediction using a Hopfield neural network. Remote Sens. Environ. 2002, 79, 1–14. [Google Scholar] [CrossRef]
- Kasetkasem, T.; Arora, M.K.; Varshney, P.K. Super-resolution land cover mapping using a Markov random field based approach. Remote Sens. Environ. 2005, 96, 302–314. [Google Scholar] [CrossRef]
- Zhang, Y.; Hong, G. An IHS and wavelet integrated approach to improve pan-sharpening visual quality of natural colour IKONOS and QuickBird images. Inf. Fusion 2005, 6, 225–234. [Google Scholar] [CrossRef]
- Gao, F.; Masek, J.; Schwaller, M.; Hall, F. On the blending of the Landsat and MODIS surface reflectance: Predicting daily Landsat surface reflectance. IEEE Trans. Geosci. Remote Sens. 2006, 8, 2207–2218. [Google Scholar]
- Ling, Y.; Ehlers, M.; Usery, E.L.; Madden, M. FFT-enhanced IHS transform method for fusing high-resolution satellite images. ISPRS J. Photogramm. 2007, 61, 381–392. [Google Scholar] [CrossRef]
- Pal, S.K.; Majumdar, T.J.; Bhattacharya, A.K. ERS-2 SAR and IRS-1C LISS III data fusion: A PCA approach to improve remote sensing based geological interpretation. ISPRS J. Photogramm. 2007, 61, 281–297. [Google Scholar] [CrossRef]
- Pohl, C.; Genderen, J.L. Multisensor image fusion in remote sensing: Concepts, methods and applications. Int. J. Remote Sens. 1998, 19, 823–854. [Google Scholar] [CrossRef]
- Garguet-Duport, B.; Girel, J.; Chassery, J.M.; Pautou, G. The use of multiresolution analysis and wavelets transform for merging SPOT panchromatic and multispectral image data. Photogramm. Eng. Remote Sensing 1996, 62, 1057–1066. [Google Scholar]
- Elad, M.; Feuer, A. Restoration of a single superresolution image from several blurred, noisy, and undersampled measured images. IEEE Trans. Image Process. 1997, 6, 1646–1658. [Google Scholar] [CrossRef] [PubMed]
- Laporterie, F.; Amram, O.; Flouzat, G.; Pilicht, E.; Gayt, M. Data Fusion Thanks to an Improved Morphological Pyramid Approach: Comparison Loop on Simulated Images and Application to SPOT 4 Data. In Proceedings of the IEEE 2000 International Geoscience and Remote Sensing Symposium, IGARSS 2000, Honolulu, HI, USA, 24–28 July 2000; Volume 5, pp. 2117–2119.
- Asner, G.P. Cloud cover in Landsat observations of the Brazilian Amazon. Int. J. Remote Sens. 2001, 22, 3855–3862. [Google Scholar] [CrossRef]
- Ju, J.; Roy, D.P. The availability of cloud-free Landsat ETM+ data over the conterminous United States and globally. Remote Sens. Environ. 2008, 112, 1196–1211. [Google Scholar] [CrossRef]
- Justice, C.O.; Vermote, E.F.; Townshend, J.R.G.; Defries, R.; Roy, D.P.; Hall, D.K.; Salomonson, V.V.; Privette, J.L.; Riggs, G.; Strahler, A.; et al. The moderate resolution imaging spectroradiometer (MODIS): Land remote sensing for global change research. IEEE Trans. Geosci. Remote Sens. 1998, 36, 1228–1249. [Google Scholar] [CrossRef]
- Vermote, E.F.; El Saleous, N.Z.; Justice, C.O. Atmospheric correction of MODIS data in the visible to middle infrared: First results. Remote Sens. Environ. 2002, 83, 97–111. [Google Scholar] [CrossRef]
- Vermote, E.F.; Tanre, D.; Deuze, J.L.; Herman, M.; Morcrette, J.J. Second simulation of the satellite signal in the solar spectrum, 6S: An overview. IEEE Trans. Geosci. Remote Sens. 1997, 35, 675–686. [Google Scholar] [CrossRef]
- Blanc, P.; Wald, L.; Ranchin, T. Importance and Effect of Coregistration Quality in an Example of ‘Pixel to Pixel’ Fusion Process. In Proceedings of the 2nd Conference Fusion Earth Data: Merging Point Measurements, Raster Maps and Remotely Sensed Images, Sophia, Antipolis, France, 28–30 January 1998; pp. 67–73.
- Thomas, C.; Ranchin, T.; Wald, L.; Chanussot, J. Synthesis of multispectral images to high spatial resolution: A critical review of fusion methods based on remote sensing physics. IEEE Trans. Geosci. Remote Sens. 2008, 46, 1301–1312. [Google Scholar] [CrossRef] [Green Version]
- Wolfe, R.E.; Roy, D.P.; Vermote, E. MODIS land data storage, gridding and compositing methodology: Level 2 grid. IEEE Trans. Geosci. Remote Sens. 1998, 36, 1324–1338. [Google Scholar] [CrossRef]
- Camara, G.; Souza, R.C.M.; Freitas, U.M.; Garrido, J. SPRING: Integrating remote sensing and GIS by object-oriented data modeling. Comput. Graph. 1996, 20, 395–403. [Google Scholar] [CrossRef]
- Efron, B. The Jackknife, the Bootstrap, and Other Resampling Plans; Society of Industrial and Applied Mathematics CBMS-NSF: Philadelphia, PA, USA, 1982. [Google Scholar]
- Shimabukuro, Y.E.; Smith, J.A. The least-squares mixing models to generate fraction images derived from remote sensing multispectral data. IEEE Trans. Geosci. Remote Sens. 1991, 29, 16–20. [Google Scholar] [CrossRef]
- Congalton, R.G.; Mead, R.A. A review of three discrete multivariate analysis techniques used in assessing the accuracy of remotely sensed data from error matrices. IEEE Trans. Geosci. Remote Sens. 1986, 24, 169–174. [Google Scholar] [CrossRef]
- Congalton, R.G.; Green, K. Assessing the Accuracy of Remotely Sensed Data: Principles and Practics; CRC Press: New York, NY, USA, 1998. [Google Scholar]
- Smits, P.C.; Dellepiane, S.G.; Schowengerdt, R.A. Quality assessment of image classification algorithms for land-cover mapping: A review and a proposal for a cost based approach. Int. J. Remote Sens. 1999, 20, 1461–1486. [Google Scholar] [CrossRef]
© 2011 by the authors; licensee MDPI, Basel, Switzerland. This article is an open access article distributed under the terms and conditions of the Creative Commons Attribution license (http://creativecommons.org/licenses/by/3.0/).
Share and Cite
Arai, E.; Shimabukuro, Y.E.; Pereira, G.; Vijaykumar, N.L. A Multi-Resolution Multi-Temporal Technique for Detecting and Mapping Deforestation in the Brazilian Amazon Rainforest. Remote Sens. 2011, 3, 1943-1956. https://doi.org/10.3390/rs3091943
Arai E, Shimabukuro YE, Pereira G, Vijaykumar NL. A Multi-Resolution Multi-Temporal Technique for Detecting and Mapping Deforestation in the Brazilian Amazon Rainforest. Remote Sensing. 2011; 3(9):1943-1956. https://doi.org/10.3390/rs3091943
Chicago/Turabian StyleArai, Egídio, Yosio E. Shimabukuro, Gabriel Pereira, and Nandamudi L. Vijaykumar. 2011. "A Multi-Resolution Multi-Temporal Technique for Detecting and Mapping Deforestation in the Brazilian Amazon Rainforest" Remote Sensing 3, no. 9: 1943-1956. https://doi.org/10.3390/rs3091943