Unmanned Aerial Vehicle (UAV) for Monitoring Soil Erosion in Morocco

1
Remote Sensing & GIS Research Group, Department of Physical Geography, Goethe University Frankfurt am Main, D-60438 Frankfurt am Main, Germany
2
Department of Physical Geography, University of Trier, D-54286 Trier, Germany
*
Author to whom correspondence should be addressed.
Remote Sens. 2012, 4(11), 3390-3416; https://doi.org/10.3390/rs4113390
Submission received: 30 August 2012
/
Revised: 16 October 2012
/
Accepted: 17 October 2012
/
Published: 7 November 2012
(This article belongs to the Special Issue Unmanned Aerial Vehicles (UAVs) based Remote Sensing)
Abstract
:This article presents an environmental remote sensing application using a UAV that is specifically aimed at reducing the data gap between field scale and satellite scale in soil erosion monitoring in Morocco. A fixed-wing aircraft type Sirius I (MAVinci, Germany) equipped with a digital system camera (Panasonic) is employed. UAV surveys are conducted over different study sites with varying extents and flying heights in order to provide both very high resolution site-specific data and lower-resolution overviews, thus fully exploiting the large potential of the chosen UAV for multi-scale mapping purposes. Depending on the scale and area coverage, two different approaches for georeferencing are used, based on high-precision GCPs or the UAV’s log file with exterior orientation values respectively. The photogrammetric image processing enables the creation of Digital Terrain Models (DTMs) and ortho-image mosaics with very high resolution on a sub-decimetre level. The created data products were used for quantifying gully and badland erosion in 2D and 3D as well as for the analysis of the surrounding areas and landscape development for larger extents.
1. Introduction
Small-format aerial photography (SFAP) acquired by Unmanned Aerial Vehicles (UAVs) is gaining approval and usage for a wide range of natural resources management applications and geospatial research. Although the military has used UAVs for decades, their availability for scientific and other public purposes is quite modern. In a recent publication, Watts et al.[1] give a detailed disquisition on the chronological development of Unmanned Aircraft Systems (UAS) as well as on their use. The scope of the paper is limited to remote sensing and scientific research.
The (scientific) environmental sector in particular increasingly takes advantage of the application of UAVs. For example, applications of UAVs and UAS for environmental remote sensing purposes are the focus of two special issues published in 2011. The special issue “Small-Scale Unmanned Aerial Systems for Environmental Remote Sensing” published in GIScience and Remote Sensing in March 2011 presents several recent approaches. The editorial introduction by Hardin and Jensen [2] gives a valuable overview of the topics covered: ground cover mapping [3], rapid aerial terrain mapping [4], multi-scale analysis combining UAS and satellite imagery [5], two sensor-based experiments [6,7] and finally the challenges and opportunities associated with small-scale UAS [2].
The special issue “Unmanned Airborne Systems (UAS) for Remote Sensing Applications” published in Geocarto International also in March 2011 presents numerous approaches of wildfire detection and mapping [8]. Almost all of these projects involve cooperation with the NASA and are therefore located in the United States. In addition to wildfire mapping, the paper authored by Cress et al.[9] deals with applying UAS for projects of the US Geological Survey, and Laliberte et al.[10] present their analysis on UAS missions for rangeland applications. The latter article emphasizes the high potential of very high-resolution remote sensing products obtained from UAS and the resulting high accuracy of the products. A detailed workflow on the image processing of the acquired optical aerial photography is given, including adjustment of exterior orientation parameters, orthorectification and mosaicking [10] (p. 145).
The recent special issue on ‘Unmanned Aerial Vehicles (UAVs) based Remote Sensing’, of which this paper is a part, covers a broad range of applications and topics. Towler et al.[11] present a more applied approach of terrain and radiation mapping in post-disaster environments, using a self-developed autonomous helicopter. Laliberte et al.[12] describe multispectral UAV-based remote sensing for rangeland environments including image processing workflows. A sensor-focused approach is presented Kelcey & Lucieer [13]. A method to detect and track moving objects from UAVs is presented by Rodrigúez-Canosa et al.[14]. The diversity of the contributions in these special issues clearly shows the increasing importance of UAVs or UASs respectively for environmental remote sensing purposes. This importance can also be observed in cultural heritage and archaeological sciences (e.g., [15–17]). Monitoring purposes with UAV-based data [18] and habitat mapping approaches from aerial orthoimages [19] have also been realized. The growing number of UAV case-study publications is accompanied by an increase of studies which focus on the technical and methodological aspects of using autonomously flying, unmanned platforms. All these platforms utilize consumer-grade digital cameras. For example Rock et al.[20] explored the influence of the number of ground control points (GCPs) and flying heights for the accuracy of UAV-derived DEMs. Blaha et al.[21] as well as Li et al.[22] investigated the possibility of direct georeferencing without GCPs. Eisenbeiss and Sauerbier [23] developed an interface between UAV control software and photogrammetry software in order to ease and accelerate the processing workflow.
What are the reasons for the increase in interest and applications of UAV-based remote sensing? UAV-based remote sensing enables user-controlled image acquisition and bridges the gap in scale and resolution between ground observations and imagery acquired from conventional manned aircrafts and satellite sensors. It presents a cost-effective method that allows adapting image characteristics to the size of the observed objects, to the monitored processes, and to the speed of change within a landscape. UAV-based remote sensing yields the best possible spatial and temporal resolutions for the respective research question or application [10,24,25].
The Remote Sensing & GIS Research Group at Frankfurt University’s Institute of Physical Geography has long-time experience with SFAP, developing high-resolution remote sensing systems and analysis workflows. From 1995 onwards, the research project EPRODESERT (Evaluation of Processes Leading to Land Degradation and Desertification under Extensified Farming Systems in North-East Spain) used a hot-air blimp for low-altitude aerial photographic monitoring [26,27]. Then, in the early 2000s, gully monitoring using kite aerial photography in Sahelian landscapes was performed [28], and both types of platforms continued to be used in further investigations in Spain [29].
The work of the research group focuses on the application of UAV remote sensing and the use of SFAP for mapping and monitoring gully development. Gullies represent an important phenomenon of soil erosion and have a high impact on land degradation especially in semi-arid regions. Both their distribution and the various factors and processes involved continue to be subject to geomorphological research. Several remote sensing studies have presented mapping approaches for local to regional scale using high to medium resolution satellite data, e.g., [30,31]. However, measuring, monitoring and understanding gully erosion on a detailed site scale presents methodological difficulties. Gully erosion occurs at different spatial scales with temporal variability. The measurement precision and repetition rate attainable with conventional airphotos or satellite imagery are not able to correspond with the process magnitudes and dynamics that are required for recording and investigating the short-term spatial and temporal variability of gully retreat ([24], p. 194). Here, UAV-based SFAP has proved to be a valuable tool for high-resolution mapping and monitoring. This holds true for 2D and 3D analysis [29,32].
The aim of this paper is to describe the application of a fixed-wing aircraft type Sirius I (MAVinci, Germany) equipped with an optical digital system camera (Panasonic). Furthermore the paper presents the results of gully mapping within the ongoing international research project AGASouss (Assessment of gully erosion in agro-industrial landscapes of the Souss Basin (Morocco)), which is a cooperation among the Universities of Frankfurt, Trier and Agadir (see d’Oleire-Oltmanns et al.[33]). The research project focuses on the mapping of gully systems and badlands in the region of Taroudant with UAV-based remote sensing (see below). Further components of the AGASouss project’s methodological approach are field mapping, experimental measurements and satellite remote sensing. The main objectives of the UAV surveys are (a) very high resolution monitoring of the investigated gullies (site-scale) with optical remote sensing data, (b) the detailed analysis of the gully site surroundings (land use, vegetation patterns, local catchment areas, etc.) using lower-scale overview surveys (local to regional scale), and (c) the creation of detailed digital maps and elevation models for the quantification of gully area and volume as well as their change from time series analysis. Located between data collected from direct field measurement and satellite-based data, the SFAP data closes a scale gap. The scale of field data provides direct contact to the object of interest and potentially unlimited resolution. The scale of satellite-based data provides spatially continuous, permanent documentation of a momentary state of the landscape at lower resolution. Within this scale gap exists high potential for UAV-based data acquisition and analysis on different intermediate scale levels. The very high image resolution as well as the photogrammetric potential of SFAP data enables a broad range of applications with a much higher degree of detail than satellite data and higher efficiency and spatial completeness than traditional field work. The main prerequisite for the design of the UAV survey approach was to meet varying requirements of scale, resolution and accuracy.
As a further objective of the research project, information from the SFAPs is further included in the development of a combined and iterative classification approach using object-based image analysis applied on satellite image level. The aim of this approach is to classify gullies on a larger spatial extent. One example for using SFAP data within an object-based approach for landform mapping is given in d’Oleire-Oltmanns et al.[34].
2. Study Area
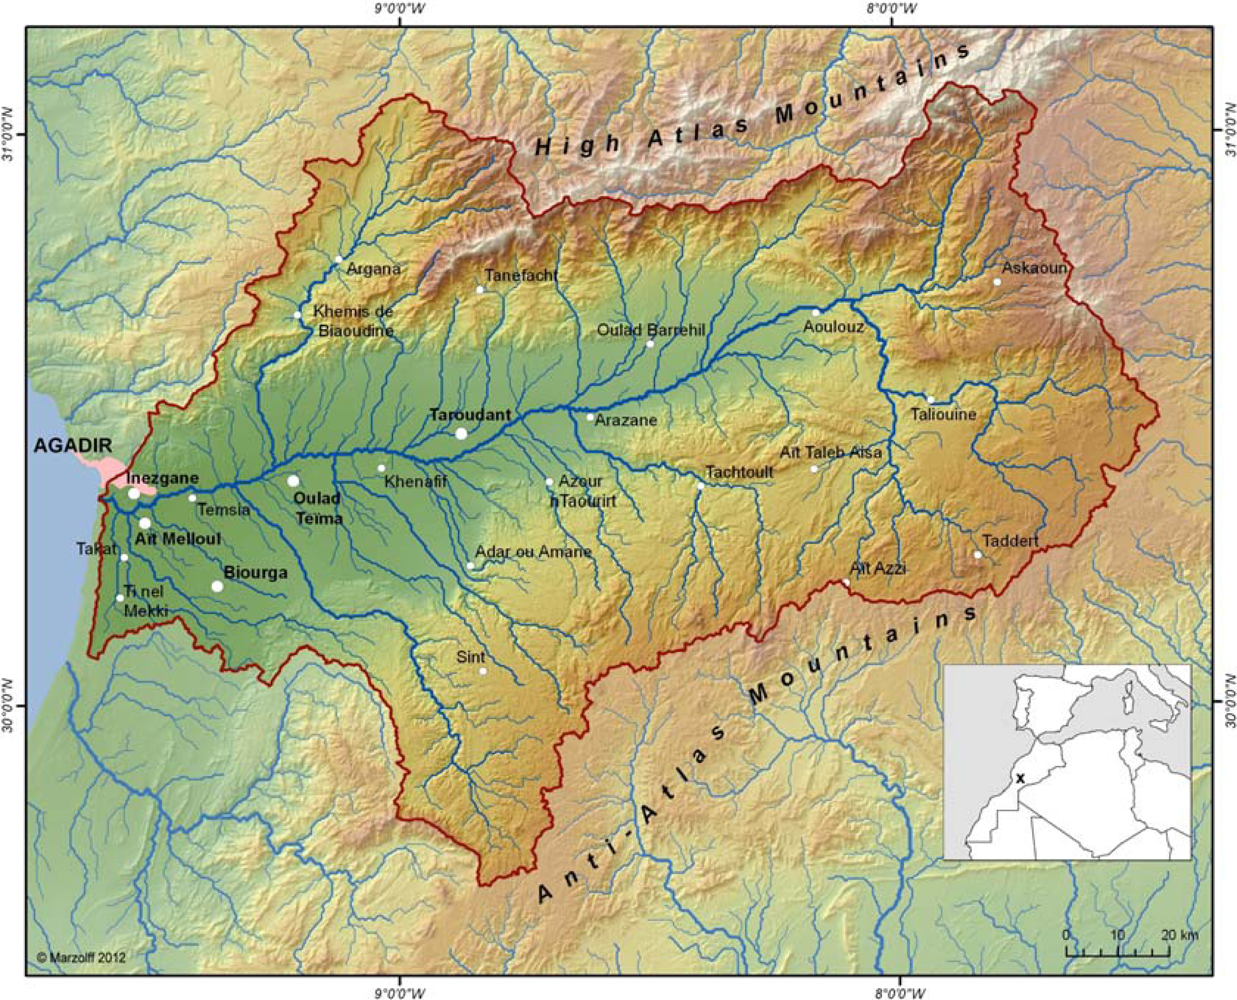
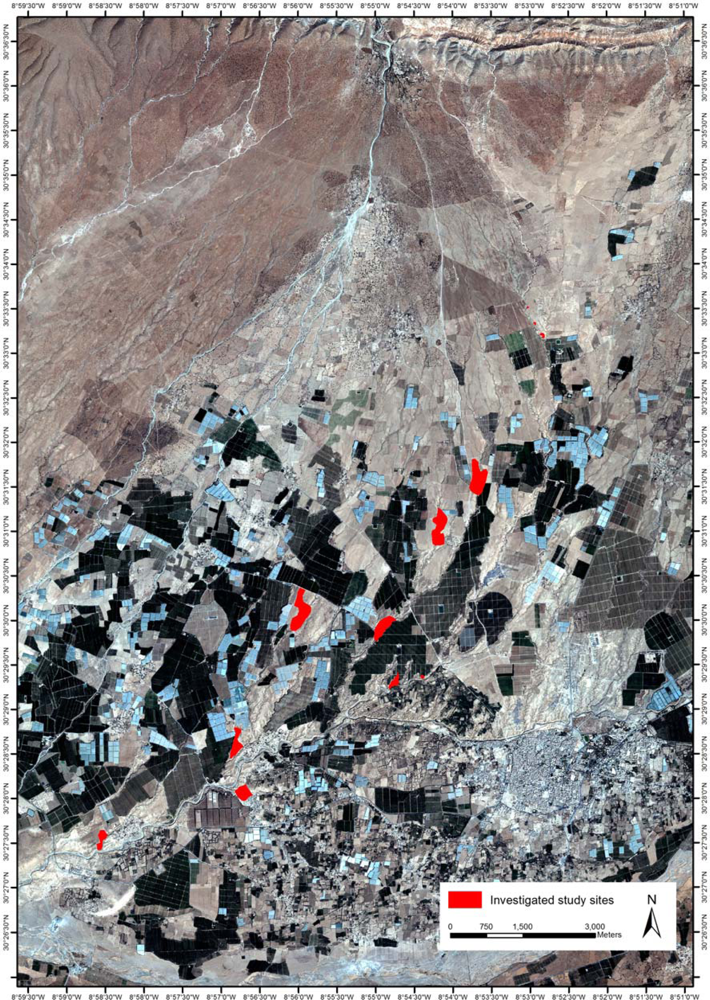
The area surrounding the city of Taroudant, Souss-Massa-Drâa, Morocco was chosen as the study area (see Figures 1 and 2). The Souss Basin is situated in the semi-arid southern part of Morocco, framed by the mountainous regions of the High Atlas (North) and the Anti-Atlas (South). It stretches over a length of about 150 km from its upper reaches in the East to the Atlantic coast and the city of Agadir to the West. The catchment area encompasses some 16,000 km2[33,35].
The large sedimentary fans originating in the High Atlas region provide the largest and most important land resource for the agro-industrial production of citrus fruit and vegetables in the Souss (fruit-tree plantations and irrigated greenhouses). This makes the area one of the most intensive and dynamic agricultural regions of Morocco. Apart from the domestic market, the main target market of the agrarian products is the European Union. The intensive agricultural production is accompanied by increasing labor migration. This migration is characterized by highly speculative and capital-intensive structures on the one side and an extensive consumption of the ground water in the valley’s aquifer on the other [36]. Thus, the already fragile and vulnerable natural environment is subject to numerous threats to environmental, social and economic sustainability, particularly with respect to water scarcity, the impacts of climate change and globalization processes [35].
In their distal part, particularly in the Taroudant area, the sedimentary fans are heavily dissected by gully erosion [37]. In some parts, the resulting badland areas reach deep between the modern fruit tree plantations and irrigation areas. Today, these badland areas are being restored to cultivated land in order to increase the productive area Utilizing bulldozing and land-leveling as common measures. The required machinery is easily available from road construction works. In the direct vicinity of existing villages, badland areas are also leveled to create seemingly suitable building ground. High demand exists due to the immigration of laborers from the rural areas. This migration is associated with the land use intensification. Due to land leveling the drainage systems and incision networks of the gullies—some of them highly active–are cut off and infilled with unconsolidated material. These superficially compacted surfaces are particularly runoff-productive and prone to soil erosion. New gullies develop that endanger and destroy the newly created agro-infrastructure or even buildings. Some of these gullies re-excavate the old, buried systems, while many new ones develop along the linear patterns that were created by the bulldozing process.
3. Methods
The choice of possible unmanned platforms for low-altitude Earth observation is huge and continues to grow. It is difficult to generalize advantages or disadvantages for particular platforms, because possible applications and working conditions vary greatly around the world. Manually navigated tethered systems such as kites and blimps are ideal for the precise coverage of small sites that require only a few images. These systems however, are hardly useful for systematic surveys of larger areas, where regular overlaps along evenly-spaced flight lines are preferable for an efficient processing workflow. GPS (global positioning system) and INS (inertial navigation system) technologies are two examples of recent developments in UAV technology. These developments have led to the availability of a range of autopiloted systems such as planes, drones, multicopters, etc. that can autonomously follow prescribed flight lines.
3.1. UAV Specifications
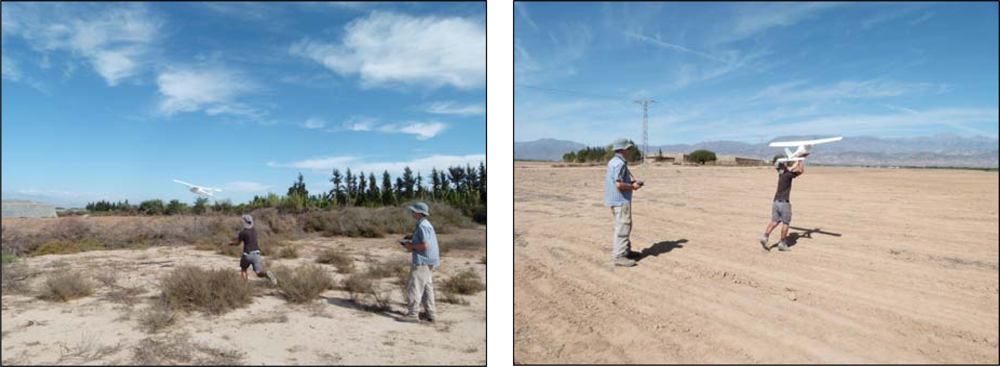
For this study, a fixed-wing aircraft type Sirius I (MAVinci, Germany) is employed (see Figure 3). It is equipped with a digital system camera (Panasonic Lumix GF1). The battery-powered system is based on a model airplane made from Elapor. It has a wingspan of 163 cm and a length of 120 cm; its weight is approx. 2.3 kg without payload. At a ground speed of 45–85 km/h the flight time with 550 g payload and one battery is up to 40 min. The plane is hand-launched, no runway or catapult is required (see Figure 3). During take-off and flight, the UAV is controlled completely autonomously by the MAVinci Autopilot and its GPS/IMU components. The UAV follows predefined flight paths computed by the flight-planning software (see Section 3.3). After completing the flight plan the UAV returns to the starting point and remains rotary in a predefined altitude. The starting point sets also the center for the so-called bounding box. This is a circular unit with a diameter of 200 m (see Section 3.3). The bounding box limits the maximum distance between the UAV and the starting point while the pilot is using the assisted flying mode (see below). Whenever the UAV hits the limit of the bounding box it automatically turns to remain within its given extent. Therefore it is an important safety aspect.
The system also features a half-autonomous mode, the so-called assisted flying mode. In this mode, the pilot is permanently supported by the autopilot software during UAV control: Height loss while flying turns or destabilization due to wind is corrected automatically. Turn radii are limited within the software to avoid material stress which might cause UAV damage. Furthermore, steering is simplified: software-controlled interaction of yaw rudder and roll-aileron enable the pilot to directly turn the UAV left or right. Limits for maximum values of pitch and roll angles are set within the software. This assisted flying mode enables the pilot to safely steer and land the plane while confining the navigation area to a predefined range. This is highly useful for difficult terrain, where fully-autonomous landing may not be possible. It also increases the flexibility during the survey, since the pilot may cover extra targets not previously included in flight-planning. However, the assisted flying mode does not relieve the pilot of his or her responsibility. The pilot must be able to safely steer and land the plane. Therefore passing the training courses offered by MAVinci prior to independent surveys is indispensable.
As the optical onboard sensor, a 12 MP digital interchangeable lens system camera is installed (Panasonic Lumix GF1 with 20 mm Pancake lens). The mirror-less Micro Four-Thirds camera with SLR-comparable quality is much smaller (12 cm × 7 cm × 6 mm incl. lens) and lighter (450 g) than traditional single-lens reflex cameras. These properties make it highly suitable for unmanned platforms. This camera features several characteristics important for the photogrammetric analysis of the images (cf.[24], pp. 78–80): single focal length, comparatively large image sensor, lossless RAW file format and lack of image stabilizer. The camera is completely concealed in the body of the plane. It points vertically to the ground through an opening in the plane bottom. The camera exposure is triggered by the on-board computer in the regular intervals computed by the flight-planning software. Thus, a continuous image series is taken during the survey.
Generally, the flight-plans are designed as parallel flight lines in order to achieve regular along-line stereoscopic overlap. At the end of each line the roll of the UAV may reach large angles up to 60°, where the image axis is off-nadir. Due to this, a rather large overshoot must be taken into account––this always results in a considerably larger area covered by the flight plan than the actual image acquisition area. Large amounts of oblique images at the flight-line ends are avoided due to restricted triggering control. Maximum pitch angles (e.g., 10° off-nadir) are set within the flight-planning software.
3.2. Ground Control
For all applications that involve measuring and mapping, georeferencing and geometric correction of the images is imperative [38,39]. However, a highly exact geometric correction requires time, effort, a digital elevation model, and excellent ground control. Many UAV applications may not really require such efforts, and depending on the image and relief characteristics, simpler solutions might be quite sufficient ([24], p. 160). For this study, the requirements regarding geometric accuracy also vary, ranging from very precise for exact gully edge delineation and 3D modeling to less ambitious for overview image mosaics.
There are two possibilities for reconstructing the location of an image within a given ground coordinate system. The first possibility uses GCPs. These are features that appear on the photographs and whose locations in a reference system are known. The second possibility determines the exterior orientation–position (X, Y, Z) and rotations (yaw, pitch and roll of the platform or κ, ϕ and ω of the image)—of the images during the flight. Although the latter is accomplished by most autonomous UAV systems–including the autopilot system of the Sirius I UAV—the recorded data are not precise enough compared to the image scales and resolution to enable direct georeferencing. However, as shown below, they may be used as initial values for approximate orientation of larger UAV flying heights. Likewise, GCP collection methods typical for satellite remote sensing or conventional aerial photography—map reference points or GPS data of existing features such as road junctions, field corners, and individual trees—do not yield coordinates precise enough for the rectification of images with centimeter ground sample distance (GSD). Thus, GCPs for high-precision UAV applications are usually pre-marked artificial features whose coordinates have to be determined in the field using total stations or differential global positioning systems (DGPS), providing a measurement precision of ±10 mm.
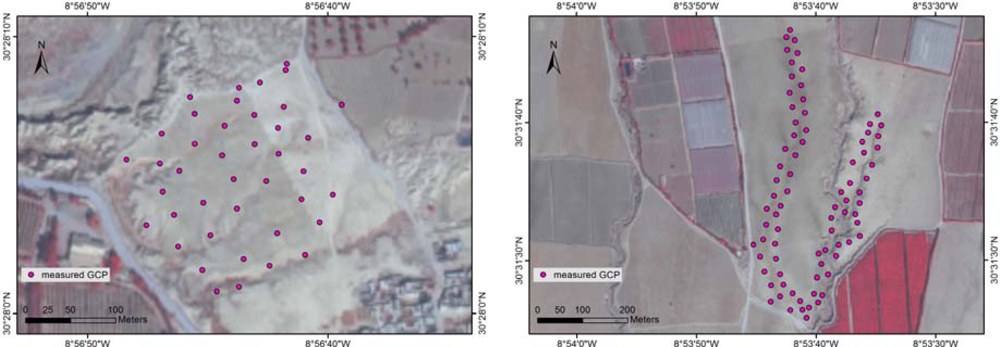
In our study, 20–80 GCPs were installed prior to the survey in each study site by driving short pieces of a metal pole into the ground. The GCPs were distributed on the surface around the gully as well as within the gully (where possible) in order to cover the varying terrain heights. They were then marked with target signals composed of 30 × 30 cm red cardboard squares, and additionally fitted with a CD labeled with a black-and-white bullseye design (Figure 4). This setup has proven to yield optimal visibility in the digital imagery at various scales. All GCP coordinates were measured with a total station using a self-defined local coordinate system since official survey points enabling the connection to the national reference system or a DGPS were not available. The precision of the total station measurements was estimated to approx. 0.5 cm for x/y and 1 cm for z. However, the GCPs are additionally measured with a standard GPS unit, so the local coordinate system may be transposed into the national reference system later.
The time required for the installation of the GCPs varies depending on the number of GCPs. A small number of around 20–25 GCPs were installed and measured within around 2–4 h. Installing and measuring a very large number of 80 GCPs takes around 7–8 h and therefore reaches the limit of the possible number of GCPs to be distributed and measured per day.
In Figure 5 two distribution patterns of GCPs are shown. Each GCP is represented as one circle. The left image illustrates a smaller rectangular area with 41 GCPs. The right image illustrates a long narrow gully system on a crop field with 80 GCPs distributed.
Most study sites are agricultural fields, pasture land or wasteland directly adjoining settlements. Hence, it is not possible to install all GCPs permanently because the metal poles will be dug out by the farmers, shepherds or local children. Some permanent reference points were installed and measured at all gully sites. These reference points were hidden under bushes or permanent features such as concrete bases of utility poles were used. This enables us to re-establish the same local coordinate systems for repeat surveys.
3.3. Image Acquisition Survey
The study sites that are monitored within the AGASouss project range from individual gullies to badland areas including the surrounding settlements, plantations and greenhouses. The required image scales and resolutions vary depending on the processes observed. Detailed changes of gully edges by headcut retreat, infilling of badlands by bulldozing, construction of new greenhouses, are examples for different processes. In order to take into account the different site extents and observation scales, different flight plan designs are employed for image acquisition.
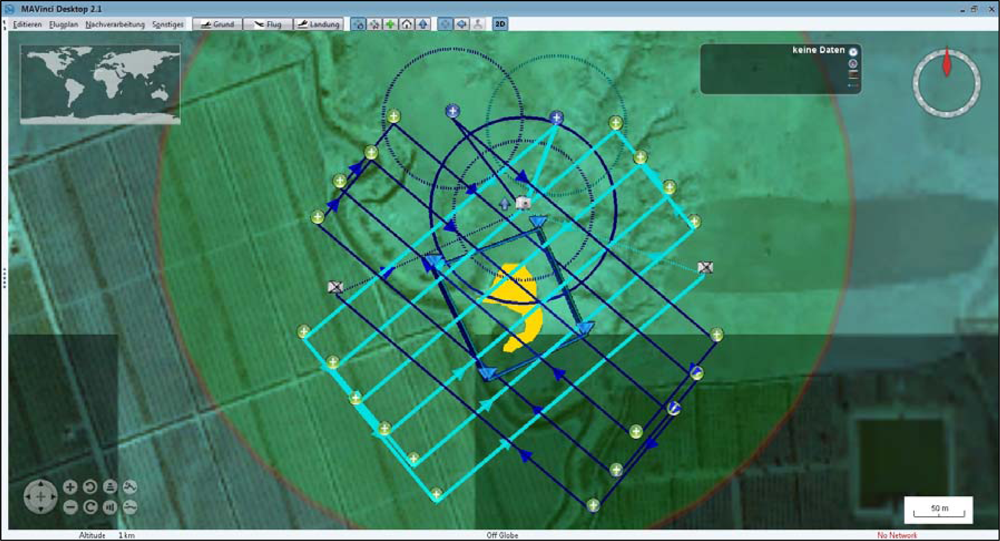
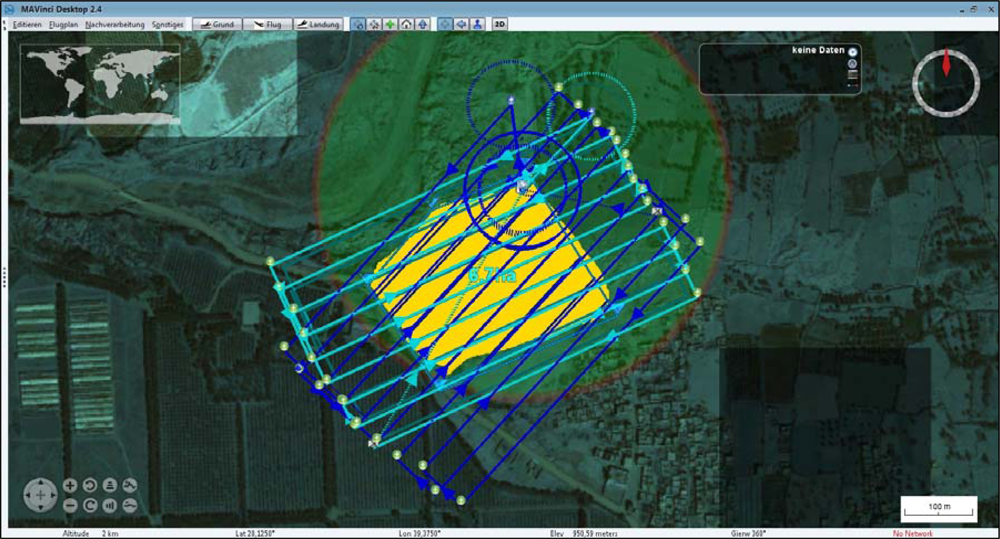
Contrary to other unmanned platforms that belong to the hovering type, such as kites, blimps or copters, a plane is constantly moving. That fact makes it difficult to hit a small target area precisely. Rather than flying regularly spaced parallel flight lines, it is advisable to design a flight plan that crosses the same spot as often as possible. This increases the number of images covering the target with varying overlaps. One designed flight plan was duplicated and its orientation was rotated against the orientation of the first flight plan. As a result, the number of flight lines that cross the target area directly is doubled. Below, in Figure 6 a small target area is illustrated: The selected study site HAM3 (yellow polygon) has an extent of about 0.5 ha. The two flight plans with 85 m flying height cover a much larger area, as the overshoot zone must be taken into account. In this overshoot zone, only oblique images were acquired during the UAV turns. The flight lines are very closely spaced, resulting in a 60% sidelap. Taking into account the minimum turn radius of the UAV and its average speed, this case represents almost the lower survey limit. In Figure 7 the medium-sized study site HOU with an extent of about 3.0 ha is shown. The corresponding flight plan covers an area of 6.7 ha from 85 m flying height. Figure 8 shows the large study site LAS with an extent of about 200 ha. The summed length of the individual flight lines is 26.5 km. The survey flight took place at 500 m above ground. Note how the overshoot area—the difference between the actual study area and the area covered by the flight plans—decreases with larger study areas.
Since the extents of the different study sites vary, not only the area to be covered changes but also the required flying height above ground. For small to medium extents a high level of detail in the acquired SFAPs is usually desired. Thus, consequently a lower flying height above ground is required. For larger and vast extents an increase of the flying height is necessary. That means, however, a reduction of detail in the images. If the flying height were set too low for a large area the total number of acquired SFAP would increase enormously. Furthermore the processing of a very large number of SFAPs would require a huge amount of time. Therefore the desired outcomes have to be considered very carefully in advance.
Table 1 contains the different values, such as flying height, extent, and more, for the three study sites shown above as well as for study sites presented in the following. In addition these values demonstrate the mapping capability of the chosen fixed-wing aircraft.
Most study sites in our project are covered with at least two survey scales—a detailed, high-resolution survey of the individual gullies, which enables precise measurements of gully areas, volumes and change, and an overview survey including the surrounding area, which allows the interpretation of gully development in its spatial context. Precise ground control as described in Section 3.2 may, however, not be established for the large areas, and other ways of georeferencing this imagery had to be found.
3.4. Image Processing
Depending on the survey scale and the presence of high-precision GCPs, two different workflows were used. Both workflows are photogrammetry-based and allow the creation of Digital Terrain Models (DTMs) and ortho-image mosaics after creating photogrammetric image blocks by bundle-block triangulation. The main difference between the two workflows is that SFAPs derived from surveys at lower flying heights are processed using high-precision GCPs installed and measured in the field. In contrast, for SFAPs acquired at large flying heights the exterior orientation values are taken from the log-files recorded during the survey flight for initial direct georeferencing of the images. The log files contain values for different angles (κ, ϕ and ω) and a GPS value for the center of each image. During image processing, the values for image orientation are refined in iterative triangulation calculations. In addition, for image orientation camera calibration parameters are used. These parameters were derived from self-calibration using a well-suited study site.
The preparation in advance to SFAP processing using either one of the two workflows is applied likewise. First, all SFAPs acquired during surveying flying are screened and well-suited SFAPs with stereoscopic overlap are selected for further processing. Taking the information saved in the log files enables visualization of image distribution and location using GIS software. Selecting well-suited SFAPs for further processing can then be done in a much faster manner using an attribute-based selection of points, e.g., by excluding images exceeding a certain threshold for maximum deviance from a nadir position during image acquisition or images with deviating flying height (taken during the staring and landing phase).
The original file format is RAW which requires transformation to TIFF format during which modest image enhancement regarding contrast, saturation and brightness is applied. All further processing of transformed image data is done using Leica Photogrammetry Suite© (LPS).
The first workflow uses existing GCP values. Image data as well as measured GCP coordinate values were imported into a photogrammetric block file in order to enable geometric referencing and stereo-model creation by bundle block triangulation. Subsequently, every single coordinate value (X/Y/Z) was assigned to the corresponding GCP on all SFAPs (see Figure 9).
At least 3 GCPs per SFAP or 6 tie points are necessary for triangulation. Following the manual assignment of GCPs and minimum required tie points, a large number of additional tie points are automatically generated for increased robustness of the created image block. Figure 10 shows the distribution of GCPs as well as the corresponding residual vectors appearing in an unsystematic order. The residual vectors are illustrated as blue lines and scaled by a factor of 200,000 for better visibility. The images are illustrated as grey rectangles.
The triangulation process calculates values for the root mean square error (RMSE) of the orientation for the whole image block, as well as for the GCPs. This is an iterative process which requires refinement, e.g., elimination of blunder tie points–until satisfying error values are reached depending on the necessary accuracy of the resulting product. All triangulation was performed with fixed interior orientation (as the camera was self-calibrated shortly before; see Table 2), slight tolerances for image point (0.33 pixels standard deviation) and a tolerance of 0.5 cm (X/Y) and 1 cm (Z) standard deviation for the GCPs. This reflects the estimated positioning and measuring accuracy of the image point and GCP coordinate positions. These slight tolerances allow them to fluctuate within the range of these values during the bundle adjustment.
Successful triangulation of the whole image block is the prerequisite for further analysis: Due to the stereoscopic overlap of the images, the extraction of Digital Terrain Models (DTMs) with very high resolution is possible. Using the SFAPs as input data, the resulting DTMs have a very high resolution which also means that large computing power is necessary for data processing. In order to keep the processing time low, not all SFAPs were processed. Image pairs with a well-suited overlap of the study area were selected. The terrain extraction was then carried out with standard settings in order to create single DTMs, which were finally mosaiced (see Figure 11). Using this DTM, ortho-image mosaics with very high resolution were calculated (see Figure 12).
A second workflow is used for those SFAPs which were acquired at larger flying heights for large areas. GCPs were not installed and measured. In this case, the information for image orientation is derived from the log files which are recorded during the survey by the MAVinci software. The log files contain—among other information—the measured X/Y/Z GPS position for each image acquired as well as the information on tilt of the image axes (κ, ϕ and ω). This information was used as initial values of exterior orientation for the images in the photogrammetric block file. The accuracy of these values is unknown. It is dependent on the measurement accuracy and precision of the GPS and IMU units, and the alignment of the camera with respect to the IMU coordinate system. Moreover, there may possibly occur a time-lag between triggering command and actual triggering of the camera that may influence the accuracy These values can therefore be expected to deviate up to several meters and degrees from the actual values.
The triangulation process in LPS requires a minimum amount of GCPs. X/Y/Z coordinates for well-defined points such as street-kerb corners, small bushes or similar were taken from a Quickbird satellite scene (cf.Figure 2) and an SRTM elevation model to fulfill this software requirement. The measured coordinates were then assigned to each corresponding SFAP image point in the block file. The triangulation was subsequently processed–with accordingly higher tolerances of 0.5 m for the GCPs—and also allowed the generation of DTMs by automatic terrain extraction as well as creating ortho-image mosaics.
3.5. GIS Analysis of Gully Volume Change
Monitoring the gully volume change is accomplished using the generated DTMs from the SFAP data. Interestingly, there are two different directions of volume change present in the study area: on the one hand, continuing erosion occurs and leads to a negative volume change, whereas, on the other hand, infilling of the gullies and badlands by land-leveling measures leads to a positive volume change. The general approach for calculating the gully volume change is to subtract the DTMs created for two different points in time. In order to quantify the starting volume of a gully for the first monitoring date, it is necessary to reconstruct the (potential) original former surface prior to erosion by creating some kind of 3D cover plate.
Generation of this so-called cover plate was done by firstly digitizing the gully edge in 3D using stereoscopic glasses. Secondly, the resulting 3D-polyline was used for generating a 3D-polygon. Finally, a TIN surface model was created from this polygon and converted to raster format. This resulted in a DTM with approximate height values of the gully system as it was prior to the incision. The height difference between this raster and the gully DTM was calculated for each raster cell. These values were then multiplied with the raster resolution and summed up in order to receive a value for the gully volume.
3.6. Accuracy Assessment
The accuracy of the UAV-derived data mainly depends on two aspects: the accuracy of the photogrammetric restitution based in the bundle-block triangulation, and the accuracy of DEM extraction. Both could only be independently assessed by using precise ground truth data, preferably as spatially continuous elevation data or at least a substantial number of check points [38]. However, due to the very high resolution of the UAV data, there is no spatially continuous reference data available for the chosen study area that would provide sufficient accuracy and precision. The lack of reference data at this level of data resolution is a common issue in UAV studies and also described by Harwin and Lucieer ([40], p. 1584). Although the use of check points—distributed and measured with the GCPs—is a reasonable alternative, this approach requires substantial additional time and effort during the field survey. Ultimately this approach is considered as not viable for most cases ([40], p. 1585).
For the case study of GLA1 presented below, we have refrained from distributing additional check points for the named reasons. Instead, the residual errors of the triangulation were computed, which allows to estimate the quality of the photogrammetric restitution and compare them to accuracies achieved in a similar study. In order to minimize errors in the photogrammetric restitution process, care was taken to maximize the precision of exterior orientation (usage of GCPs measured by total station; see Section 3.2) and interior orientation (usage of camera calibration parameters; see Section 3.4).
4. Results
4.1. DTMs and Orthoimage
During two field campaigns which took place in autumn 2010 and autumn 2011, more than 17,000 SFAPs were acquired over 13 study sites. Flying heights varied from 50 to 600 m above ground. The number of installed GCPs for ground control ranged from 12 to 80 depending on the size of the respective study site.
The generated DTM from the study site GLA1 (see Table 1 and Figure 10) is shown in Figure 11. The flying height was 70 m above ground and a total number of 31 images were processed. In Figure 10 the corresponding image mosaic is illustrated. The enlarged inset shows the structure of the gully sidewall in detail.
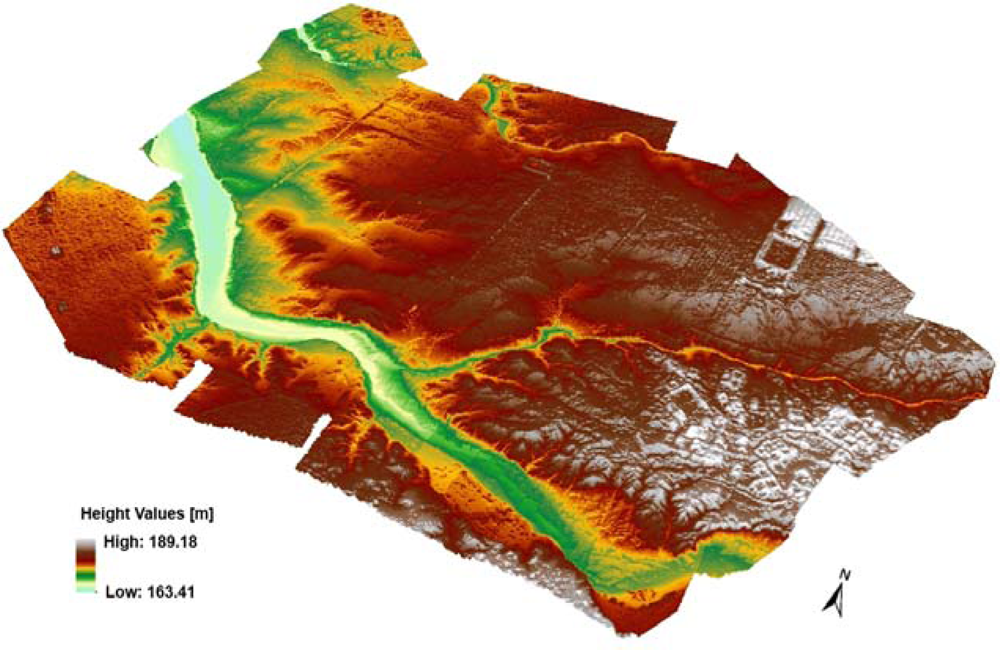
In Figure 13 the DTM is illustrated that was processed with the second workflow (described under Section 3.3). Here, the flying height was 400 m above ground. The area has an extent of about 1,000 m × 400 m. The white circle indicates the location of study site GLA1 (see Figure 11).
The results presented in Figures 11–13 illustrate the high degree of detail achievable with the chosen approach of UAV-based SFAP and subsequent analysis. Aside from the main gully, also very small lateral rills are visible over the whole extent of the mapped area (see Figure 11 inset and Figure 12). In contrast, satellite images with very high resolution such as Quickbird (see Figure 2) do not allow this degree of detail but are limited to larger elements only–such as the main gully rill–and they also lack 3D information. Available DTMs derived from satellites with stereoscopic capabilities, such as SPOT, also do not allow a detailed analysis. For instance, the resolution of a SPOT-DTM with 10 m × 10 m is too coarse and only allows the identification of the slight depression of the thalweg where the gully incises-if the main gully has already grown large enough. Airborne LIDAR data–not available in Morocco or for this project–usually yields excellent resolutions and accuracies compared to other remotely sensed terrain data, but is also limited to approx. 0.5–1 m resolution.
Regarding traditional field work, one established method of gully erosion monitoring is the manual measurement of gully profiles by y tape or total station. For quantification of erosion rates, simple geometric shapes (e.g., trapeze or cuboids) could then be calculated. Such field work would, however, significantly increase the time required for data acquisition. In addition, the degree of detail is much lower since the accuracy of manual measurement and measurement point density would be the limiting factor.
The resulting DTMs and ortho mosaics show the agriculturally used areas and their shaping by soil erosion phenomena in detail. The depression of existing erosion lines (i.e., gully erosion) is well visible. The gully volume was quantified using the generated DTM and digitized gully edge (see Section 3.5.), which delivered an approximate amount of 720 m3 of gully volume. The gully area used for quantification of the volume change has an extent of 869 m2. The elevation heights given in Figure 11 are relative to the zero level that was created while setting up the local coordinate system. The actual maximum incision depth of the gully reaches 4.25 m at the lowest point, which is the level of the wadi bottom. The incision depth decreases slowly while moving up the main gully, from the deepest point at the wadi bottom towards the more recently eroded areas (see Figures 11 and 12).
In order to be able to further interpret the values given above, the catchment area for GLA1 was created using the DTM of GLA (see Figure 13) for hydrological modeling: Flow directions for the entire DTM were calculated. Then all sinks within the DTM were filled. Setting the pour point where the gully enters the wadi enabled the calculation of the overall catchment. The size of the catchment amounts to around 3.5 ha.
4.2. Accuracy and Residual Errors
In Table 3 calculated values for the residual errors of the triangulation, as well as information on the spatial resolutions of the data is provided. The RMSE for the GCP position and the mean accuracy of the exterior orientation was calculated for the DTMs processed with the two workflows. For study site GLA1, which was processed with the field GCP workflow, the RMSE of the GCPs reaches values between 0.9 and 2.7 cm in horizontal directions. In vertical direction the error is below 1 cm. The mean accuracy of the exterior orientation ranges between 2 and 4 cm. For the whole study site GLA that was processed with the second workflow, the RMSE of the GCPs taken from the satellite data ranges between 1 and 1.7 m. The mean accuracy of the exterior orientation amounts to 0.3–0.4 m. The mean difference values between the exterior orientation values computed during triangulation and those taken from the UAV log files are only available for the GLA data set. They reflect the quality of the in-flight GPS measurements, confirming the fact that their precision is rather low and would not be sufficient for direct referencing of higher-resolution SFAP taken from lower flying heights. Finally, the resolution of each data set is given in the last column.
In a study conducted by one of the authors ([24], pp. 32–34), the accuracy of triangulation and DTM has been assessed in detail for a similar SFAP survey design. Additional GCPs were distributed as independent check points. These check points were measured with the total station in the field. Findings show that horizontal error values range between original image resolution and mean exterior orientation accuracy. Vertical errors (i.e., z-values) are about 2–3 times larger ([24], pp. 32–34). Flying height, GCP and check point signaling and measurement method and DEM extraction method correspond with those presented in this paper for the first workflow. Accordingly, findings are regarded as transferable. For the case of GLA1, we may therefore expect an accuracy of approx. 1.5–3 cm in location and 5–8 cm in height for elevation points computed by space resection from the stereo models.
4.3. Land Leveling and Soil Erosion Processes
The GLA1 gully presented here is an interesting and typical example for erosion processes occurring in this study area. Gully erosion often takes place in ancient depression lines that have temporarily been smoothed over by land-leveling measures. The gully systems as illustrated in Figures 11 and 12 may already be identified on older satellite data such as Corona military reconnaissance data, showing the state of the study area around 40 years ago.
Heavy rainfall events cause high amounts of run-off leading to sediment discharge over the entire catchment area. At the lowest point of the catchment, the water enters the adjoining wadi. This gradually causes the initial edge fraction that evolves into regressive erosion. Both aspects lead to and starting the gully growth. A more recent SPOT satellite image from 2004 (currently appearing in GoogleEarth) shows the same gully system: the main gully rills are further incised and more lateral rills building a fine dendritic system have developed. On the Quickbird satellite image from 2009 (as shown in Figure 2), the gully system has been infilled by land-leveling measures. The material from this infilled gully was probably taken out by renewed erosion after only one heavy rainfall event which occurred in February 2010. This illustrates the enormous dynamics which occur in the study area: Around 720 m3 of soil material have been eroded most probably within a single rainfall event.
The intensification of the agriculture permanently increases the pressure on available arable land. In order to gain even larger agricultural extents, landowners started to infill existing gullies and badlands throughout the region. Bulldozers were applied to shift material from the neighboring soil surface into the gullies and thus create additional arable land. These leveling measures destroy the soil surface. The material filled into the gullies does not begin to feature stable conditions as compared to naturally developed soil horizons, and the surrounding surface is often compacted by the leveling. Then, if a heavy rainfall event occurs, the erosion caused by the run-off is much higher than in a natural environment.
The ploughing rills and furrows created by the bulldozers even increase the impact of erosion processes since rainfall accumulates within these small linear depressions, which accelerates the erosion process. Next to the main gully, which has already been eroded until reaching the base level of erosion defined by the wadi bottom, small erosion rills are visible in Figure 11 indicating future locations for regressive erosion and gully development.
5. Discussion
The applied methodology for soil erosion monitoring provides a good way of reducing the existing gap between field scale and satellite scale using SFAP. The variable scale, where image acquisition may take place using the presented UAV proves the high potential of this technique. Survey flights were successful at low and large flying heights as well as for small, medium and large study site extents.
The number of 80 GCPs distributed as shown in Figure 3(right) reaches the limit of possible areas mapped with this method. Distributing and measuring 80 GCPs using the total station required more than half a day’s work. The surveying flight(s) had to take place on the same day since the GCPs cannot be left over night in the field. Illumination also has to be considered for good image results which finally limits the time slot. Another limit for data acquisition using an UAV is the extent of the area to be mapped and/or the flying height since the UAV has to be visible during the whole surveying flight.
Flight plans as shown in Section 3.3. define the possible area extents and flying heights. Flight plans with even smaller extents and flight lines that were even closer to each other were theoretically possible. However, the resulting SFAP would not fit the required value ranges concerning image quality as well as coverage (yaw, pitch and roll of the platform or κ, ϕ and ω of the image). Overall the chosen UAV appeared to be well-suited for mapping the broad range from small areas at low flying heights to large-scale coverage at large flying heights. The presented system covers all of these scopes and proves its good applicability. For a comparison of different UAVs see also Chapter 8 in Aber et al.[24] as well as Watts et al.[1].
The derived data products enable detailed 2D and 3D analysis. Change detection or landscape development analysis for larger areas is possible. The DTMs used for quantification of erosion volumes lead to tangible statements of gully growth. The high resolution and precision of the derived data products is yet missing on satellite scale level. Also other high resolution data products such as LIDAR point clouds are not yet available for large areas, such as our study area. Especially for these areas, the UAV-based monitoring provides a valuable alternative for mapping and monitoring short-term development of soil erosion and other environmental applications. A good example is given by Laliberte and Rango [41] discussing texture and scale in UAV imagery.
The first workflow (including GCP values) leads to very precise results with high-level accuracy. In order to assure this high accuracy GCPs were distributed and measured with a total station. This delivers very precise local coordinates. Total stations have an uncertainty in position of ∼1 cm and an uncertainty in elevation of ∼2 cm as analyzed by Walker and Willgoose [42]. Our own measurement precision–as estimated from repeat measurements–is somewhat higher, possibly due to shorter measurement distances. Due to a lack of spatially continuous reference data traditional accuracy assessment is not yet possible. This is also described by Harwin and Lucieer [40] (p. 1584). For the presented work, the results from a previous case study with accuracy assessment were applied. Aber et al.[24] assessed the accuracy using independent check points. The data acquisition took place in the same way as presented in this paper. Therefore, the results are considered to be transferable. The resulting accuracy values correspond well with the high level of resolution that is implied in the acquired SFAPs. This holds true for results from both workflows presented.
The presented approach allows to map and measure erosion in very high detail. Otherwise, that could only be approximated by extremely laborious and time-consuming field measurements with total stations, differential GPS or terrestrial laser scanners. However, all these systems would most probably fail to capture the complete form of such complex erosion gullies due to accessibility and visibility problems. Hence the good applicability of the chosen UAV may be seen as an advantage for time-effective data acquisition of large areas. That very is needed in several disciplines dealing with dynamic processes as stated by Eisenbeiss and Sauerbier ([23], p. 404). The extremely high resolution of the images and resulting DTMs allow the mapping of numerous spatial details. Small erosion rills or surface structure resulting from leveling and ploughing may be identified in the field. This is not possible with any other remote sensing data such as traditional aerial photographs or high resolution satellite images. As high-precision georeferencing is required, this approach involves some field work for installing and measuring the GCPs.
The results derived from the second workflow gain high potential for large-area mapping, although this workflow is less accurate because it does not use previously installed field-measured GCPs, Compared to traditional remote sensing data, these data products are still much more detailed and accurate. Their image resolution of ca. 5–10 cm is approximately one order of magnitude better than recent high-resolution images taken by WorldView or Quickbird. Larger areas may be analysed in considerable detail with such commercially available imagery. One example is our complete study area shown in Figure 2. Anyhow UAV data from flying heights of around 500 m account for the coverage of local study areas with even higher precision at user-specified times, repeat rates and lighting conditions. Thus, they may additionally provide the spatial context for yet smaller study sites which are located within the area (see Figure 13). The concept of mapping the spatial context of small study sites by acquiring overview data from high flying heights is used by Hendrickx et al. ([16], p. 2970). Nevertheless, the applied Microdrone cannot cover the same range of flying heights as the UAV presented within this paper.
One fact to be mentioned is that the flying height for images processed with the second workflow has to be set rather high. In our experience and for our UAV the flying height must not be below 250 m. Otherwise the accuracy of the initial exterior orientation values taken from the in-flight GPS logs (see Table 3) would be too low compared to the area size covered by the image. If the initial position of the image during the triangulation process is too inaccurate, no overlap with the neighboring images may be computed. Thus, no tie points and therefore no relative orientation between the images can be established. Larger image extents—acquired at higher flying heights—decrease the relative mispositioning of the images. Accordingly, this allows the necessary initial triangulation and subsequent refinement.
The quantification of gully volume changes was shown as an application for soil erosion monitoring utilizing the generated DTM with very high resolution. Gaining reproducible values, this methodology is considered to be valuable. However, the workflow is not completely independent from manual influences, such as digitizing the gully edge. In order to achieve accurate results, this part requires expert knowledge as well as precise digitized data. Since there is also some inaccuracy implied in the height values of the DTM, the presented value for the gully volume should be considered as a good estimation of the magnitude of erosion-induced change rather than a precise absolute amount. Especially small lateral rills are captured with less detail and accuracy. This is due to their deeply incised and narrow shape. Poor visibility conditions emerge therefrom and prevent complete mapping due to shadowing and low contrast (see also [43]). In addition to superficial erosion, these lateral rills are often subject to subsurface erosion processes such as piping. Quantifying these underground erosion volumes is not possible with the presented method. Still the achieved quantification values are considered to deliver a good estimation of the magnitude of erosion-induced change. Within the AGASouss project erosive processes are also analyzed by applying rainfall simulation. Rainfall events are the main cause for soil erosion in semi-arid regions [33]. Those rainfall simulation experiments were applied on different soil surfaces. Results from these rainfall simulation experiments will be published in an upcoming article. The combination of the remote sensing approach with the analysis of soil erosion processes indicates interesting and tangible results in the overall context of this topic.
Image processing that aims for results with a high level of detail is rather work-intensive and still requires future improvement. However, this required manual input may also be seen as an advantage: the user remains in a position with more control over the process ([16], p. 2973). More recent techniques may lead to further more facilitation, such as the workflows based on Structure from Motion (SfM) techniques [44]. SFAP acquisition at too low flying heights remains one problem for accurate triangulation of SFAPs. Due to high image overlaps only little stereo parallax exists. The correlation of single pixels then sometimes leads to noise in the data products which may also be identified at some places in Figure 11.
Further evaluation of image processing workflows will be an ongoing task for future work. The quantitative analysis of the derived DTMs will be continued, including further data acquired at a second point in time. This monitoring analysis will lead to insights in soil erosion development in the study area and provide the basis for future interdisciplinary analysis within the AGASouss project.
6. Conclusions
This paper has presented the application of an Unmanned Aerial Vehicle (UAV) for monitoring soil erosion in Morocco. Data acquisition at multiple scales, closing the gap between field scale and satellite image scale, was successfully performed with the chosen fixed-wing UAV. For the image analysis, two different photogrammetric workflows were applied, that cope with the very high resolution of the acquired small-format aerial photographs (SFAPs). The first workflow is applied on SFAPs that were acquired from lower flying heights (i.e., 70 m above ground). Accordingly the image resolution is very high with only a few centimeters. Precisely measured coordinate values from manually installed GCPs were used in the first workflow. This leads to very accurate triangulation values for the photogrammetric image block. The RMSE errors of the GCPs reach values between 0.009 and 0.027 m in horizontal directions. In vertical direction the error value amounts to 0.007 m. The second workflow was applied on SFAPs that were acquired from larger flying heights (i.e., 400 m above ground). The image resolution still remains below 10 cm at these flying heights. Since this aerial survey covers a very large area, no GCPs were distributed in the field. Instead, direct georeferencing using the UAV GPS log was applied for creating the image block, supported by a small number of GCPs taken from a Quickbird satellite scene and a SRTM elevation model. This method enables the creation of image blocks for large areas without manually installed GCPs. Here, accuracy values in horizontal directions reach values between 0.09 and 0.3 m. In vertical directions the accuracy values range from 0.3 to 0.8 m. After triangulating the image block, using either one of the workflows, Digital Terrain Models (DTMs) and subsequently ortho-images could be derived. The presented approach was applied at two different levels of scale. At a local scale, single study sites may be analysed in high detail. These data products allow analysis of soil erosion at a level that is comparable to direct field work due to its high resolution. As one example the quantification of the gully volume at a site near Glalcha, Taroudant, was processed. The more regional scale puts single study sites in their larger spatial context which is especially required for a profound understanding of numerous aspects that influence the whole erosion process. Both levels are located between field measurement scale and satellite scale. Therefore this approach is valuable in terms of reducing this existing scale gap. The presented mapping method extends beyond traditional SFAP acquisition by incorporating unconventionally designed flight plans. Hence, almost all kinds of different study sites may be mapped. Apart from mapping soil erosion, this approach may be used for any kind of environmental mapping purposes. It is furthermore well-applicable for repeated data acquisition.
In future work, the mapping approach will be continued to arrive at a regular monitoring. Quantification of erosion rates as well as the combination of the presented mapping approach with process analysis will be focused on. A profound understanding of the erosion processes within their spatial context may be achieved using this approach.
Acknowledgments
Funding for the research project “AGASouss-Assessment of gully erosion in agro-industrial landscapes of the Souss Basin (Morocco)” is granted by the German Research Foundation (Deutsche Forschungsgemeinschaft/DFG) under research contracts MA 2549/3 and Ri 835/5 and is gratefully acknowledged. The acquisition of the UAV system was financially supported by the Vereinigung von Freunden und Förderern der Goethe-Universität and the University of Trier.
The authors also want to thank all colleagues, students and friends participating in the field campaigns supporting successful data acquisition: Meike Düspohl, Hassan Ghafrani, Christiane Giudici, Abdellatif Hanna, Johannes König, Ahmed Mellali, Maja Nägle, Werner d’Oleire-Oltmanns (in alphabetical order).
Constructive and valuable feedback given from the three anonymous reviewers helped to increase the quality of the paper.
References
- Watts, A.C.; Ambrosia, V.G.; Hinkley, E.A. Unmanned aircraft systems in remote sensing and scientific research: Classification and considerations of use. Remote Sens 2012, 4, 1671–1692. [Google Scholar]
- Hardin, P.J.; Jensen, R.R. Small-scale unmanned aerial systems for environmental remote sensing. GISci. Remote Sens 2011, 48, 1–3. [Google Scholar]
- Laliberte, A.S.; Rango, A. Image processing and classification procedures for analysis of sub-decimeter imagery acquired with an unmanned aircraft over arid Rangelands. GISci. Remote Sens 2011, 48, 4–23. [Google Scholar]
- Stefanik, K.V.; Gassaway, J.C.; Kochersberger, K.; Abbott, A.L. UAV-based stereo vision for rapid aerial terrain mapping. GISci. Remote Sens 2011, 48, 24–49. [Google Scholar]
- Hervouet, A.; Dunford, R.; Piégay, H.; Belletti, B; Trémélo, M. Analysis of post-flood recruitment patterns in braided-channel rivers at multiple scales based on an image series collected by unmanned aerial vehicles, ultra-light aerial vehicles and satellites. GISci. Remote Sens 2011, 48, 50–73. [Google Scholar]
- Breckenridge, R.P.; Dakins, M.E. Evaluation of bare ground on rangelands using unmanned aerial vehicles: A case study. GISci. Remote Sens 2011, 48, 74–85. [Google Scholar]
- Hunt, E.R.; Hively, W.D.; McCarty, G.W.; Daughtry, C.S.T.; Forrestal, P.J.; Kratochvil, R.J.; Carr, J.L.; Allen, N.F.; Fox-Rabinovitz, J.R.; Miller, C.D. NIR-Green-Blue high-resolution digital images for assessment of winter cover crop biomass. GISci. Remote Sens 2011, 48, 86–98. [Google Scholar]
- Ambrosia, V.; Hutt, M.; Lulla, K. Unmanned airborne systems (UAS) for remote sensing applications: Editorial. Geocarto Int 2011, 26, 69–70. [Google Scholar]
- Cress, J.J.; Sloan, J.L.; Hutt, M.E. Implementation of unmanned aircraft systems by the US Geological Survey. Geocarto Int 2011, 26, 133–140. [Google Scholar]
- Laliberte, A.S.; Winters, C.; Rango, A. UAS remote sensing missions for rangeland applications. Geocarto Int 2011, 26, 141–156. [Google Scholar]
- Towler, J.; Krawiec, B.; Kochersberger, K. Terrain and radiation mapping in post-disaster environments using an autonomous helicopter. Remote Sens 2012, 4, 1995–2015. [Google Scholar]
- Laliberte, A.S.; Goforth, M.A.; Steele, C.M.; Rango, A. Multispectral remote sensing from unmanned aircraft: Image processing workflows and applications for rangeland environments. Remote Sens 2011, 3, 2529–2551. [Google Scholar]
- Kelcey, J.; Lucieer, A. Sensor correction of a 6-band multispectral imaging sensor for UAV remote sensing. Remote Sens 2012, 4, 1462–1493. [Google Scholar]
- Rodríguez-Canosa, G.R.; Thomas, S.; del Cerro, J.; Barrientos, A.; MacDonald, B. A real-time method to detect and track moving objects (DATMO) from unmanned aerial vehicles (UAVs) using a single camera. Remote Sens 2012, 4, 1090–1111. [Google Scholar]
- Chiabrando, F.; Nex, F.; Piatti, D.; Rinaudo, F. UAV and RPV systems for photogrammetric surveys in archaeological areas: Two tests in the Piedmont region (Italy). J. Archaeol. Sci 2011, 3, 697–710. [Google Scholar]
- Hendrickx, M.; Gheyle, W.; Bonne, J.; Bourgeois, J.; de Wulf, A.; Goossens, R. The use of stereoscopic images taken from a microdrone for the documentation of heritage—An example from the Tuekta burial mounds in the Russian Altay. J. Archaeol. Sci 2011, 30, 2968–2978. [Google Scholar]
- Verhoeven, G.; Taelman, D.; Vermeulen, F. Computer Vision-based orthophoto mapping of complex archaeological sites: The ancient quarry of Pitaranha (Portugal-Spain)*. Archaeometry. [CrossRef]
- Acevo-Herrera, R.; Aguasca, A.; Bosch-Lluis, X.; Camps, A.; Martínez-Fernández, J.; Sánchez-Martín, N.; Pérez-Gutiérrez, C. Design and first results of an UAV-borne L-band radiometer for multiple monitoring purposes. Remote Sens 2010, 2, 1662–1679. [Google Scholar]
- Barker, R.; King, D.J. Blanding’s turtle (emydoidea blandingii) potential habitat mapping using aerial orthophotographic imagery and object based classification. Remote Sens 2012, 4, 194–219. [Google Scholar]
- Rock, G.; Ries, J.B.; Udelhoven, T. Sensitivity Analysis of UAV-Photogrammetry for Creating Digital Elevation Models (DEM). Proceedings of Conference on Unmanned Aerial Vehicle in Geomatics, Zurich, Switzerland, 14–16 September 2011. Volume XXXVIII-1/C22..
- Bláha, M.; Eisenbeiss, H.; Grimm, D.; Limpach, P. Direct Georeferencing of UAVs. Proceedings of Conference on Unmanned Aerial Vehicle in Geomatics, Zurich, Switzerland, 14–16 September 2011. Volume XXXVIII-1/C22..
- Li, C.; Zhang, G.; Lei, T.; Gong, A. Quick image-processing method of UAV without control points data in earthquake disaster area. Trans. Nonferrous Metal. Soc. Ch 2011, 21, 523–528. [Google Scholar]
- Eisenbeiss, H.; Sauerbier, M. Investigation of UAV systems and flight modes for photogrammetric applications. Photogramm. Rec 2011, 26, 400–421. [Google Scholar]
- Aber, J.; Marzolff, I.; Ries, J.B. Small Format Aerial Photography: Principles, Techniques and Geoscience Applications; Elsevier: Amsterdam, The Netherlands, 2010; p. 256. [Google Scholar]
- Thamm, H.P.; Judex, M. The “Low Cost Drone”—An Interesting Tool for Process Monitoring in a High Spatial and Temporal Resolution. Proceedings of the ISPRS Commission VII Mid-Term Symposium “Remote Sensing from Pixels to Processes”, Enschede, the Netherlands, 8–11 May 2006; pp. 140–144.
- Marzolff, I.; Ries, J.B. 35-mm Photography Taken from a Hot-Air Blimp. Proceedings of the First North American Symposium on Small Format Aerial Photography, Cloquet, MN, USA, 14–17 October 1997; pp. 91–101.
- Marzolff, I. Großmaßstäbige fernerkundung mit einem unbemannten heißluftzeppelin für GIS-gestütztes monitoring von vegetationsentwicklung und geomorphodynamik in Aragón (Spanien). Freiburger Geographische Hefte 1999, 57, 226. [Google Scholar]
- Marzolff, I.; Ries, J.B.; Albert, K.-D. Kite Aerial Photography for Gully Monitoring in Sahelian Landscapes. Proceedings of the Second Workshop of the EARSeL Special Interest Group on Remote Sensing for Developing Countries, Bonn, Germany, 18–20 September 2002. (CD-ROM)..
- Marzolff, I.; Poesen, J. The potential of 3D gully monitoring with GIS using high-resolution aerial photography and a digital photogrammetry system. Geomorphology 2009, 111, 48–60. [Google Scholar]
- Shruthi, R.B.V.; Kerle, N.; Jetten, V. Object-based gully feature extraction using high spatial resolution imagery. Geomorphology 2011, 134, 260–268. [Google Scholar]
- Vrieling, A.; Rodrigues, S.C.; Bartholomeus, H.; Sterk, G. Automatic identification of erosion gullies with ASTER imagery in the Brazilian cerrados. Int. J. Remote Sens 2007, 28, 37–41. [Google Scholar]
- Marzolff, I.; Ries, J.B.; Poesen, J. Short-term versus medium-term monitoring for detecting gully-erosion variability in a Mediterranean environment. Earth Surf. Process. Landf 2011, 36, 1604–1623. [Google Scholar]
- D’Oleire-Oltmanns, S.; Marzolff, I.; Peter, K.D.; Ries, J.; Aït Hssaïne, A. Monitoring Soil Erosion in the Souss Basin, Morocco, with a Multiscale Object-Based Remote Sensing Approach Using UAV and Satellite Data. Available Online: www.sciforum.net/presentation/562/pdf (accessed on 20 June 2012).
- D’Oleire-Oltmanns, S.; Eisank, C.; Drăguţ, L.; Schrott, L.; Marzolff, I.; Blaschke, T. Object-Based Landform Mapping at Multiple Scales from Digital Elevation Models (DEMs) and Aerial Photographs. Proceedings of the 4th GEOBIA, Rio de Janeiro, Brazil, 7–9 May 2012; pp. 496–502.
- Aït Hssaïne, A. Le Cadre Physique de la Dépression du Souss et la Dégradation de L’environnement Sédimentaire. In L’espace Rural Dans le Souss: Héritage et Changements; Bouchelkha, M., Charef, M., Zefzaf, A., Eds.; Université Ibn Zohr, Faculté des lettres et des sciences humaines, Agadir, Groupe d’études et de recherches sur le sud marocain: Agadir, Maroc, 2002; pp. 22–27. [Google Scholar]
- Popp, H. Un «Manmade Hazard»: Le surpompage dans la vallée du Souss. Aspects socio-géographiques d′une exploitation excessive en eaux souterraines. Revue de Géographie du Maroc 1983, 7, 35–52. [Google Scholar]
- Aït Hssaïne, A. Géomorphologie et Quaternaire du Piémont de Taroudant-Oulad Teima, Vallée du Souss, Maroc. Ph.D. Dissertation,. Université de Montréal: Montréal, QC, Canada, 1994. [Google Scholar]
- Chandler, J. Effective application of automated digital photogrammetry for geomorphological research. Earth Surf. Process. Landf 1999, 24, 51–63. [Google Scholar]
- Wolf, P.R.; de Witt, B.A. Elements of Photogrammetry: With Applications in GIS, 3rd ed; McGraw-Hill: Boston, MA, USA, 2000; p. 624. [Google Scholar]
- Harwin, S.; Lucieer, A. Assessing the accuracy of georeferenced point clouds produced via multi-view stereopsis from unmanned aerial vehicle (UAV) imagery. Remote Sens 2012, 4, 1573–1599. [Google Scholar]
- Laliberte, A.S.; Rango, A. Texture and scale in object-based analysis of subdecimeter resolution unmanned aerial vehicle (UAV) imagery. IEEE Trans. Geosci. Remote Sens 2009, 47, 761–770. [Google Scholar]
- Walker, J.P.; Willgoose, G.R. A comparative study of Australian cartometric and photogrammetric digital elevation model accuracy. Photogramm. Eng. Remote Sensing 2006, 72, 771–779. [Google Scholar]
- Giménez, R.; Marzolff, I.; Campo, M.A.; Seeger, M.; Ries, J.B.; Casalí, J.; Álvarez-Mozos, J. High-resolution photogrammetric and field measurements of gullies with contrasting morphology. Earth Surf. Process. Landf 2009, 34, 1915–1926. [Google Scholar]
- Turner, D.; Lucieer, A.; Watson, C. An automated technique for generating georectified mosaics from ultra-high resolution unmanned aerial vehicle (UAV) imagery, based on structure from motion (SfM) point clouds. Remote Sens 2012, 4, 1392–1410. [Google Scholar]
Figure 1.
Souss catchment in South Morocco (Basemap: USGS HydroSHEDS).

Figure 2.
Overview of the study area with investigated gully sites. The dark-green patterned areas are fruit-tree plantations; the light-blue, mostly rectangular shapes are greenhouses. The city of Taroudant is situated in the lower right and surrounded by less industrialized, more fractured agricultural areas (Quickbird2; 26 October 2009).

Figure 3.
Fixed-wing aircraft Sirius I by MAVinci (Photo: W. d’Oleire-Oltmanns 2011).

Figure 4.
Ground control point (GCP) installation workflow (Photo: W. d’Oleire-Oltmanns 2011).
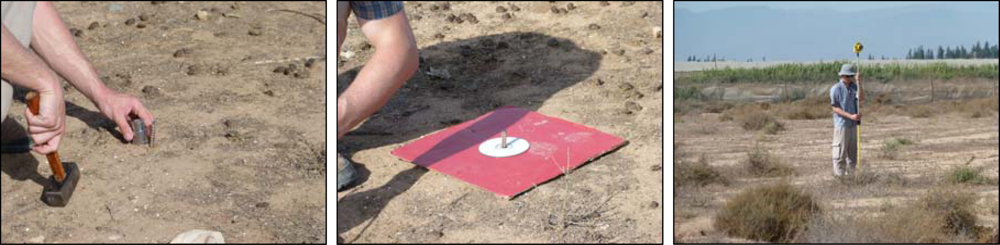
Figure 5.
GCP distribution patterns measured with standard GPS (Quickbird2; 26/10/2009).

Figure 6.
Flight plan for a small study site (HAM3, 85 m flying height). The variably shaded blue lines are two consecutive flight plans that are offset and rotated against each other to enable complete coverage of the small site.
Figure 6.
Flight plan for a small study site (HAM3, 85 m flying height). The variably shaded blue lines are two consecutive flight plans that are offset and rotated against each other to enable complete coverage of the small site.

Figure 7.
Flight plan for a medium sized study site (HOU, 85 m flying height).

Figure 8.
Flight plan for a large study site (LAS, 500 m flying height).
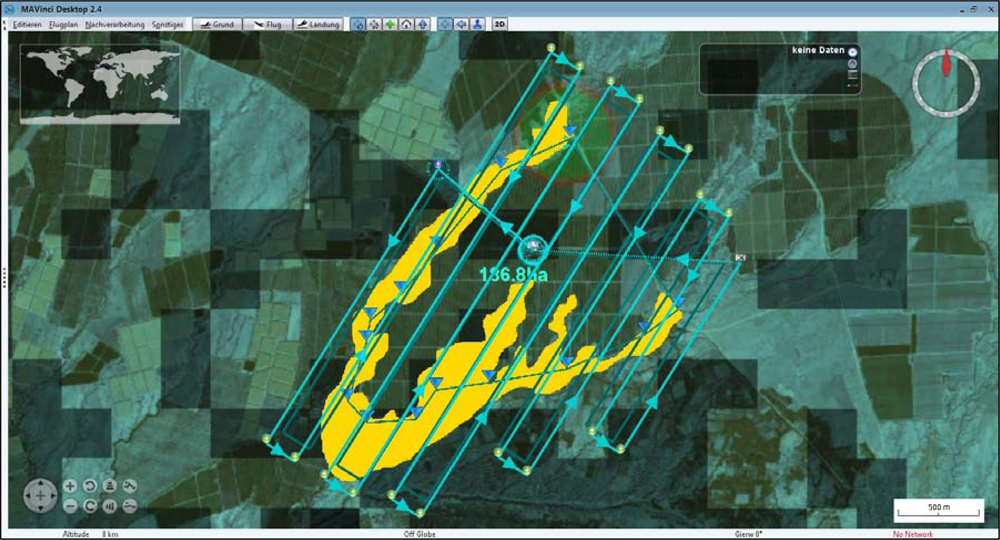
Figure 9.
Assignment of image coordinate values for the GCPs on two images with stereo overlap, highlighted with green circles. GCPs are distributed around the gully system and within the gully to cover the different elevations (study site GLA1).
Figure 9.
Assignment of image coordinate values for the GCPs on two images with stereo overlap, highlighted with green circles. GCPs are distributed around the gully system and within the gully to cover the different elevations (study site GLA1).
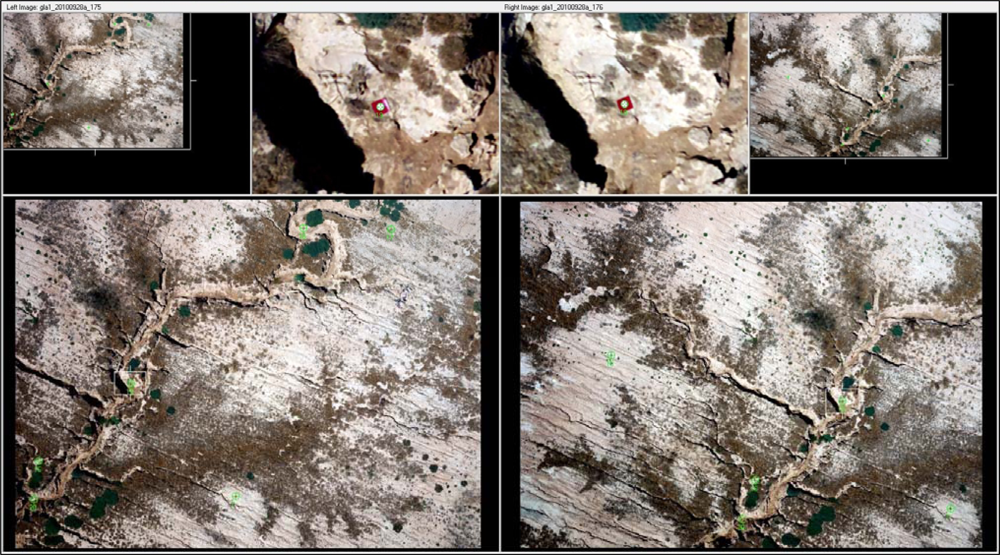
Figure 10.
Distribution of GCPs with corresponding residual vectors in no systematic order. GCPs indicated as red rectangles and error vectors indicated as blue lines (image block from study site GLA1).
Figure 10.
Distribution of GCPs with corresponding residual vectors in no systematic order. GCPs indicated as red rectangles and error vectors indicated as blue lines (image block from study site GLA1).
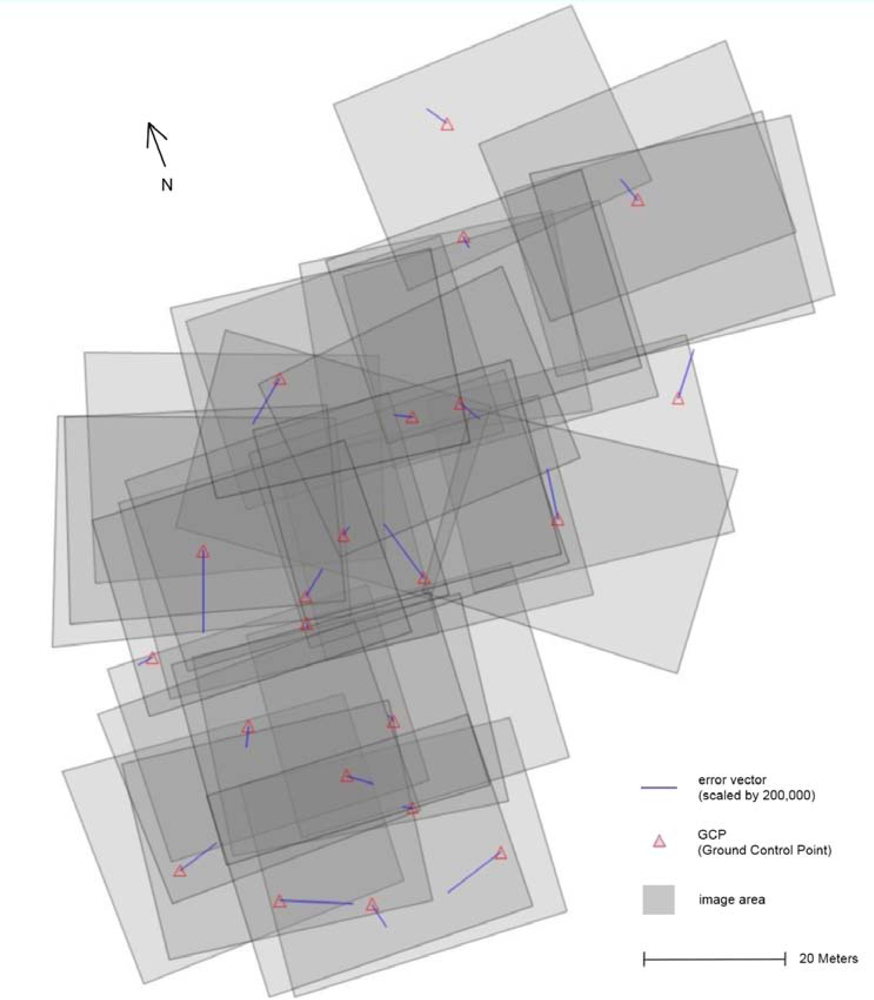
Figure 11.
Generated DTM of study site GLA1.
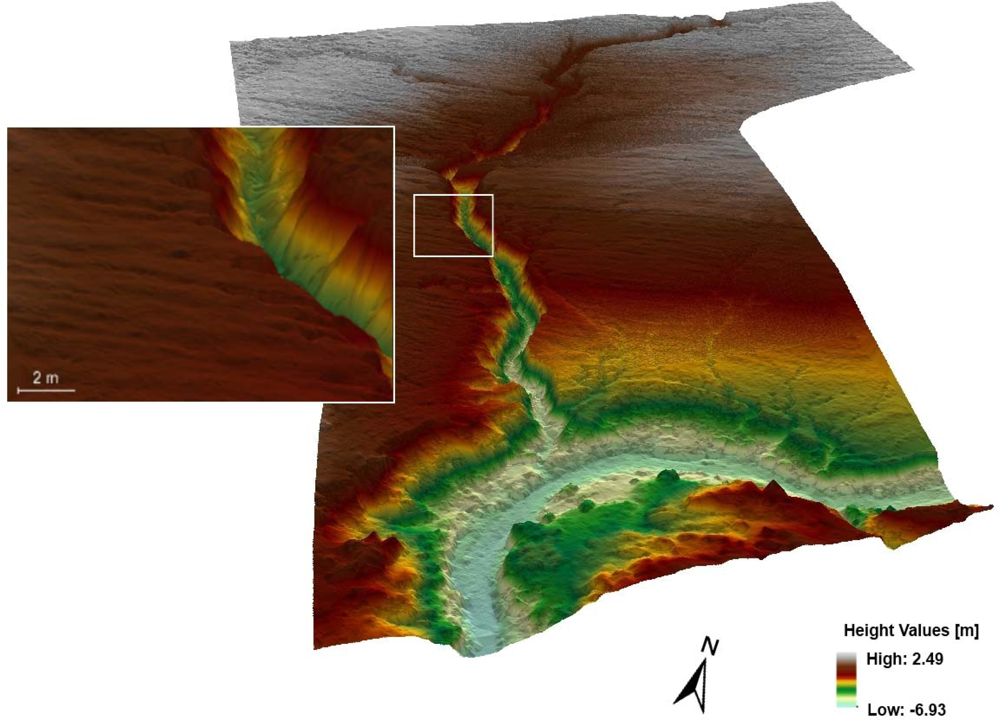
Figure 12.
Ortho-image mosaic of study site GLA1.
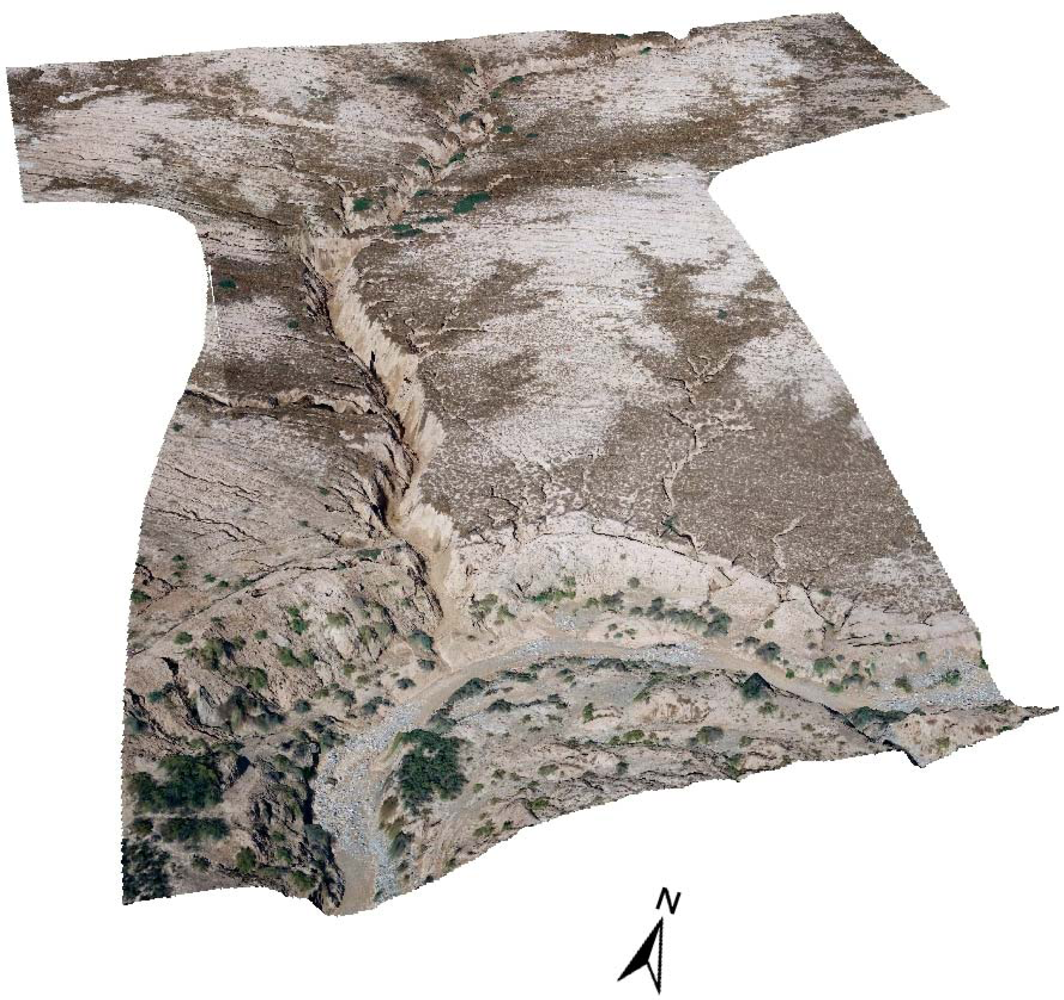
Figure 13.
Generated Digital Terrain Models (DTM) of study site GLA.

Table 1.
Selected parameters for image acquisition survey on selected study sites. Values are taken from MAVinci software since, e.g., setting the parameter flying height defines the area covered by the resulting flight plan.
| Flying Height Above Ground (m) | Area Covered by Flight Plan (ha) | Calculated Image Resolution (cm × cm) | |
|---|---|---|---|
| HAM3 (Hamar 3) | 85 | 1.0 | 1.8 × 1.8 |
| HOU (Houmer) | 85 | 6.7 | 1.8 × 1.8 |
| HOU (Houmer) | 170 | 6.7 | 3.7 × 3.7 |
| GLA1 (Glalcha 1) | 70 | 4.1 | 1.5 × 1.5 |
| GLA (Glalcha) | 400 | 20.2 | 8.6 × 8.6 |
| LAS (Lastah) | 500 | >200.0 | 10.8 × 10.8 |
| Focal length (mm) | 19.1015 |
| Principle point Xo (mm) | −0.0266 |
| Principle point Yo (mm) | 0.0539 |
| Radial lens distortion Konrady coefficients | |
| K1 | −5.9629000e–05 |
| K2 | 2.2113300e–07 |
| RSME GCPs (X/Y/Z) in (m) | Mean Accuracy Exterior Orientation (X/Y/Z) in (m) | Mean Difference Exterior Orientation From Log Values (X/Y/Z) in (m) | Original Image Resolution (m) | DTM Resolution (m) | |
|---|---|---|---|---|---|
| GLA1 (DTM, first workflow) | 0.0093/0.027/0.007 | 0.037/0.024/0.021 | - | 0.015 × 0.015 | 0.05 × 0.05 |
| GLA (DTM, second workflow) | 1.7/1.04/1.1 | 0.3/0.31/0.38 | 4.19/5.0/8.24 | 0.086 × 0.086 | 1.0 × 1.0 |
Share and Cite
MDPI and ACS Style
D'Oleire-Oltmanns, S.; Marzolff, I.; Peter, K.D.; Ries, J.B. Unmanned Aerial Vehicle (UAV) for Monitoring Soil Erosion in Morocco. Remote Sens. 2012, 4, 3390-3416. https://doi.org/10.3390/rs4113390
AMA Style
D'Oleire-Oltmanns S, Marzolff I, Peter KD, Ries JB. Unmanned Aerial Vehicle (UAV) for Monitoring Soil Erosion in Morocco. Remote Sensing. 2012; 4(11):3390-3416. https://doi.org/10.3390/rs4113390
Chicago/Turabian StyleD'Oleire-Oltmanns, Sebastian, Irene Marzolff, Klaus Daniel Peter, and Johannes B. Ries. 2012. "Unmanned Aerial Vehicle (UAV) for Monitoring Soil Erosion in Morocco" Remote Sensing 4, no. 11: 3390-3416. https://doi.org/10.3390/rs4113390