An Object-Based Image Analysis Method for Monitoring Land Conversion by Artificial Sprawl Use of RapidEye and IRS Data


1
CIRAD, UMR TETIS, 500 rue François Breton, F-34398 Montpellier, France
2
IRSTEA, UMR TETIS, 500 rue François Breton, F-34093 Montpellier Cedex 5, France
*
Author to whom correspondence should be addressed.
Remote Sens. 2012, 4(2), 404-423; https://doi.org/10.3390/rs4020404
Submission received: 21 December 2011
/
Revised: 17 January 2012
/
Accepted: 17 January 2012
/
Published: 2 February 2012
(This article belongs to the Special Issue Remote Sensing in Support of Environmental Policy)
Abstract
:In France, in the peri-urban context, urban sprawl dynamics are particularly strong with huge population growth as well as a land crisis. The increase and spreading of built-up areas from the city centre towards the periphery takes place to the detriment of natural and agricultural spaces. The conversion of land with agricultural potential is all the more worrying as it is usually irreversible. The French Ministry of Agriculture therefore needs reliable and repeatable spatial-temporal methods to locate and quantify loss of land at both local and national scales. The main objective of this study was to design a repeatable method to monitor land conversion characterized by artificial sprawl: (i) We used an object-based image analysis to extract artificial areas from satellite images; (ii) We built an artificial patch that consists of aggregating all the peripheral areas that characterize artificial areas. The “artificialized” patch concept is an innovative extension of the urban patch concept, but differs in the nature of its components and in the continuity distance applied; (iii) The diachronic analysis of artificial patch maps enables characterization of artificial sprawl. The method was applied at the scale of four departments (similar to provinces) along the coast of Languedoc-Roussillon, in the South of France, based on two satellite datasets, one acquired in 1996–1997 (Indian Remote Sensing) and the other in 2009 (RapidEye). In the four departments, we measured an increase in artificial areas of from 113,000 ha in 1997 to 133,000 ha in 2009, i.e., an 18% increase in 12 years. The package comes in the form of a 1/15,000 valid cartography, usable at the scale of a commune (the smallest territorial division used for administrative purposes in France) that can be adapted to departmental and regional scales. The method is reproducible in homogenous spatial-temporal terms, so that it could be used periodically to assess changes in land conversion rates in France as a whole.

1. Introduction
In France, peri-urban development in rural areas, and the development of infrastructure for transport and tourism is made possible by the conversion of agricultural land [1–3]. Local dynamics (population growth, economic stakes, real estate, the extension of existing infrastructure) and the financial gains to be had by property owners, almost systematically lead to the approval of such land conversion.
The dynamics underpinning such land conversion are considered to have a minor impact at local scale, but cause greater concern at the regional scale, and even more at the national scale when multiplied by the number of municipalities and accumulation over time. The loss of agricultural land may be irreversible as it would be very difficult and costly (if not impossible or at least economically unrealistic) to subsequently reclaim this land for agriculture. Consequently, this heritage is being destroyed for short term economic gain with no consideration of its collective utility in the medium to long term [1].
In France, natural areas and aquatic environments are public domain and the need for conservation strategies to protect them has been acknowledged [4].
In July 2010, a French law for the modernization of agriculture and fishing was passed which included the creation of an observatory for land conversion with the objective of reducing land conversion by 50% by 2020. To implement this law, a method is needed that would enable monitoring of any changes in land conversion at a national scale to help ensure that the objective is met.
The method must be sufficiently: (i) accurate, to analyze phenomena involved at the municipal/local scale; (ii) exhaustive, to accurately account for changes in artificial land conversion; (iii) reliable and reproducible in homogenous spatial-temporal terms, so that it could be used periodically to evaluate changes in land conversion rates in the country as a whole.
Remote sensing based on satellite images is an appropriate tool as it enables: (i) land use maps to be generated and the location of urban areas to be determined precisely; (ii) large areas to be processed; and (iii) the processes to be reproduced sufficiently rapidly to monitor any changes in land conversion in a timely manner [5–7].
Processing data from satellite images data enables land use objects to be extracted. These then have to be aggregated in such a way that they incorporate all the peripheral areas that characterize each class (for example linking the edges of buildings (gardens, carparks, etc.)) in the “built-up” class. Geographers and urban planners use the urban patch concept [8] as it enables the continuous generation of consistent data on urbanized land. It describes an item of information generated by mathematical morphology processing and gathers together the different component parts or built-up areas (housing, industrial zones, etc.), in accordance with the criterion “continuity distance between buildings”.
We adapted the urban patch concept to peri-urban and rural contexts. We defined the term “artificial patch” in which “artificial” means built up, in the broadest sense of the term (i.e., not only urban areas but also roads and railways, quarries, landfills, etc.).
Constituent objects can be extracted either by photo-interpretation or automatically. As our method is intended to be spatially and temporarily reproducible and to be used for vast areas, we opted for automatic classification. This is accomplished in three steps that can generate global exhaustive information on land “artificialization” to enable monitoring of land conversion over time: (i) mapping of artificial land based on satellite images; (ii) creation of “artificial patches”; and (iii) diachronic analysis of artificial patch maps to characterize artificial sprawl.
This article presents the methodological approach based on remote sensing and the concept of an artificial patch developed to meet the objectives of the French Ministry of Agriculture.
2. Definitions
This paper introduces two specific concepts:
- Artificial patch: this consists of aggregating all the peripheral areas that characterize artificial areas to allow the continuous generation of consistent data on “artificialized” areas. It consists of applying successive dilation/erosion operations characterized by a continuity distance to the artificial areas. The artificialized patch concept is an innovative extension of the urban patch concept. The principle is similar but our definition of the artificial patch differs from that of the urban patch in its components and in the continuity distance used:
- – We defined three main categories of constituent objects: (i) housing areas; (ii) commercial and business areas; and (iii) facilities and infrastructure (including quarries and landfills).
- – We applied a continuity distance of 100 m, which is the best compromise in peri-urban and rural areas. This distance was defined after trials revealed overestimation of the artificial area when the standard continuity distance of 200 m was used to calculate urban patches, and underestimation when a distance of less than 100 m was used
- Artificial sprawl: this concept describes the irreversible land conversion by artificialized areas. It is calculated by diachronic analysis of artificial patches.
3. Study Area and Dataset
3.1. Study Area
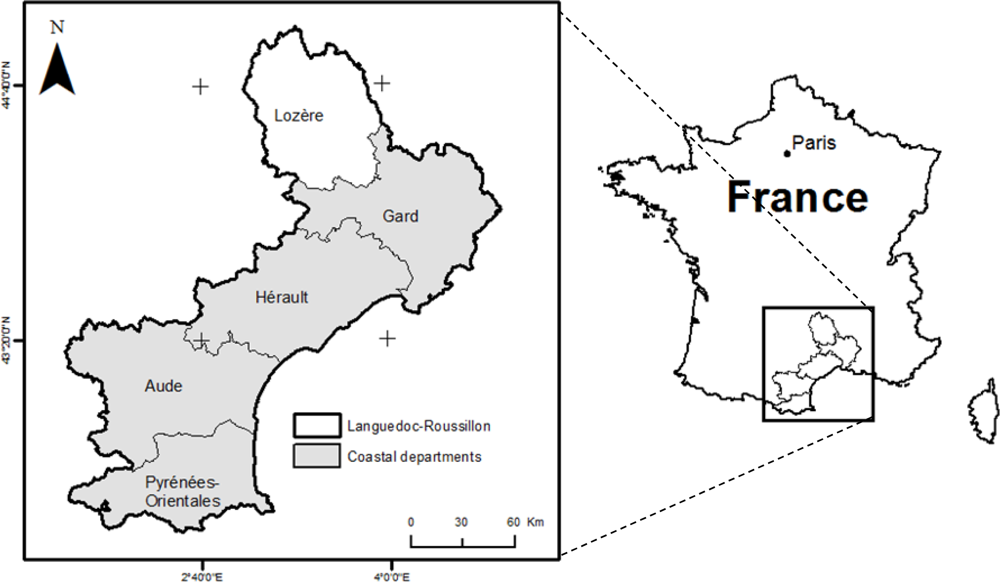
The Languedoc-Roussillon region is a territorial collective located in the South of France. It is composed of five departments (Aude, Gard, Lozère, Hérault and Pyrénées-Orientales). The region covers 2,737,600 ha and had a population of 2,548,000 in 2007.
For the last three decades, population pressure in Languedoc-Roussillon has led to rapid and poorly managed urbanization of the coastal plain, notably that of the most productive land in the region. The topography of the territories and coastal development policies have led to an imbalance in both the population and in the distribution of activities over the region, and hence to “coastalization” (the concentration of populations and activities along the coastline [9], which is characteristic of the Mediterranean basin). The region’s demographic growth is concentrated in the major cities and their peripheral extensions, all of which are situated within 30 km of the coast [10]. On the coastal plain, the construction of housing and infrastructure, and the development of economic activity zones (which has increased with demographic growth), have led to significant pressure on land resources. Successive crises in the wine making sector and subsequent vineyard clearances and reconversion policies have had a negative impact on agricultural activities in general. There is intense land speculation on the fringes of the main urban areas in the region. Most land located close to urban areas that is cleared of vines is sold and urbanized. The remaining lands are subject to agricultural reconversion or are planted with high quality vines [11]. This phenomenon is deemed marginal at the local scale but takes on a whole new dimension when considered at the regional scale. The loss of this strategic agricultural heritage is a major concern for the institutions and stakeholders in the agricultural sector who fear that the disappearance of these farmlands may be irreversible. The method we developed was applied at the scale of the four coastal departments of Languedoc-Roussillon (Aude, Gard, Hérault and Pyrénées-Orientales), all of which have undergone significant urban growth in recent decades (Figure 1).
3.2. Image Dataset and Pre-Processing
Two different datasets of HSR multi-spectral satellite images were used to map changes in artificial sprawl. Different datasets were used for each period: RapidEye images for the most recent period (2009) and Indian Remote Sensing (IRS) images for the earlier (1996–1997) period. IRS images were the only HSR remotely sensed data available that covered the study area during the earlier period. Table 1 lists the characteristics of the two datasets. We wanted to use images acquired during spring and summer, i.e., when vegetation was in active growth, to limit confusion between bare soils (natural or agricultural) and artificial areas.
RapidEye images are produced by the remote sensors in a five-satellite constellation in use since 2008. This constellation can quickly provide homogenous and recent data covering large areas. Images are delivered in 25 km large orthorectified blocks with a spatial resolution of 5 m. Sixty-five images (acquired during spring and summer, 2009) were required to cover the study area.
IRS images are generated by two remote sensors: one sensor (LISS) is used to acquire multispectral images at a spatial resolution of 23 m, and the other (PAN) for panchromatic images with a spatial resolution of 5.8 m. Images from the two sensors (LISS & PAN) were used for our study because panchromatic images are required to accurately delineate artificial areas in addition to multispectral images. Twelve archive image pairs (LISS + PAN) were used to cover the study area. Images from each pair were collected simultaneously. Only eight image pairs were available for spring or summer in the archive catalogue, the three other pairs were acquired in the fall. Images are delivered without geometric correction. Each image was orthorectified using the LPS module of ERDAS IMAGINE™ ERDAS, Inc. (GA, USA) software based on a digital elevation model with a spatial resolution of 50 m and orthophotos with a spatial resolution of 0.5 m produced by the French National Geographic Institute (IGN). The images were resampled to match the spatial resolution of the RapidEye images (5 m). Finally, mosaics were built for the whole study area using each image dataset.
3.3. Ancillary Data
Given the difficulties involved in extracting roads from remotely sensed images, linear vector data from the BDCarto® database were also collected for roads in the study area. BD CARTO® is a mapping reference database produced by IGN and uses a departmental scale (1:50,000). These linear vector data were converted into polygons by building buffers. The buffer widths depended on the type of road: 10 m for two lane roads and 20 m for multi-lane highways.
4. Methods
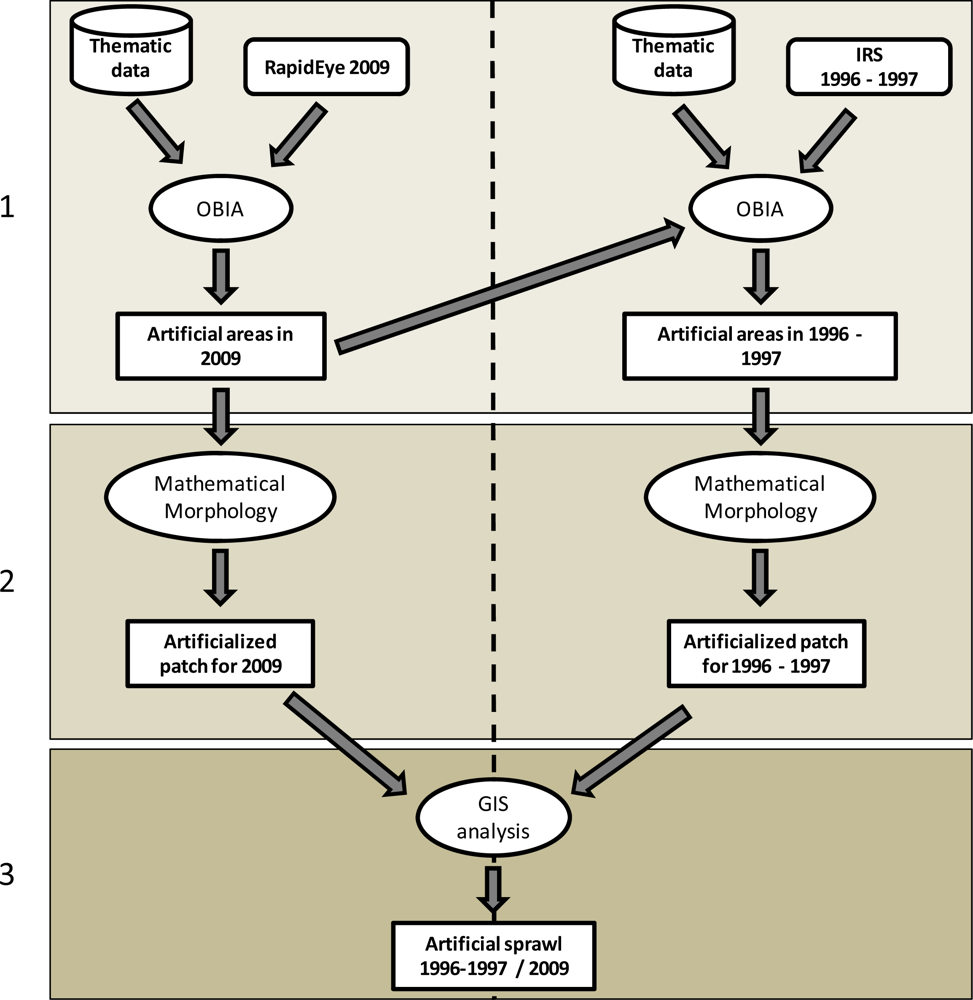
A three-step method was designed to characterize artificial sprawl between 1997 and 2009 (see workflow diagram in Figure 2) including: (i) fine-scale mapping of artificial areas by processing the HSR satellite images acquired for each period; (ii) building artificial patches from each map; (iii) performing diachronic analysis of artificial patches to characterize changes in artificial sprawl between 1997 and 2009.
This method enabled areas to be assigned to one of the two following classes:
- “artificial areas”, including urban fabric, industrial and commercial areas, mineral extraction, dumps, construction sites, and roads. We considered that these objects represent “sustained urbanization” (i.e., a return to “non artificial” is not feasible)
- “non artificial areas” including all the other land uses: agriculture, forests, water, etc.
4.1. Mapping Artificial Areas from OBIA
When high resolution is used (i.e., when the pixels are significantly smaller than the object concerned, [12]), the spectral information in an image is spatially heterogeneous and the pixel no longer corresponds to the object. This was the case in our study: artificial areas in HSR images are composed of pixels with different spectral behaviors (roofs, roads, parks, etc.) distributed in a disorganized way throughout the area. Many researchers have pointed to the limited accuracy of this method of classification, the “salt and pepper” effect being responsible for this drawback (e.g., [6,13–19]). Object-based image analysis (OBIA) has proven to be an effective way of solving this problem. First, a segmentation process identifies and builds up homogeneous regions (segments or image objects) to delineate the objects to be taken into account. Next, the objects are classified using spectral as well as spatial information such as texture, shape and context features to more clearly distinguish spectrally similar land cover types. Most comparative studies that have compared OBIA and pixel classification approaches reported that OBIA provides the most accurate results (e.g., [19–23]). Recent advances in OBIA have revolutionized the processing of high to very high spatial resolution remote sensing data by providing effective computer-assisted classification techniques whose results are close to the quality of manual photo-interpretation, while also being much faster, cheaper and reproducible over large areas (e.g., [6,7]).
We developed two specific OBIA procedures to map the artificial areas for each period using eCognition Developer 8 software (see Sections 3.1.1 and 3.1.2). With this software, fuzzy classification can be used to extract objects of interest at the scale desired. To this end, a hierarchical image object network able to simultaneously segment images at fine and coarse scales is created from the multi-resolution algorithm, and a hierarchical classification scheme is built to allow semantic organization of the classes. A complete description of the multi-resolution algorithm (region-growing algorithm) can be found in [24–26]. Fuzzy classification improves class description, using understandable linguistic concepts built from expert knowledge, and facilitates fusion of heterogeneous multi-source information including non-image data [25].
The classification process we developed will be easy to transfer to other areas since: (i) the fuzzy classification introduces flexibility in defining classification rules; and (ii) the expert knowledge classification method allows thresholds to be changed between each image, and classes to be added if the context is different [7,27].
The fuzzy classification method combined with expert knowledge classification means the definition of classes can be adapted to each individual context
4.1.1. Procedure for Classification of RapidEye Images Acquired in 2009
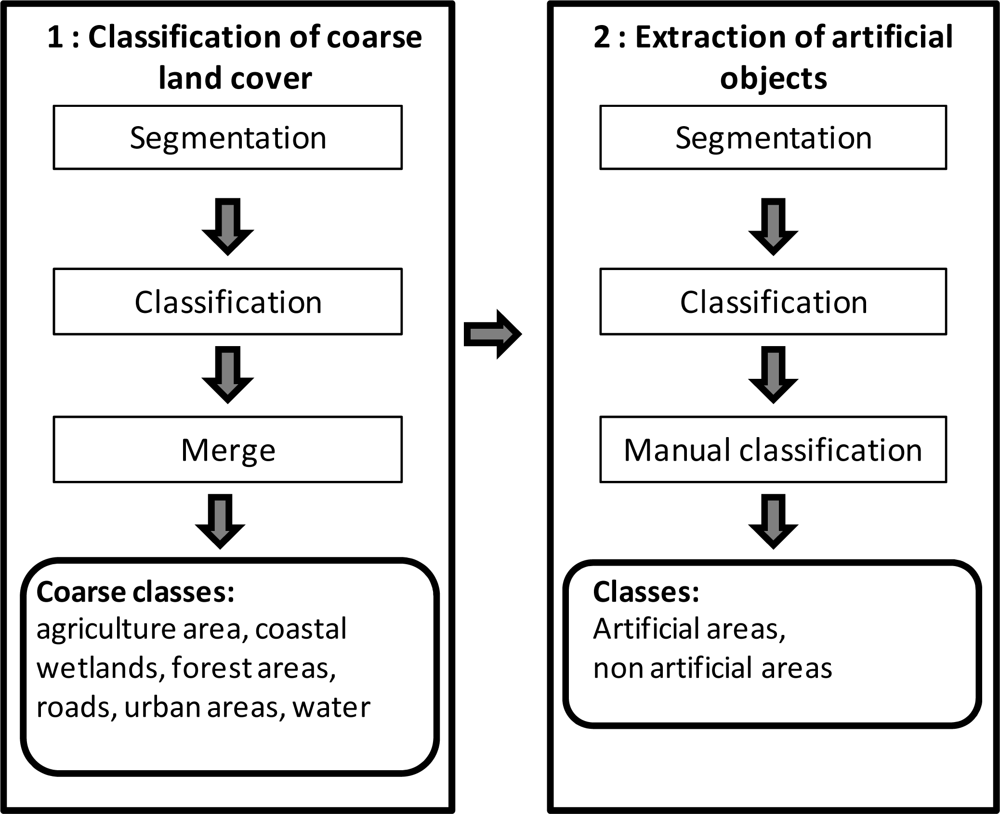
To map artificial areas, we developed an OBIA procedure comprised of two successive steps of segmentation-classification (Figure 3). The first step allows the area to be stratified into regions of the same nature. The second step consists of reclassifying each of these regions to extract artificial objects. This method allows the parameters and thresholds of each class to be adapted to the local context.
Next we provide a short description of the procedure. The segmentation parameters and feature classes for each step are summarized in Table 2.
Step I, “classification of coarse land cover” allows the landscape to be stratified into six land cover categories: C1-“agriculture areas”, C2-“coastal wetlands”, C3-“forest areas”, C4-“roads”, C5-“water surfaces”, C6-“urban areas”. To this end, a coarse segmentation level is first created by implementing the multi-resolution segmentation algorithm using information from both thematic (roads) and raster (all bands of RapidEye) layers. In this way, the study zone is segmented according to the limits of both thematic data to product coarse land cover objects. Second, each object is assigned to a land cover category using fuzzy classification rules based on thematic attributes for the C4 category, and raster attributes (spectral and context) for the other categories (see Table 2). For example, the normalized difference vegetation index (NDVI) was used to distinguish artificial and agriculture areas. Finally, neighboring objects in the same category are merged into a single object using the merge algorithm included in the software.
Step II, “extraction of artificial area” allows all artificial objects to be extracted and assigned to one of the three categories extracted in Step I: C1-“agricultural areas”, C3-“forest areas” and C6-“urban areas”. To this end, a finer segmentation level based on image object limits in step 1 and RapidEye band information is first obtained by using the multi-resolution segmentation algorithm. This segmentation level is needed for satisfactory delimitation of all artificial objects including small isolated objects. Then, each object at this level inherits the land cover categories from step I using class-related features at the super-object level. An “artificial areas” class is allocated to all objects in the C4 category. For each object classified in C1, C3 and C6, category specific classification rules based on spectral and textural attributes (see Table 2), are used to distinguish the “artificial areas” class. For instance for objects that belong to the C3 category, a classification rule based on near infrared information is used to separate “vegetation objects” from “building objects”, the latter being extremely small and isolated in this region [28]. Finally, manual classification processing is performed to reduce confusion between artificial objects and agricultural or semi-natural bare soil objects that have very similar spectral and textural behaviors.
4.1.2. Procedure Used for Classification of IRS Images Acquired in 1997
In this procedure, we consider that the artificialization of a territory is permanent, i.e., artificial areas built in the past will be present in the future. The procedure thus consists of checking to see if the artificial areas extracted from the 2009 images were also visible in the archive images. It is based on OBIA and comprises one segmentation-classification step, which includes the results (artificial areas) of processing of the 2009 images, which were used as thematic data input. The segmentation parameters and feature classes are summarized in Table 2. First, the segmentation level was created by implementing the multi-resolution segmentation algorithm based on information from both thematic and raster (with a weight for IRS-PAN twice that of IRS-LISS) layers. The study area was thus segmented according to the limits of the artificial areas present on images while retaining the limits of thematic data entities (artificial areas present in 2009). Then, each object was classified into “artificial areas in 2009” according to their thematic attributes. For each object classified under “artificial area in 2009”, we checked to see if it was still artificial using fuzzy classification rules, based on spectral and textural attributes both from IRS-PAN and IRS-LISS information (see Table 2).
4.1.3. Map Validation
As metric accuracy of boundary locations was not required to satisfy the main objective of the study (i.e., building artificial patches and indicators from these patches) we did not check the planimetric accuracy of the boundaries, but focused on the semantic quality of the classification (i.e., the nature of the objects). Obviously semantic quality also depends on planimetric accuracy. Semantic quality is assessed using a confusion matrix [29]. Given that the features used for classification are calculated at the scale of the object, objects or polygons were chosen as sampling units for the selection of control data [30–33]. As the resulting map contains objects of different sizes, from tiny to very large, the confusion matrix was computed using the area of the selected control objects (expressed as a number of 5 m pixels). To select control data (required for a sample that is spatially and thematically well-distributed over the study area [34]), we used an algorithm available in “Hawths Analysis Tools for ArcGis” ( http://www.spatialecology.com). Next, stratified random sampling was performed using grid cells as geographic strata (equal area for all strata). To obtain at least one object from each class in each grid cell, the number of cells (N) was made equal to the desired sample size. As suggested by [35] and used in other studies (e.g., [7]), 50 samples were taken from each class to build the confusion matrix. Considering the size of the study area (and mapping regions), collecting field data for the control sample would normally be extremely labor-intensive and time-consuming. As suggested by [22] and [36], selected control objects were photo-interpreted using the image with the highest spatial resolution as control data. To ensure photo interpretation was objective, the classified map was not viewed during the process and the manual photo interpretation was made by an experienced photo-interpreter who was not involved in developing the method. Three statistics were extracted from the confusion matrix to assess the accuracy of the land cover pressure map [35]: (i) overall accuracy: i.e., the proportion of map pixels that are correctly classified (i.e., equivalent to the proportion of real pixels that are correctly classified); (ii) user accuracy, i.e., for each class, what percentage of this map class corresponds to this class in reality; (iii) producer accuracy, i.e., for each class what percentage of the reality is correctly classified on the map.
4.2. Building Artificialized Patches to Monitor Land Conversion
4.2.1. Mathematical Morphology Operation: Closing
The extent of geographical objects can be increased by applying a mathematical morphology operation called closing, which combines two basic operations called dilation and erosion [8,37–40]. In our case, the method used to produce an artificial patch is the successive application of the two transform operations to the artificial objects extracted from the satellite images. The successive execution of these operations enables the addition of elementary objects (from the same group) [40]. However, the dilation and erosion operations have opposite effects. The dilation effect first increases the size of building objects. The height and width of dilated components is then the respective sum of the heights and widths of the original components and of a structuring element. The erosion operation is used to shrink the resulting elements through dilation. The height and width of the eroded element is then the respective differences in the heights and widths of the original components and the structuring element. Therefore, the area eroded corresponds to the symmetrical element (or residue) of the dilation process [41].
The structuring element is defined by its shape and size. The shape of the structuring element has an effect on the contours of the modified object; a square filter will highlight angular elements while a round filter will soften the contours [42]. In this study we applied a round structuring element in order to generate artificial patches with smooth contours (Figure 4).
The size of the structuring element is linked to the distance between the buildings to be taken into account in order to decide if they belong, or not, to the same zone (which buildings are bounded within a single polygon?) The weaker the continuity criterion, the more fragmented the artificial patch, which therefore depends on the type of object under study and the accuracy of the data used.
4.2.2. Determining the Artificial Patch Envelope: Choosing a Continuity Distance between Buildings
Current research on the choice of a building continuity distance is generally based on a building gap threshold of 200 m (a 100 m radius), which is internationally used for the definition of urban areas. This definition results from the development of a urban nomenclature that is shared worldwide and corresponds to the distance that a person can comfortably walk between two houses [38]. However, it may not be suitable for the definition of an artificial patch, whose accuracy and characterization depend on the mode of detection and on the spatial resolution of the data used in the analysis.
We tested several distances and evaluated the results obtained by laying the resulting artificial patches on aerial photographs. The results showed that a 100-m radius (used to define an urban area) tends to include too many non-urbanized areas, while a 25-m median radius overexpresses sprawl in densely artificialized areas.
Given these results, we decided that a 50-m median radius was sufficient to monitor land conversion in rural, peri-urban and urban areas. A study conducted by the Certu Institute (Research institute for the study of networks, transport, urban planning and state building projects) and the CETE Institute (Research institute for the development of infrastructure) supported our choice [43]. The artificial patch generated did not significantly encroach on surrounding rural areas and allowed us to retain a 1 to 2 ha minimum data collection unit.
5. Results and Discussion
5.1. Accuracy of Map of Artificial Objects Using HSR Imagery
We validated the results of the classification of artificial areas for 2009 and 1996–1997. The overall accuracy for 2009 was 90.57%. This is a very good classification rate for an automatic classification method. Errors were the result of the method’s inability to distinguish between non-cultivated agricultural/rocky areas and artificial areas.
Concerning the 1996–1997 classification, the IRS images had a lower spatial resolution, which reduced the detection of isolated buildings. We used the 2009 results as a mask to reduce the error rate. The overall accuracy obtained was 88.33%.
The user accuracy and producer accuracy values obtained are listed in Table 3. They confirm the high quality of the results.
5.2. Monitoring Land Conversion Using Artificial Patches
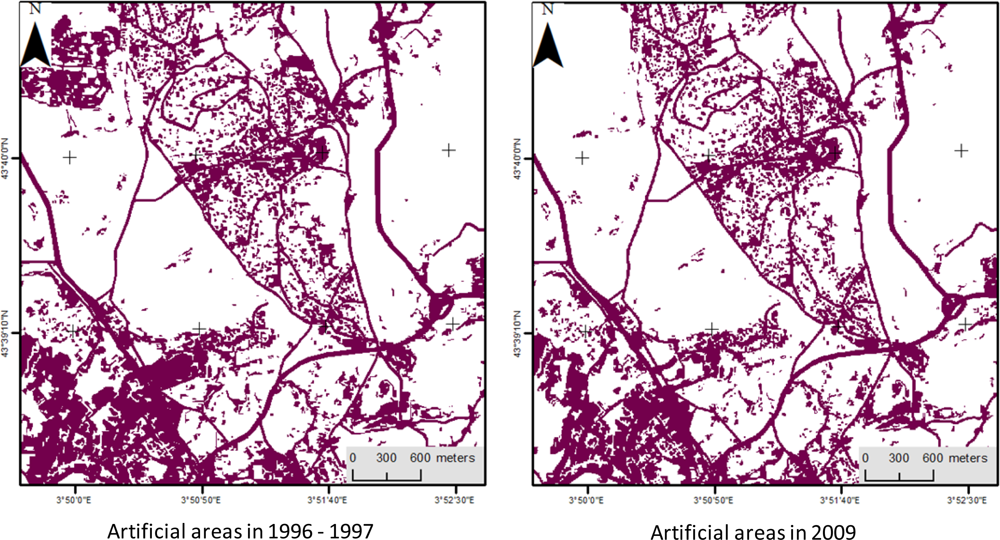
At the end of the classification process we developed, we extracted images of artificial areas from the RapidEye images of 2009 and the IRS images of 1996–1997 (Figure 5).
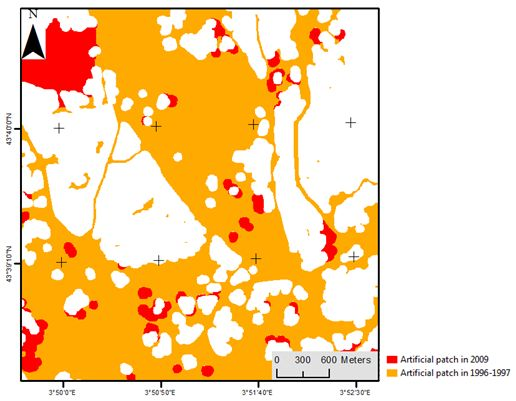
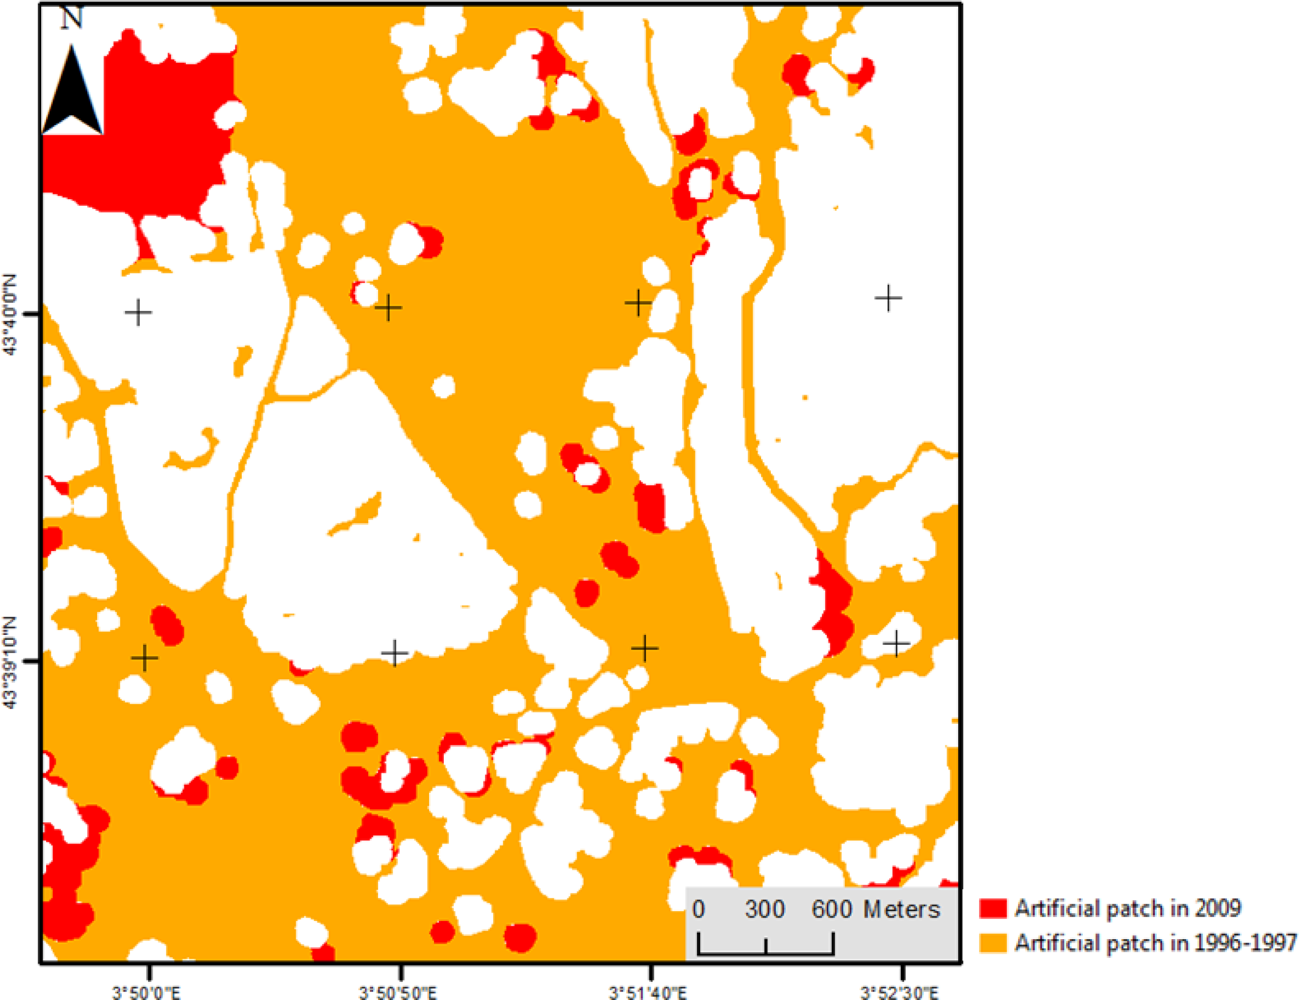
Two artificial patches were generated covering the four coastal departments in Languedoc-Roussillon in 1996–1997 and 2009. An extract of these results is shown in Figure 6.
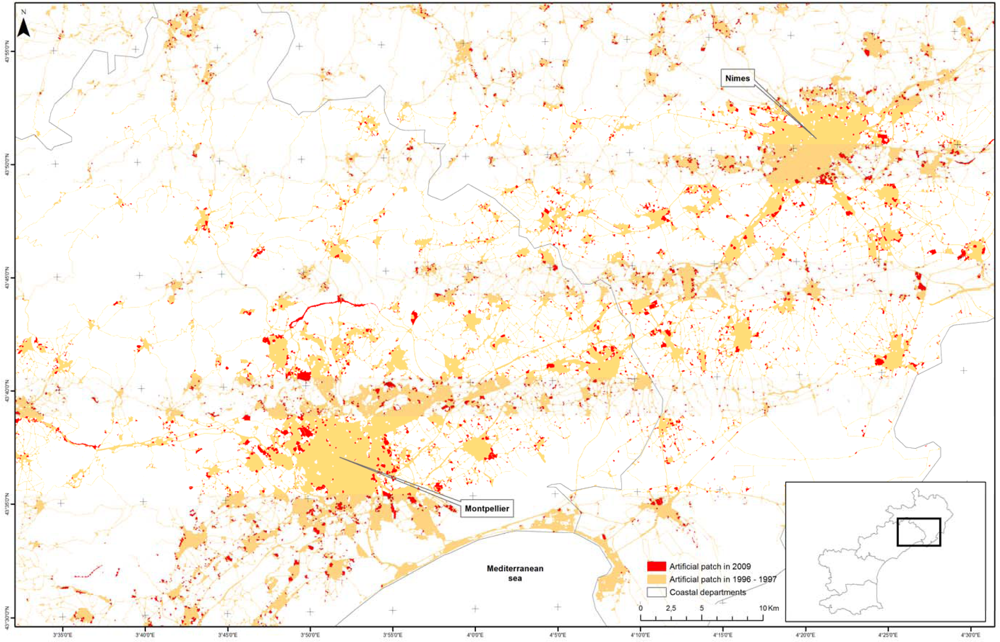
These two artificial patches were then combined and used to identify any increase in urban sprawl between 1996–1997 and 2009, and also to quantify land conversion. Figure 7 shows the spatial progression of land artificialization. Figure 8 shows an extract of artificial sprawl at a coarser scale.
The increase in artificial areas in our study area amounted to 20,000 ha, i.e., 0.8% of the total area of the four coastal departments. However, this represents an approximate 8% increase in artificial areas (Table 4).
These results illustrate the differences in the degree of pressure on each territory in the study area. The Hérault and Gard departments showed the largest increases in artificial sprawl: approximately 7,000 ha in both departments and an increase in urban sprawl of 9% and 9.9% respectively. Figure 9 shows the artificial sprawl for each department.
To identify the nature of these changes, we also produced a roadless “artificial patch”. Table 5 shows that in this case, growth for the four departments analyzed increased from 8% to 18%. The increase in off-road artificial areas was highly significant (18% in 12 years). It mainly reflects the urban sprawl phenomenon. On the other hand, although including roads in the artificial patch leads to an exhaustive representation artificial areas, it partially smoothed land conversion. This is explained by the density of the existing road network and its marginal development that minimize the overall artificial sprawl.
5.3. Improving the Method
The image processing method developed in this study was designed for use in other study areas, and also at a national scale. During the study described here, the image processing method was implemented in Languedoc, which allowed us to assess its potential for application at the regional scale in a Mediterranean setting, and to adapt it accordingly.
The method would be worth modifying for use in a different context and then assessing its feasibility. Certain lines of research could improve the processing time. Since 1 January 2011, IGN has made available its land cover databases to public services free of charge. Knowing how the databases were updated, these cannot replace the image processing step in our method. However, it would be useful to combine them with satellite images in order to stratify processing and hence reduce confusion between areas of bare soil, agricultural areas, and artificial areas. Using these data would allow us to significantly reduce or even eliminate the post classification step and consequently reduce total processing time.
A second improvement to the artificial patch production method would involve adapting the choice of the building continuity distance to the type of area under study (urban peri-urban or rural). This would involve varying the width of the buffer zone applied to the constituent objects of the artificial area produced by the dilation/erosion operation. The nomenclature would have to be extended to be able to distinguish the component artificial areas of rural, peri-urban and urban areas, and then to define criteria for distances between the corresponding building objects.
The second possible improvement of the method mentioned above would be particularly useful to generate data that could be used for studies of the shape of towns and their spatial distribution.
6. Conclusions
This paper describes a generalizable and reproducible method for quantitative and qualitative monitoring of land conversion by artificial sprawl. The main innovations consists of: (i) the object-based image analysis (OBIA) method used to ensure spatial-temporal reproducibility; (ii) the artificial patch concept, which aggregates all the peripheral areas that characterize artificial areas to allow the continuous generation of consistent data on artificialized areas. The method comprises three steps: (i) fine-scale mapping of artificial areas from the OBIA processing of high resolution spatial satellite images; (ii) the building of artificial patches from each map; (iii) diachronic analysis of artificial patch maps. This generates information that can be used at a fine scale (1/15,000) to enable characterization of artificial sprawl.
The method was applied to Indian Remote Sensing (1996–1997) and RapidEye (2009) satellite image datasets on the South of France (Languedoc-Roussillon). We measured an increase in artificial areas from 113,000 ha (1997) to 133,000 ha (2009), i.e., an 18% increase in 12 years.
The transferability of the method remains to be confirmed. However, the concepts developed and the use of OBIA and high-resolution images should ensure transferability. This means that we can envisage using this method both at national scale and periodically to observe how land conversion phenomena evolve over time.
In this respect, our innovative method fits in with the French law of July 2010 on the modernization of agriculture and fishing, which aims at a 50% reduction in land conversion by 2020. The periodic use of this method would enable changes in land conversion to be monitored at a national scale and help ensure that this reduction objective is met.
Acknowledgments
This project was supported by the DRAAF Languedoc-Roussillon (regional directorate of the French Ministry of Agriculture). We thank Agnès Bégué,Maxime Claden, Dany Lo Senn (CIRAD, UMR TETIS) Kenji Ose (IRSTEA, UMR TETIS), and Thierry Tormos (IRSTEA-ONEMA, UR MALY, Lyon France) for the help they have given us in this project.
References
- Le Gouée, P.; Maxime, M. DEMETER: Une Démarche Originale pour Maîtriser la Consommation du Foncier Agricole lié à l'Étalement Urbain; Outils Pour Décider Ensemble (OPDE), Aide à la Décision et Gouvernance: Montpellier, France, 2010; pp. 11–24. [Google Scholar]
- Pointereau, P.; Coulon, F. Abandon et artificialisation des terres agricoles. Courrier de l'environnement de l'INRA 2009, 57, 109–120. [Google Scholar]
- Trégouët, B. Le Point sur L’Artificialisation des Sols s’Opère aux Dépens des Terres Agricoles; Commissariat Général au Développement Durable, Observation et Statistiques, Environnement: La Défense, France, 2011; p. 4. [Google Scholar]
- Geniaux, G.; Napoléone, C. Rente foncière et anticipations dans le périurbain. Economie Prévision 2005, 2, 77–95. [Google Scholar]
- D’Oleire-Oltmanns, S.; Coenradie, B.; Kleinschmit, B. An object-based classification approach for mapping migrant housing in the mega-urban area of the Pearl River Delta (China). Remote Sens 2011, 3, 1710–1723. [Google Scholar]
- Durieux, L.; Lagabrielle, E.; Nelson, A. A method for monitoring building construction in urban sprawl areas using object-based analysis of SPOT 5 images and existing GIS data. ISPRS J. Photogramm 2008, 63, 399–408. [Google Scholar]
- Tormos, T.; Durrieu, S.; Kosuth, P.; Dupuy, S.; Villeneuve, B.; Wasson, J.G. Object based image analysis for operational fine-scale regional mapping of land cover within river corridors from multispectral imagery and thematic data. Int. J. Remote Sens 2011, in press.. [Google Scholar]
- Cuniberti, E.; Frandon, C.; Giraud, E. Les bases de Données Géographiques d’Occupation du Sol: Volet Tache Urbaine. Descriptif et Comparatif de 6 Bases de Données; CETE de Lyon, Certu: Lyon, France, 2005; p. 53. [Google Scholar]
- Baud, P.; Bourgeat, S.; Bras, C. Dictionnaire de la Géographie, 2nd ed.; Hatier: Paris, France, 1997; p. 509. [Google Scholar]
- Abrantes, P.; Soulard, C.; Jarrige, F.; Laurens, L. Dynamiques urbaines et mutations des espaces agricoles en Languedoc-Roussillon (France). Cybergeo 2010. [Google Scholar] [CrossRef]
- Jarrige, F.; Delay, C.; Montfraix, P.; Gambier, J.-P.; Buyck, J.; Chéry, J.P. Mutation du Foncier Agricole en Frange Urbaine. Elaboration et mise à l’épreuve d’une Politique de Régulation Territoriale. Proceedings of XLVIé Colloque de l’ASRDLF, Clermont-Ferrand, France, 6–8 July 2009; p. 21.
- Blaschke, T. Object based image analysis for remote sensing. ISPRS J. Photogramm 2010, 65, 2–16. [Google Scholar]
- Irons, J.; Markham, B.; Nelson, R.; Toll, D.; Williams, D.; Latty, R.; Stauffer, M. The effects of spatial resolution on the classification of Thematic Mapper data. Int. J. Remote Sens 1985, 6, 1385–1403. [Google Scholar]
- Ivits, E.; Koch, B.; Blaschke, T.; Jochum, M.; Adler, P. Landscape structure assessment with image grey-values and object-based classification at three spatial resolutions. Int. J. Remote Sens 2005, 26, 2975–2993. [Google Scholar]
- Kressler, F.P.; Kim, Y.S.; Steinnocher, K.T. Object-Oriented Land Cover Classification of Panchromatic KOMPSAT-1 and SPOT-5 Data. Proceedings of 2003 IEEE International Geoscience and Remote Sensing Symposium, Toulouse, France, 21–25 July 2003; pp. 3471–3473.
- Latty, R.; Hoffer, R. Computer-Based Classification Accuracy due to Data Spatial Resolution Using a Per-Point vs. Per Field Classification Techniques. Proceedings of International Symposium Machine Processing of Remotely Sensed Data, West Lafayette, IN, USA, 23–26 June 1981; pp. 384–393.
- Lennartz, S.P.; Congalton, R.G. Classifying and Mapping Forest Cover Types Using IKONOS Imagery in the Northeastern United States. Proceedings of ASPRS Annual Conference, Denver, CO, USA, 23–28 May 2004; pp. 23–28.
- Muller, E.; DÉCamps, H.; Dobson, M.K. Contribution of space remote sensing to river studies. Freshwater Biology 1993, 29, 301–312. [Google Scholar]
- Yan, G.; Mas, J.F.; Maathuis, B.; Xiangmin, Z.; Van Dijk, P. Comparison of pixel-based and object-oriented image classification approaches: A case study in a coal fire area, Wuda, Inner Mongolia, China. Int. J. Remote Sens 2006, 27, 4039–4055. [Google Scholar]
- Oruc, M.; Marangoz, A.M.; Buyuksalih, G. Comparison of Pixel-Based and Object-Oriented Classification Approaches Using Landsat-7 ETM Spectral Bands. Proceedings of XX ISPRS Congress, Istambul, Turkey, 23–27 July 2004; p. 5.
- Repaka, S.R.; Traux, D.D.; Kolstad, E.; O’Hara, C.G. Comparing Spectral and Object Based Approaches for Classification and Transportation Feature Extraction from High Resolution Multispectral Imagery. Proceedings of ASPRS Annual Conference, Denver, CO, USA, 23–28 May 2004.
- Whiteside, T.G.; Boggs, G.S.; Maier, S.W. Comparing object-based and pixel-based classifications for mapping savannas. Int. J. Appl. Earth Obs. Geoinf 2011, 13, 884–893. [Google Scholar]
- Willhauck, G.; Schneider, T.; De Kok, R.; Ammer, U. Comparison of Object Oriented Classification Techniques and Standard Image Analysis for the Use of Change Detection between SPOT Multispectral Satellite Images and Aerial Photos. In IAPRS, Proceedings of XIX ISPRS Congress, Amsterdam, The Netherlands, 16–22 July 2000; 2000; 33, pp. 35–42. [Google Scholar]
- Baatz, M.; Schäpe, A. Multiresolution segmentation: An optimization approach for high quality multi-scale image segmentation. In Angewandte Geographische Informationsverarbeitung XII. Beiträge zum AGIT-Symposium Salzburg 2000; Herbert Wichmann Verlag: Karlsruhe, Germany, 2000; pp. 12–23. [Google Scholar]
- Benz, U.C.; Hofmann, P.; Willhauck, G.; Lingenfelder, I.; Heynen, M. Multi-resolution, object-oriented fuzzy analysis of remote sensing data for GIS-ready information. ISPRS J. Photogramm 2004, 58, 239–258. [Google Scholar]
- Trimble, eCognition® Developer 8.64.1 User Guide; Trimble Germany GmbH: Munich, Germany, 2011.
- Hofmann, P.; Strobl, J.; Blaschke, T.; Kux, H. Detecting informal settlements from QuickBird data in Rio de Janeiro using an object based approach. In Object-Based Image Analysis: Spatial Concepts for Knowledge-Driven Remote Sensing Applications; Blaschke, T., Lang, S., Hay, G.J., Eds.; Springer-Verlag: Berlin/Heidelberg, Germany, 2008; pp. 531–553. [Google Scholar]
- Lampin-Maillet, C.; Jappiot, M.; Long, M.; Bouillon, C.; Morge, D.; Ferrier, J.P. Mapping wildland-urban interfaces at large scales integrating housing density and vegetation aggregation for fire prevention in the South of France. J. Environ. Manage 2010, 91, 732–741. [Google Scholar] [Green Version]
- Foody, G.M. Status of land cover classification accuracy assessment. Remote Sens. Environ 2002, 80, 185–201. [Google Scholar]
- Grenier, M.; Labrecque, S.; Benoit, M.; Allard, M. Accuracy Assessment Method for Wetland Object-Based Classification. Proceedings of GEOBIA 2008, Calgary, AB, Canada, 6–7 August 2008; pp. 285–289.
- Schöpfer, E.; Lang, S. Object Fate Analysis—A Virtual Overlay Method for the Categorisation of Object Transition and Object-Based Accuracy Assessment. Proceedings of 1st International Conference on Object-Based Image Analysis (OBIA 2006), Salzburg, Austria, 4–5 July 2006.
- Tiede, D.; Lang, S.; Hoffmann, C. Supervised and Forest Type-Specific Multi-Scale Segmentation for a One-Level-Representation of Single Trees. Proceedings of 1st International Conference on Object-Based Image Analysis (OBIA 2006), Salzburg, Austria, 4–5 July 2006.
- Zhan, I.; Molenaar, M.; Tempfli, K.; Shi, W. Quality assessment for geo-spatial objects derived from remotely sensed data. Int. J. Remote Sens 2005, 26, 2953–2974. [Google Scholar]
- Congalton, R.G. Putting the Map Accuracy Map Back in Assessment; CRC Press, Taylor & Francis Group: Boca Raton, FL, USA, 2004; pp. 1–11. [Google Scholar]
- Congalton, R.G. A review of assessing the accuracy of classifications of remotely sensed data. Remote Sens. Environ 1991, 37, 35–46. [Google Scholar]
- Zhu, Z.; Yang, L.; Stehman, S.V.; Czaplewski, R.L. Accuracy assessment for the US Geological Survey regional land-cover mapping program: New York and New Jersey region. Photogramm. Eng. Remote Sensing 2000, 66, 1425–1438. [Google Scholar]
- Haralick, R.M.; Sternberg, S.R.; Zhuang, X. Image analysis using mathematical morphology. IEEE Trans. Pattern Anal. Machine Intell 1987, PAMI-9, 532–550. [Google Scholar]
- Le Corre, S.; Guillaume, R.; Galaup, M.; De Boissezon, H. Intérêts et Limites de l’Utilisation des Images Satellites en Vue de la Constitution d’un SIG pour la Région Urbaine d’Istanbul. Proceedings of Colloque “Représenter Istanbul hier et aujourd’hui”, Istanbul, Turkey, 19–20 May 2000; pp. 3–23.
- Robin, F.-X.; Gondeaux, P.; Vigné, P.; Demeules, V. Méthodes pour Réaliser un Suivi de l’Évolution du Bâti. Utilisation de Cartes Anciennes, du Cadastre et de Photographies Aériennes; Certu, CETE Normandie-Centre: Paris, France, 2007; p. 95. [Google Scholar]
- Serra, J. Cours de Morphologie Mathématique; Ecole des Mines de Paris: Paris, France, 2000. [Google Scholar]
- Ronse, C. Opérations Morphologiques de Base: Dilatation, Érosion, Ouverture et Fermeture Binaires; Laboratoire des Sciences de l’Image, de l’Informatique et de la Télédétection (LSIIT), UMR 7005 CNRS-UdS, Département d’Informatique de l’Université de Strasbourg: Strasbourg, France, 2009. [Google Scholar]
- Blanchard, C. Morphologie Floue et Transformée en Ondelettes sur des Images de Codes à Bulles; ENSICAEN: Caen, France, 2007; p. 22. [Google Scholar]
- Di Salvo, M. La Mesure de la Tache Urbaine en Basse-Normandie; DGUHC, Certu, DRE Basse-Normandie, CETE Normandie-Centre: Paris, France, 2004; p. 4. [Google Scholar]
Figure 1.
The study area in the Languedoc Roussillon region, in the South of France. The method was applied at the scale of the four coastal departments.
Figure 1.
The study area in the Languedoc Roussillon region, in the South of France. The method was applied at the scale of the four coastal departments.

Figure 2.
Order of steps in the fine characterization of artificial sprawl.

Figure 3.
OBIA procedure for mapping artificial areas from 2009 RapidEye images. This procedure is composed of two successive segmentation-classification steps.
Figure 3.
OBIA procedure for mapping artificial areas from 2009 RapidEye images. This procedure is composed of two successive segmentation-classification steps.

Figure 4.
The mathematical morphology operation used to produce an artificial patch. The process combines two basic operations, dilation and erosion to merge separate objects.
Figure 4.
The mathematical morphology operation used to produce an artificial patch. The process combines two basic operations, dilation and erosion to merge separate objects.

Figure 5.
Result of the classification: Artificial areas in 1996–1997 and 2009.

Figure 6.
Result of the dilation/erosion process: artificialized patches in 1996–1997 and 2009.

Figure 7.
Combining the artificialized patches enabled us to locate and quantify artificial sprawl between 1996–1997 and 2009—fine scale extract.
Figure 7.
Combining the artificialized patches enabled us to locate and quantify artificial sprawl between 1996–1997 and 2009—fine scale extract.

Figure 8.
Combining the artificialized patch enabled us to locate and quantify artificial sprawl between 1996–1997 and 2009: Coarse scale extract.
Figure 8.
Combining the artificialized patch enabled us to locate and quantify artificial sprawl between 1996–1997 and 2009: Coarse scale extract.

Figure 9.
Increase in artificial sprawl between 1996–1997 and 2009.


Table 1.
Characteristics of remotely sensed datasets: RapidEye and Indian Remote Sensing (IRS) satellite images (B: Blue; G: Green; R: Red; RE: Red Edge; NIR: Near infrared; SWIR: Shortwave Infrared).
| Satellite | Sensor | Footprint | Spatial Resolution | Spectral Resolution | Acquisition Date | Number of Blocks |
|---|---|---|---|---|---|---|
| RapidEye 1, 2, 3, 4, 5 | 25 km | 5 m | B, G, R, RE, NIR | Spring and summer 2009 | 65 | |
| IRS 1C | LISS | 70 km | 23 m | G, R, NIR, SWIR | Fall 1996 (3 images) Spring and summer 1997 (8 images) | 12 |
| IRS 1C | LISS | 70 km | 5.8 m | Panchromatic | Fall 1996 (3 images) Spring and summer 1997 (8 images) | 12 |
Table 2.
Parameters used in the multi-resolution segmentation and image object classification in 2009 and 1996–1997 of the OBIA (B = Blue, G = Green, R = Red, RE = Red Edge, NIR = Near infrared, PAN = IRS panchromatic; (1) and (2) = weight used in segmentation).
| Segmentation | Classification | |||||||||
|---|---|---|---|---|---|---|---|---|---|---|
| Parameters | Object Features | Illustration | ||||||||
| Spectral band and thematic layer | Scale | Form | Compactness | RapidEye | IRS | Thematic Layer | Context | |||
| 2009 | Phase 1 | RapidEye : B(1), G(1), R(1), RE(1), NIR(1) and roads | 750 | 0.4 | 0.6 | B: standard deviation, ratio, Haralick second moment, Haralick Contrast and Haralick dissimilarity G : mean of outer border and ratio RE : Mean of outer border NIR : mean Brightness NDVI | not used | roads | Distance to classes |  |
| Phase 2 | RapidEye : B(1), G(1), R(1), RE(1), NIR(1) and roads | 80 | 0.3 | 0.9 | B : mean, ratio, Haralick second moment, Haralick Contrast and Haralick dissimilarity R : ratio RE : ratio, standard deviation Brightness NDVI | not used | roads | Existence of super object Relative area of classes |  | |
| 1996–1997 | IRS : PAN(2) LISS(1) and artificial areas in 2009 | 35 | 0.1 | 0.5 | not used | PAN : Haralick entropy and Haralick contrast NDVI | artificial areas in 2009 | not used |  | |
| User Accuracy | Producer Accuracy | Overall Accuracy | ||
|---|---|---|---|---|
| 2009 | Artificial Areas | 86% | 80% | 90% |
| No Artificial Areas | 92% | 95% | ||
| 1996–1997 | Artificial Areas | 82% | 93% | 88% |
| No Artificial Areas | 94% | 85% |
| Area in hectares | ||||
|---|---|---|---|---|
| Name of Departments | Total Area (ha) | Artificialized Patch in 1996–1997 | Artificialized Patch in 2009 | Artificial Sprawl |
| Pyrénées-Orientales | 416,139 | 43,174 | 46,349 | 3,175 |
| Hérault | 624,789 | 77,475 | 84,470 | 6,995 |
| Gard | 588,826 | 68,746 | 75,583 | 6,837 |
| Aude | 634,700 | 53,000 | 55,304 | 2,304 |
| Total | 2,264,454 | 242,396 | 261,707 | 19,311 |
| Area in hectares | Artificial sprawl (%) | ||
|---|---|---|---|
| Artificialized patch in 1996–1997 | Artificialized patch in 2009 | ||
| Artificialized patch with roads | 242,396 | 261,707 | 8% |
| Artificialized patch without roads | 113,469 | 133,280 | 18% |
Share and Cite
MDPI and ACS Style
Dupuy, S.; Barbe, E.; Balestrat, M. An Object-Based Image Analysis Method for Monitoring Land Conversion by Artificial Sprawl Use of RapidEye and IRS Data. Remote Sens. 2012, 4, 404-423. https://doi.org/10.3390/rs4020404
AMA Style
Dupuy S, Barbe E, Balestrat M. An Object-Based Image Analysis Method for Monitoring Land Conversion by Artificial Sprawl Use of RapidEye and IRS Data. Remote Sensing. 2012; 4(2):404-423. https://doi.org/10.3390/rs4020404
Chicago/Turabian StyleDupuy, Stéphane, Eric Barbe, and Maud Balestrat. 2012. "An Object-Based Image Analysis Method for Monitoring Land Conversion by Artificial Sprawl Use of RapidEye and IRS Data" Remote Sensing 4, no. 2: 404-423. https://doi.org/10.3390/rs4020404