Burned Area Mapping in Greece Using SPOT-4 HRVIR Images and Object-Based Image Analysis


Laboratory of Forest Management and Remote Sensing, Aristotle University of Thessaloniki, P.O. Box 248, GR 54124 Thessaloniki, Greece
*
Author to whom correspondence should be addressed.
Remote Sens. 2012, 4(2), 424-438; https://doi.org/10.3390/rs4020424
Submission received: 6 December 2011
/
Revised: 17 January 2012
/
Accepted: 21 January 2012
/
Published: 3 February 2012
(This article belongs to the Special Issue Advances in Remote Sensing of Wildland Fires)
Abstract
:The devastating series of fire events that occurred during the summers of 2007 and 2009 in Greece made evident the need for an operational mechanism to map burned areas in an accurate and timely fashion to be developed. In this work, Système pour l’Observation de la Terre (SPOT)-4 HRVIR images are introduced in an object-based classification environment in order to develop a classification procedure for burned area mapping. The development of the procedure was based on two images and then tested for its transferability to other burned areas. Results from the SPOT-4 HRVIR burned area mapping showed very high classification accuracies (∼0.86 kappa coefficient), while the object-based classification procedure that was developed proved to be transferable when applied to other study areas.

1. Introduction
Accurate information relating to the impact of fire on the environment is a key factor in the following activities: quantifying the impact of fires on landscapes [1]; selecting and prioritizing treatments applied on site [2]; planning and monitoring restoration and recovery activities [3,4]; and providing baseline information for future monitoring [5]. Given the extremely broad spatial expanse and often limited accessibility of the areas affected by forest fire, satellite remote sensing is an essential technology for gathering post-fire-related information in a cost-effective and time-saving manner [2,3,6,7]. In recent years, an increase in the number of extreme fires has been observed in the European Mediterranean region; this is attributed to: (a) land-use changes; and (b) climatic warming [8]. The increasing trend in the occurrence of fire events has underlined the need for the development of a reliable procedure in order to map burned areas accurately and rapidly. The ability of such a procedure to assess the impact of fire on the environment in a timely and accurate fashion would make it applicable in other areas, such as the United Nations’ Reducing Emissions from Deforestation and Degradation (UN-REDD) collaborative program initiative. UN-REDD requires an understanding of the process of fire in forest systems and the calculation of greenhouse gas emissions due to vegetation fires [9].
Optical satellite data have been used extensively for many years in the detection and mapping of fire-affected areas [6,10–12]. This mapping has been based on the use of: (a) low-resolution data, such as Advanced Very High Resolution Radiometer (AVHRR) imagery from the National Oceanic and Atmospheric Administration (NOAA) satellite series [13–16], SPOT VEGETATION [17,18], and the Along Track Scanning Radiometer (ATSR) imagery [19]; (b) medium resolution data such as the Moderate Resolution Imaging Spectroradiometer (MODIS) [11,20], the Argentinian Satellite for Scientific Applications-C/Multispectral Medium Resolution Scanner (SAC-C/MMRS) [21], and the Medium Resolution Imaging Spectrometer (MERIS) imagery [22]; (c) high-resolution data such as the Landsat Thematic Mapper (TM) imagery [23,24]; and (d) very high-resolution data such as Ikonos imagery [25].
Mapping burned areas has been an important subject of research in remote sensing in the last decades. The most common image analysis techniques employed so far are: the principal component analysis [26,27], the spectral mixture analysis [28], logistic regression modeling [24,29], supervised classification [6], multitemporal image compositing algorithms [30,31], and spectral indices thresholding [32]. Recently, the support vector machines technique for burned area mapping was introduced for burned area mapping [33]. Although many different techniques have been used, however, the results of the application of the aforementioned methodologies have been reported to create various types of confusion between burned areas and other land cover types, such as water bodies and shadows, as well as confusion between slightly burned areas and unburned vegetation, which can affect the accuracy of mapping [24,32,34].
OBIA was recently introduced to the field of burned area mapping and has already showed promising results when using different types of satellite imagery, such as the Advanced Spaceborne Thermal Emission and Reflection Radiometer (ASTER) [35], NOAA/AVHRR [36], and Landsat-TM [12].
According to Blaschke [37] OBIA has been used in a wide array of environmental application areas: (1) land-cover/land-use mapping, (2) forest, vegetation and urban structure mapping, (3) mapping of habitats, (4) land cover change detection, (5) identification of urban features, and (6) detection of damaged areas. The basic processing units of object-based image analysis are image objects and not single pixels. According to Benz et al [38], the advantages of OBIA are: an increased uncorrelated feature space using shape (e.g., length, number of edges, etc.), topological features (e.g., neighbor, super-object, etc.), and the close relationship between real-world objects and image objects. This relationship has been reported to improve classification results [38].
Mitri and Gitas [12] developed a semi-automated object-based classification model to accurately map burned areas (∼96% overall accuracy) using Landsat images. The authors concluded that the accurate results obtained by object-based classification are mainly due to the ability of context-based classification to reduce the speckle in the classification. Moreover, Polychronaki and Gitas [35], Gitas et al [36] and Mitri and Gitas [12] concluded that the combination of object features, such as spectral values together with contextual information, made it possible to avoid confusion in the classification between burned areas and other land cover types.
Given the promising results of the aforementioned works, an investigation on the performance of the application of object-based classification applied to SPOT-4 HRVIR images in order to map burned areas is of high interest for the following reasons:
- SPOT data are easy to access through the European Space Agency (ESA). In 2006, ESA and SPOT Image signed a multiyear agreement permitting ESA-accepted Category-1 projects to order more than 10,000 images per year from the SPOT-1, 2, 3, and 4 satellites [39]. Investigators have since had the opportunity to acquire archived as well as new SPOT images with no or little cost for research and application development. Hence, the development of an operational classification methodology, such as the one aimed at in this work, could be employed to generate an historical fire-perimeter database using the extensive available archive of SPOT-4 images;
- Given the forthcoming launch of the Sentinel-2 mission, which is designed for the data continuity of SPOT-type missions [40], an investigation on the use of SPOT-4 HRVIR images for burned area mapping could indicate the potential of the Sentinel-2 data in this field. The spectral and spatial resolution of the two satellite products are similar [40], and it is estimated that a classification method for burned areas mapping, developed using SPOT-4 HRVIR images, could possibly be used with Sentinel-2 images.
The points mentioned above provide the motivation for this work, wherein a procedure is developed to map burned areas using object-based classification and SPOT-4 HRVIR. The specific objectives of this work are as follows:
- To develop an object-based classification procedure to map the burned areas of two regions in Greece by employing SPOT-4 HRVIR images;
- To test the transferability of the developed classification procedure to map the burned areas of two different regions in Greece.
2. Study Area and Datasets
This work investigates the fires that occurred during the summers of 2007 and 2009 in the Greek regions of the Peloponnese, East Attica, Pelion and Parnitha, (Figure 1). The area of the Peloponnese under investigation is covered mainly with maquis and agricultural areas, while the forested areas are mainly covered by black pine (Pinus nigra) and oak (Quercus sp). The area of East Attica, which is located north-east of Athens, is mainly covered by Aleppo pines (Pinus halepensis) and comprises agricultural and residential areas. Mount Pelion is located near the city of Volos, in central Greece. A large part of the area is forested, mainly with beech (Fagus sylvatica), and it is surrounded by maquis and agricultural areas. Mount Parnitha is situated in the north-western part of Athens and is covered with forests of Greek fir (Abies cephalonica) and Aleppo pine (Pinus halepensis); part of the mountain is designated as a national park.
During the summer of 2007, Greece faced the worst natural disaster recorded in recent decades in terms of human losses, the number of fire outbreaks, and the extent of the estimated burned area (more than 12% of the total forested areas in Greece) [41]. The first serious fire occurred at Mount Parnitha, where significant forested parts of Parnitha National Park were damaged. At the beginning of July 2007, a forested part of Mount Pelion was also affected by fires. Until early September 2007, the fires mainly affected large areas of western and southern Peloponnese. In the summer of 2009, a series of large wildfires also broke out; these mostly affected the area of East Attica. As a result, the pine forests and residential houses in the area were damaged.
Four SPOT-4 HRVIR (four bands: green, red, near-infrared (NIR) and short-wave-infrared (SWIR)) images were acquired very soon after the fire events that occurred in the four study areas (Table 1). In addition, due to the absence of official fire perimeters, three very high-resolution images (VHR), namely two SPOT-5 and one Ikonos pan-sharpened image, were acquired and were used to assess the classification accuracies of the burned areas.
3. Methodology
The methodology involved pre-processing of the SPOT-4 HRVIR images, development of the object-based classification procedure, and subsequently, examination of the transferability of the developed procedure. The different steps included in the method are discussed in detail below.
3.1. Dataset Pre-Processing
Pre-processing of the data involved the atmospheric correction of the four SPOT-4 HRVIR images. Atmospheric correction was applied to enhance the classification result and was considered essential given that the developed classification procedure would be implemented using different images acquired under different atmospheric conditions [42]. To convert the raw digital numbers (DN) to reflectance values, the Cosine of Solar Zenith Angle Correction (COST) method [43] was used. The images were later rescaled to 8-bit in order to make the classification procedure more computationally efficient.
The following step in the data pre-processing included the image-to-image geometric correction of the SPOT images employing the VHR images as reference images and using bilinear interpolation. The total RMS errors associated with the GCPs used to geometrically correct the SPOT-4 HRVIR images did not exceed 0.5 pixels.
Finally, reference burned area maps were generated from photointerpretation and digitization of the available VHR images. More specifically, polygons were created based on the photointerpretation of the VHR images. It has to be noted that for the East Attica study area no reference map was produced due to the unavailability of a VHR image.
3.2. Development of the Object-Based Classification Procedure
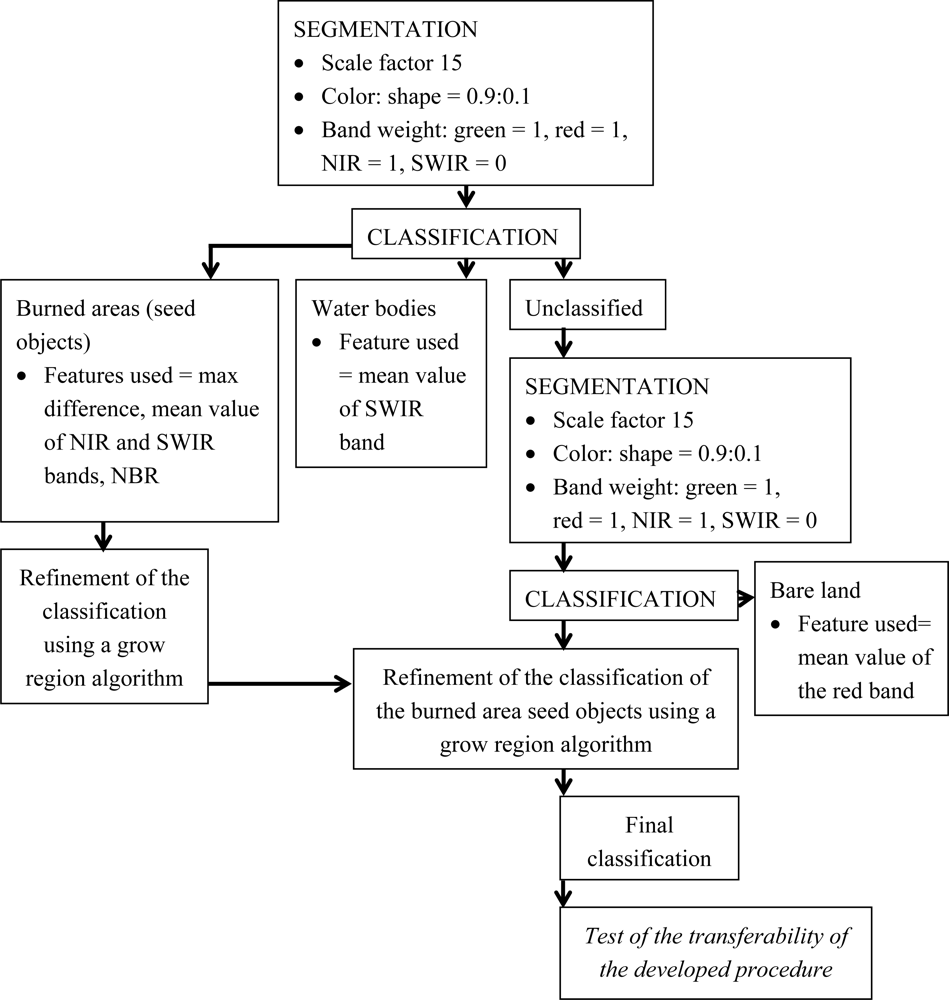
In order to build the object-based classification procedure two SPOT-4 HRVIR images were initially employed: one (image from the Peloponnese) for developing and the other (image from East Attica) for calibrating the classification procedure. The remaining two images (images from Pelion and Parnitha) were later used in the methodology to assess the transferability of the classification procedure. The basic actions carried out for the development of the procedure are discussed in the following paragraphs and depicted in the following flowchart (Figure 2). The eCognition Developer 8.0 software was used in this work.
The first action carried out was the segmentation of the image into objects. The resulting objects served as information carriers and building blocks for further classification and subsequent segmentation processes [38]. In order to determine the size of the objects, several parameters were defined, such as the scale parameter (unit less), the single layer weights, and the homogeneity criterion. The scale is an abstract term which determines the upper limit for a permitted change of heterogeneity throughout the segmentation process (the smaller the value the smaller the object’s size). Layer weights determined the degree to which information provided by each layer was used during the process of the object generation (values ranged from 0 to 1). The homogeneity criterion was used to determine which heterogeneity attributes of image objects were to be minimized as a result of a segmentation run. The homogeneity criterion is a combination of color (digital value of the resulting objects) and shape (defines the textural homogeneity of the resulting objects) criteria.
An image object is regarded as a ‘peer-reviewed’ image region refereed by a human expert [44]. To generate the appropriate size of the image objects a trial-and-error procedure was followed in order to choose the parameters for the segmentation: the green, red, and NIR bands were given layer weight one, while the SWIR band was given weight zero; the scale was 15, and the color criterion was given the maximum weight.
The next step involved the classification of the resulting image objects into two classes: “burned” and “water”. The image objects classified as “burned” at this stage represented seed objects (reliable burned objects) that would later be used for the final classification of the burned areas. The reason for creating the “water” class was that this class assisted in overcoming the confusion involved in detecting burned areas and water bodies in a subsequent step.
For each class a rule was defined. Such a rule can have one single object feature or can consist of a combination of several features that have to be fulfilled for an object to be assigned to a class. In this case it was found that applying thresholds to each of the selected features was adequate; fuzzy logic was not applied as was seen in previous works [12,35,36].
The optimum classification result was achieved when the rule of the class “burned” consisted of a combination of four object features, which are described in the following:
- The maximum difference, which is defined as the maximum difference between the mean values of each object for all bands (values for this feature are between 0 and 1);
- The mean value of the NIR band, which is defined as the mean intensity (pixel values) of all pixels of the NIR band forming an object (feature values for the 8-bit images used are between 0 and 255);
- The mean value of the SWIR band, which is defined as the mean intensity of all pixels of SWIR band forming an object (feature values for the 8-bit images used are between 0 and 255); and
- The normalized burn ratio (NBR) [24], which was found to be very useful in detecting the burned areas. The NBR is defined as follows:
The combination of the aforementioned features was able to overcome the inability of the single use of the NBR to distinguish burned areas from other land cover types such as water bodies and shadows. The threshold values that were used for each feature for the “burned” class were: maximum difference ≥ 0.4, mean value of NIR ≤ 60, mean value of SWIR ≥ 71, and mean value of NBR ≤ −0.2. In addition, the feature used to define the class “water” was the mean value of the SWIR band and the threshold value set for this feature was: mean value of SWIR ≤ 54.
The subsequent steps involved the refinement of the initial classification. This action was considered necessary because some objects located at the coastline were erroneously classified as “burned”. Therefore, all objects classified as “water” were first merged together in order to apply the procedure in a more computationally efficient manner, and then a grow region algorithm was employed. Under certain conditions, the algorithm extends all image objects with neighboring image objects of defined candidate classes-in this case objects classified as “burned”. The algorithm works in sweeps, which means that at each execution of the algorithm, it merges all direct neighboring image objects according to conditions applied [45]. For merging the objects, the condition applied was: “burned” objects with relative border to the “water” objects higher than 0.3, were merged with the “water” objects. The feature “relative border to” describes the ratio of the shared border length of “water” objects with neighboring “burned” objects to their total border length. In general, if the relative border of an image object to the image objects of a certain class is 1, the image object is totally embedded in this certain class [45].
Next, only the unclassified image objects were re-segmented. The purpose of this action was to generate objects of a smaller size, in order to classify smaller patches of burned areas that were not categorized in the previous classification step. A scale of 5 was used, while the other criteria were the same, as those mentioned earlier. In order to make the procedure computationally efficient for an operational application the re-segmentation was not executed for all unclassified objects of the scene but only for those which had a distance of 100 pixels from objects classified as “burned”. At this stage of the analysis it was found that an additional class, namely “bare land”, needed to be determined due to the confusion detected in the final classification between slightly burned areas and bare land. The feature “mean value of the red band” was found to be the most appropriate to map the bare land and the condition that was set for this feature was: mean value of red ≥ 200. Following the classification of the “bare land”, the grow region algorithm was used again. In this case, unclassified re-segmented objects were merged with the “burned” objects if their “mean value of NBR” was less than −0.15 (Figure 3).
The last step of the methodology involved the application of the developed object-based classification procedure described above to the remaining two SPOT-4 HRVIR images of the Pelion and Parnitha in order to test its transferability to map burned areas. The procedure exhibited satisfactory performance when applied to the two study areas, since no additional adjustments or modifications in the production line were necessary.
4. Results
4.1. Results of the Developed Object-Based Classification Procedure
To assess the ability of the developed object-based classification procedure to map burned areas accurately, the agreement between the burned area resulted from the developed classification procedure and the reference map, for the study area of Peloponnese, was estimated. Table 2 shows the results generated from the confusion matrix and Table 3 shows the results of the comparison between the burned area with the reference map in terms of spatial overlay and size.
The results show that the developed object-based classification procedure mapped the burned area with very high accuracy: 97.8% overall agreement with the reference map and the kappa coefficient was found to be 0.87. In addition, omission errors of the burned area were observed to be low (10.52%). Commission errors were slightly higher (12.24%), which could be attributed to the mosaic of burned and unburned areas dominated the study area. Comparing with the reference map, it was found that 90% of the burned area (52,062 ha) was common to both maps, while 5,422 ha were underestimated and 6449 ha were overestimated by the procedure.
4.2. Transferability Results
The transferability of the developed procedure was tested by comparing the OBIA resulted burned areas with the reference maps of Pelion and Parnitha. Table 4 includes the results generated from the confusion matrices while Table 5 reports the results from the spatial comparisons, for the two study areas.
Results show that the developed object-based classification procedure, when applied to both study areas, was able to map the burned areas with high accuracy: kappa coefficient was 0.88 and 0.83 for Pelion and Parnitha study areas, respectively. The classification procedure resulted in very low commission errors for the burned areas (9.59% and 1.92% for Pelion and Parnitha, respectively). Omission errors were higher, especially for Parnitha (14.30% and 21.86% for Pelion and Parnitha, respectively). These errors were mainly related to the misdetection of some slightly burned areas. Comparing with the reference maps, 758 ha and 1,081 ha were underestimated by the classification procedure for Pelion and Parnitha, respectively. Results indicate that the performance of the procedure was better at detecting the burned areas in the study area of Pelion in comparison to Parnitha. This could be attributed to the confusion observed between burned areas and shadowed areas located on high slopes in this area.
5. Discussion
This paper presented the development of an object-based classification procedure to map burned areas. The procedure was developed by using two SPOT-4 HRVIR scenes and subsequently applied to two additional scenes in order to investigate its transferability. Overall, the results showed that the developed procedure was able to map the burned areas with high accuracy and the procedure proved to be transferable.
The developed classification procedure started with the generation of image objects of appropriate size and was followed by the classification of burned area seed objects. A grow region algorithm was applied to the seed objects at a later step in order to refine the classification. The application of the algorithm only to objects that were at a specific distance from the burned area seed objects resulted in the development of a computational efficient procedure. In comparison to the work of Mitri and Gitas [12], where an object-based model was developed for burned area mapping using Landsat images, the structure of the classification procedure presented here is much simpler and more computationally efficient.
In relation to the classification accuracy assessment results, the lower commission errors observed in the case of Pelion and Parnitha could be attributed to the more homogeneous distribution of the burned area, in comparison with the case of the Peloponnese, where a mosaic of burned and unburned areas dominated the study area. This was also the case reported by Bastarrika et al [24]: their developed algorithm performed much better when the burned area was compact. The reason for the different distribution of the burned area could be related to differences in the type and spatial arrangement of the land cover types in the study areas. More specifically, the area in the Peloponnese is more heterogeneous and covered mainly with agricultural areas and shrublands, while the Pelion and Parnitha areas are characterized by more homogeneous areas of forest and shrubland. In addition, commission errors (12.24%) and the overestimation of the size of the burned area mapped in the case of the Peloponnese (6,449 ha) occurred due to the confusion between the burned area and a coal mine located in the study area.
In all study areas the omission errors and the underestimation of the size of the burned areas could be attributed to non-mapping of slightly burned areas that were sparsely or not at all vegetated before the fire event. The burning of these areas exposed the underlying bright soil, increasing thus the surface reflectance [46] and making their mapping as burned areas very difficult when SPOT-4 images were used. Furthermore, in the case of Parnitha it was observed that some burned areas located on high slopes could not be mapped by the developed classification procedure, due to the spectral similarity of the aforementioned areas with shadowed areas. Thus, a further improvement of the classification results could involve topographic correction of the SPOT-4 HRVIR images prior to the implementation of the developed classification procedure presented in this work, even though Mitri and Gitas [12] concluded that a topographic correction increased only marginally the accuracy of object-based classification. In addition, the higher omission errors (21.86%) and the underestimation of the size of the burned area (1,081 ha) in Parnitha could be attributed to the use of VHR images as reference data due to their ability to discriminate better burned from non-burned areas. The same applies to the cases of the Peloponnese and Pelion.
In addition, the use of spectral information (NBR index, SWIR, NIR channels) in combination with contextual information exhibited success in overcoming most of the confusion existing between burned areas and other land cover types, such as water bodies and shadows. In a recent work, Bastarrika et al [24] used logistic regression by employing spectral indices derived from Landsat images. A two-phase methodology was developed: at phase one the seed (core) burned pixels were detected while at phase two a region-growing algorithm was applied in order map the burned areas. However, the authors reported that confusion between burned areas and arable land could not be diminished. In the work of Stroppiana et al [47], revised layers were input for a region-growing algorithm to produce a map of burned areas using spectral indices derived from Landsat images. The authors reported that their method was able to successfully overcome any confusion. However, their proposed methodology was applied to a small area and was evaluated over one Landsat scene; hence the preliminary results presented in their work need to be taken carefully into account.
6. Conclusions
The potential of SPOT-4 HRVIR imagery for burned area mapping was investigated in this work. Satellite imagery was introduced in an object-based classification environment in order to develop an appropriate classification procedure. As a result, very high classification accuracies were achieved (kappa coefficient ∼0.85) and spatial comparisons of the resulting classification maps with reference maps showed very high degrees of consistency both in spatial overlap (∼85%) and in total burned area. In addition, the object-based classification procedure proved to be transferable, since it was able to map the burned areas with high accuracy; this indicates its potential for use on an operational basis.
The use of spectral information in combination with contextual information could overcome much of the existing confusion between burned areas and other land cover types, such as water bodies and shadows. Nevertheless, further investigation should include the topographic correction of the images prior to the implementation of the developed procedure.
The results showed that SPOT-4 HRVIR and object-based analysis can be used for accurately mapping burned areas in different regions in Greece. Future work will include testing the performance of the developed classification procedure in other regions of the Mediterranean area and in different ecosystems. In addition, future investigation could include the development of a similar classification procedure, to the one presented in this work, to be used with the forthcoming Sentinel-2 data; in this way the transferability of the methodology could be further examined.
Acknowledgments
Data for this work were obtained through the ESA cat-1 project 7204. Authors would like to thank the anonymous reviewers for their constructive comments and remarks.
References
- van Wagtendonk, J.; Root, R.; Key, C.; Running, S. Comparison of AVIRIS and Landsat ETM+ Detection Capabilities for Burn Severity. Int. J. Wildland Fire 2004, 92, 397–408. [Google Scholar]
- Patterson, M.; Yool, S. Mapping fire-induced vegetation mortality using Landsat Thematic Mapper Data: A comparison of linear transformation techniques. Remote Sens. Environ 1998, 65, 132–142. [Google Scholar]
- Jakubauskas, M.; Lulla, K.; Mausel, P. Assessment of Vegetation Change in a Fire-altered Forest Landscape. Photogramm. Eng. Remote Sensing 1990, 56, 371–377. [Google Scholar]
- Gitas, I. Geographical Information Systems and Remote Sensing in Mapping and Monitoring Fire-altered Forest Landscapes. Ph.D. Dissertation. Department of Geography, University of Cambridge, Cambridge, UK. 1999. [Google Scholar]
- Brewer, C.K.; Winne, J.C.; Redmond, R.L.; Opitz, D.W.; Mangrich, M.V. Classifying and mapping wildfire severity: A comparison of methods. Photogramm. Eng. Remote Sensing 2005, 71, 1311–1320. [Google Scholar]
- Chuvieco, E.; Congalton, R. Mapping and inventory of forest fires from digital processing of TM data. Geocarto Int 1988, 4, 41–53. [Google Scholar]
- White, J.; Ryan, K.; Key, C.; Running, S. Remote sensing of forest fire severity and vegetation recovery. Int. J. Wildland Fire 1996, 6, 125–136. [Google Scholar]
- Chuvieco, E. The Role of Fire in European Mediterranean ecosystems. In Remote Sensing of Large Wildfires in the European Mediterranean Basin; Chuvieco, E., Ed.; Springer-Verlag: Berlin, Germany, 1999; pp. 6–7. [Google Scholar]
- GOFC-GOLD, A Sourcebook of Methods and Procedures for Monitoring and Reporting Anthropogenic Greenhouse Gas Emissions and Removals Caused by Deforestation, Gains and Losses of Carbon Stocks in Forests Remaining Forests, and Forestation; GOFC-GOLD Report Version COP16-1; GOFC-GOLD Project Office, Natural Resources Canada: Edmonton, AB, Canada, 2010.
- Siljeström, P.; Moreno, A. Monitoring burnt areas by principal components analysis of multi-temporal TM data. Int. J. Remote Sens 1995, 16, 1577–1587. [Google Scholar]
- Roy, P.D.; Lewis, O.C. Burned area mapping using multi-temporal moderate spatial resolution data—A bi-directional reflectance model-based expectation approach. Remote Sens. Environ 2002, 83, 263–286. [Google Scholar]
- Mitri, G.H.; Gitas, I.Z. A Semi-automated object-oriented model for burned area mapping in the Mediterranean Region using Landsat-TM imagery. Int. J. Wildland Fire 2004, 13, 367–376. [Google Scholar]
- Pereira, J.M.C.; Sa, A.C.L.; Sousa, A.M.O.; Martín, M.P.; Chuvieco, E. Regional-scale burnt area mapping in Southern Europe using NOAA-AVHRR 1 km data. In Remote Sensing of Large Wildfires in the European Mediterranean Basin; Chuvieco, E., Ed.; Springer-Verlag: Berlin, Germany, 1999; pp. 139–155. [Google Scholar]
- Fraser, R.H.; Li, Z.; Cihlar, J. Hotspot and NDVI Differencing Synergy (HANDS): A new technique for burned area mapping over boreal forest. Remote Sens. Environ 2000, 74, 362–376. [Google Scholar]
- Chuvieco, E.; Ventura, G.; Martín, M.P. AVHRR multitemporal compositing techniques for burned land mapping. Int. J. Remote Sens 2005, 26, 1013–1018. [Google Scholar]
- Chuvieco, E.; Englefield, P.; Trishchenko, A.P.; Luo, Y. Generation of long time series of burn area maps of the boreal forest from NOAA–AVHRR composite data. Remote Sens. Environ 2008, 112, 2381–2396. [Google Scholar]
- Stroppiana, D.; Pinnock, S.; Pereira, J.M.C.; Grégoire, J.M. Radiometric analysis of SPOT-VEGETATION images for burnt area detection in Northern Australia. Remote Sens. Environ 2002, 82, 21–37. [Google Scholar]
- Grégoire, J.M.; Tansey, K.; Silva, J.M.N. The GBA2000 Initiative: Developing a global burned area database from SPOT-VEGETATION imagery. Int. J. Remote Sens 2003, 24, 1369–1376. [Google Scholar]
- Eva, H.; Lambin, E.F. Burnt area mapping in Central Africa using ATSR data. Int. J. Remote Sens 1998, 19, 3473–3497. [Google Scholar]
- Loboda, T.V.; Hoy, E.E.; Giglio, L.; Kasischke, E.S. Mapping burned area in Alaska using MODIS data: A data limitations-driven modification to the regional burned area algorithm. Int. J. Wildland Fire 2011, 20, 487–496. [Google Scholar]
- García, M.; Chuvieco, E. Assessment of the potential of SAC-C/MMRS imagery for mapping burned areas in Spain. Remote Sens. Environ 2004, 92, 414–423. [Google Scholar]
- Oliva, P.; Martín, P.; Chuvieco, E. Burned area mapping with MERIS post fire image. Int. J. Remote Sens 2011, 32, 4175–4201. [Google Scholar]
- Koutsias, N.; Karteris, M.; Chuvieco, E. The use of Intensity-Hue-Saturation transformation of Landsat-5 Thematic Mapper Data for burned land mapping. Photogramm. Eng. Remote Sensing 2000, 66, 829–839. [Google Scholar]
- Bastarrika, A.; Chuvieco, E.; Martín, M.P. Mapping burned areas from Landsat TM/ETM+ data with a two-phase algorithm: Balancing omission and commission errors. Remote Sens. Environ 2011, 115, 1003–1012. [Google Scholar]
- Mitri, G.H.; Gitas, I.Z. Fire type mapping using object-based classification of IKONOS imagery. Int. J. Wildland Fire 2006, 15, 457–462. [Google Scholar]
- Richards, J.A. Thematic mapping from multispectral image data using the principal components transformation. Remote Sens. Environ 1984, 16, 35–46. [Google Scholar]
- Siljeström, P.; Moreno, A. Monitoring burnt areas by principal components analysis of multi-temporal TM data. Int. J. Remote Sens 1995, 16, 1577–1587. [Google Scholar]
- Quintano, C.; Fernández-Manso, A.; Fernández-Manso, O.; Shimabukuro, Y.E. Mapping burned areas in Mediterranean countries using spectral mixture analysis from a uni-temporal perspective. Int. J. Remote Sens 2006, 27, 645–662. [Google Scholar]
- Koutsias, N.; Karteris, M. Burned area mapping using logistic regression modeling of a single post-fire Landsat-5 Thematic Mapper image. Int. J. Remote Sens 2000, 21, 673–687. [Google Scholar]
- Sousa, M.O.; Pereira, J.M.C.; Silva, J.M.N. Evaluating the performance of multitemporal image compositing algorithms for burned area analysis. Int. J. Remote Sens 2003, 24, 1219–1236. [Google Scholar]
- Chuvieco, E.; Ventura, G.; Martín, M.P.; Gómez, I. Assessment of multitemporal compositing techniques of MODIS and AVHRR images for burned land mapping. Remote Sens. Environ 2005, 94, 450–462. [Google Scholar]
- Chuvieco, E.; Martín, M.P.; Palacios, A. Assessment of different spectral indices in the Red-Near-infrared spectral domain for burned land discrimination. Int. J. Remote Sens 2002, 23, 5103–5110. [Google Scholar]
- Cao, X.; Chen, J.; Matsushita, B.; Imura, H.; Wang, L. An automatic method for burn scar mapping using Support Vector Machines. Int. J. Remote Sens 2009, 30, 577–594. [Google Scholar]
- Koutsias, N.; Karteris, M.; Fernández-Palacios, A.; Navarro, C.; Jurado, J.; Navarro, R.; Lobo, A. Burnt land mapping at local scale. In Remote Sensing of Large Wildfires in the European Mediterranean Basin; Chuvieco, E., Ed.; Springer-Verlag: Berlin, Germany, 1999; pp. 163–164. [Google Scholar]
- Polychronaki, A.; Gitas, I.Z. The Development of an operational procedure for burned-area mapping using object-based classification and ASTER imagery. Int. J. Remote Sens 2010, 31, 1113–1120. [Google Scholar]
- Gitas, I.Z.; Mitri, G.H.; Ventura, G. Object-based image classification for burned area mapping of Creus Cape, Spain, using NOAA-AVHRR imagery. Remote Sens. Environ 2004, 92, 409–413. [Google Scholar]
- Blaschke, T. Object based image analysis for remote sensing. ISPRS J. Photogramm 2010, 65, 2–16. [Google Scholar]
- Benz, U.C.; Hofmann, P.; Willhauck, G.; Lingenfelder, I.; Heynen, M. Multi-resolution, object-oriented fuzzy analysis of remote sensing data for GIS-ready information. ISPRS J. Photogramm 2004, 58, 239–258. [Google Scholar]
- European Space Agency. ESA and SPOT Image Set Precedence with Data Sharing. 2006. Available online: http://www.esa.int/esaEO/SEM0PEAATME_index_0.html (accessed on 10 October 2011).
- Martimort, P. Sentinel-2, the optical high-resolution mission for GMES operational services. ESA Bull 2007, 131, 18–23. [Google Scholar]
- Gitas, I.Z.; Polychronaki, A.; Katagis, T.; Mallinis, G. Contribution of remote sensing to disaster management activities: A case study of the large fires in the Peloponnese, Greece. Int. J. Remote Sens 2008, 29, 1847–1853. [Google Scholar]
- Mather, P.M. Pre-processing of remotely-sensed data. In Computer Processing of Remotely-Sensed Images: An Introduction, 3rd ed.; Mather, P.M., Ed.; John Wiley and Sons, Ltd: Chichester, UK, 2004; pp. 80–119. [Google Scholar]
- Chavez, P. Image-based atmospheric corrections—Revisited and improved. Photogramm. Eng. Remote Sensing 1996, 6, 1025–1036. [Google Scholar]
- Lang, S. Object-based image analysis for remote sensing applications: Modeling reality, dealing with complexity. In Object-Based Image Analysis: Spatial Concepts for Knowledge-Driven Remote Sensing Applications; Blascke, T., Lang, S., Hay, G.J., Eds.; Springer-Verlag: Berlin/Heidelberg, Germany, 2008; p. 13. [Google Scholar]
- Definiens, eCognition 8.0.1 Reference Book; Definiens: Munich, Germany, 2010.
- Roy, D.P.; Frost, P.G.H.; Justice, C.O.; Landmann, T.; Le Roux, J.L.; Gumbo, K.; Makungwa, S.; Dunham, K.; Toit, R.D.; Mhwandagara, K.; et al. The Southern Africa Fire Network (SAFNet) regional burned-area product-validation protocol. Int. J. Remote Sens 2005, 26, 4265–4292. [Google Scholar]
- Stroppiana, D.; Bordogna, G.; Boschetti, M.; Carrara, P. Positive and negative information for assessing and revising scores of burn evidence. IEEE Geosci. Remote Sens. Lett 2012, in press. [Google Scholar]
Figure 1.
Location of the four study areas, extent of each image (orange boxes) and corresponding available SPOT-4 HRVIR images: (1) Peloponnese, (2) East Attica, (3) Parnitha, and (4) Pelion.
Figure 1.
Location of the four study areas, extent of each image (orange boxes) and corresponding available SPOT-4 HRVIR images: (1) Peloponnese, (2) East Attica, (3) Parnitha, and (4) Pelion.

Figure 2.
Flowchart of the methodology followed during the development of the classification procedure.
Figure 2.
Flowchart of the methodology followed during the development of the classification procedure.

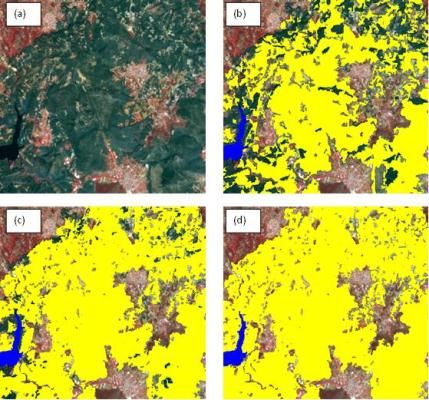
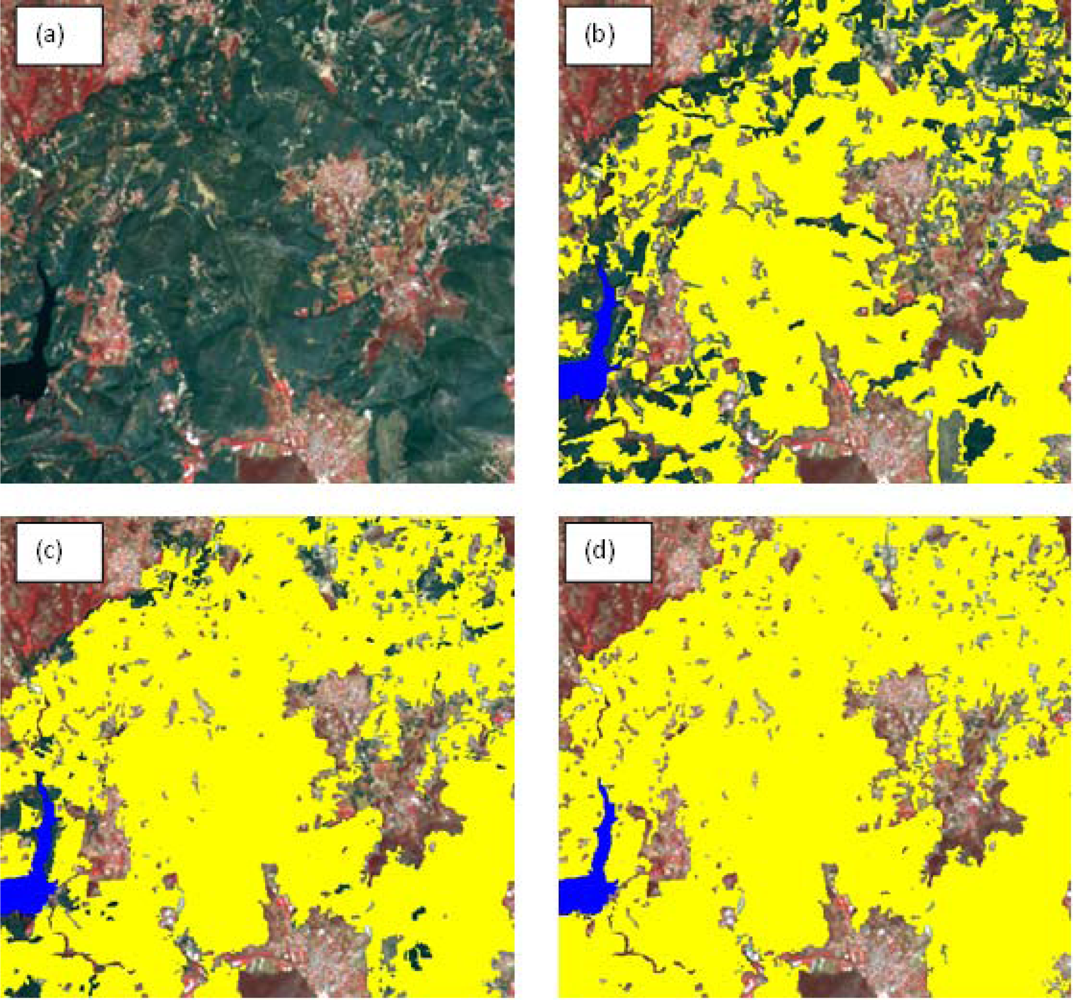
Figure 3.
(a) Detail of the SPOT-4 HRVIR image depicting the East Attica fire (R: NIR band, G: red band, B: green band), (b) classification of the seed burned area objects (in yellow) and water bodies (in blue), (c) refinement of the classification using the grow region algorithm. Unclassified objects with a mean value of NBR less than −0.15 were finally merged with objects classified as “burned”, (d) final classification of the burned areas.


| Study Area | EO Data (Spatial Resolution) | Acquisition Date | Date of Fire Event |
|---|---|---|---|
| Parnitha | SPOT-4 HRVIR 2 (20 m) | 2007-08-03 | 2007-06-28 |
| Parnitha | IKONOS PAN/MSI (1 m) | 2007-07-08 | 2007-06-28 |
| East Attica | SPOT-4 HRVIR 1 (20 m) | 2009-08-27 | 2009-08-24 |
| Peloponnese | SPOT-4 HRVIR 2 (20 m) | 2007-09-09 | 2007-08-30 |
| Peloponnese | SPOT-5 HRG 1 (10 m) | 2007-09-02 | 2007-08-30 |
| Pelion | SPOT-4 HRVIR 1 (20 m) | 2007-07-29 | 2007-07-07 |
| Pelion | SPOT-5 HRG 2 (2.5 m) | 2007-07-23 | 2007-07-07 |
Table 2.
Omission (OE) and Commission (CE) errors for burned and unburned areas, kappa coefficients and overall agreement for the study area of the Peloponnese.
| Study Area | OE (%) Burned Area | OE (%) Unburned Area | CE (%) Burned Area | CE (%) Unburned Area | Kappa Coefficient | Overall Agreement (%) |
|---|---|---|---|---|---|---|
| Peloponnese | 10.52 | 1.30 | 12.24 | 1.10 | 0.87 | 97.8 |
Table 3.
Sizes of the burned areas and results of the spatial overlays between the reference map and the object-based classification result for the study area of the Peloponnese.
| Study Area | Reference Map (ha) | Object-Based Classification (ha) | Common Area (ha) | Burned Area Not Mapped by OBIA (ha) | Burned Area Mapped only by OBIA ha) |
|---|---|---|---|---|---|
| Peloponnese | 52,062 | 53,089 | 46,640 (90%) | 5,422 (10.4%) | 6,449 (12%) |
Table 4.
Omission (OE) and Commission (CE) errors for burned and unburned areas, kappa coefficients and overall agreement for the study areas of Pelion and Parnitha.
| Study Area | OE (%) Burned Area | OE (%) Unburned Area | CE (%) Burned Area | CE (%) Unburned Area | Kappa Coefficient | Overall Agreement (%) |
|---|---|---|---|---|---|---|
| Pelion | 14.30 | 0.08 | 9.59 | 0.13 | 0.88 | 99.7 |
| Parnitha | 21.86 | 0.55 | 1.92 | 7.30 | 0.83 | 93.8 |
Table 5.
Sizes of the burned areas and results of the spatial overlays between the reference map and the object-based classification result for the study areas of Pelion and Parnitha.
| Study Area | Reference Map (ha) | Object-Based Classification (ha) | Common Area (ha) | Burned Area not Mapped by OBIA (ha) | Burned Area Mapped only by OBIA (ha) |
|---|---|---|---|---|---|
| Pelion | 5372 | 5092 | 4614 (85%) | 758 (14%) | 478 (9.4%) |
| Parnitha | 4944 | 3939 | 3863 (78%) | 1081 (22%) | 76 (1.9%) |
Share and Cite
MDPI and ACS Style
Polychronaki, A.; Gitas, I.Z. Burned Area Mapping in Greece Using SPOT-4 HRVIR Images and Object-Based Image Analysis. Remote Sens. 2012, 4, 424-438. https://doi.org/10.3390/rs4020424
AMA Style
Polychronaki A, Gitas IZ. Burned Area Mapping in Greece Using SPOT-4 HRVIR Images and Object-Based Image Analysis. Remote Sensing. 2012; 4(2):424-438. https://doi.org/10.3390/rs4020424
Chicago/Turabian StylePolychronaki, Anastasia, and Ioannis Z. Gitas. 2012. "Burned Area Mapping in Greece Using SPOT-4 HRVIR Images and Object-Based Image Analysis" Remote Sensing 4, no. 2: 424-438. https://doi.org/10.3390/rs4020424