1. Introduction
The high overall resilience of the Yamal Nenets social-ecological system (SES) in West Siberia has recently been addressed [
1]. The Yamal-Nenets Autonomous Okrug (YNAO) has been subject to extensive gas exploration [
1–
3] climate warming [
4,
5] and post-Soviet socio-economic upheaval [
1–
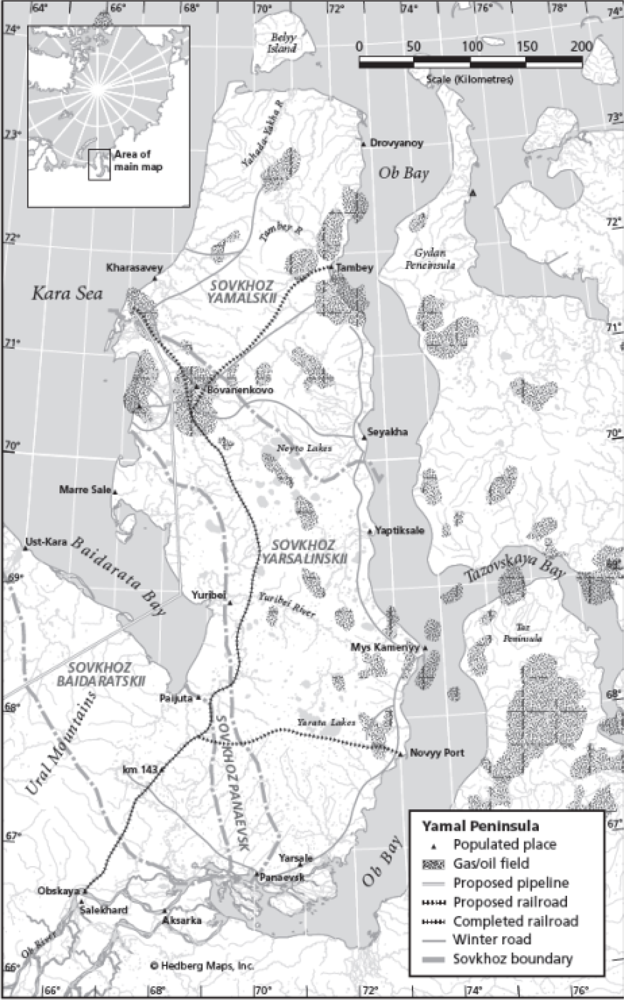
3]. The SES has continued to function well during the last 2–3 decades of rapid change, due in large part to unfettered access to pastures and the fact that only a few out of several dozen collective and private management units actively migrating on the Yamal Peninsula (
Figure 1) were severely affected at the time of the initial study (2004–2007) [
1,
3].
The hydrocarbon industry is presently the source of most ecological changes in the West Siberian tundra and socio-economic impacts experienced by migratory Nenets reindeer herders who move annually between winter pastures at treeline and the coastal summer pastures by the Kara Sea [
1,
2,
6]. Giant gas fields on the Yamal Peninsula are expected to begin feeding the Nord Stream pipeline to Western Europe in late 2012 [
7,
8]. The tundra zone of Yamal has until recently experienced minimal exploitation of its natural resources beyond fish, fur and reindeer meat [
9]. YNAO, like all territories with sizable hydrocarbon reserves in the circumpolar Arctic, is facing extensive land use and land cover changes over the coming years and decades [
10,
11]. As a consequence, migratory Nenets reindeer herding is under pressure to contract and decline or adapt to ever more fragmented spring, summer and autumn pastures shared with several thousand newcomers comprising a non-indigenous workforce. It is important to note that in spite of rapidly intensifying industrial, socio-economic and environmental pressures in recent decades, the Yamal Peninsula continues to experience a growing number of Nenets households and growing numbers of herded reindeer [
1,
6]. Broader general awareness within oil and gas companies, coupled with increased concern of their public image, has improved somewhat the ability of Nenets to negotiate on preferable pipeline routing and compensation regimes [
9,
12,
13]. When satellite remote sensing is employed in studies of reindeer rangelands in the Russian Arctic, the focus to date has generally been on detecting the visible industrial footprint at a given point in time [
14–
18]. We are not aware of previous studies that have published time series analyses of satellite imagery encompassing the combined social-ecological milieu during the course of oil and gas development in Arctic Russia.
Remote sensing provides an efficient tool to investigate human induced changes in land cover and land use. Landsat provides the longest lifespan of available imagery, covering terrestrial areas from 1972 to the present day. Although Landsat’s spatial resolution is relatively coarse (MSS = 70 m, TM/ETM+ = 30 m), it proves to be accurate enough in the study of large-scale gas field development in otherwise undisturbed tundra environments. The utility of different satellite imagery for certain applications, such as assessment of human induced changes in tundra land cover, always depends on key questions; (1) what is the scale of impact that is under investigation; and (2) what is the spatial and spectral scale of the available satellite imagery? By coupling Landsat with higher resolution imagery, e.g., SPOT, ASTER VNIR or Quickbird-2 (for spatial resolution see
Table 1), more detailed investigations of impacts can be conducted. Satellite imagery, combined with detailed onsite field observations and measurements and social science field surveys, ensures the accurate interpretation of gas field developments and environmental changes [
1–
3].
The present contribution builds on the authors’ previously published analyses with new data from 2010–2011 and focuses on: (1) detailing the timeline of development by combining remote sensing change detection procedures at various scales with intensive ground truthing and social anthropological field surveys; (2) quantifying the extent of visible impacts and transformations in land cover; (3) linking the different stages of infrastructure expansion to responses among the nomadic Nenets population; and (4) assessing the ability of the existing governance regime to facilitate adaptation in real time as the gas field quickly gears up for its first phase of production, possibly in autumn 2012.
3. Data and Methods
3.1. Remote Sensing
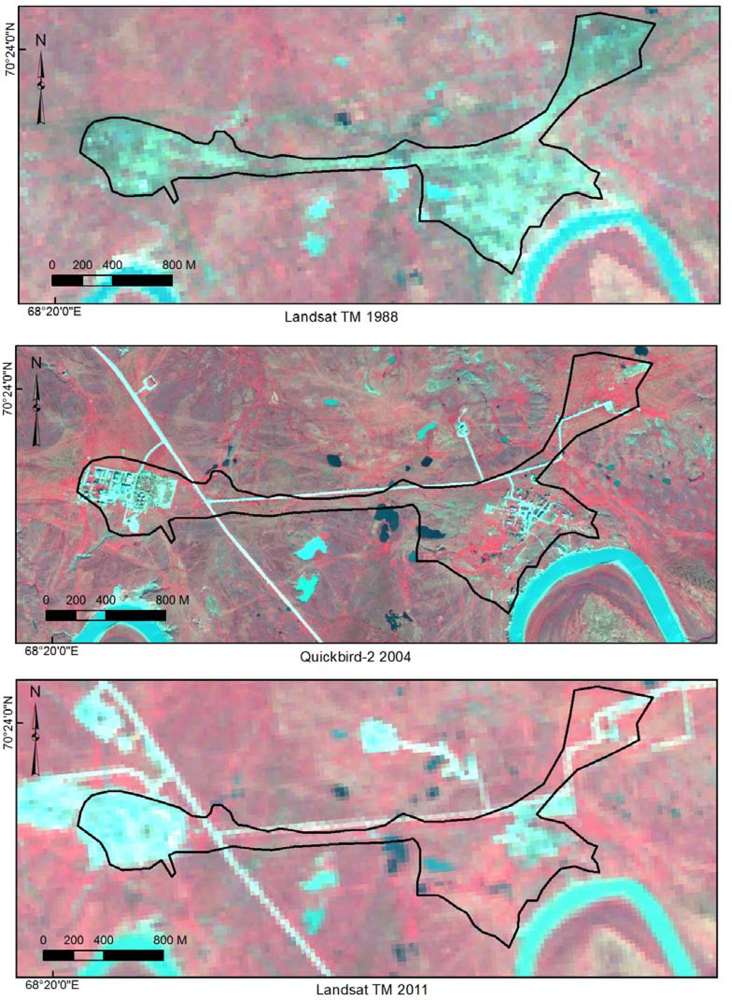
The time span of the present study begins in 1984 with a Landsat MSS image showing the Bovanenkovo area before any significant gas exploration related impacts had occurred. A Landsat TM image from late summer 1988 already reveals that significant exploration activities had begun earlier the same year. Subsequent imagery (see
Table 1) covers the years 1993, 1998, 2000, 2001, 2004, 2010 up to the latest Landsat TM image from summer 2011. With these images our analysis encompasses 27 years, of which 23 years track the period of gas field development.
Our first goal has been to investigate fine and local-to-landscape scale impacts of gas exploration activities on reindeer pastures specifically, and nomadic reindeer herding in the vicinity of the gas field during the past 23 years. Investigation of the 2,052 km2 large Bovanenkovo gas field is necessarily based on lower resolution imagery, such as Landsat (MSS, TM, ETM+), SPOT (Systeme Pour l’Observation de la Terre) and ASTER (Advanced Spaceborne Thermal Emission and Reflection Radiometer) VNIR (Visible Near Infrared). We were also able to include Very High Resolution imagery (Quickbird-2 and GeoEye) in our analysis, which improved the interpretation of coarser imagery.
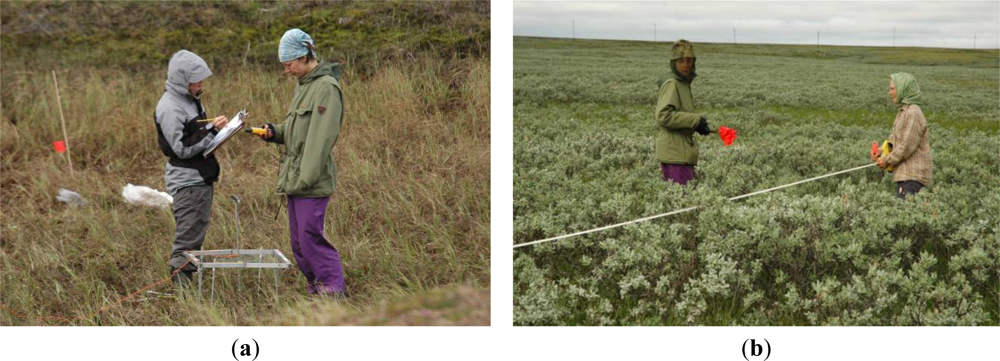
Field observations and measurements were conducted in the summers of 2004, 2005 and 2011. Data were collected for satellite image interpretation and classification, vegetation classification, and industrial disturbance evaluation. Each of the selected ground-level study plots was additionally inventoried in the field and represented a homogeneous vegetation or land use type. 250 field study plots were selected according to a stratified random protocol. From within the subjectively determined main vegetation types and land use patterns 5–10 sample quadrats of 50 cm × 50 cm (total circa 800 quadrats) were randomly placed in each of the vegetation types identified at all sites, which represented circa 15–20 different classes of land cover, including bare ground. Percentage of vegetation cover and bare ground was estimated visually and plant species composition was determined to the lowest possible taxon for vascular plants, bryophytes and lichens. Average height of the plants was also measured. The locations of the field study plots were marked using GPS with an accuracy of 3–8 m. Satellite imagery was analyzed with ERDAS Imagine, Versions 9.3–10 and with ArcGIS, Versions 9.2–11. Quickbird-2, ASTER VNIR and Landsat images acquired and downloaded from www-servers were in a Universal Transverse Mercator (UTM) projection and World Geodetic System 1984 (WGS84) datum. Then they were re-projected into UTM WGS84 zone 42N and finally synchronized to match each other using ERDAS Imagine, software’s AutoSync-module. Anthropogenic impacts were interpreted and digitized from Quickbird-2, GeoEye, ASTER VNIR, SPOT and Landsat MSS/TM/ETM+ images. For the next step, the spatial extents of the respective linear impacts (e.g., off-road vehicle tracks, roads, pipelines, railroad) were calculated using various sizes of buffers. To estimate the capacity of different satellite systems to detect disturbances’ impacts at different scales and of different sizes, field data, ground photographs and photographs taken from helicopter were used. Reindeer herders’ migration routes and brigadiers’ notes on satellite image printouts in the field interviews were later digitized as shape files in GIS-format. A map depicting the total area of cumulative disturbances around the Bovanenkovo gas field was produced.
3.2. Participant Observation
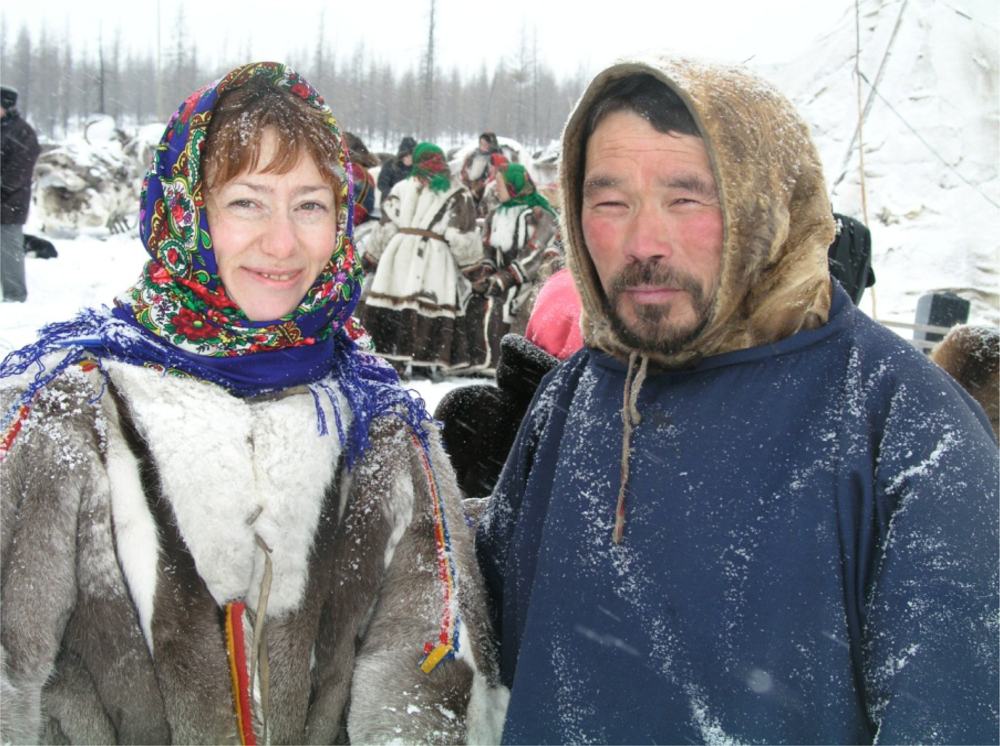
Social anthropological fieldwork consisted mainly of participant observation with herders and long-term (>17 years) gas field personnel (
Figure 2). Work with herders took place in summer 2005, building on preliminary interviews in spring 2005 and earlier fieldwork between 1998 and 2001 [
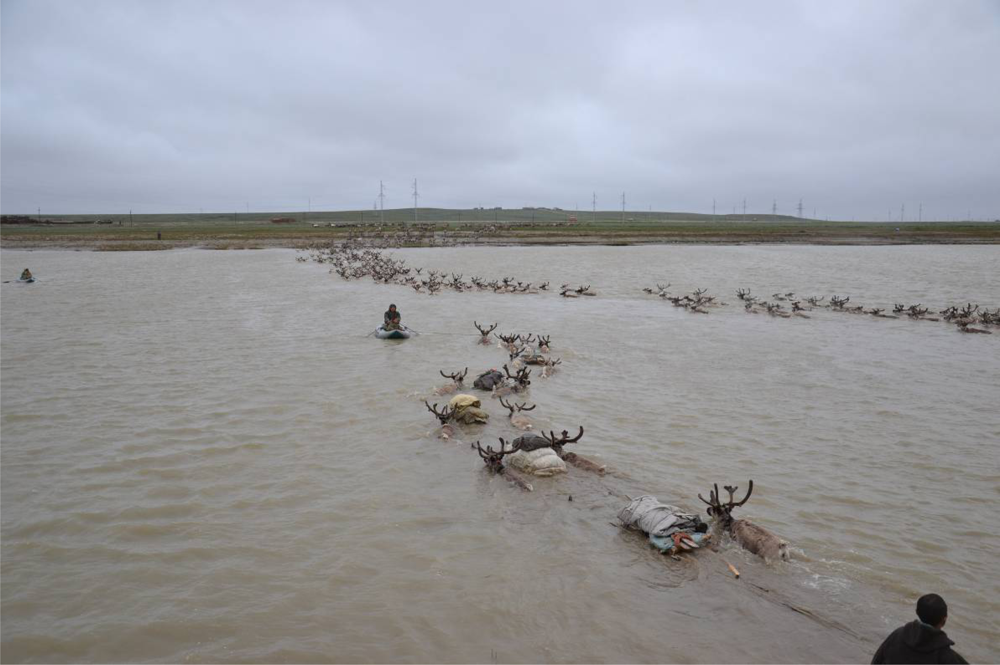
9]. Gas workers were interviewed, beginning in summer 2004, and continuing in summer 2005. Fieldwork involved migrating with the herders of camps 2, 4 and 8 from the sovkhoz Yarsalinskii. The camps were accompanied while approaching the industrial impact zone starting at 70°15.385′N, 68°44.785′E, then crossing the Se Yakha River and moving through the area of the gas deposit along roads, quarries, pipelines and industrial production bases, until leaving further north towards the shore of the Kara Sea ending at 70°27.870′N, 68°03.969′E (
Figure 3). Participant observation with gas field workers involved accompanying them on excursions in the vicinity of the gas field by truck,
vezdekhod (off-road vehicle), boat and helicopter, mainly for purposes of trading velvet reindeer antlers with herders. Regular follow-up meetings with key figures from herding and the gas industry were held between 2006 and 2010, usually just before the herders’ spring migration or during seminars in the capital of Salekhard and during an international participatory workshop held in Rovaniemi, Finland in December 2007 [
13]. Follow-up fieldwork took place in summer 2011 with herders of camps 4 and 8 and with the same gas field personnel originally interviewed circa 2004–2005. During the 2011 fieldwork, gas field workers were occupied with facilitating the migration of herders through the gas field (
Figures 3 and
4). This activity was in addition to the usual trading for goods, such as bread, tea, and other foods, kerosene for lamps, and gasoline for running the generators that are now carried by most camps during migration.
Herders have very intimate knowledge and monitor ongoing environmental changes on a daily basis during their herding activity throughout the year. Migration through the gas deposit occupies only about two months per year, however. In order to understand industrial impacts for the yearly lifecycle in their entirety, fieldwork is essential not only during the time of crossing industrial impact zones but also during other seasons. Therefore, brigade 8 was accompanied in 2006 for 7 weeks on their way back to the slaughterhouse in November-December, and met in February/March before the spring migration.
Structured and unstructured interviews were conducted with herders about their everyday decision-making concerning the exact migration route, advantages and disadvantages of the proximity of industry, the impact of industrial development on herders and reindeer grazing, and views of the future impact of industrial development on their livelihoods. In addition to moving with the camp, herders were accompanied during their work with the herd, particularly during the night shifts in industrially affected areas during mosquito harassment—where both humans and animals are exposed to multiple natural and anthropogenic pressures. They provided detailed information on landscape changes over the last three decades, using topographic maps and high-resolution satellite image printouts. Social impacts of industrial development were assessed while accompanying herders to the settlement of Bovanenkovo, where they re-supply their households with staple food, and accompanying gas workers to the herders’ camps, thus experiencing how relations develop between these two contrasting groups of land users. For spatial referencing during participant observation and interviews with both herders and gas field workers, we relied on a combination of satellite imagery (Quickbird-2, ASTER) and topographic maps of 1:100,000.
4. Results
Changes in land cover caused by gas exploration and production activities occur at various scales, ranging from local to landscape level. The impacts can be divided into the three spatial scales: small (<0.09 ha), medium (0.1 ha to 1 ha) and large (>1 ha) and they vary from fragmented patches to linear transportation networks (roads, off-road tracks, pipelines,
etc.) (
Table 2). For example, at the medium scale, impacts were generally detectable with coarser resolution satellite imagery but interpretation of actual disturbance type was merely suggestive of a basic differentiation between disturbed and undisturbed terrain. Quickbird-2 and GeoEye images were most applicable in spatial disturbance estimation and in interpreting the source of disturbance. Although even VHR images did not reveal industrial waste (e.g., metal trash, glass, concrete pieces), sparsely distributed and partial vegetation covered the area. Such “hidden” waste is one factor that lowers the value of reindeer pasture land due to the risk of infections caused by hoof injuries.
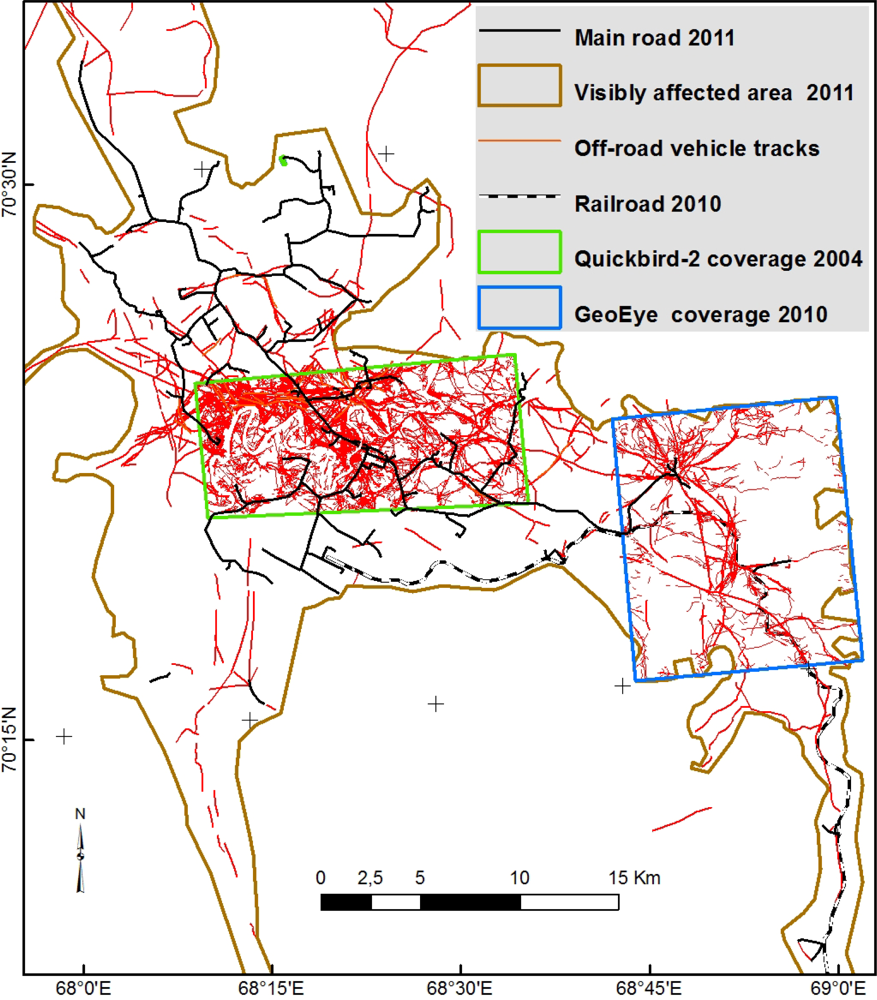
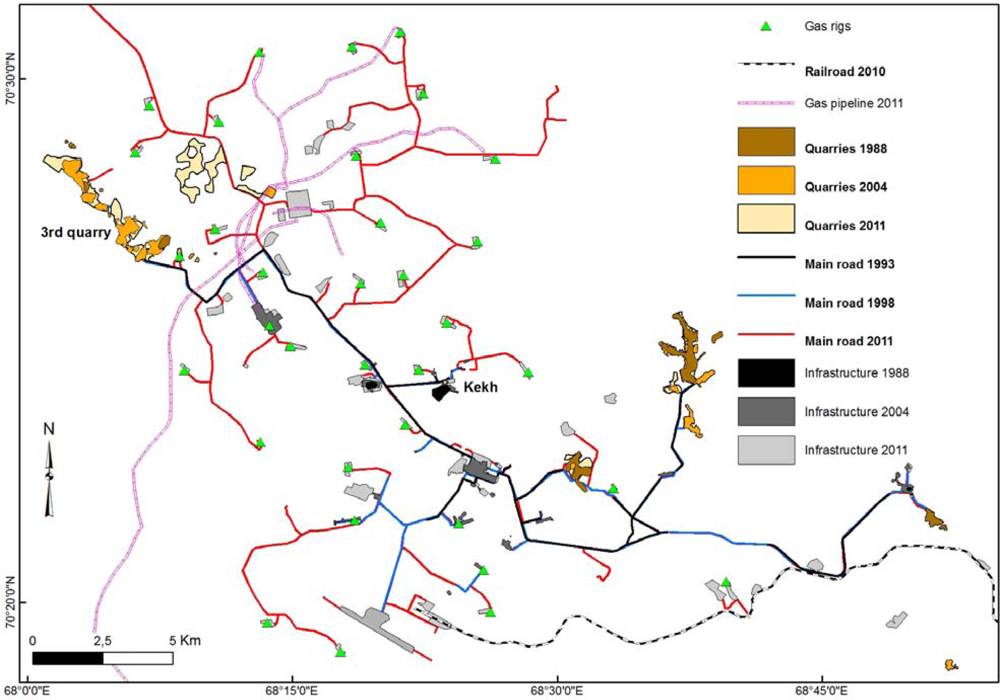
Our time series analysis based on satellite imagery of Bovanenkovo from 1984 to 2011 tracks the spread of infrastructure and associated surface disturbance outward from the initial gas worker settlement at Kekh (
Figure 5). In 1985, before the establishment of Kekh, a few dozen kilometers of tracks from off-road vehicle traffic were already vaguely visible from Landsat MSS imagery along the ridges and better drained sections of what is mostly low-lying and moderately wet to boggy, highly saturated terrain. These same routes are, in fact, marked on 1:100,000 topographic maps from 1970 and probably date from the original hydrocarbon deposit surveys conducted on Yamal Peninsula in the late 1960s. From the 1988 Landsat TM image, extensive development is clearly detectable (
Table 3). With respect to building a complete chronology of gas field expansion, SPOT images from the 1990s were crucial. For example, from them, the spreading road network was clearly identified. ASTER VNIR with 15 m spatial resolution is significantly more reliable in detecting the off-road vehicle tracks than Landsat TM images with 30 m resolution. There is a marked jump in the amount of off-road vehicle track between 2001 and 2004, from 590 km to 2,400 km (
Table 3) and 2004 to 2010, even though the total amount of area visibly affected by development does not change significantly during this same period. This is not so much a result of increased off-road traffic, but rather it demonstrates the improved impact detection capacity of VHR satellite imagery (Quickbird-2 and GeoEye) compared to HR imagery (e.g., Landsat, SPOT, ASTER). Off-road vehicle traffic was most extensive during the period 1988 to the mid 1990s, by which time the basic road network had been finished (
Table 3).
The surface area visibly affected increases slowly from 1988 to 2004, partly also as a result of used imagery’s better spatial resolution. There is a sharper increase between 2004 and 2010 and then again from 2010 to 2011 which is a result of the significant increase of infrastructure development and preparation for starting the production of the gas field. The stage of the development in 2010 was interpreted from low quality Landsat TM imagery, yet the size of the affected area was large enough to be easily detected. Field observations of the central portion of the gas field in 2005 with Quickbird-2 imagery from summer 2004 enabled us to compare the detection capacity of earlier and subsequent images from various sensors (Landsat, SPOT, ASTER) and to corroborate our own short-term observations with those of nomadic Nenets herders and long-term gas workers. This resulted in a detailed understanding of the spatial and temporal patterns of movement within and through the gas field during a phase of rapid expansion. Quickbird-2 and GeoEye greatly improved our ability to detect the impacts of off-road vehicle traffic and increase the accuracy of our estimates of other surface disturbances, as can be seen in
Figure 6.
The initial phase of development, centered on Kekh, resulted in the almost complete denudation of circa 2 km
2 of what had been closed tundra vegetation right near the point where reindeer herding brigades cross the Se-yakha River (
Table 3). This was before any roads had been established and the main form of ground transport was
vezdekhod and other off-road vehicles (tractors, large trucks, earth moving equipment,
etc.). The sizeable area of ground made bare is clearly visible in the Landsat image from 1988 (
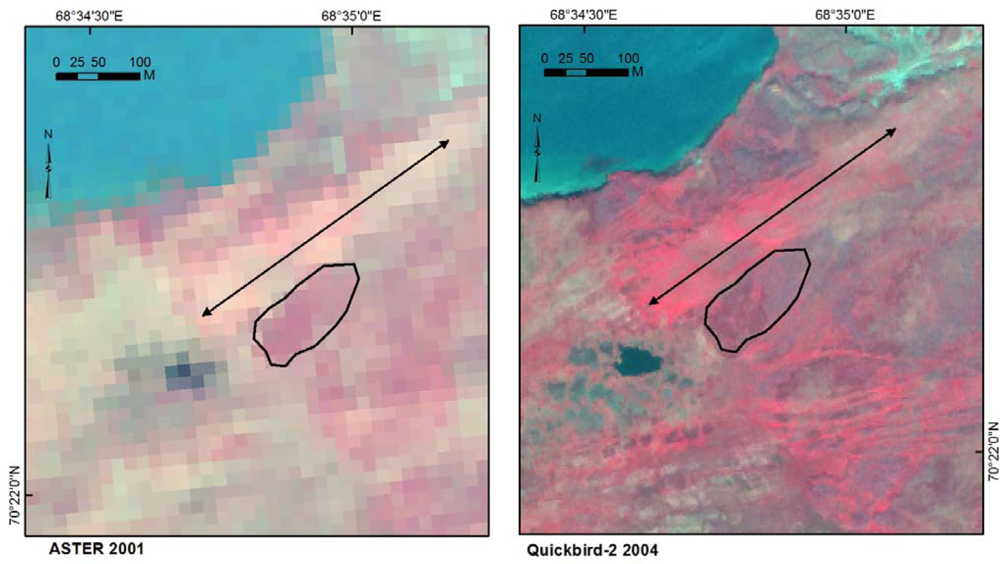
Figure 5), due to the high reflectance of the exposed mineral soils, mainly marine clay. As of 13 years later any bare ground that was not subsequently disturbed had been almost entirely recolonized by a thick cover of graminoids. The closed graminoid vegetation appears as various shades of pink and red in the false color ASTER VNIR image from summer 2001 and the later Quickbird-2 image from 2004 (
Figures 5 and
7). The net ecological effect of the extensive mechanical disturbance associated with off-road traffic has been the transformation of more than 50 km
2 of mixed erect shrub and mire vegetation types to dense, graminoid-dominated swards characterized by the absence of almost any woody plants (
Figure 8).
Other notable changes detected in the imagery from 2004 to 2011 include: (1) the establishment of a new railway connection between Bovanenkovo and Obskaya (
Figure 1); (2) breaking ground on a new airport, which will eventually be able to land cargo and other full size airplanes; (3) the gas transportation pipeline construction (Vorkuta-Baidaradata Bay to Bovanenkovo) from the south, including the annexation of the main gas field to areas south of Mordy-yakha River that had been virtually undisturbed previously (
Figures 9 and
10); (4) are large number (30) of active gas drill rigs (
Figures 9 and
10); and (5) the construction of a large town for industry workers in Bovanenkovo with state-of-the-art housing and amenities for flying workers in and out (including a church, gyms,
etc.). The amount of territory directly affected by the railway (3.6 km
2) and the airport (1 km
2) is relatively small so far. The expansion of the pipeline network of infrastructure across the Mordy-yakha is more substantial, and as of 2011 encroaches on the territory of brigade 2 (147 km
2). North of Se-yakha River, the main gas field has also expanded considerably to the north and east since 2004, encroaching onto the summer pastures of brigade 5 (
Figures 10 and
11).
The new infrastructure and related surface disturbances have together significantly reduced the overall amount of territory available for collective and privately managed reindeer herds that utilize the area for reindeer pastures, mainly but not exclusively in summer. The construction of roads and, in particular, bridges, has visibly affected freshwater systems in the vicinity of the gas field. The hydrology of lakes, rivers, small creeks and other drainage paths were negatively affected, especially during the initial construction phase, when waterways were blocked during the snow-free season, during which time fish were moving within the area to reproduce.
Subsequent fieldwork after the completion of some infrastructure projects revealed the potential for mitigation and longer term effects of industrial installations. Most notably, herders report decreased disturbance by off-road transport due to the completion of concrete roads. Also, the cleanup of some old iron junk from pastures was reported, as well as the recovery of fish to certain rivers and lakes that had been blocked for fish migration during the construction phase. On the other hand, the overall increase of population in the area and territory occupied by industry poses additional challenges to the duration of the period of stress endured during camp and herd migration through the area.
5. Discussion
The amount of infrastructure and related disturbance grew slowly in the 1990s, mostly due to the post-Soviet economic slump during which oil and gas activities contracted considerably right across Russia, but then picked up again in the early 2000s [
1,
9]. This explains the sharp increase in off-road vehicle traffic visible from 2001 to 2004 (
Table 3). Multi-pass tracks can be detected, even in low-resolution Landsat TM images, when the vegetation cover and organic mat are broken or removed, revealing the underlying sand and marine clay layers with relatively high albedo (
Figure 3). The increase in tracks is primarily due to the greater detection capacity of Quickbird-2 relative to ASTER (see
Figure 6), but probably also, to a lesser extent, reflects an increase in industrial activity in the study area. Theoretically, expansion of the road network should decrease the amount of off-road vehicle traffic. However, whereas the road system increased in length circa 2.5 times from 80 km to 212 km between 1998 and 2011, the length of off-road vehicle tracks increased nearly 8-fold from 410 km to 3136 km. In the absence of roads, damage from off-road traffic tends to be exacerbated relatively quickly at Bovanenkovo due to the fact that after a few passes on the prevailing wet ground the silty marine clay substrate forms extremely sticky and potentially deep, impassable ruts that must be steered around during subsequent use of the same route. We witnessed this form of damage many times during repeated visits to the gas field throughout the 1990s and 2000s, both on the ground and from helicopter, and so were able to verify the patterns seen in the satellite imagery. The main ecological response to off-road traffic, a transition from shrub and mire vegetation types to bare ground to graminoid cover, constitutes an alternative stable state that is likely to last for many decades, if not centuries [
24].
To investigate industrial impacts within the gas field, the highest available resolution imagery (e.g., Quickbird-2, GeoEye) is the best data source (
Table 2). As such imagery is expensive and there is little or no archive imagery available (sparse coverage since early 2000s), the only option is to use lower resolution imagery with better temporal coverage. Landsat TM is the best source if the period of investigation begins in the 1980s. SPOT archives with higher resolution also provide an important data source since the late 1980s, although the coverage is smaller than Landsat. Multi-temporal and multi-source imagery is the key to building a complete chronology of the gas field expansion. At the same time, higher resolution imagery can be used as a reference to check interpretations from lower resolution imagery. However, in the case of the Bovanenkovo gas field, we were fortunate to find such a comprehensive chronology. To obtain cloud-free imagery across several years/decades from high latitudes can be difficult or impossible.
Besides pasture vegetation, herders have reported reductions in fish populations. While changes in fish populations cannot be directly detected from satellite images, herders commented about proxy indicators on the images, such as different colors of lakes. “Dead” lakes with low turbidity would have a different colour from “live” lakes,
i.e., those with fish in them. Long-term field data suggest, however, that fish populations recover over time: fish returned after completion of river crossings of railways and roads in some cases, e.g., between Bovanenkovo and Kharasavey, beyond the third quarry (see
Figure 9). The losses have been attributed to the timing of road and bridge construction, combined with poaching. Some poaching is flagrant and excessive, but more often it results from the accumulated effects of individual injudicious and unsustainable use of fishing nets by off-duty gas workers, particularly those with little presence on the land before. Since 2010–2011, herders have also noted that as soon as the new railway from Obskaya linked up to Bovanenkovo (
Figure 1), fish virtually disappeared from the lakes and streams in the vicinity of the transport corridor. They concluded that this was not the result of poaching and attributed it instead to the strong subsurface vibrations emitted by heavy freight train traffic. Fish is a critical resource all year round, especially during the long summer migration. Particularly among older people, there is a consciousness about maintaining fish populations. Timing, location, duration of fishing efforts are all therefore carefully considered [
25]. Herders have a decade-long memory, not only on the amount of fish in particular water bodies, but also the species composition and the changes that it undergoes during industrial activity. This information is indeed impossible to detect on satellite pictures, and is closely related to culturally specific ways of knowing, using and perceiving the land. This shall be explored in further detail in an anthropological article focusing specifically on fishing among Nenets people. As most fish are migratory between the Ob and Taz Bay and the inland waters, a detailed fishing-knowledge investigation should include comparisons from fishermen accessing the resources from both the Yamal and the Taz side of the bay. For the present purpose, it shall be sufficient to state that the perception of healthy fish resources is indicative of the condition of the entire system. Even if claims concerning fish losses and displacement cannot yet be scientifically verified, our long-term experience actively migrating with these and other herders around Yamal, coupled with the nomads’ strong sense of stewardship [
25], leads us to assign a large measure of credence to their qualitative observations, even if the underlying causes are not clear. The degradation and change of freshwater fishing resources is of major importance to the viability of the social-ecological system because fish provide the main source of protein to tundra nomads during the snow-free season.
The documented increase in lush, green vegetation cover on formerly bare ground does not necessarily translate into renewed pastures and available forage for reindeer. While shrubs are considered by herders to be superior to grasses and sedges, they admit that for
Rangifer spp., even those new species present tend to be highly edible and digestible [
26,
27]. Ideally, it should be determined by the animals: whether they prefer the graminoids or not. This can be done through intensive fieldwork, driving reindeer sledges through such areas and observing which plants are consumed by the animals along the way [
25]. The decision-makers determining whether or not such areas are exploited for forage are mostly human; herders are concerned that reindeer will be injured by the substantial amount of potentially harmful garbage hidden in the tall and graminoid cover, including rusty metal, broken glass, oil and other toxic wastes.
Avoiding such areas is thus a protective measure for preventing reindeer from becoming infected and getting hoof-rot disease (
necrobacteriosis), which leads in autumn to emergency slaughtering and contaminated pastures. To make a quantitative connection, one could check if herds that move through gas deposits have increased percentages of hoof-rot infections. During Soviet times, these data were collected carefully by the Yamal agricultural research station. While reindeer know the forage plants in the area very well, they need humans to direct them to where it is safe to graze. Theoretically, garbage can also be found in areas covered by shrubs, but most typically there is much less of it in areas that have not been accessed by industry. This is in addition to the near-constant disturbance from industrial noises and activities, and sometimes feral dogs that cause herders to give a wide berth when moving their animals, particularly near the older sites. Herds move as quickly as possible through a migration corridor purposefully cleared of obstructions to designated camps, in some cases within a few meters of newly established drill rigs (
Figure 5). They are actively facilitated in this process by the long-term workers of the gas station, who provide boat transport across the river for infants, toddlers and elderly Nenets, in addition to the occasional cat and several herding dogs that are either unable or unwilling to swim across under their own power.
Herders were profoundly disturbed and stressed by the physical degradation to reindeer pastures in the vicinity of the gas field in the initial phase of construction, which can be seen by the large amount of bare ground that appeared from 1985 to 1988 (
Figure 3). Upon first seeing the amount of totally denuded terrain and new infrastructure that had appeared within just a couple of years, one herder exclaimed to himself, “This is my apocalypse!”. At the same time, some sacred sites and strategically located camps were destroyed or rendered inaccessible while freshwater fishing resources were severely degraded in certain places, as discussed above. Brigades 4 and 8 were therefore forced to adapt quickly to a large number of ecological changes at the same time as the socio-economic situation was rapidly transforming in the vicinity of the gas field, due to the large influx of workers. In the background, it must be kept in mind that even without the ongoing warming climate trend [
10,
28], Yamal weather patterns can differ considerably from year to year and herders therefore depend upon a network of campsites, fishing, and grazing resources to cope with annual and seasonal variability. Mostly negative ecological impacts were at least partly offset by increased opportunities for trade, which were viewed as positive [
1].
As gas company plans and priorities continued to shift during the early to mid 2000s, in the middle phase of construction, herders were told in 2005 that they would need to completely vacate the pastures north of Se-yakha as the entire area from there to Kharasavey (
Figure 1) would soon become too fragmented with infrastructure and therefore logistically too difficult and unsafe for them. During 2007–2008, camp migration through the Bovanenkovo deposit was also facilitated by lorries from the gas company, so that only the herds circumvented the deposit area, while the camp households of two brigades were transported within a single day through the entire zone of infrastructure and related impacts. This practice and the decision to close the area north of the Se-yakha River crossing was eventually withdrawn, but the combined experience of the early phase of construction, accompanied by genuine broken promises and more basic cultural misunderstandings, left some herders badly shaken and doubtful about the future [
29].
In the latest phase of construction, the combined effect of the new railway, airport and the annexation of territory south of Mordy-yakha and north-west towards Kharasvey (
Figure 1) will be to open up vast, previously undisturbed areas to relatively rapid exploitation. If not carefully planned, this can easily lead to detrimental cumulative impacts for herders and herds, since migration through areas under industrial exploitation is more stressful for humans and animals alike. In 2011, herders were somewhat relieved to report that there had been noticeable recovery of fish populations in streams that had been heavily damaged during the bridge construction phase in the early-mid 2000s. This had returned a measure of optimism since fish are so critical to the long summer migration.
6. Conclusions
This contribution has detailed the timeline of development of the Bovanenkovo gas field on the Yamal Peninsula by combining multi-source and time series remote sensing imagery change detection procedures at various scales with intensive ground truthing and social anthropological field surveys. VHR images (e.g., Quickbird-2 and GeoEye) have the highest capacity to detect impacts caused by hydrocarbon exploration and extraction activities. To build an up-to-date chronology of gas field expansion, Landsat and SPOT archives provide the longest available time series, although at high latitudes a single platform seldom encompasses comprehensive time series coverage for a given location. We have quantified the extent of visible impacts and transformations in land cover and linked the different stages of infrastructure expansion to combined social-ecological responses among the nomadic Nenets population and the terrestrial and aquatic tundra ecosystems that sustain them. The first phase of development in the mid-late 1980s, centered on the gas workers’ settlement at Kekh, resulted in a great deal of surface disturbance that not only denuded the vegetation cover used as pastures, but also destroyed some important migration camps and sacred sites highly valued by reindeer herders. At the same time, fishing resources began to be noticeably degraded. The second phase of gas field growth in the early 2000s was characterized by rapid expansion of the road network and a reduction in off-road vehicle traffic. However, the large number of bridges constructed for roads continued to damage lakes and streams and reduce the availability of fish needed for protein during the summer migration. Although the denuded soils had mostly recovered by then, the amount of metal trash hidden in the dense graminoid swards rendered sizable areas unusable as reindeer pastures. The combined effect of the first two phases was a general diminution of herders’ prospects about the future of co-existence. In the third phase, from 2004 to 2011, infrastructure expansion has again ramped up rapidly and expanded into new areas to both the north and south of the original settlements. Fish populations began to return to the streams and lakes damaged during road and bridge construction, and some trash had been tidied and piled up at better identifiable waste dumps, affording herders a measure of optimism at a time of steady encroachment on their traditional summer pastures.
The rich experience of herder/gas worker interactions over more than two decades allows us to offer a brief concluding assessment of the ability of the existing governance regime to facilitate adaptation in real time as the gas field quickly gears up for its first phase of production, possibly in autumn 2012. All in all, the relationship between herders and industry has developed towards long-term agreements for managing their mutual coexistence on the territory they share by necessity. Part of this concerns practical seasonal arrangements, for example the preparation of individual passageways for camps to cross roads and rivers, the halting of road traffic during herders’ crossings, the cleanup of old metal trash from the pastures and other forms of assistance. At the same time, individual agency still remains important for both herders and workers, for example as far as trading is concerned.
The decades-long coexistence of herders with the gas industry in the south of YNAO has shown that in the long run, both ways of using the land can survive in close proximity to each other, even though some of the adaptations were painful for herders who had to change and abandon traditional migration routes. For a future governance regime to function properly, it is important to have a solid framework agreement outlining the rights and duties of both the industry and private herding structures, but which at the same time provides enough room for flexibly addressing and solving everyday concerns. The sheer existence of laws and rules is not sufficient to address the diversity of problems that arises during the practice of coexistence [
12].


