Effect of Grain Size and Mineral Mixing on Carbonate Absorption Features in the SWIR and TIR Wavelength Regions

1
Department of Earth Systems Analysis, Faculty of Geo-Information Science and Earth Observation (ITC), University of Twente, Hengelosestraat 99, P.O. Box 217, 7500 AE Enschede, The Netherlands
2
Department of Physics, Faculty of Mathematics and Natural Sciences, Syiah Kuala University, Darussalam, Banda Aceh 23111, Aceh, Indonesia
*
Author to whom correspondence should be addressed.
Remote Sens. 2012, 4(4), 987-1003; https://doi.org/10.3390/rs4040987
Submission received: 24 February 2012
/
Revised: 27 March 2012
/
Accepted: 28 March 2012
/
Published: 10 April 2012
Abstract
:Reflectance spectra of carbonate minerals in the shortwave infrared (SWIR) and thermal infrared (TIR) wavelength regions contain a number of diagnostic absorption features. The shape of these features depends on various physical and chemical parameters. To accurately identify carbonate minerals or rocks in pure and mixed form, it is necessary to analyze the effects of the parameters on spectral characteristics. In this study, we analyzed spectral absorption feature characteristics of calcite and dolomite in the SWIR (features at 2.3 and 2.5 μm) and TIR (features at 11.5 and 14 μm) wavelength regions, as a function of grain size and carbonate mineral mixtures. Results showed that varying grain sizes and mineral contents in the sample, influence reflectance values and absorption feature characteristics. Absorption band positions of pure and mixed calcite and dolomite in the SWIR and TIR regions for both features were displaced slightly as observed in previous studies. The band positions of calcite and dolomite varied relative to grain size only in the TIR region. These positions shifted to longer wavelengths for the feature at 11.5 μm and to shorter wavelengths for the feature at 14 μm from fine to coarse grain size. The band positions of calcite-dolomite mixtures in the SWIR and TIR regions were determined by the quantity of calcite and dolomite in the sample. These results can be applied for the identification of pure and mixed calcite and dolomite, as well as estimating the relative abundance of both minerals with different grain size and mineral mixtures in a synthetic sample or rock. They can also be used as a preliminary proxy for assessing dolomitization patterns in carbonate rocks.
1. Introduction
Carbonate rocks, which are recognized as an important natural resource for construction materials and the cement industry [1,2], are sedimentary rocks that mostly consist of calcite (CaCO3) and dolomite (CaMg(CO3)2) [1–4]. These carbonate minerals in the form of limestones also have an economic interest in terms of petroleum geology, because their porosity is a potential storage reservoir for oil and natural gas [1,2,5,6]. The development of porosity in limestones is affected by the sequence of diagenetic processes, which include dolomitization [1,5,6]. The dolomitization process involves the replacement of calcite by dolomite in the rock when magnesium-rich water permeates through limestone [1,6,7]. The process may result in an increase in the porosity of the rock by up to 12%, making it suitable as a natural reservoir for oil [5,6,8]. The implications of dolomitization for oil exploration [9,10] and the importance of dolomite in making cement make it a favorable mineral to be investigated.
Besides the interest in oil and gas reservoir characterization, there is an interest in looking into calcite-dolomite mineralogy from an ‘ore geology’ perspective, as carbonates are important pathfinder and alteration minerals associated with calcic skarn deposits, low sulphidation epithermal deposits and porphyry Cu deposits [11,12]. In addition, coral reefs are under worldwide decline as a result of climate change [13]. Corals are among the species that contribute to carbon sequestration, the capture of carbon dioxide (CO2) from the atmosphere, and act as natural carbon sinks. As they are largely built of carbonate material, more information on its spectral characteristics will help in better species differentiation and in mapping using remote sensing [14,15].
Carbonate minerals have diagnostic absorption features in the shortwave infrared (SWIR) and thermal infrared (TIR) regions due to vibrational processes of the carbonate ions (
) [16–20]. In general, carbonate minerals can be distinguished by the presence of two prominent spectral absorption features in the wavelength ranges around 2.50–2.55 μm and 2.30–2.35 μm in the SWIR [8,18,20–22] and around 13.70–14.04 μm and 11.19–11.40 μm in the TIR [17,19,23,24]. These features can be used to identify pure and mixed calcite and dolomite in synthetic samples or carbonate rocks, because the absorption band position of calcite is located at a slightly longer wavelength than that of dolomite [8,21]. Although the absorption band positions of these particular minerals have been observed by multiple researchers, the precise position of calcite and dolomite absorption bands in the SWIR [8,18,21,22] and TIR [19,23–26] spectra has been recorded at different wavelengths.
There are several factors controlling the position of carbonate absorption bands at the atomic level: cation mass, cation radius, cation and anion valences, cation coordinate number, the gap between cation and anion, and site symmetry [27,28]. Spectral absorption features of carbonate minerals in the infrared region are also influenced by physical and chemical parameters such as grain size [8,21,29], texture [29], packing or porosity [21], carbonate mineral content [8], and chemical composition (metal ion impurity) [8,18,27]. Previous studies of the effect of particle size on carbonate absorption features in the SWIR revealed that differences in grain size change reflectance values and absorption feature depth [8,21,29], but absorption band position, width [8,21], and asymmetry of the features [8] are invariant to grain size. Position, depth, and asymmetry of carbonate absorption feature in the SWIR are displaced by changing the relative amounts of calcite and dolomite composing a sample [8]. The presence of iron in the form of Fe2+ in carbonate minerals reduces the reflectance value [8,27] and depth of the carbonate absorption feature in the SWIR [8].
Although the spectral absorption features of carbonate minerals in the SWIR wavelength region have been extensively studied [8,21,29], they have not been fully explored and observed in the TIR region, particularly with regard to the influences of grain size and carbonate mineral mixtures. In this study, we analyze the spectral absorption feature characteristics of calcite and dolomite in both the SWIR and TIR wavelength regions as a function of grain size and calcite-dolomite mixtures. To accurately identify carbonate minerals in pure and mixed forms, it is necessary to analyze the effects of those parameters that change spectral characteristics.
2. Material and Methods
2.1. Sample Preparation
Synthetic samples of calcite and dolomite were prepared by crushing, sieving, mixing and packing. Rock samples of calcite from the Serra de Ficalho, Moura, Portugal and dolomite of chemical grade from the UK were separately pulverised using a jaws-crusher and a steel percussion mortar and pestle. The pulverized samples were dried in an oven overnight at 105 °C to evaporate water, and subsequently sieved into six grain size fractions of pure powdered minerals (<45 μm, 45–90 μm, 90–125 μm, 125–250 μm, 250–500 μm and >500 μm) using a Fritsch sieving machine with stainless steel sieves. Synthetic mixtures of calcite and dolomite were prepared by mixing weight percentages of powdered minerals ranging from pure calcite to pure dolomite with same grain size fractions. The samples used in this mixing process consisted of three different grain size fractions with a combination of some pure fractions, namely <45, 45–125, and 125–500 μm. The pure powdered calcite and dolomite were weighed on the basis of weight percentage of each mineral respectively, using a top-loading precision balance (Mettler PE360) with a reading precision of ±1 g. The total amount of material needed to prepare a synthetic sample was 25 g and the compositions of calcite-dolomite mixtures with different mineral contents for each grain size fractions were 75%–25%, 50%–50%, and 25%–75%. To obtain homogenous mixtures, samples were manually stirred in a porcelain mortar using a spoon-spatula for 5 min. For packing of the samples, the pure and mixed synthetic samples were placed separately in a cylindrical aluminum cup of 5 cm in diameter and 5 mm in depth, and pressed using a weight pressure of 1,090 g for 5 min.
2.2. FTIR Reflectance Spectra Measurement
A Bruker Vertex 70 FTIR Spectrometer was used to measure reflectance spectra of the synthetic samples in the SWIR (1.0–3.3 μm) and TIR (5.0–20 μm) wavelength regions. The spectrometer was equipped with a near infrared (NIR) source, Calcium Fluoride (CaF2) beam splitter, and Indium Gallium Arsenide (InGaAs) on-sphere detector for the SWIR spectra measurements. The spectrometer measured the SWIR spectra with 16 cm−1 spectral resolution at 256 scans per acquisition. The TIR spectra were recorded using an external mid infrared (MIR) source, Potassium Bromide (KBr) beam splitter, and Mercury Cadmium Telluride (MCT) on-sphere detector cooled by liquid nitrogen. The sample was scanned 4,096 times per acquisition with 8 cm−1 spectral resolution.
Directional hemispherical reflectance measurements were made using a custom-built integrating sphere [30] attached to the Bruker Vertex 70. The beam of SWIR or TIR radiation from the spectrometer passed through the sphere and illuminated the sample surface with an angle of approximately 10°. The sample was placed under a sample port at the bottom of the sphere. The sample area measured was approximately 25 mm in diameter. Radiation reflected by the sample and scattered by the gold-coated sphere was recorded by detectors placed on the top (MCT) and the rear (InGaAs) of the sphere. A gold-coated plate was used for referencing, before each sample measurement was conducted.
2.3. Spectral Absorption Features Analysis
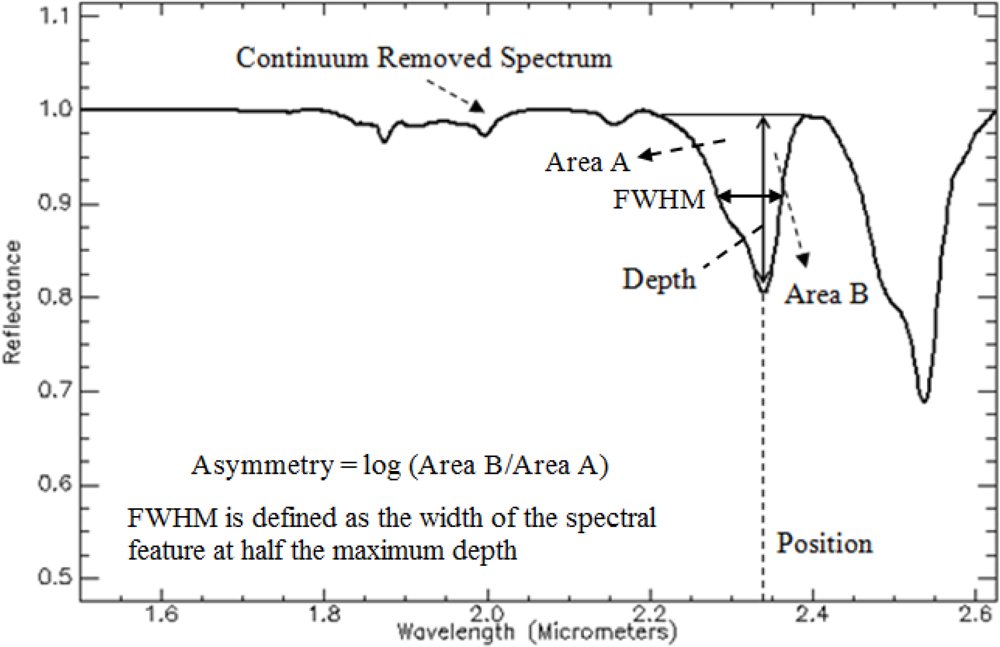
Absorption feature characteristics analysis consisted of determining absorption band position, depth, full width at half maximum (FWHM), and asymmetry [8,31–33], calculated from continuum-removed spectra [31–34] (Figure 1). The position of the absorption band is defined as the wavelength at which the maximum absorption or minimum reflectance of an absorption feature occurred [8,31]. The depth of the absorption feature indicates the reflectance value at the shoulders minus the reflectance value at the position of the absorption wavelength [8,31,32]. The FWHM is defined as the width of the spectral feature at half the maximum depth [33]. The asymmetry of the absorption feature represents the logarithm of the ratio of the area right of the absorption position (Area B) to the area left of the absorption position (Area A) [33], where the result of the calculation is zero if the absorption feature has a perfect asymmetry, a negative value for a skewed absorption feature towards shorter wavelengths, and a positive value for a skewed absorption feature towards longer wavelengths [33].
A continuum is a mathematical function that can isolate and enhance specific spectral absorption features [32], which has been used for various applications to analyze the feature characteristics of field [34–36], laboratory [37,38], and image [31,39–41] reflectance spectra. We analyzed four prominent vibrational absorption features in carbonate reflectance spectra: features at 2.3 and 2.5 μm in the wavelength range of 2.164–2.653 μm (SWIR) and features at 11.5 and 14 μm in the wavelength range of 10.89–14.81 μm (TIR). The absorption feature characteristics were computed using custom IDL scripts [31,38] within IDL-ENVI software package [42].
3. Results
3.1. SWIR Spectra of Pure Calcite and Dolomite with Varying Grain Size
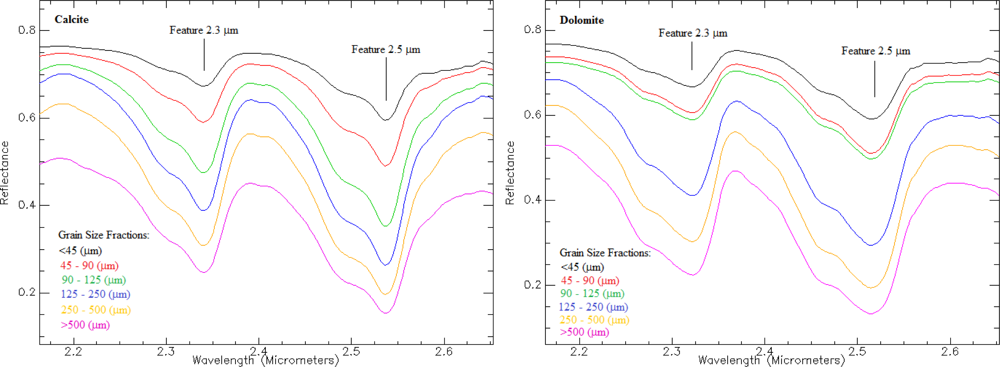
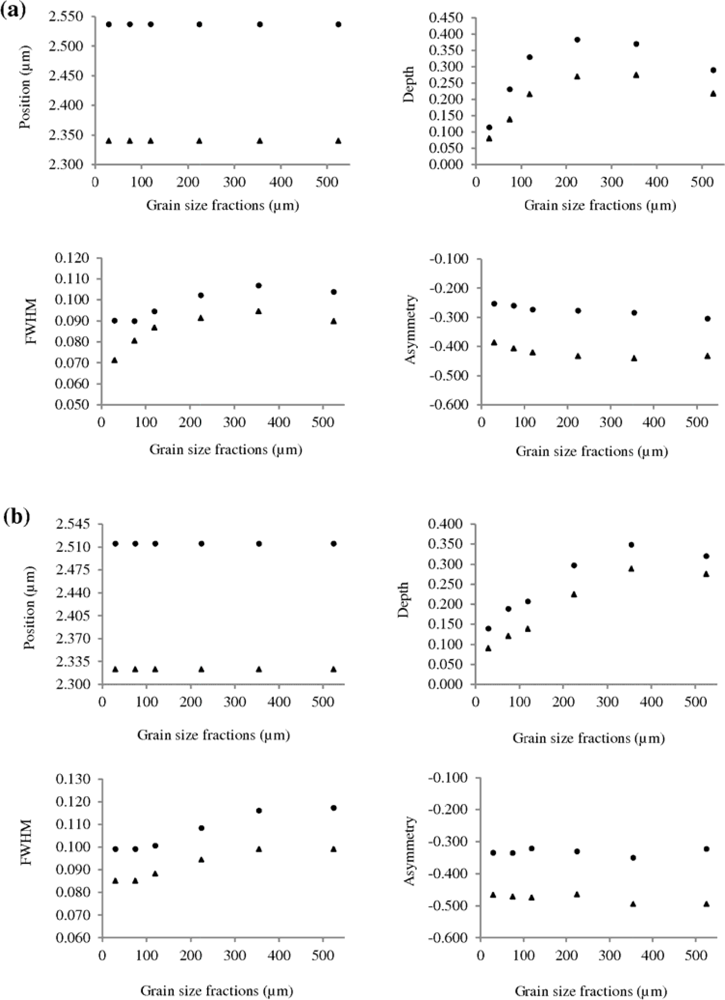
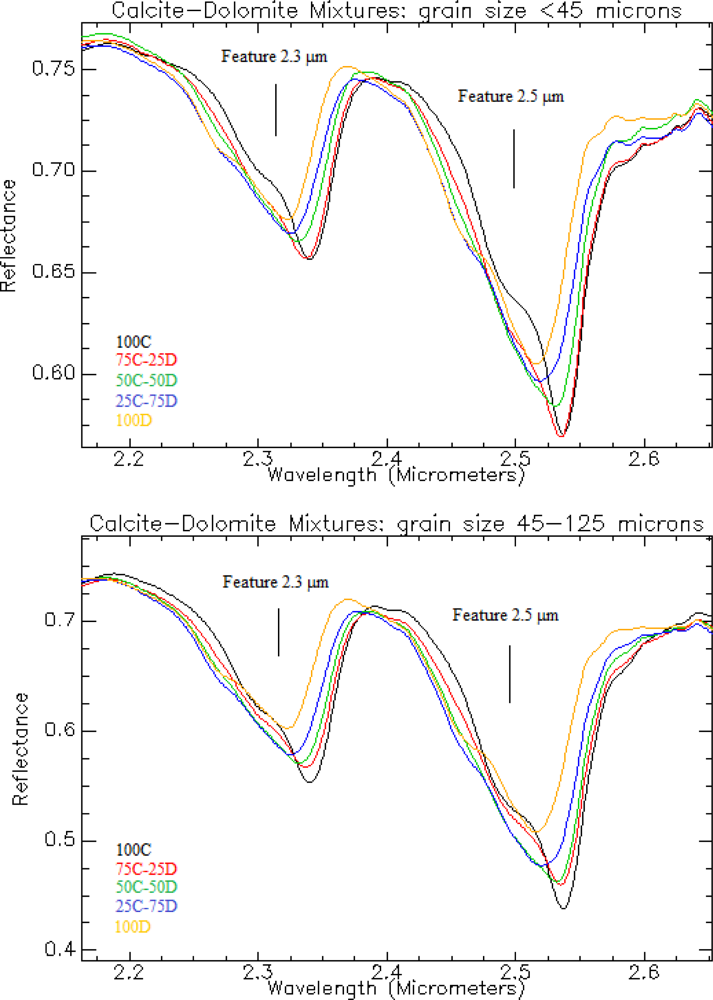
SWIR spectral characteristics of the two vibrational absorption features in pure powdered calcite and dolomite are shown for each grain size fraction in Figure 2. It can be observed that varying the grain size fraction influences the reflectance value and absorption feature characteristics, especially the depth of absorption bands and the overall brightness in the SWIR wavelength region. The depth of absorption bands increases with increasing grain size fraction of calcite and dolomite between 45 and 250 μm, and decreases when the grain size is greater than 250 μm (Figure 3). Overall reflectance decreases with increasing grain size fraction of the sample (Figure 2).
FWHM and asymmetry of the features also vary slightly with grain size fraction, but the position of absorption bands for both features of calcite and dolomite is invariant to grain size fraction (Figure 2). The absorption band positions are centered at 2.340 μm and 2.537 μm for calcite and at 2.323 μm and 2.515 μm for dolomite (Figure 3(a,b)). The FWHM increases with increasing grain size fractions from 45 to 500 μm, but slightly decreases when grain size is larger than 500 μm (Figure 3). The feature at 2.5 μm is wider and deeper than the feature at 2.3 μm for both minerals. The asymmetry of calcite and dolomite features has a negative value which tends to skew to shorter wavelengths (Figures 2 and 3) and the feature at 2.3 μm skews more to shorter wavelengths than the feature at 2.5 μm.
3.2. TIR Spectra of Pure Calcite and Dolomite with Varying Grain Size
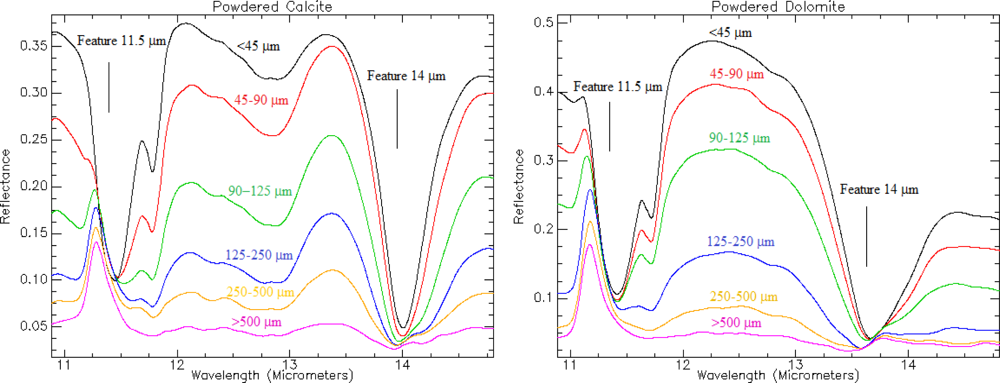
TIR reflectance spectra of pure powdered calcite and dolomite are characterized by the two prominent vibrational absorption features at 11.5 and 14 μm (Figure 4). The graphs show that change in grain size influences spectral shape, reflectance value, and absorption feature characteristics of both calcite and dolomite. Overall reflectance and depth of absorption bands decrease with increasing grain size fraction for both features. The spectral features of calcite and dolomite become poorly defined as grain size fraction increases, particularly between 125 and 500 μm grain sizes. Additionally, the doublet at 11.75 μm and peaks at 12 and 13.50 μm disappear gradually with increasing grain size fraction, whereas the peak at 11.25 μm becomes more pronounced.
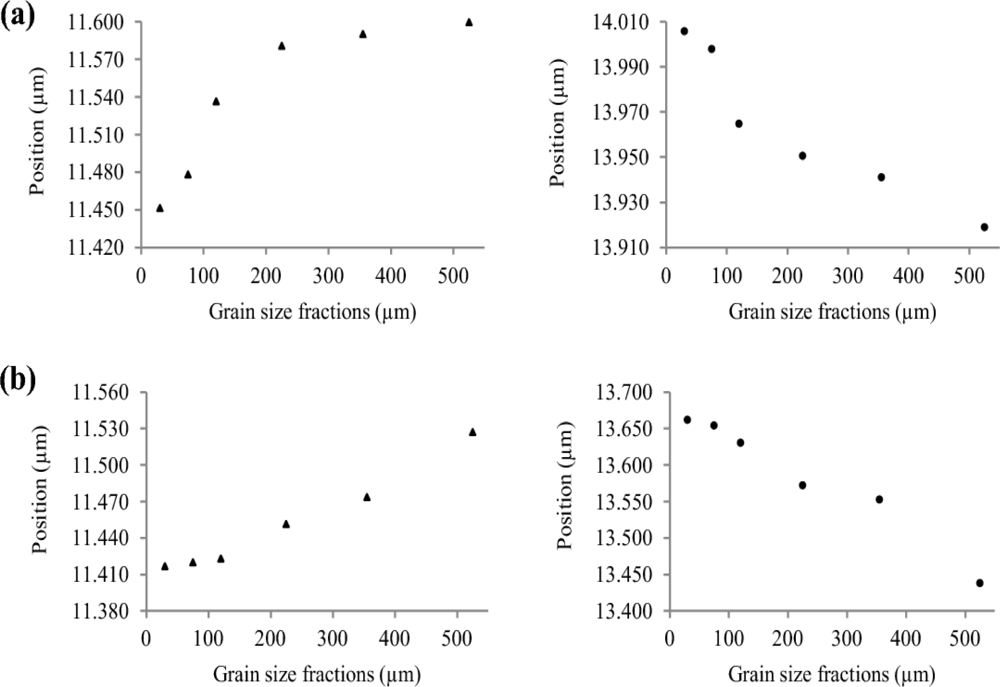
Absorption band position, FWHM, and asymmetry also vary with grain size fraction. The position shifts to longer wavelengths for the 11.5 μm feature (11.451–11.600 μm for calcite and 11.417–11.527 μm for dolomite) and to shorter wavelengths for the 14 μm feature (14.006–13.919 μm for calcite and 13.662–13.438 μm for dolomite), from fine to coarse grain size fraction (Figures 4 and 5). The FWHM increases with increasing grain size fraction of calcite and dolomite. The asymmetry of the features has a positive value which tends to skew to longer wavelengths as grain size increases (Figure 4).
3.3. SWIR Spectra of Mixed Calcite and Dolomite with Varying Mineral Contents
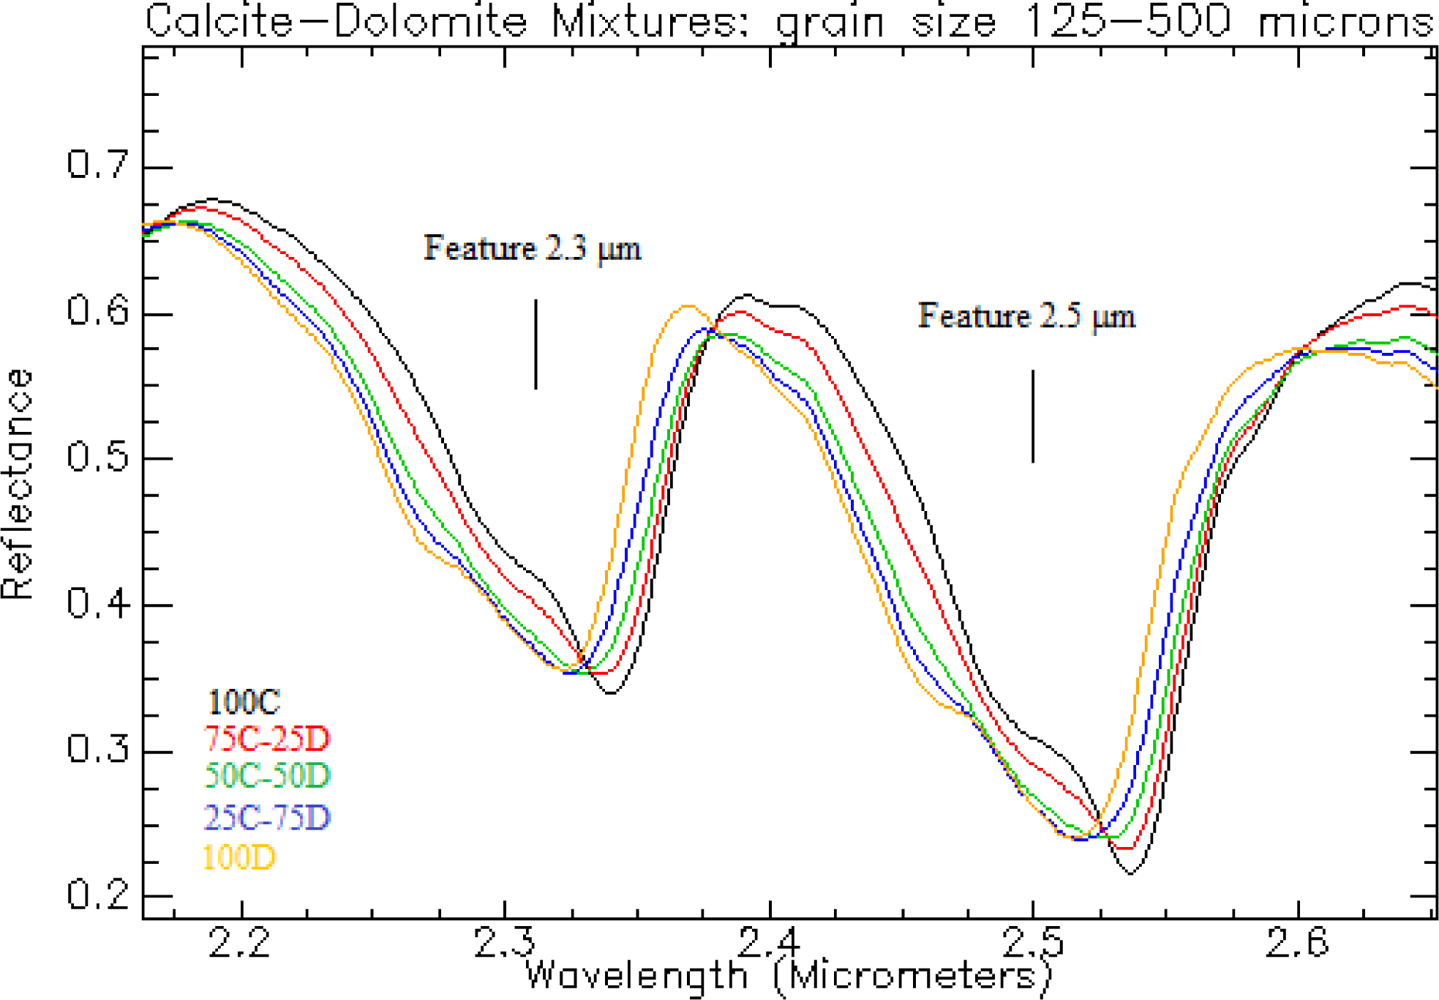
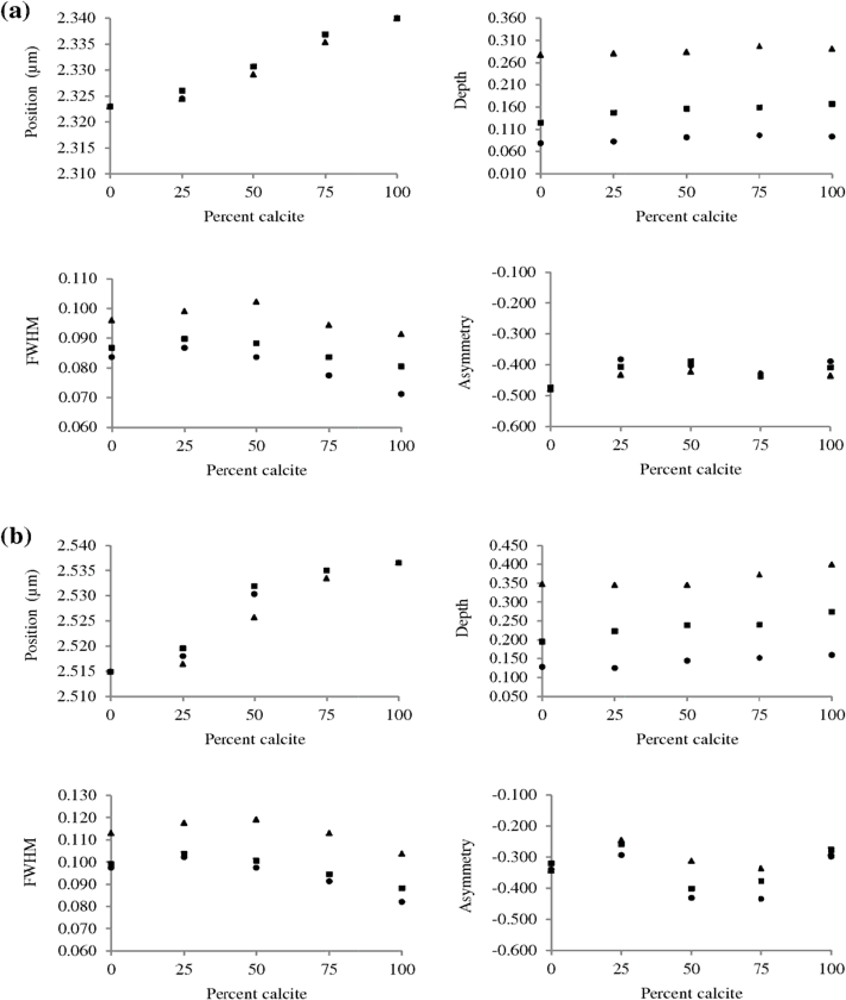
Reflectance spectra of calcite-dolomite mixtures in the SWIR wavelength region used in absorption feature analysis are shown in Figure 6. The graphs show that reflectance intensity and spectral characteristics change with different calcite and dolomite contents and grain size. Overall reflectance tends to decrease with increasing grain size fraction. The 2.3 and 2.5 μm absorption bands shift in position as a result of different calcite or dolomite contents in the sample (Figure 7). These band positions of calcite-dolomite mixtures in the SWIR region are centered within the wavelength range of 2.323–2.340 μm and 2.515–2.537 μm, from the band position of pure dolomite to pure calcite. Absorption band positions of the mineral mixtures also subtly displace with grain size fraction, especially when calcite content increases from 25% to 75%.
Absorption band depth, FWHM, and the asymmetry of both features also vary slightly with changing carbonate mineral content (Figure 7). For each grain size fraction, the depth of absorption bands increases with increased calcite content. Coarse grain size gives deeper absorption features than fine grain size. The FWHM decreases when more than 25% of calcite is in the sample. The asymmetry of features has a negative value which tends to skew to shorter wavelengths.
3.4. TIR Spectra of Mixed Calcite and Dolomite with Varying Mineral Contents
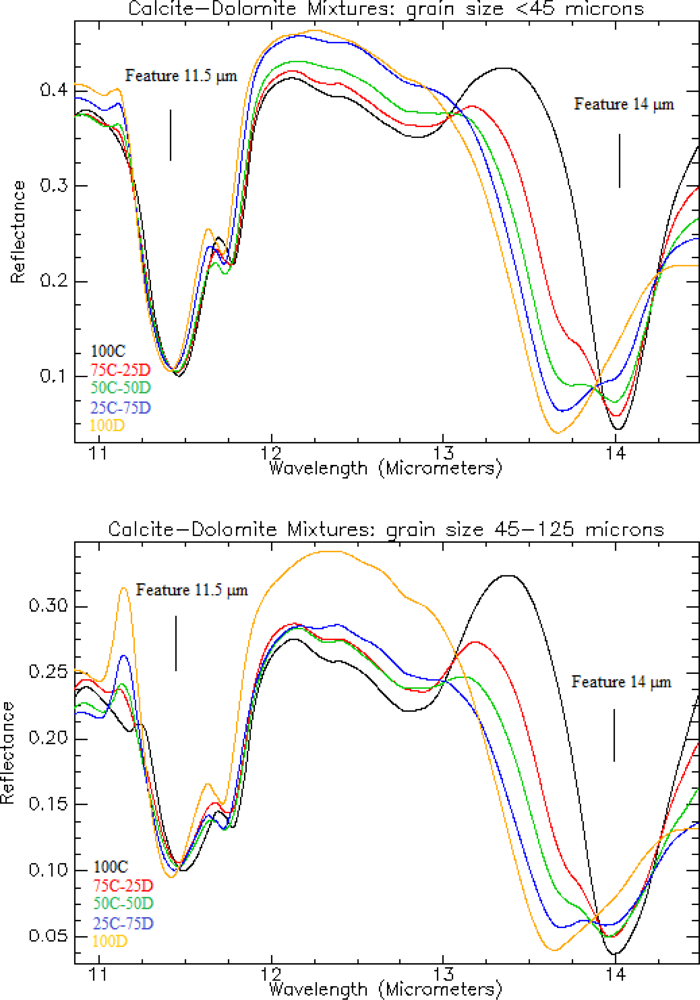
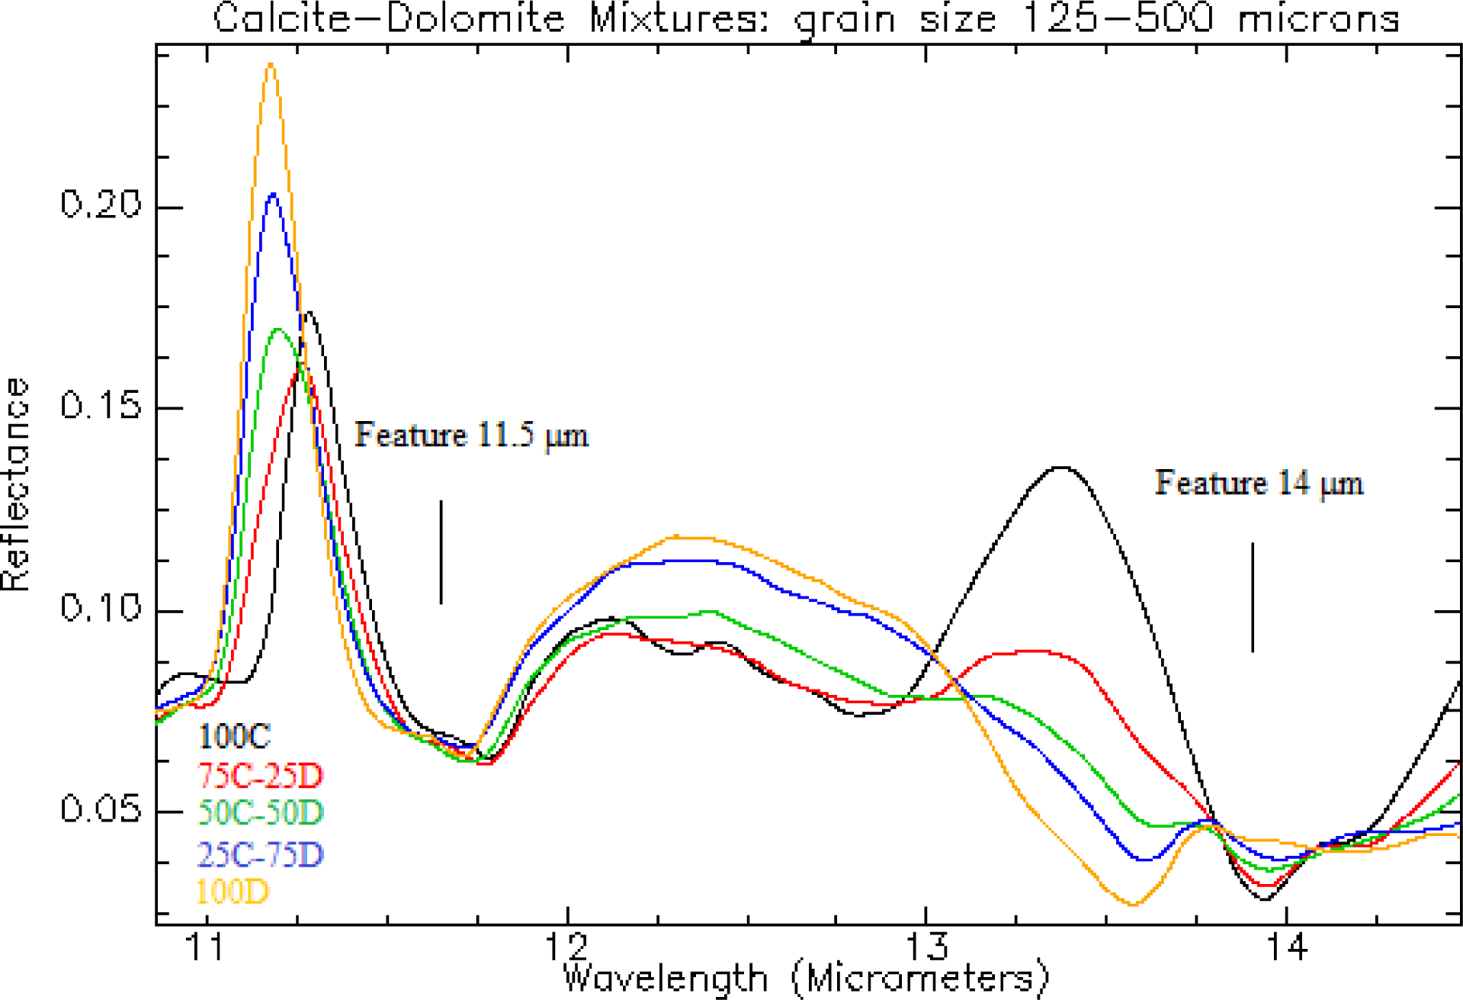
Figure 8 shows reflectance spectra of calcite-dolomite mixtures in the TIR wavelength region, for each grain size fraction. The graphs show that spectral shapes and absorption feature characteristics of both features (11.5 and 14 μm) vary with changing calcite and dolomite contents. Overall reflectance decreases with increasing calcite content and grain size fraction. The thermal infrared spectra of calcite-dolomite mixtures exhibit a relatively flat spectral curve when grain size fractions are in the range of 125 to 500 μm.
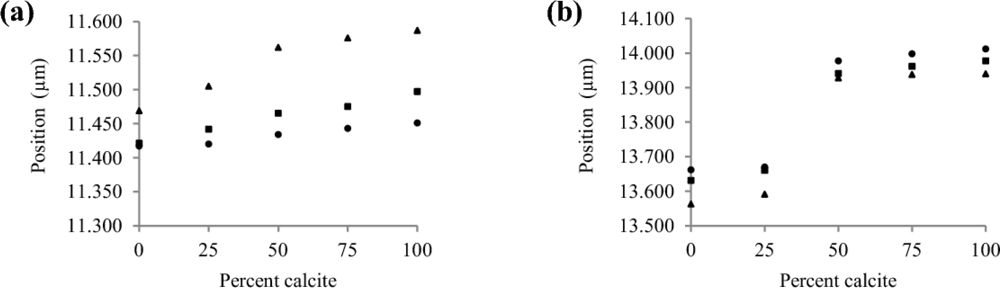
The position of absorption bands of both features depends on the calcite content and grain size composing the sample, where the band positions range from that of pure dolomite to pure calcite or change to longer wavelengths as calcite content increases (Figure 9). These band positions of calcite-dolomite mixtures in the TIR region are centered within the wavelength range of 11.417–11.451 μm and 13.662–14.006 μm for grain size <45 μm, 11.421–11.497 μm and 13.631–13.977 μm for grain size 45–125 μm, and 11.469–11.578 μm and 13.563–13.940 μm for grain size 125–500 μm. Absorption band depth, FWHM, and asymmetry of the features also vary with calcite content (Figure 8). The features tend to have positive asymmetry which skews to longer wavelengths.
4. Discussions
4.1. Effect of Grain Size
Varying grain size in carbonate samples influences spectral shape and thus absorption feature characteristics in the SWIR and TIR wavelength regions. Particularly, reflectance and depth of absorption bands change (Figures 2 and 4). The studies by van der Meer [8], Gaffey [21], and Crowley [29] also show that the reflectance and depth of absorption bands of these minerals in SWIR spectra are affected by grain size. Coarse grain size fractions absorb more electromagnetic radiation penetrating to the grain surface than fine grain size associated with thickness of the grain or internal optical path of the grain [19,32] according to Lambert-Beer’s Law, typical of transparent material [19], and roughness of the grain surface [29].
The presence of carbonate ion in a mineral or rock is characterized by several fundamental vibrational bands in the SWIR [17,18,20,21] and TIR [17,19,20] regions. The two prominent absorption features in SWIR reflectance spectra of calcite and dolomite (Figure 2) are caused by overtones and combination tones of internal vibrational processes of carbonate ions [17,18,20,21]. In TIR spectra (Figure 4), the two diagnostic absorption features are generated by two vibrational bending modes of carbonate ions, which are out-of-plane bends for the feature at 11.5 μm and in-plane bends for the feature at 14 μm [17,19,20].
The position of absorption bands for both features in pure powdered calcite and dolomite spectra in the SWIR wavelength region appeared invariant to grain size fraction (Figure 3), confirming results reported by van der Meer [8] and Gaffey [21]. Although the center of the absorption band position is not influenced by grain size, the band positions are centered at a slightly different wavelength, when compared to previous studies [8,18,21,22]. Gaffey [21] revealed that using different spectroscopic instruments and methods to calculate band position may result in changing the center of the band position. In this study, we used an advance hyperspectral spectrometer with very high spectral resolution for reflectance spectra measurement, so that it could be the reason why our result is slightly different from others. The FWHM and asymmetry of the features at 2.3 and 2.5 μm in the SWIR region varied with grain size fraction (Figures 2 and 3), which is in contrast to what has been published in prior studies [8,21]. Here it was stated that the width and asymmetry of absorption features, and the number of absorption bands are not changing or invariant with particle size [8,21]. In addition, the FWHM for both absorption features is wider for dolomite than for calcite.
The band position of both features in the TIR wavelength region appeared to be dependent on grain size fraction of the sample (Figure 4). The center of the band position changed slightly at different wavelengths, confirming results of previous studies [19,23–26]. Reflectance intensity of band shoulders on the left and right sides of both features at 11.5 and 14 μm decreased considerably more than for the band centers, when the grain size becomes coarser in the sample. Therefore, it influences spectral shapes and absorption feature characteristics. As grain size affects the shape of absorption features [19], it may also affect band position. The absorption band depth, FWHM, and asymmetry of the TIR carbonate features also varied with grain size, but the feature parameters were difficult to analyze given the weak nature of spectral features at larger grain sizes, especially between 125 and 500 μm grain sizes.
4.2. Effect of Mineral Mixing
Varying quantity of calcite and dolomite in the sample affects absorption band position in the SWIR and TIR wavelength regions. Work reported by van der Meer [8] for carbonate band positions in SWIR spectra of calcite-dolomite mixtures shows the same trends found in the course of this study. Gaffey [27] also reported that absorption band position in calcite and dolomite spectra displaces with changed chemical composition such as increased Mg content in calcite and Fe content in dolomite. However, the absorption band position displaced also with grain size, especially when the calcite content in the samples increases from 25% to 75% (Figure 7), although the band position did not shift in the SWIR spectra of pure powdered calcite and dolomite (Figure 3). This effect may be caused by the mixing of calcite and dolomite in the sample, which is dominated by one of the two carbonate minerals or “pilling effect” of the fine grains in the sample [18]. The FWHM of the 2.5 μm feature in mixed mineral spectra is wider than the 2.3 μm feature (Figure 7), which is the same as the FWHM of pure calcite and dolomite spectral features (Figure 3), most likely due to stronger vibrational absorption at 2.5 μm [18].
The absorption band position of calcite-dolomite mixtures in the TIR was not only dependent on mineral contents, but also on grain size (Figure 9). Absorption features may be affected by grain size and multiple scattering effects [19]. The absorption band depth, FWHM, and asymmetry of the features also varied with calcite content (Figure 8). These characteristics show the same pattern as pure calcite or dolomite feature characteristics (Figure 4), when the quantity of calcite-dolomite mixtures composing a sample is dominated by one of those minerals. It was also difficult to analyze due to less pronounced spectral features with increased grain size.
4.3. Mineralogical Mapping Applications
Results of this study indicate that absorption band positions of the two prominent carbonate features in the SWIR and TIR wavelength regions are distinctive of carbonate minerals with different grain size and mineral content (Figures 3, 5, 7 and 9). Previous research has revealed that the two prominent carbonate features in the SWIR [8,18,21,22] and TIR [17,19,23] regions are essential to distinguish between calcite and dolomite, as they contain the strongest vibrational absorption features of carbonate ions. Therefore, these features are useful for identifying pure and mixed calcite and dolomite as well as estimating the relative abundances of both minerals in a synthetic sample or rock. Previous research has demonstrated that distinctive spectral reflectance characteristics in the near infrared through laboratory experiment and remote sensing imagery can assist in identification of carbonate minerals and dolomitization patterns [9,10,43]. Van der Meer [8] stated that estimation of the calcite-dolomite ratio from spectra could be done using diagnostic absorption features around 2.30–2.34 μm, of which the exact position is dependent on the relative amounts of calcite and dolomite. Consequently, knowledge of these precise absorption band positions may be applied to analysis of hyperspectral remote sensing imagery for mapping carbonate minerals and dolomitization patterns in limestones.
5. Conclusions
Absorption feature characteristics and reflectance values of pure and mixed calcite and dolomite spectra in the SWIR and TIR wavelength regions were influenced by grain size and carbonate mineral content. Absorption band positions of both features in these wavelength regions were displaced slightly as observed in previous studies. The positions of SWIR calcite features at 2.340 μm and 2.537 μm and dolomite features at 2.323 μm and 2.515 μm were invariant to grain size. The FWHM and asymmetry of the calcite and dolomite spectral features at 2.3 and 2.5 μm in the SWIR region varied with grain size fraction, in contrast to what has been published in prior studies that the width and asymmetry of absorption features, and the number of absorption bands are not changing or invariant with particle size. In the TIR region, the positions depended on grain size and shifted to longer wavelength for the feature at 11.5 μm and to shorter wavelength for the feature at 14 μm from fine to coarse grain size fractions. The positions of both features of calcite-dolomite mixtures in the SWIR and TIR wavelength regions were determined by the calcite or dolomite content composing the sample. The positions of the features in the SWIR region were centered within the wavelength range of 2.323–2.340 μm and 2.515–2.537 μm. In the TIR region, however, the absorption band positions of the calcite-dolomite mixtures not only depended on mineral content, but also on grain size in the sample. Knowledge of these detailed feature characteristics can increase the accuracy of spectral identifications of pure and mixed calcite and dolomite with different grain size and carbonate mineral content, which is of particular use for assessments of dolomitization patterns in limestones.
This study has contributed to understanding the effects of grain size and mineral mixtures on the spectral absorption feature characteristics in the SWIR and TIR wavelength regions, which will help in improving mineral identification on the earth’s surface using hyperspectral remote sensing.
Acknowledgments
The authors would like to thank Boudewijn de Smeth, who kindly supported and facilitated of sample preparations at Faculty of Geo-Information Science and Earth Observation (ITC), University of Twente, The Netherlands. We want to express our gratitude to Christoph Hecker for his assistance in the spectral measurements and for the discussions on the TIR carbonate spectroscopy.
References
- Pettijohn, F.J. Limestones and Dolomites. In Sedimentary Rocks, 3rd ed.; Harper & Row: New York, NY, USA, 1975; pp. 316–391. [Google Scholar]
- Blatt, H.; Middleton, G.; Murray, R. Origin of Limestones. In Origin of Sedimentary Rocks; Prentice-Hall: Englewood Cliffs, NJ, USA, 1972; pp. 409–455. [Google Scholar]
- Deer, W.A.; Howie, R.A.; Zussman, J. Carbonates. In Introduction to the Rock: Forming Minerals; Longman: London, UK, 1966; pp. 473–503. [Google Scholar]
- Waltham, A.C. Sedimentary Processes and Rocks. In Foundations of Engineering Geology, 3rd ed.; Spon: London, UK, 2009; pp. 8–10. [Google Scholar]
- Harbaugh, J.W. Carbonate Oil Reservoir Rock. In Carbonate Rocks: Origin, Occurence and Classification; Chilingar, G.V., Bissell, H.J., Fairbridge, R.W., Eds.; Elsevier: Amsterdam, The Netherlands, 1976; Volume 9A, pp. 349–398. [Google Scholar]
- Friedman, G.M.; Sanders, J.E. Origin and Occurrence of Dolostones. In Carbonate Rocks: Origin, Occurence and Classification; Chilingar, G.V., Bissell, H.J., Fairbridge, R.W., Eds.; Elsevier: Amsterdam, The Netherlands, 1967; Volume 9A, pp. 266–348. [Google Scholar]
- Hatch, F.H.; Rastall, R.H. Carbonate Rocks: Magnesian Limestones and Dolomites. In Textbook of Petrology: Vol. 2. Petrology of the Sedimentary Rocks, 4th revised ed.; Allen & Unwin: London, UK, 1965; pp. 221–234. [Google Scholar]
- van der Meer, F.D. Spectral reflectance of carbonate mineral mixtures and bidirectional reflectance theory: Quantitative analysis techniques for application in remote sensing. Remote Sens. Rev 1995, 13, 67–94. [Google Scholar]
- van der Meer, F. Classification of remotely-sensed imagery using an indicator kriging approach: Application to the problem of calcite-dolomite mineral mapping. Int. J. Remote Sens 1996, 17, 1233–1249. [Google Scholar]
- van der Meer, F. Mapping dolomitization through a co-regionalization of simulated field and image-derived reflectance spectra: A proof-of-concept study. Int. J. Remote Sens 1998, 19, 1615–1620. [Google Scholar]
- Rockwell, B.W.; Hofstra, A.H. Identification of quartz and carbonate minerals across northern Nevada using ASTER thermal infrared emissivity data—Implications for geologic mapping and mineral resource investigations in well-studied and frontier areas. Geosphere 2008, 4, 218–246. [Google Scholar]
- Kozak, P.K.; Duke, E.F.; Roselle, G.T. Mineral distribution in contact-metamorphosed siliceous dolomite at Ubehebe Peak, California, based on airborne imaging spectrometer data. Am. Mineralogist 2004, 89, 701–713. [Google Scholar]
- Baker, A.C.; Glynn, P.W.; Riegl, B. Climate change and coral reef bleaching: An ecological assessment of long-term impacts, recovery trends and future outlook. Estuar. Coast. Shelf Sci 2008, 80, 435–471. [Google Scholar]
- Hochberg, E.J.; Atkinson, M.J. Spectral discrimination of coral reef benthic communities. Coral Reefs 2000, 19, 164–171. [Google Scholar]
- van der Meer, F. Spectral mixture modelling and spectral stratigraphy in carbonate lithofacies mapping. ISPRS J. Photogramm 1996, 51, 150–162. [Google Scholar]
- Gupta, R.P. Remote Sensing Geology, 2nd ed; Springer: Berlin, Germany, 2003; p. 655. [Google Scholar]
- Clark, R.N. Spectroscopy of Rocks and Minerals, and Principles of Spectroscopy. In Remote Sensing for the Earth Sciences: Manual of Remote Sensing, 3rd ed.; Rencz, A.N., Ed.; John Wiley and Sons: New York, NY, USA, 1999; Volume 3, pp. 3–58. [Google Scholar]
- Hunt, G.R.; Salisbury, J.W. Visible and near infrared spectra of minerals and rocks: II. Carbonates. Mod. Geol 1971, 2, 23–30. [Google Scholar]
- Salisbury, J.W.; Hapke, B.; Eastes, J.W. Usefulness of weak bands in mid infrared remote sensing of particulate planetary surface. J. Geophys. Res 1987, 92, 702–710. [Google Scholar]
- Clark, R.N.; King, T.V.V.; Klejwa, M.; Swayze, G.A.; Vergo, N. High spectral resolution reflectance spectroscopy of minerals. J. Geophys. Res 1990, 95, 12653–12680. [Google Scholar]
- Gaffey, S.J. Spectral reflectance of carbonate minerals in the visible and near infrared (0.35–2.55 microns): Calcite, aragonite, and dolomite. Am. Mineralogist 1986, 71, 151–162. [Google Scholar]
- Baissa, R.; Labbassi, K.; Launeau, P.; Gaudin, A.; Ouajhain, B. Using HySpex SWIR-320m hyperspectral data for the identification and mapping of minerals in hand specimens of carbonate rocks from the Ankloute Formation (Agadir Basin, Western Morocco). J. Afr. Earth Sci 2011, 61, 1–9. [Google Scholar]
- Huang, C.K.; Kerr, P.F. Infrared study of the carbonate minerals. Am. Mineralogist 1960, 45, 311–324. [Google Scholar]
- Lane, M.D.; Christensen, P.R. Thermal infrared emission spectroscopy of anhydrous carbonates. J. Geophys. Res.-Planet 1997, 102, 25581–25592. [Google Scholar]
- Ji, J.F.; Ge, Y.; Balsam, W.; Damuth, J.E.; Chen, J. Rapid identification of dolomite using a Fourier Transform Infrared Spectrophotometer (FTIR): A fast method for identifying Heinrich events in IODP Site U1308. Mar. Geol 2009, 258, 60–68. [Google Scholar]
- Reig, F.B.; Adelantado, J.V.G.; Moreno, M.C.M.M. FTIR quantitative analysis of calcium carbonate (calcite) and silica (quartz) mixtures using the constant ratio method. Application to geological samples. Talanta 2002, 58, 811–821. [Google Scholar]
- Gaffey, S.J. Reflectance spectroscopy in the visible and near infrared (0.35–2.55 microns): Applications in carbonate petrology. Geology 1985, 13, 270–273. [Google Scholar]
- Povarennykh, A.S. Use of infrared-spectra for determination of minerals. Am. Mineralogist 1978, 63, 956–959. [Google Scholar]
- Crowley, J.K. Visible and near-infrared spectra of carbonate rocks-reflectance variations related to petrographic texture and impurities. J. Geophys. Res.-Solid 1986, 91, 5001–5012. [Google Scholar]
- Hecker, C.; Hook, S.J.; van der Meijde, M.; Bakker, W.; van der Werff, H.; Wilbrink, H.; van Ruitenbeek, F.J.A.; de Smeth, B.; van der Meer, F.D. Thermal infrared spectrometer for earth science remote sensing applications—Instrument modifications and measurement procedures. Sensors 2011, 11, 10981–10999. [Google Scholar]
- van der Meer, F.D. Analysis of spectral absorption features in hyperspectral imagery. Int. J. Appl. Earth Obs 2004, 5, 55–68. [Google Scholar]
- Clark, R.N.; Roush, T.L. Reflectance spectroscopy-quantitative analysis techniques for remote sensing applications. J. Geophys. Res 1984, 89, 6329–6340. [Google Scholar]
- Kruse, F.A.; Lefkoff, A.B.; Dietz, J.B. Expert system-based mineral mapping in Northern Death-Valley, California Nevada, using the airborne visible infrared imaging spectrometer (AVIRIS). Remote Sens. Environ 1993, 44, 309–336. [Google Scholar]
- Kokaly, R.F.; Clark, R.N. Spectroscopic determination of leaf biochemistry using band-depth analysis of absorption features and stepwise multiple linear regression. Remote Sens. Environ 1999, 67, 267–287. [Google Scholar]
- Smith, M.J.; Stevens, T.; MacArthur, A.; Malthus, T.J.; Lu, H.Y. Characterising Chinese loess stratigraphy and past monsoon variation using field spectroscopy. Quatern. Int 2011, 234, 146–158. [Google Scholar]
- Mutanga, O.; Skidmore, A.K.; Prins, H.H.T. Predicting in situ pasture quality in the Kruger National Park, South Africa, using continuum-removed absorption features. Remote Sens. Environ 2004, 89, 393–408. [Google Scholar]
- Yitagesu, F.A.; van der Meer, F.; van der Werff, H.; Hecker, C. Spectral characteristics of clay minerals in the 2.5–14 μm wavelength region. Appl. Clay Sci 2011, 53, 581–591. [Google Scholar]
- Luleva, M.I.; van der Werff, H.; Jetten, V.; van der Meer, F. Can infrared spectroscopy be used to measure change in potassium nitrate concentration as a proxy for soil particle movement? Sensors 2011, 11, 4188–4206. [Google Scholar]
- Youngentob, K.N.; Roberts, D.A.; Held, A.A.; Dennison, P.E.; Jia, X.P.; Lindenmayer, D.B. Mapping two Eucalyptus subgenera using multiple endmember spectral mixture analysis and continuum-removed imaging spectrometry data. Remote Sens. Environ 2011, 115, 1115–1128. [Google Scholar]
- Hecker, C.; van der Meijde, M.; van der Werff, H.; van der Meer, F.D. Assessing the influence of reference spectra on synthetic SAM classification results. IEEE Trans. Geosci. Remote Sens 2008, 46, 4162–4172. [Google Scholar]
- Hubbard, B.E.; Crowley, J.K.; Zimbelman, D.R. Comparative alteration mineral mapping using visible to shortwave infrared (0.4–2.4 μm) Hyperion, ALI, and ASTER imagery. IEEE Trans. Geosci. Remote Sens 2003, 41, 1401–1410. [Google Scholar]
- ITT. Visual Information Solutions. Available online: http://www.ittvis.com (accessed on 18 May 2010).
- Windeler, D.S.; Lyon, R.J.P. Discriminating dolomitization of marble in the Ludwig Skarn near Yerington, Nevada using high-resolution airborn infrared imagery. Photogramm. Eng. Remote Sensing 1991, 57, 1171–1177. [Google Scholar]
Figure 1.
Definitions of absorption feature characteristics.

Figure 2.
Reflectance spectra of pure powdered calcite and dolomite for each grain size fraction in the shortwave infrared (SWIR) wavelength region. The center of absorption band position is not affected by grain size.
Figure 2.
Reflectance spectra of pure powdered calcite and dolomite for each grain size fraction in the shortwave infrared (SWIR) wavelength region. The center of absorption band position is not affected by grain size.

Figure 3.
Absorption feature parameters of pure powdered (a) calcite and (b) dolomite as a function of grain size obtained from the spectral features at 2.3 (▴) and 2.5 μm (●), shown in Figure 2.
Figure 3.
Absorption feature parameters of pure powdered (a) calcite and (b) dolomite as a function of grain size obtained from the spectral features at 2.3 (▴) and 2.5 μm (●), shown in Figure 2.

Figure 4.
Reflectance spectra of pure powdered calcite and dolomite for each grain size fraction in the thermal infrared (TIR) wavelength region. The center of absorption band position is affected by grain size.
Figure 4.
Reflectance spectra of pure powdered calcite and dolomite for each grain size fraction in the thermal infrared (TIR) wavelength region. The center of absorption band position is affected by grain size.

Figure 5.
Absorption band positions of pure powdered (a) calcite and (b) dolomite in the TIR wavelength region as a function of grain size (features at 11.5 (▴) and 14 μm (●)), shown in Figure 4.
Figure 5.
Absorption band positions of pure powdered (a) calcite and (b) dolomite in the TIR wavelength region as a function of grain size (features at 11.5 (▴) and 14 μm (●)), shown in Figure 4.

Figure 6.
Spectral features of calcite-dolomite mixtures for each grain size fraction in the SWIR wavelength region. Position of absorption bands is a function of calcite content in the sample. (C = calcite and D = dolomite, prefix numbers showing the mineral contents in percent).
Figure 6.
Spectral features of calcite-dolomite mixtures for each grain size fraction in the SWIR wavelength region. Position of absorption bands is a function of calcite content in the sample. (C = calcite and D = dolomite, prefix numbers showing the mineral contents in percent).


Figure 7.
SWIR absorption feature parameters of calcite-dolomite mixtures for each grain size fraction (grain size: <45 μm (●), 45–125 μm (▪), and 125–500 μm (▴)) obtained from (a) feature at 2.3 μm and (b) feature at 2.5 μm, shown in Figure 6.
Figure 7.
SWIR absorption feature parameters of calcite-dolomite mixtures for each grain size fraction (grain size: <45 μm (●), 45–125 μm (▪), and 125–500 μm (▴)) obtained from (a) feature at 2.3 μm and (b) feature at 2.5 μm, shown in Figure 6.

Figure 8.
TIR spectral features of calcite-dolomite mixtures for each grain size fraction. Position of absorption bands is a function of the calcite content in the sample. (C = calcite and D = dolomite, prefix numbers showing the mineral contents in percent).
Figure 8.
TIR spectral features of calcite-dolomite mixtures for each grain size fraction. Position of absorption bands is a function of the calcite content in the sample. (C = calcite and D = dolomite, prefix numbers showing the mineral contents in percent).


Figure 9.
Absorption band positions of calcite-dolomite mixtures in the TIR region for each grain size fraction (grain size: <45 μm (●), 45–125 μm (▪), and 125–500 μm (▴)) obtained from (a) feature at 11.5 μm and (b) feature at 14 μm, shown in Figure 8.
Figure 9.
Absorption band positions of calcite-dolomite mixtures in the TIR region for each grain size fraction (grain size: <45 μm (●), 45–125 μm (▪), and 125–500 μm (▴)) obtained from (a) feature at 11.5 μm and (b) feature at 14 μm, shown in Figure 8.

Share and Cite
MDPI and ACS Style
Zaini, N.; Van der Meer, F.; Van der Werff, H. Effect of Grain Size and Mineral Mixing on Carbonate Absorption Features in the SWIR and TIR Wavelength Regions. Remote Sens. 2012, 4, 987-1003. https://doi.org/10.3390/rs4040987
AMA Style
Zaini N, Van der Meer F, Van der Werff H. Effect of Grain Size and Mineral Mixing on Carbonate Absorption Features in the SWIR and TIR Wavelength Regions. Remote Sensing. 2012; 4(4):987-1003. https://doi.org/10.3390/rs4040987
Chicago/Turabian StyleZaini, Nasrullah, Freek Van der Meer, and Harald Van der Werff. 2012. "Effect of Grain Size and Mineral Mixing on Carbonate Absorption Features in the SWIR and TIR Wavelength Regions" Remote Sensing 4, no. 4: 987-1003. https://doi.org/10.3390/rs4040987