Dielectric and Radiative Properties of Sea Foam at Microwave Frequencies: Conceptual Understanding of Foam Emissivity


Remote Sensing Division, Naval Research Laboratory, Washington, DC 20375, USA
*
Author to whom correspondence should be addressed.
Remote Sens. 2012, 4(5), 1162-1189; https://doi.org/10.3390/rs4051162
Submission received: 14 March 2012
/
Revised: 16 April 2012
/
Accepted: 18 April 2012
/
Published: 27 April 2012
Abstract
:Foam fraction can be retrieved from space-based microwave radiometric data at frequencies from 1 to 37 GHz. The retrievals require modeling of ocean surface emissivity fully covered with sea foam. To model foam emissivity well, knowledge of foam properties, both mechanical and dielectric, is necessary because these control the radiative processes in foam. We present a physical description of foam dielectric properties obtained from the foam dielectric constant including foam skin depth; foam impedance; wavelength variations in foam thickness, roughness of foam layer interfaces with air and seawater; and foam scattering parameters such as size parameter, and refraction index. Using these, we analyze the scattering, absorption, reflection and transmission in foam and gain insights into why volume scattering in foam is weak; why the main absorption losses are confined to the wet portion of the foam; how the foam impedance matching provides the transmission of electromagnetic radiation in foam and maximizes the absorption; and what is the potential for surface scattering at the foam layers boundaries. We put all these elements together and offer a conceptual understanding for the high, black-body-like emissivity of foam floating on the sea surface. We also consider possible scattering regimes in foam.
1. Introduction
Oceanic whitecaps are a conspicuous expression of wave breaking with air entrainment. Creating rafts of sea foam on and bubble plumes below the sea surface, breaking waves transfer momentum, heat, and mass across the air-sea interface [1–4] and alter the optical field of the water column, the surface roughness, and the ambient noise in the ocean [5–7]. One (among others) physical quantity that is used to evaluate these air-sea interaction processes is the whitecap fraction, defined as the fraction of the ocean surface covered by foam.
Whitecap fraction can be evaluated with a number of parameterizations developed for open ocean [8] and coastal zone [9] using photographic measurements [10–12] in the visible portion of the electromagnetic (EM) spectrum. Whitecaps can also be observed at infrared [13] and microwave wavelengths [14]. Recent efforts to retrieve whitecap fraction from space-based radiometric observations of the ocean surface at microwave frequencies from 1 to 37 GHz show promise [15–18]. The retrieval algorithm requires the modeling of the ocean surface emissivity fully covered with sea foam ef.
Laboratory and field measurements have shown that ef at microwave frequencies is high, close to that of a blackbody [14,19–22]. To explain and model ef, one needs to understand the radiative processes taking place in foam. Knowledge of the mechanical and dielectric properties of sea foam is necessary for such an understanding. While extensive oceanographic research facilitates the characterization of the foam mechanical properties (Chapters 4.4 and 4.5 in [23]), the knowledge of the foam dielectric properties is incomplete.
Basis for the dielectric properties of a medium is its relative dielectric constant (permittivity). Permittivity determines such intrinsic characteristics of the medium as skin (and penetration) depth, impedance, refractive index, etc. These quantities control the attenuation due to absorption and scattering and the transmission and reflection of the EM radiation in the medium. These radiative processes affect, in turn, the energy lost in and then emitted by the medium. Therefore, an understanding of the relative importance of all these characteristics and processes can assist the choice of an approach to model ef, the formulation of relevant assumptions and/or simplifications, and the interpretation of the model results.
We address the need for more complete characterization of foam dielectric and radiative properties in a series of papers. Anguelova [24] analyzed the available information to determine suitable formula to predict the complex permittivity of sea foam εf. Anguelova and Gaiser [25] focused on the skin depth of foam layers with a vertical void fraction profile. In the present paper, we consider the foam properties at microwave frequencies, which control fundamental radiative processes such as reflection, scattering, and transmission in vertically structured foam layers. The parameters used for this consideration are foam impedance η, size parameter x, and refractive index m (Section 3). Analysis of these dielectric properties helps to identify the unique traits, which the fundamental radiative processes acquire when microwave radiation interacts with sea foam (Section 4). Finally, we put all our findings together to formulate a concept of the high foam emissivity (Sections 5.1 and 5.2) and discuss scattering regimes in foam (Section 5.3). The information, findings, and generalizations in this series of papers form the physical basis on which we have built our foam emissivity model (briefly described in [16] and to be detailed in a forthcoming paper).
2. Background
2.1. Sea Foam as a Medium
Both whitecaps on the surface and bubble plumes beneath them constitute sea foam. For passive remote sensing of the ocean surface, the foam skin depth dictates our interest in the floating foam layers, excluding deeper bubble plumes [25]. Whitecaps corresponding to the inception of wave breaking are usually thick and bright (visually and radiometrically) and are referred to as active whitecaps. Whitecaps in their decaying phase are thinner and dimmer and are referred to as residual whitecaps. Anguelova [24] gives an extended definition of the sea foam.
Sea foam in surface layers has a specific vertical structure comprising large thin-walled bubbles close to the air-foam interface characterized with high air content (dry foam) and smaller, thick-walled bubbles with high water content (wet foam) close to the seawater boundary [20]. A set of macroscopic quantities such as void fraction fa (defined as the fraction of a unit volume of seawater that is occupied by air) and foam layer thickness t can describe this mechanical structure. A set of microscopic quantities such as bubble dimensions (radius a and wall thickness w) and concentration or size distribution N(a) are useful when one considers the characteristics of the bubbles forming the foam.
To describe oceanic whitecaps under various conditions and in different lifetime stages, the full range of void fractions fa (from 0 to 1) needs to be considered [24]. It was shown that various functional forms could represent the shape of the void fraction profile in the foam depth [25]. A review of oceanographic data from laboratory and field experiments [25] established a plausible range of foam layer thicknesses encountered in the ocean, from 1 cm to more than 12 cm in active whitecaps and from 0.1 to 1 cm when the whitecaps decay.
2.2. Bubbles in a Foam Layer
Bubble size distributions that characterize bubble plumes at different depths and under various wind speeds have been published extensively; see summaries in [23,26,27]. Meanwhile, there are just a few reports for bubble size distributions within the foam layer. Militskii et al. (Figure 3 in [28]) report bubble diameters within the foam layer in the range from 0.2 mm to 2 mm with the most probable value being 0.3 mm to 0.5 mm. From analysis of 20 foam images, Guo et al. [29] report the mode of the bubble size distribution to be around 0.5 mm “in the bottom half of the foam layer”. Certainly, the range of bubble sizes is much wider in natural conditions under various wind speeds. To encompass as fully as possible this range of bubble sizes, we refer to recent laboratory and field measurements of bubble size distributions in bubble plumes close to the surface, about 0.5 m below the interface, and soon after the breaking event [27,30]. Thus, we consider bubbles with radii a of the air cavity from 0.05 mm to 10 mm with a broad peak around radii of 0.05 mm to 1 mm.
2.3. Definitions of Electromagnetic Properties
Basic physical relationships from the electromagnetic theory determine the dielectric properties of a medium. Table 1 lists the formulae used to obtain all foam dielectric properties from the complex permittivity of foam εf at microwave frequencies F from 1.4 to 37 GHz. The formulae used are valid for scatter free medium, but are applicable to sea foam because a survey of experimental and modeling observations has shown that at the frequencies of interest the scattering in foam is weak to negligible (Section 2.3 in [24]).
Discernible interfaces at the air-foam and foam-water boundaries point toward possible contribution to radiation attenuation due to surface scattering by foam. To investigate whether the foam interfaces with air and water are rough or smooth as seen by microwave radiation, we use two criteria appropriate at microwave frequencies ([32], p. 827). The Fraunhofer criterion defines a surface as smooth if σ < σref, where σ is the standard deviation of the surface height (or RMS height) and the reference value is
, with λ being the wavelength and θ the incidence angle of the EM radiation. The other criterion expresses σ in electromagnetic units with the quantity kσ where k = 2π/λ is the radiation wavenumber.
3. Foam Dielectric Properties
3.1. Sea Foam Permittivity
Systematic investigation of various mixing rules yielded several possibilities for computing the dielectric constant of sea foam εf at microwave frequencies [24]. For consistency with the study on the foam skin depth [25], here we use εf obtained with the Polder-van Santen (PS) mixing rule (Equation (1) in Table 1). The calculations use a double Debye model for the complex dielectric constant of seawater ε [33]. Refer to [24] for the dependencies of εf obtained with the PS mixing rule on the frequency, sea surface temperature (SST), and salinity. All results are illustrated with an exponential profile for the foam void fraction fa(z) with values at the air-foam and foam-water boundaries of 99% and 1%, respectively. Refer to [25] for comparison of exponential fa(z) to other functional forms of the void fraction profile.
3.2. Foam Skin and Penetration Depths
Anguelova and Gaiser [25] obtained and analyzed in detail the skin depth d (Equation (2) in Table 1) of sea foam vertically stratified in layers with thickness t from 0.2 cm to 10 cm. For various frequencies F and the chosen fa(z) profile (Section 3.1), d could vary from 0.17 cm to no more than 7 cm. Analysis of the relationship between d, t, and the fa range (upper to lower values at the foam layer boundaries) showed that the thermal emission from foam-covered surfaces could be from the entire foam layer, from part of the foam layer, or from both the foam layer and the seawater.
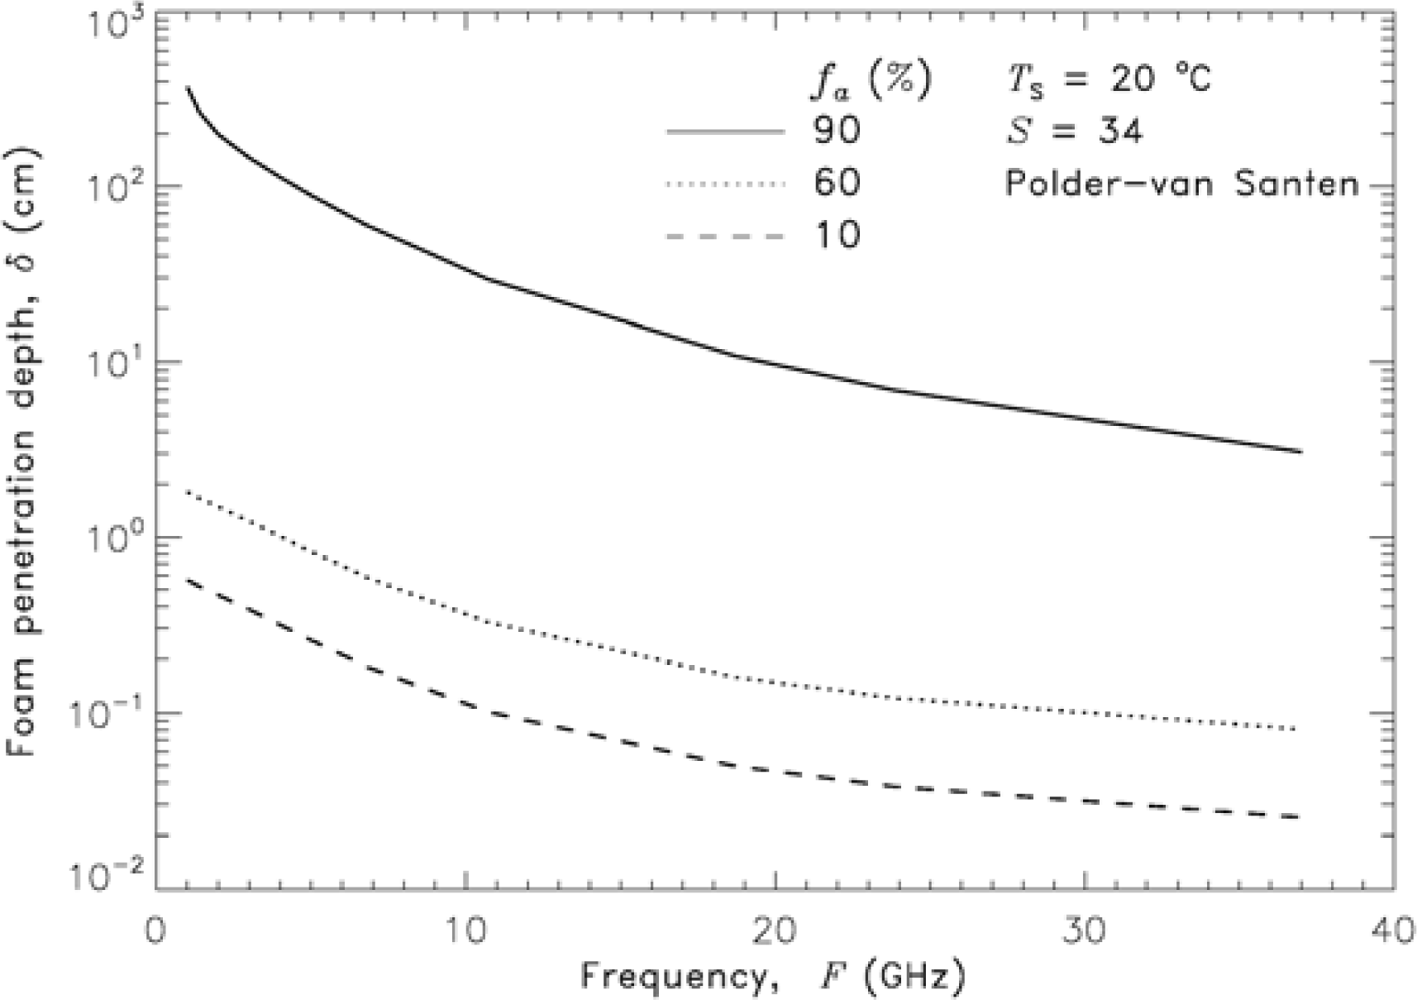
For any frequency or any layer thickness, d is thicker than its corresponding penetration depth δ (Equation (3) in Table 1) by a factor of up to 2 [25]. Figure 1 shows δ as a function of frequency for three fixed fa values. For fa = 90%, δ ranges from a few centimeters to a few meters; for fa < 60%, δ is mostly less than 1 cm.
3.3. Foam Impedance
The concept of impedance has been applied in different fields of physics ([38]; p. 282). In the EM theory, the intrinsic impedance of a medium follows from the relationship between the amplitudes of the electric and magnetic fields of EM radiation. It depends only on the medium properties and is important when the propagation of EM radiation through a medium is considered.
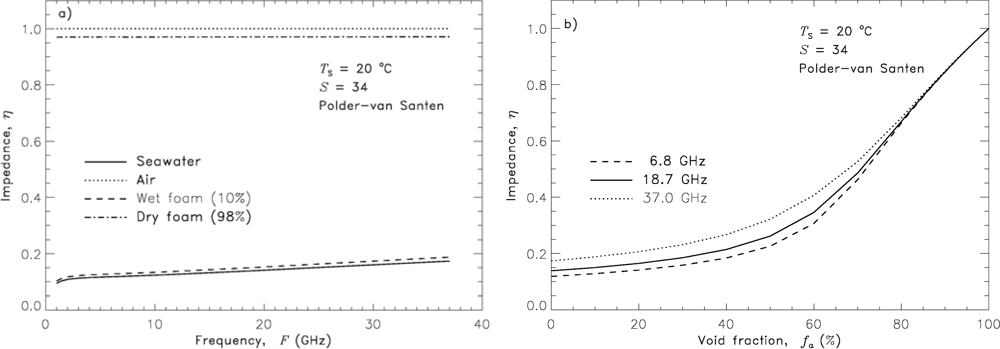
Figure 2(a) shows the magnitude
of a complex foam impedance η (Equation (4) in Table 1) for dry (constant vertical profile of fa = 98%, dash-dot line) and wet (constant profile of fa = 10%, dashed line) foam. The impedances of the seawater (solid line) and air (dotted line) are shown for comparison. Figure 2(b) depicts how the foam impedance changes as a function of fa in a vertically structured foam layer for three frequencies. Over the range of considered frequencies, foam impedance varies from 1 to less than 0.2 as fa decreases from 100% to 0%.
3.4. Wavelength Changes in Foam Layers
Vertical variations of the real part of the permittivity in foam thickness invoke changes in the radiation wavelength λf and propagation constant kf as compared to that in air λ0 (Equations (5) and (6) in Table 1). Table 2 shows values of λf in dry and wet foam represented with fa = 98% and 10%, respectively, for all considered frequencies. The corresponding values in seawater λ are also included for reference.
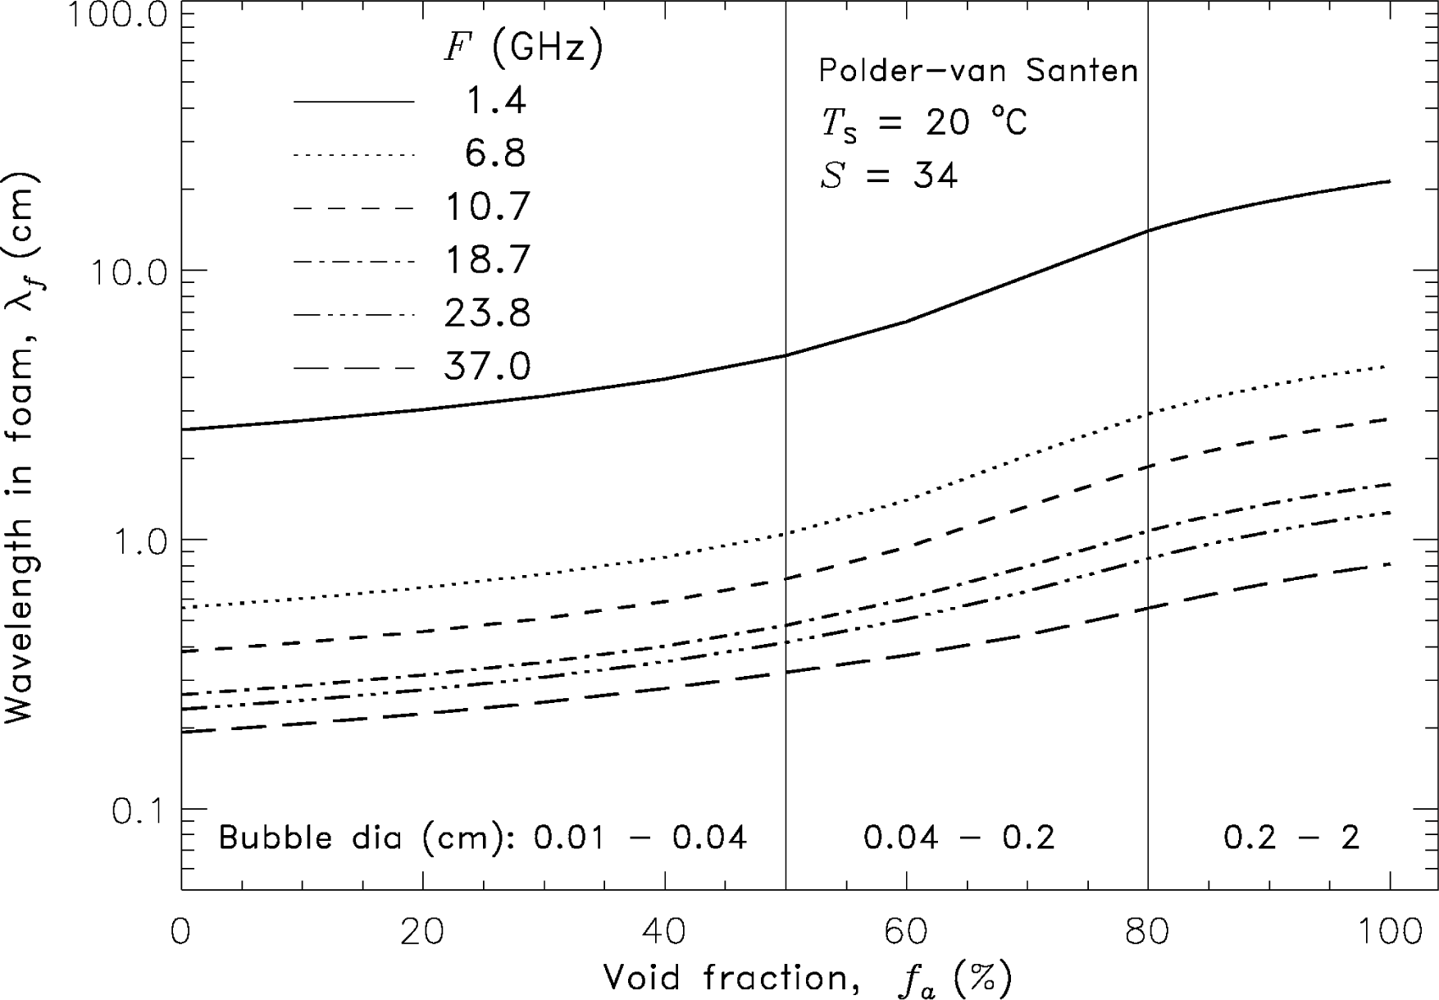
Figure 3 depicts the change of λf from λ0 to λ as it propagates through foam with varying void fraction. In the figure, for each frequency we discern three regions in the trend of λf based on the rate of change ∂λf/∂fa. In dry foam, λf varies slowly remaining close to λ0; ∂λf/∂fa changes by a factor of 1.4 (1.1) at 1.4 (37) GHz as void fraction changes from 80% to 100%. For void fractions below 40%, λf is quite close to λ and also changes relatively slowly. The slope ∂λf/∂fa changes by a factor of 2.6 on average over the range of frequencies when fa varies from 40% to 10%. A steeper transition between the air-like and seawater-like behavior takes place in the void fraction range of 80% to 40% with ∂λf/∂fa changing on average by a factor of 4.8. The lower the frequency the more clearly these three regions are seen.
On this basis we can broadly represent a vertically structured foam layer as a sequence of three relatively homogeneous sublayers, which stand for dry, intermediate wet, and wet foams. We identify these sublayers by their fa values with vertical lines in Figure 3. While we base this conceptual representation on different rates of change of λf values, Raizer (Figure 1(a) in [39]) gives a similar schematic of a vertically stratified foam based on experimental observations [28].
3.5. Scattering Parameters of Foam
3.5.1. Characteristic Bubbles for Each Foam Sublayer
The known scattering rules of individual particles [37] can be applied to foam mixture because the foam macroscopic parameters (e.g., fa and λf) are related to those of a separate bubble (e.g., fb and λb).
Qualitatively, such a relationship is possible because the vertical structure of a foam layer is associated with segregation by size of the bubbles forming the foam (see [24] and Section 2.1). Indeed, we expect that dry foam consist predominantly of large bubbles with an upper limiting radius of 10 mm (Section 2.2). Meanwhile, most of the smaller bubbles with a lower limiting radius of 0.05 mm would concentrate preferentially in the lower, wet part of the foam layer. The intermediately wet foam between these two limiting portions would comprise bubbles with wider size variation, with most typical sizes around the peak of the bubble size distribution (Section 2.2). Thus, the three sublayers of vertically structured foam associated with specific fa values (Section 3.4) could be alternatively differentiated by expected specific, predominant bubble radius a (Figure 3).
Quantitatively, this relationship is based on the fact that foam void fraction can be obtained from the bubble size distribution [7]. The void fraction fa of a collection of N bubbles with a fixed outer radius a and a wall (shell) of seawater w = a – qa, where qa is the inner radius of a bubble, is
For example, if a = 10 mm and w = 100 μm (i.e., q = 1 − w/a = 0.99), then fb ≈ 97%. Since a bubble with such dimensions (large a, thin wall w) is characteristic for the dry foam sublayer represented with fa = 98%, fb can characterize the mixture’s fa. Similarly, the void fractions of smaller bubbles, e.g., a = 0.3 mm and 0.1 mm, having walls with a thickness w of 0.05 mm (i.e., q = 0.83 and 0.5 respectively) are representative of foam with fa ≅ fb = q3 ≈ 60% and 12%, respectively.
3.5.2. Size Parameter in a Foam Layer
The size parameter x (or diffraction parameter [40]) describes the relationship between the radiation wavelength in a mixture and the sizes of the scatterers in it. In the case of foam, x quantifies how this relation changes in foam layer thickness as both λf and the dominant bubble size a change.
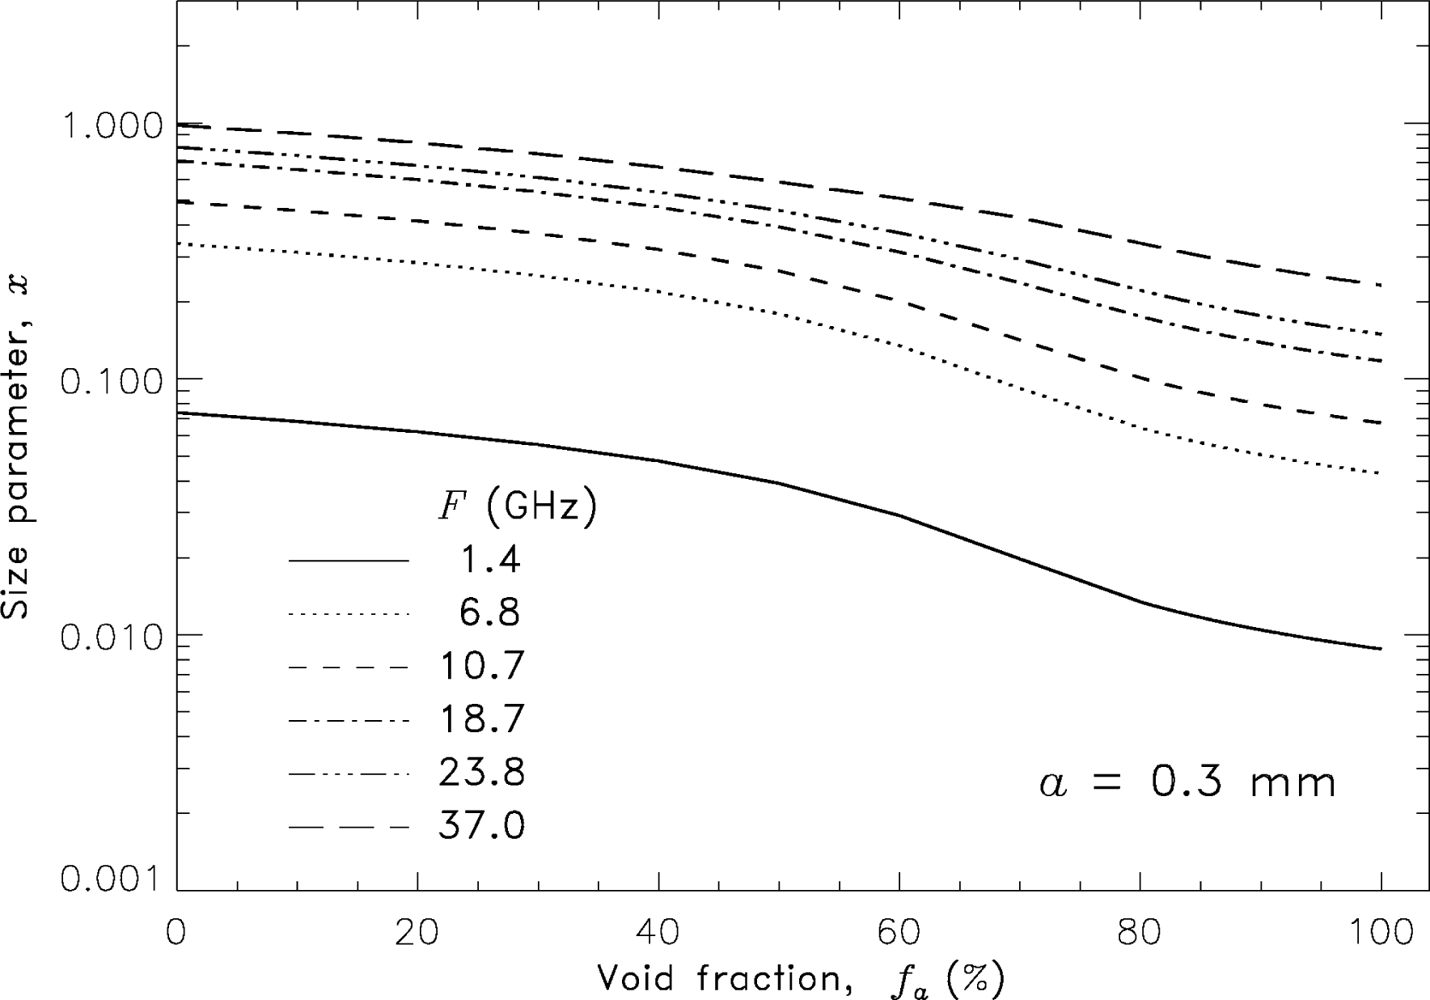
Figure 4 shows a family of curves for all considered frequencies representing x as a function of fa of a foam mixture comprising bubbles with a fixed radius a = 0.3 mm (a size within the peak of the bubble size distribution, Section 2.2). Changes of fa in the depth of foam comprising bubbles with the fixed radius a are realized via variations of bubble wall thickness w which yield q3 = fa (Section 3.5.1).
The figure shows that x increases as foam changes from dry to wet. This change of x in foam depth is stronger for lower frequencies in accord to the variations of the λf values shown in Table 2. For instance, at 37 GHz the value of x at fa = 98% changes by a factor of 3.8 compared to the values of x at fa = 10%, while at 10.7 GHz this change is by a factor of 6.6. Table 3 summarizes the ranges of variation of x in foam thickness using the values of the predominant bubble size for each sublayer (Columns 1 and 2 in Table 3).
3.5.3. Refractive Index of Foam
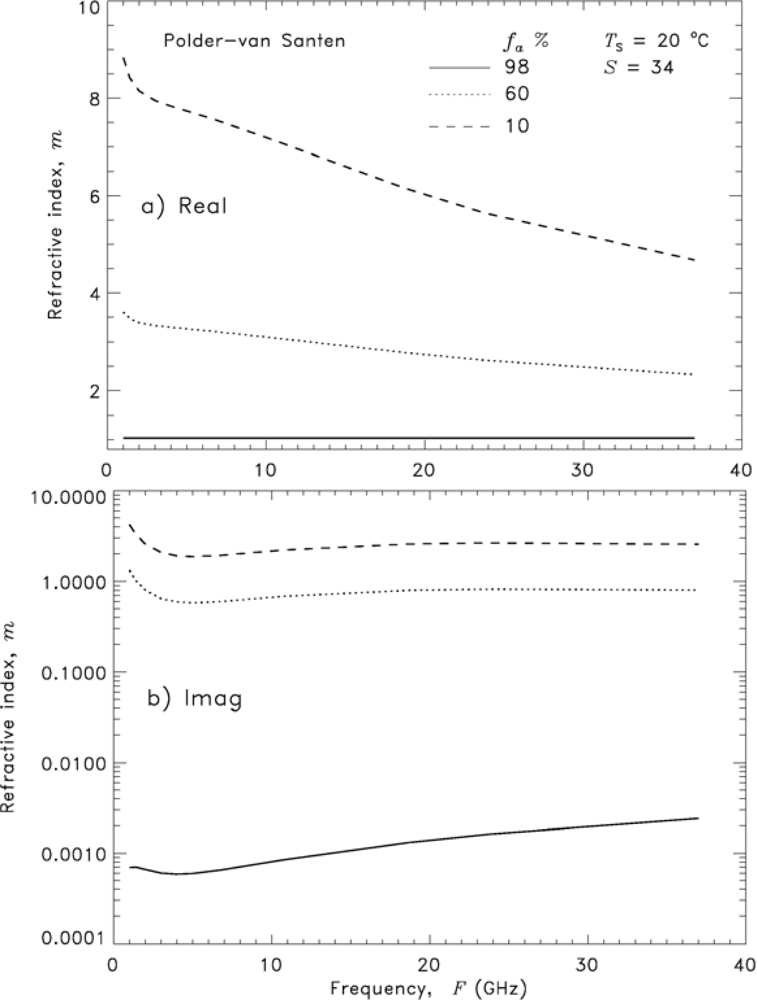
The refractive index of foam m is obtained with Equation (8) in Table 1. Figure 5 presents the real and imaginary parts of m (m′ and m″ in panels a and b, respectively) as a function of frequency at void fractions representative for each of the three sublayers—98%, 60%, and 10%. At a fixed void fraction value, the dependence on frequency is noticeable. But the variations due to changes of the void fraction are stronger, especially for the imaginary part. As expected, in dry foam (fa = 98%) m′ ≈ 1 and m″ features the lowest values of O(10−3). As the seawater content increases in foam depth, so does the refraction index (Table 3): at fa = 60%, m′ = O(3) and m″ = O(1); at fa = 10% m′ = O(5 to 9) and m″ = O(3).
3.6. Roughness of Foam Layer Interfaces
Though this is a mechanical, not dielectric, property of the sea foam, we consider the roughness of the foam layer interfaces because it is useful in considering the radiative processes in foam (Section 4.2). Structurally, foam roughness comes about as concave and convex surfaces formed at the boundaries from the bubble caps protruding into the air and indenting into the water. Roughness due to bubbles at the foam boundaries has not been presented in the literature. Here we make an order-of-magnitude estimate using two smoothness criteria (Section 2.3).
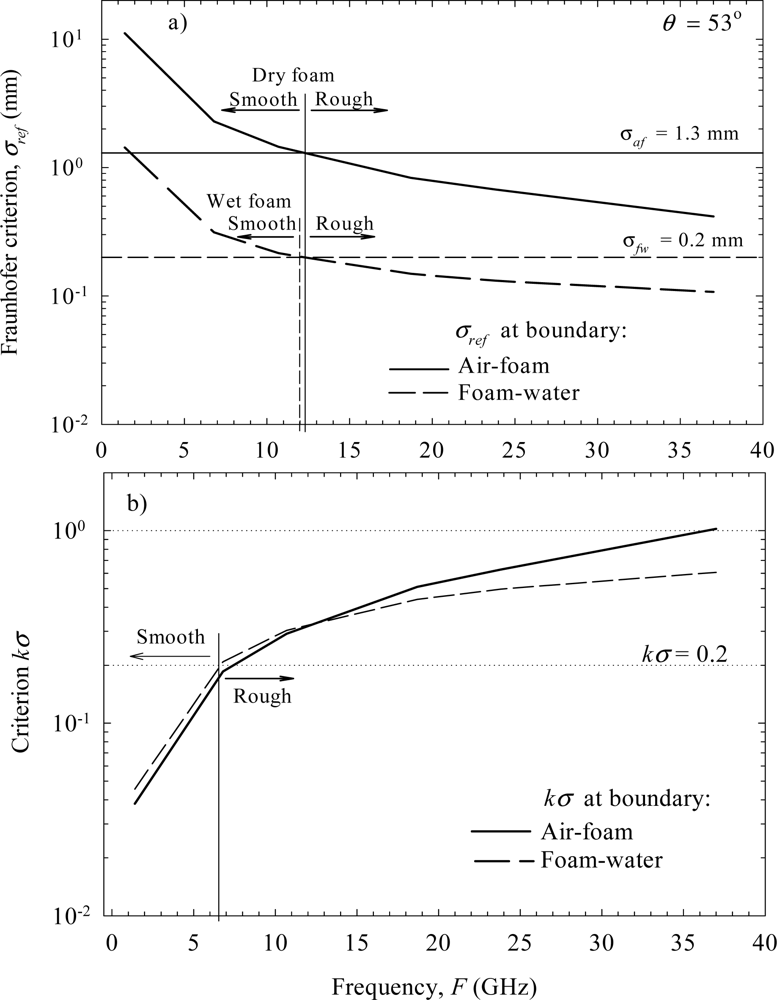
We assume that half of a bubble projects out of or indents into a reference surface to form a vertical characteristics length scale. We can thus use bubble radii to represent the roughness height of foam at the air and water interfaces. Bubble radius data are obtained in laboratory and field experiments [7,30,31]. From the large-size end of the bubble data (a from 1 mm to 10 mm), foam rms height at the air-foam boundary is σaf = 1.3 mm. At the foam-water interface, we estimate σfw = 0.2 mm using the small-size end of the bubble data, radii from 0.05 mm to 1 mm. For σref and kσ (Section 2.3) we use λ0 and λf at a void fraction of 10% (Table 2) for the air and water interfaces, respectively.
Figure 6 shows all these estimates together over the range of considered frequencies for θ = 53°. Panel (a) represents results for the Fraunhofer criterion (Section 2.3), while panel (b) shows results for the kσ criterion. At the air-foam interface, σref (curved solid line) of the Fraunhofer criterion changes from about 10 mm at 1.4 GHz to 0.4 mm at 37 GHz. Compared to the rms height due to bubbles at this boundary, σaf = 1.3 mm (horizontal solid line), the Fraunhofer criterion identifies dry foam as a smooth surface for frequencies below approximately 12 GHz (vertical solid line). For higher frequencies, the dry foam would be a rough surface. Approximately the same frequency limit of 12 GHz divides the wet foam into smooth and rough surfaces for the foam-water interface (dashed lines).
According to the kσ criterion, a surface is smooth if kσ < 0.2 and very rough if kσ > 1.0 ([32]; p. 828). Figure 6(b) shows how the kσ values for air-foam and foam-water boundaries (solid and dashed curves, respectively) compare to these limits (dotted lines). The smooth/rough separation for the boundaries of both dry and wet foam occurs at around 6.5 GHz. That is, according to the kσ criterion, dry and wet foam surfaces are rough for a wider range of frequencies than that established by the Fraunhofer criterion.
4. Radiative Processes in Foam
Following the Kirchoff’s law for thermal radiation [41]—the emissivity of a medium at thermal equilibrium equals its absorptivity—we know that in order to model the medium emissivity we need to evaluate the absorption losses in it. We recognize two possible pathways of absorption in foam layers (Section 4.5 in [25]). We call medium-intrinsic the absorption of the radiation propagating along the line of observation due to the presence of seawater, a lossy medium. We call scattering-driven the absorption caused by a lengthened path of propagation of the radiation along the line of observation due to the scattering among densely packed bubbles. The scattering-driven absorption enhances the medium-intrinsic absorption.
Note that we consider the attenuation caused by scattering-driven absorption different from the attenuation caused by loss of radiation scattered out of the line of observation. Both of these scattering effects cause attenuation in the medium, but one of them has a positive consequence for our considerations because it enhances the absorption and thus contributes to the emission of the medium. Our descriptive analysis does not allow evaluation of the relative magnitude of these two scattering effects. However, heeding the fact that sea foam has high thermal emission, which necessarily derives from strong absorption losses, we assume that the lost of radiation available for absorption via scattering is small in foam.
The processes, which “deliver” the EM radiation available for absorption in the foam are reflection and surface scattering at the air-foam and foam-water boundaries, scattering within the foam, and transmission through the foam. In the following, we analyze the foam dielectric properties presented in Section 3 and gain physical understanding of how these fundamental radiative processes acquire unique features because of the presence of vertical void fraction profile in a foam layer.
4.1. Foam Reflection and Transmission
4.1.1. Foam as Impedance Matching
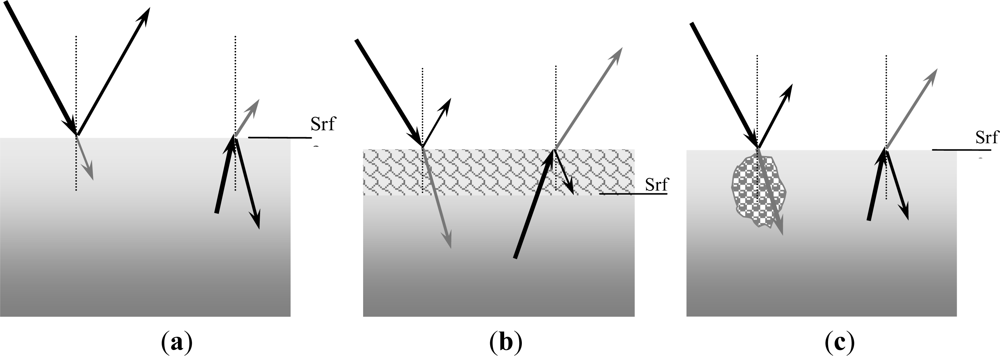
In absence of foam, the air water interface is highly reflective. The reason for this is the large difference between the dielectric constants of air (ε0 = 1 − i.0) and seawater, which leads to very different intrinsic impedances (Figure 2(a), solid and dotted lines). Because the impedance difference between two media determines the reflectivity at their interface, r ∝ Δη (e.g., p. 228 in [35]), the reflectivity at the air water boundary is large. Thus, only a small portion of down-welling atmospheric radiation impinging on the air water interface would pass and be available for absorption within the foam-seawater system. As Kirchoff’s law holds, a foam free water surface has low emission. The cartoon in Figure 7(a) illustrates this.
The situation changes when foam is present at the water air interface because the foam acts as matching impedance. Dry foam (e.g., fa ≅ 98%) at the top of the foam layer has dielectric properties close to those of air, while wet foam (fa ≅ 10%) at the bottom of the foam layer has dielectric properties similar to those of seawater [25]. Accordingly, the intrinsic impedances for wet and dry foam are close to those of seawater and air, respectively, Figure 2(a) (dashed and dash-dotted lines). Therefore, as the foam void fraction gradually changes from the top of the foam layer to its bottom, it provides a seamless matching of the dielectric properties of air and seawater, Figure 2(b). This action of a foam layer on the water surface is the natural counterpart of the technology used to reduce reflection in optical systems ([42], Chapter 2, §16). That is, the foam layer acts as an antireflective coating on the sea surface allowing effective transmission of down-welling atmospheric radiation into the foam-seawater system. As more of the transmitted radiation is absorbed in the foam-water system, more is emitted, ultimately resulting in high emissivity from foam-covered water surfaces. The cartoon in Figure 7(b) illustrates this situation.
4.1.2. Effectiveness of Impedance Matching
Williams [19] suggested that the most effective impedance matching of sea foam would necessarily involve a surface layer. Figure 2(b) confirms this suggestion by showing that the impedance difference between seawater and air is best minimized only when the full range of void fraction is present, from ≈ 100% to ≈ 0%. This could be fulfilled only when foam floats on the surface. Strong emission would not be observed when bubble plumes linger in the water column but foam is not present at the air-water interface above them (Figure 7(c)). The reason is that the lower impedance of the aerated seawater in the bubble plume is “shielded from the surface for microwaves” ([19], p. 223) and thus its matching role is obviated.
Besides presence or lack of foam on the surface, another possibility that might influence the effectiveness of the impedance matching is that the vertical profiles in foam layers with different thicknesses may cover limited instead of the full range of values. For instance, active whitecaps are thick thus they are anticipated to have impedance corresponding to wider range of void fractions, from an upper value of 80–100% down to about 10%. Meanwhile, the foam layers of residual whitecaps are thinner and may have a lower impedance associated with a narrower fa range shifted toward lower values, e.g., fa ∈ (<60% to 0%) ([25], Section 4.4). Figure 2(b) suggests, however, that even foam with a limited fa range could provide impedance matching. It may not be the most effective, but still it could mediate some decrease in the impedance mismatch between air and seawater. The most important requirement therefore for the impedance matching is the foam to float on the surface.
4.2. Surface Scattering of Foam
Only smooth boundary invokes a specular reflection as that illustrated in Figure 7(a). In real geophysical configurations, all boundaries are more or less rough. This results in a surface scattering pattern, which adds to or completely supersedes the specular reflection.
The strength of surface scattering is defined by the dielectric contrast of two media on both sides of an interface (as in Section 4.1) and the degree of roughness of this interface. In Section 4.1 we showed that, by the virtue of impedance matching, the foam boundaries are weakly to non-reflective surfaces. This relatively weak reflection might, however, be augmented if these boundaries are rough. In this section we address the question whether the roughness of the foam boundaries is large enough to affect the weak, dielectrically determined surface reflection of the sea foam.
Figure 6 showed that, according to the Fraunhofer criterion, both dry and wet foams appear rough to EM radiation above 12 GHz, while the kσ criterion places this limit to about 6.5 GHz. To put into prospective these results, we compare the foam rms height values σaf and σfw used in Figure 6 to the rms height of a wind-roughened sea surface σu. We obtain σu from the variance of the sea surface displacement h about the mean surface at a given point. It is defined as the zeroth moment of the wave spectrum S(K),
[43,44], where K = 2π/Λ is the wave number of an ocean wave with wavelength Λ. Note that σu is a measure of the geometric roughness of a wind-driven sea surface, not the aerodynamic roughness usually represented by the roughness length z0 [45,46].
The choice of integration limits Klow and Kup above determines the wavelength scales contributing to σu. But these length scales, determined mostly by geometric consideration, also need to be tied to length scales important for the aerodynamic surface roughness because this is the variable used for air-sea interaction studies. Our reasoning in choosing Klow and Kup is thus as follows. First, note that remote sensing of the sea surface is effective when the probing EM wavelengths λ0 are comparable to the length scales of the ocean waves. For example, for scatterometers, ocean length scales ranging from about 40 cm to less than 2 cm correspond to λ0 from 25 cm to 3 cm at incidence angles of 20° and 60° ([36], p. 1705). On this premiss, one can expect the probing wavelengths λ0 for the range of frequencies investigated here (Table 2) to be most relevant to ocean lengths scales from about 40 cm to a few millimeters. These length scales represent short gravity and capillary water waves. Next, note that analysis of the mean square slope of wave number spectrum, resulting from oceanographic surface wave measurements, has shown that intermediate-scale waves with Λ between 6 m and 2 cm are the dominant contributors to the aerodynamic surface roughness in oceans [47]. Combining these two considerations, we restrict our estimates to ocean length scales from 40 cm to 2 cm. The corresponding wavenumbers K range from 3.14 rad·cm−1 to 0.16 rad·cm−1. To cover this range of K values, we obtained m0 for three portions of the wave spectrum: S2(K), S3(K), and S4(K) as defined in [43]. In the estimates we used a friction velocity u* of 24 cm·s−1 (U10 ≈ 7 m·s−1), a value close to the globally averaged wind.
For the considered range of length scales for ocean waves, we find that the wind-roughened rms height σu ranges from about 1 mm for the short end of water waves (Λ of 2 cm) to 5.4 mm for longer water waves (Λ of 40 cm). We obtain similar estimates for σu if an empirically formulated wave spectrum in terms of mean square slope is used [47] instead of S(K).
A comparison of these estimates to σaf = 1.3 mm implies that there could be cases in which the roughness of the dry foam could be comparable to the roughness created by the shortest capillary waves. But the dielectric contrast between dry foam and air is almost none existing (Figure 2 and Section 4.1). This leads ultimately to lack of surface scattering at the air-foam boundary.
For the wet foam boundary, its roughness (σfw = 0.2 mm) is an order of magnitude below that of the shortest capillary waves (1 mm). This implies that wet foam, whether at the surface or as a sublayer in the foam thickness, is usually smoother than the sea surface roughness. We thus deem the wet foam boundary as incapable of providing significant surface scattering as well.
Our conclusion of negligible surface scattering by any of the foam layer boundaries is consistent with the general observation that the reflectivity of a foam-covered surface is not comparable to that of foam-free rough sea. In fact, microwave models (e.g., [48]) usually assume that “foam tends to decrease the reflectivity” ([49], p. 24). Note that the conclusions in this section result from the combined effect of the geometric roughness and the dielectric contrasts at the boundaries of a foam layer with well-stratified void fraction. Deviations from these conclusions are possible when the void fraction profile is limited (Section 5.2).
4.3. Weak Volume Scattering Throughout a Foam Layer
While we recognize the presence of scattering-driven pathway of attenuation in foam and expect it to play an important role in a structure conducive to significant scattering (namely, the close packing of bubbles), a previous survey ([24], Section 2.3) has shown that at the considered frequencies the scattering within the sea foam is weak. Here, we explain this counterintuitive conclusion.
Generally, one conjectures on the presence, or lack of, volume scattering in a medium by considering its effective penetration depth and the spatial and dielectric irregularities in its volume ([32], Chapter 11–4). The spatial and dielectric irregularities are usually quantified with their spatial distribution and dielectric contrast. The size parameter and the refractive index of a medium express these two quantities. Thus, in the following we analyze δ, x and m for clues regarding the volume scattering in foam.
Our reasoning proceeds in two steps. First, employing general scattering rules, we establish the expected scattering behavior for various foam structures. Second, we show how this expected behavior is altered (or not followed) in natural, vertically stratified foam layers.
4.3.1. Expected Scattering in Foam Layers
Using δ, we can identify the structure that could contribute to volume scattering the most. Because compared to fixed fa values the integral effect of a vertical fa profile is to limit d [25], we infer from Figure 1 that significant volume scattering could be expected in active whitecaps as they involve more dry foam and thus have the largest penetration depth. Because the penetration depth of intermediate-wet and wet foam (fa ≤ 60%, e.g., residual whitecaps) is much smaller, the inhomogeneities within could be assumed to contribute little to volume scattering.
Using x and m, we can further assess the strength and relative importance of the volume scattering in dry and wet foam. For this purpose, we employ two basic rules established for scattering by particles. Namely, (i) the larger the particle compared to the wavelength (λf << a or x >> 1) the more effective the scattering ([37], p. 68); and (ii) the larger the dielectric contrast between the refractive indices of the particle and the surrounding medium the stronger the scattering. That is, in the case of particles in air, there is no scattering for m = 1 and scattering is small for m near 1 ([37], p. 172). We apply these rules for particles to foam on the basis of the connection between foam layers and bubbles (Section 3.5.1).
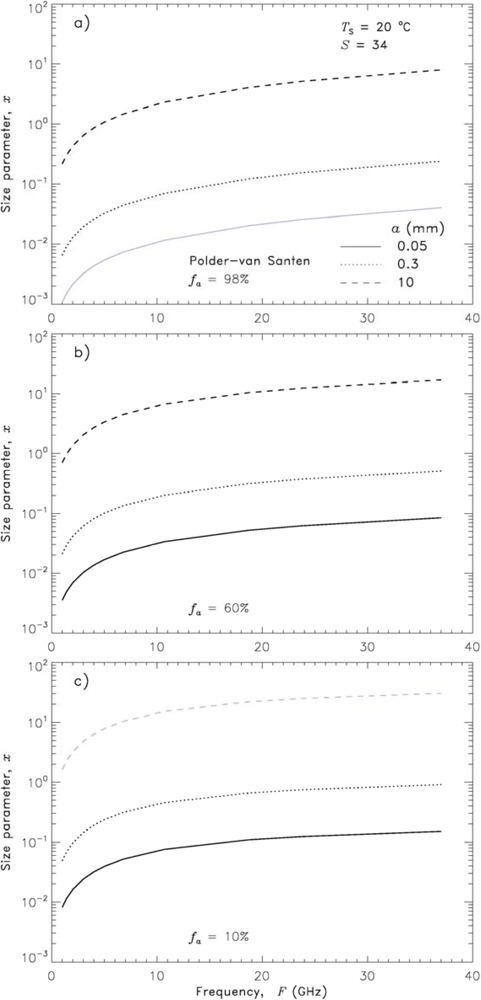
We start with the analysis of x values. Figures 8a–c show x as a function of frequency in dry, intermediate-wet, and wet foams for bubble sizes characteristic for each sublayer (Figure 3 and Table 3). In each panel, the size parameter associated with the characteristic bubble size, which is the least likely for the depicted void fraction is plotted in gray. We observe two trends from panels (a) to (c) in Figure 8. One trend is that for most frequencies, foam structures comprising large bubbles (a = 10 mm) have x > 1 or x >> 1 (dashed lines), whatever the void fraction those bubbles form by having various wall thicknesses w (recall Section 3.5.1). According to rule (i) above, this means that foam containing larger bubbles would have strong scattering. Another trend observed in Figure 8 is that x >> 1 in wetter foam (panels (b) and (c)) than in dry foam (panel (a)). From these two trends, we surmise that significant and effective volume scattering would be present in wet foam comprising large, thick-walled bubbles; Figure 8(c) (dashed line) exemplifies this generalization.
4.3.2. Altered Scattering in Foam Layers
The expected scattering behavior established in Section 4.3.1 is not readily applicable for natural foams in which bubbles sort themselves by size in the foam depth (Section 2.1). Because of the bubble size stratification, large bubbles are the least likely to occur or non-existing in wetter sublayers; Figure 8(c) shows this (the dashed line is gray). Thus, effective volume scattering should be confined to mostly dry foam. However, dry foam has the lowest x values (Figure 8(a)) compared to x of other foam structures (Figure 8(b,c)). Analysis of x thus reveals the first limitation for achieving strong volume scattering in natural foam layers. Namely, the volume scattering is restricted to the least effective scattering structure, the dry foam.
Analysis of m reveals another limitation for effective volume scattering in natural foam layers. From Figure 5 and rule (ii) (Section 4.3.1), we see that the x–limited effectiveness of the dry foam as a scattering medium is further diminished by its small dielectric contrast. Having m ≈ 1 (solid line in Figure 5), the refractive index of the dry foam does not differ much from that of the air. Thus, the scattering in dry foam is negligible. Meanwhile, as m increases in foam depth, the perceived ineffectiveness of the wet foam as a scattering medium based on x << 1 could be somewhat strengthened. This is especially true when wet foam is adjacent to air (residual whitecaps might exemplify such a case). But when wet foam is part of a vertically structured foam layer (as in active whitecaps), the increased values of m would still lead to modest enhancement of the volume scattering because the immediately adjacent sublayers have close m values.
Overall, we infer that, in a foam mixture comprising a distribution of bubble sizes sorted in foam depth, the simultaneous decrease of λf and the number of bubbles with radii effective for scattering keeps the x values relatively low and confined in a narrow range. As a result, the scattering in foam remains less effective. This is compounded with the effect of the dielectric contrast, which is expressed via m increasing in foam depth yet staying adjacent to sublayers with similar m values. The scattering in wet foam is somewhat more effective than the scattering in dry foam, however the thickness, thus the penetration depth, of wet foam restricts this further. The overall outcome is weak scattering throughout the foam.
4.4. Strong Absorption by Wet Foam Revisited
Section 4.3 provides a physical explanation of why, of the two pathways for absorption losses in foam, the scattering-driven one, though present, is not a major contributor. This thus qualitatively confirms the conclusion Anguelova and Gaiser ([25]; Section 4.5) reached that the medium-intrinsic absorption is the defining controlling factor for high foam absoprtivity. Anguelova and Gaiser [25] also showed that the thin water-laden wet foam could provide a strong emission from foam-covered sea surfaces. Here we give further evidence for this conclusion using the results for x and m.
Besides small skin depth ([25]; Section 4.1), another quantitative measure for the high absorptivity of foam as a medium is the fact that the refractive index (and permittivity εf) of foam is a complex number (m = m′ – im″, Section 3.5.3). Media with even very small m″ values have been called strongly absorbing. On the basis of m″ ≠ 0 and m – 1 << 1, which means that a negligible fraction of the radiation is reflected, one could conjecture that even dry foam (Figure 5, solid lines) would be absorptive. In fact, a combination of refractive index values similar to that of dry foam with large size parameter (e.g., x ≥ 100) could represent a medium whose behavior approaches that of a black body ([37], p. 269).
However, such a combination of m and x is not observed in natural dry foam because x does not exceed 10 (Figure 8(a)). The combination of a narrow range of x (x ≤ 10) with m″ << 1 thus excludes the possibility that dry foam contributes to medium-intrinsic absorption losses. Meanwhile, m′ and m″ values for wet foam are of the same order (Figure 5, dashed lines) signifying that this is an intrinsically absorptive medium. However little the volume scattering in wet foam (Section 4.3), it adds to the medium-intrinsic absorption, making the wet foam a more effective absorber than the dry foam.
5. Discussion
5.1. Concept for the High Foam Emissivity
Various suggestions can be found in the literature explaining the high emissivity of foam-covered surfaces. Williams [50] was the first to suggest the importance of the impedance matching that the sea foam provides between the air and seawater. Consequent experiments led to the tentative conclusion that roughness expressed as “distortion of the water surface at the interstices between the bubbles at the bottom of the foam layer” ([51], p. 3097) together with the dielectric constant of foam “produce a zone of radically tapered dielectric constant” ([19], p. 223; cited also by [21]; [36], p. 1454; [48]). The Russian literature on the subject approaches the problem from a microscopic point of view and promotes the explanation that the bubbles within the foam “represent some kind of small black bodies, which intensively absorb the EM energy owing to inter-bubble diffraction” ([52], p. 511). Describing the sea foam as “a nonreflecting … absorbing but partially transparent medium”, Wilheit ([48], p. 246) touched upon the effective transmission of EM radiation through foam. Williams [19] measurements involving foam on different underlying substrates, water or metal, suggest that not just the foam itself, but also the system of foam floating on seawater is the one that could lead to high emissivity.
This brief account of proposed explanations demonstrates that one or another element of the physical system that a foam-covered sea surface represents has been identified and used to interpret the observed high emissivity. None of these explanations, however, combines these elements into a consistent whole. Meanwhile, the analysis in this study of the radiative processes in foam (Sections 4.1–4.4) shows that none of these separate elements alone is enough to account for the high emissivity ef of sea foam. Rather, all foam properties and all radiative processes engage in an emergent behavior (i.e., the whole is greater than the sum of its parts [53]) and contribute in some way to bring about the overall effect of a high ef. Moreover, we argue that what makes the sea foam an exceptional emitter is the combination of these properties and processes in a vertically structured foam layer floating on seawater surfaces. The following is a summary of our conceptual understanding of how this happens.
First, two components ensure the high emissivity of foam-covered ocean surfaces: (1) High absorption losses in a coupled foam-seawater system; and (2) effective transmission of EM radiation through the foam. If one of these components were missing, a high ef could not be guaranteed. The potential of the foam-seawater system for strong absorption and emission cannot be realized without effective transmission and propagation of radiation across layer boundaries into the foam; and vice versa—effective transfer across the layer boundaries is not enough if a highly absorptive agent is not in place to carry on high absorption and emission.
Second, absorption losses in foam are provided by medium-intrinsic and scattering-driven absorption. Absorption in wet foam is relatively more important than absorption in dry foam. Furthermore, though strong, the absorption of the foam layer itself might remain somewhat limited. The seawater below the foam layer is a major absorptive agent whose emission adds to that of the foam layer to yield the highest absorption losses in a coupled foam-seawater system.
Third, with its intrinsic impedance, foam on the ocean surface, in any stage of its lifetime, provides impedance matching between the contrasting dielectric properties of air and seawater. This decreases reflections at the air-foam and foam-seawater boundaries and assists effective entry of EM radiation into the foam-seawater system. Existing, yet weak surface scattering at these boundaries and weak volume scattering within the foam provide the maximal portion of the propagating radiation to be delivered to and absorbed by the wet foam and seawater.
Forth, the foam-seawater system reaches its maximal effectiveness and becomes a black-body-like emitter when a vertical profile of properties in the depth of a foam layer controls the relative importance and contribution of the radiative processes. Only gradual increase of seawater content and gradual change of spatial inhomogeneities minimize radiation attenuation in dry foam and maximize the absorption losses in wet foam and underlying seawater. Only a gradual change of the foam intrinsic impedance over the widest possible range of values, from that of the air to that of the seawater, provides weakly reflective to non-reflective foam boundaries and maximizes the entry of EM radiation.
In short, only in vertically structured foam layers every property and process conspires to bring maximum EM radiation to the most effective absorptive agent and thus producing maximum absorption and emission.
5.2. Foam as a Dynamic System
Our discussion of the sub-surface bubble plume and the overlying foam layer generated is presented up to this point as a static, time-independent system. The impact that the dynamic of the system may have on the foam structure and its emissivity was alluded to in our considerations of the effectiveness of the impedance matching provided by whitecaps in their active and residual lifetime stages (Section 4.1.2). Here we address further the temporal variations of the system.
The rational for these considerations is that the void fraction in the bubble clouds formed after wave breaking varies by roughly two orders of magnitude between initial entrainment and the loss of large bubbles, an interval of roughly a second or so. Indeed, in a laboratory study, Anguelova and Huq [59] observed disintegration of the initial compact form of a whitecap into winding streaks of foam after only 100 ms. Such a time scale is comparable to the time period of 90 ms reported by Deane and Stokes [60] for the dispersion of a compact mass of bubbles into individual ones in a surf zone. For about one wave period (about 1 s), Anguelova and Huq [59] documented a decrease of the void fraction from near unity to about 20%. They also observed that the evolution of the bubble plume, and the foam layer above, could persist for many wave periods.
The question is: What is the impact of such dynamical changes on a field of whitecaps in the open ocean? Statistical analysis of void fraction values representative for the initial air entrainment and for the subsequent decaying stage suggest the presence of both thick foam layers with high void fractions of 70%–90%, and thinner, wetter foam layer with lower void fraction values (<80%) (e.g., Figures 12 and 13 in Anguelova and Huq [59]). Because evolving bubble clouds keep replenishing the foam layers on the surface, their statistics reveal that the temporal variations lead to a high variability of the foam layer properties. That is, in the open ocean at any moment foam layers with a distribution of void fraction values at their boundaries could exist. These would include combinations of dry foam next to a foam-water boundary or wet foam next to air. Therefore, some of the various foam structures may exhibit a distinct impedance discontinuity at the mean ocean surface; others may represent stratified foam well. This in turn has important implications for the reflection and transmission of microwave energy.
The next logical question is: How can we model such a variability of the foam layer properties? One simple approach is to assume that the foam structure analyzed in the present study represents a likely scenario in the early stage of foam development. A significant improvement upon such a simple approach would be to develop an elaborate physical model for the time-varying properties of sub-surface bubble clouds, about which relatively little is known, or the surface foam they generate, about which even less is known. A starting point could be to generate a void fraction profile likely to be representative of the bubble plume/foam system during whitecap decay. Anguelova and Gaiser ([25], Section 4.4) discussed the modeling of void fraction profiles by noting that one needs to consider the profile shape, profile range, and the profile variations with foam thickness, and how these choices affect the foam emissivity.
5.3. Modeling Scattering in Foam
Foam emissivity can be modeled following two approaches [36,52,54]. The intensity approach employs the radiative transfer theory to calculate the microwave radiance of a medium. The wave approach employs solutions of Maxwell equations to compute the scattering losses in a medium and use those to obtain emissivity. The PS formula represents the most rigorous starting point when obtaining the scattering of sea foam is pursued. The reason is that the PS formula is identical to the low frequency limit form of the effective permittivity obtained with the strong permittivity fluctuations theory for scattering from a random medium ([54], pp. 378–379). According to Tsang et al. ([54], p. 429), “the applicability of the mixing formula to a particular dense medium in the very low frequency limit will help in deciding the multiple scattering theory to be employed at higher frequencies.” Because we use the PS mixing rule in this study (Section 3.1), we are in good position to qualitatively discuss which scattering theory would be appropriate when the wave approach is chosen to obtain sea foam emissivity.
5.3.1. Scattering Regimes in Foam
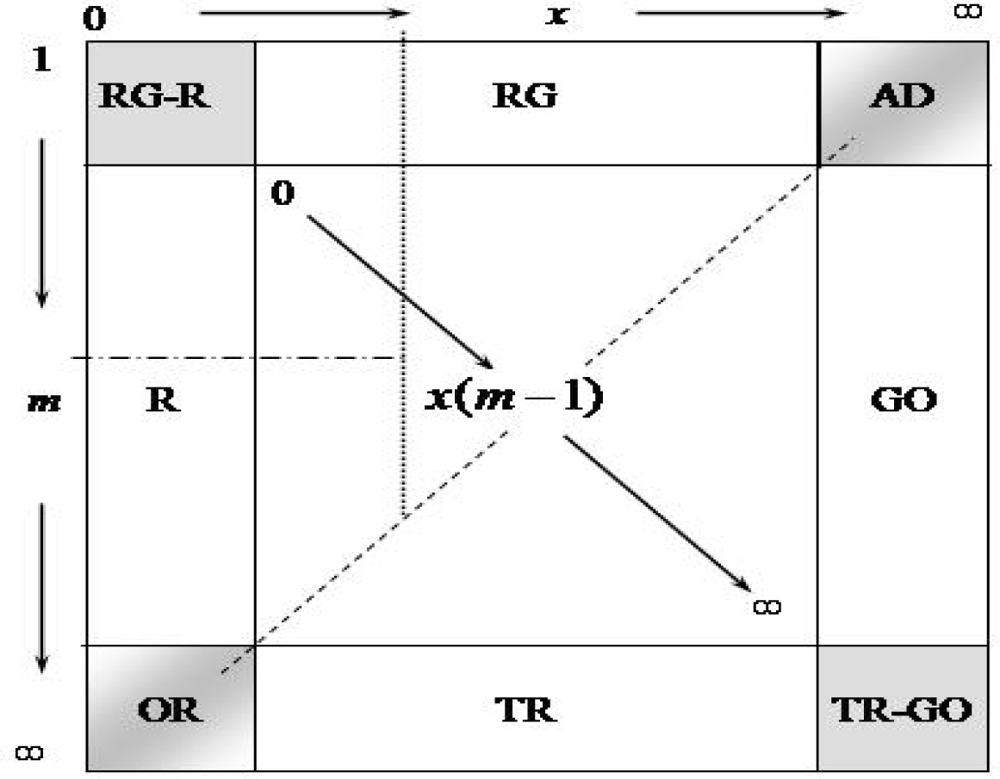
Aden and Keker [55] and Dombrovskiy [56] extended the classical Mie theory to apply it to hollow spherical particles (bubbles in our case). Dombrovskiy [57] used this theory to calculate the absorption and scattering of foam at several microwave frequencies. He made the same calculations also using the Rayleigh approximation and found that the results differ from those of the Mie theory by 3% for thick-walled bubbles at 37 GHz and by no more than 0.3% for thin-walled bubbles at 37 GHz and 10 GHz. Analyzing the scattering parameters of foam mixtures (Section 3.5 and Table 3) instead of individual bubbles [57], we also find that the Rayleight approximation represents well the scattering regime in vertically structured foam layers. Here we show how we reach this result. In our considerations, we use the so-called m-x domain, which summarizes all possible scattering regimes ([37], p. 132) depending on the values of the medium size parameter, refractive index, and their product (Appendix).
Following conditions (A.1–A.3), we evaluate the entries in Table 3 as small (s), large (l), or arbitrary (arb) values and formulate the entries in Table 4 for x, m − 1, and x(m − 1). We compare these to the regimes listed in Table A and infer the following scattering regimes for the most realistic situations encountered in foam.
First, considering that according to Table 4 x(m − 1) is small, the possible scattering regimes in foam are those in the upper left side of the m − x square (left and above the dashed line in Figure 9) excluding the regimes of total reflection and geometric optics.
Next, according to Tables 3 and 4, x is small (usually << 1) for intermediate-wet and wet foam, and when it is > 1 (in dry foam) it is no higher than 10; this is way below the possible upper limit of x > 50 at microwave frequencies (Appendix). This keeps the scattering in foam mostly in the left part of the m − x square. With very large x excluded, we rule out the anomalous diffraction ([37], Section 11.3) as a possible scattering regime in foam.
Finally, values m − 1 in Table 4 vary in foam from small to arbitrary. Large m values (up to 9, the possible upper limit at microwave frequencies as noted in the Appendix) combined with small x for the intermediate-wet and wet foams lead to optical resonance (i.e., Mie scattering), Figure 9. Indeed, strong resonance peaks in the extinction is documented for m = 8.9 − i0.69 and x < 0.5 ([37], Figure 60). But even a small increase of |Im{m}| (e.g., from a value of 0.69 to 1.96) effectively damps any resonance effects. The large |Im{m}| values in intermediate-wet and wet foam (Table 3) thus restrict the occurrence of classical Mie scattering in foam.
Overall, we surmise that with both x and x(m − 1) small and m − 1 restricted to less than 8, the prevailing scattering regimes in foam for the range of considered frequencies are Rayleigh and Rayleigh-Gans (also called Rayleigh-Debye or Born approximation) regimes. In the m − x domain (Figure 9), this is roughly the region to the left of the dotted line and above the dash-dotted line.
5.3.2. Variations of the Scattering Regimes in Foam
Anything that changes the values of the scattering parameters (x, m, and x(m − 1)) in foam, would cause deviations from the conclusion in Section 5.3.1. Of course, the foremost reason of scattering regime change in a foam layer is its vertical structure. Going from the foam-air interface toward the foam-water boundary, the scattering regime in foam would change from Rayleigh-Gans scattering in dry foam (80% ≤ fa ≤ 100%) to Rayleigh scattering in wet foam (0% ≤ fa ≤ 40%) with a gradual transition between these two in the intermediate-wet foam (40% ≤ fa ≤ 80%). Other possible reasons that could change the values of the scattering parameters are: (i) Changes in m due to full account of the scattering in εf ; (ii) changes in x due to SST effect (at fixed salinity) on εf and with this on λf ; and (iii) changes in x due to salinity effect (at fixed SST) on a and εf (thus λf).
To evaluate the expected changes in the scattering regimes due to (i), let us assume that by ignoring scattering we deviate from the total attenuation (absorption + scattering) ke by overestimating or underestimating it. Because of the direct proportionality
(Equations (2), (3), and (8) in Table 1), m″ of intermediate-wet and wet foams (Table 3) would increase or decrease. Meanwhile the values of Re{m} are expected to change little compared to those reported in Table 3.
All values used in the considerations until now are for SST of 20 °C and salinity of 34 psu. SST does not influence the bubble size at fixed salinity. However, the temperature dependence of εf may increase λf noticeably at lower SST ([24], Figure 6). Such a result would decrease size parameter x, which would confine the scattering in foam to the transitional (R-RG in Figure 9) or Rayleigh regimes.
Salinity affects both λf (via the salinity dependence of εf) and the bubble size a. Seawater with lower salinity (at fixed SST) breaks into fewer but larger bubbles (e.g., [58], Figure 5). Meanwhile, Anguelova ([24], Figure 8) shows that, as salinity decreases, the real part of foam permittivity increases, negligibly so for higher frequencies (18 GHz to 37 GHz) and more noticeably for lower (1.4 GHz to 10 GHz). Both changes—shift of bubble size distribution toward larger sizes and shorter wavelengths—lead to an increasing x at lower salinity. In addition, lower salinity values decrease seawater conductivity thus the imaginary part of foam permittivity and refraction index m. The real parts of εf and m would, however, keep the m − 1 values no higher than about 10. Therefore, at lower salinity the scattering regime would shift more toward the Rayleigh-Gans (Born approximation) regime. Similar reasoning points out that higher salinity reinforces conditions for predominantly Raylegh scattering in foam.
6. Conclusions
Passive microwave remote sensing of whitecap fraction at frequencies from 1 to 37 GHz requires modeling of ocean surface emissivity fully covered with foam ef. To model ef, knowledge of mechanical and dielectric properties of sea foam is necessary. Here we present a full physical description of the dielectric properties of sea foam layers with a vertical profile of void fraction. These include foam dielectric constant, foam skin depth, foam impedance, wavelength variations in foam depth, roughness of foam layer interfaces with air and seawater, and foam scattering parameters such as size parameter, and refraction index.
Foam dielectric properties are analyzed to gain physical insights about scattering, absorption, reflection and transmission in foam (Section 4). These fundamental radiative processes acquire unique features in vertically stratified foam layers, namely:
- Weak or negligible reflection at the foam layer interfaces with air and seawater due to foam impedance matching.
- Floating foam layers provide the most effective impedance matching.
- Weak or negligible surface scattering at the foam layer interfaces due to small roughness and low dielectric contrast of foam boundaries.
- Weak volume scattering throughout the foam due to simultaneous decrease in the foam depth of radiation wavelength and bubbles’ radii effective for scattering.
- Absorption losses are predominantly confined to the wet portion of the foam layer.
We put all these elements together and offer a conceptual understanding for the high, black-body-like emissivity of foam (Section 5.1). The high foam emissivity at microwave frequencies is explained with the harmonious mix of contributions from all radiative processes taking place in foam. There are two necessary, closely linked components that ensure foam high emissivity, namely high absorption losses in a coupled foam-seawater system and effective transmission of electromagnetic radiation into and through the foam. We show that the most important reason for the high foam emissivity is the vertical profile of the foam properties. Only in vertically structured foam layers does every property and process contribute toward delivering maximum radiation to the most effective absorptive agent thus producing maximum absorption and emission.
The conceptual understanding of the properties and processes, which determine the sea foam emissivity gives physical foundation and facilitates the implementation aspects of a foam emissivity model.
Acknowledgments
This work is sponsored by the Office of Naval Research (NRL Program element 61153N WU 8967). M.A. wishes to thank Edward C. Monahan and Edgar L Andreas for reviewing parts of the manuscript, Paul Hwang for alternative estimates of the rms height of wind-roughened sea, and Grant Deane for sharing data of bubble sizes. The constructive criticisim, comments, and suggestions of three anonymous reviewers are highly appreciated.
Appendix: Scattering Regimes Mapped in m − x Domain
For convenience, this appendix summarizes information on scattering regimes relevant for this study using the work of van de Hulst ([37], Section 10.1). The Mie solution of the Maxwell equations gives rigorous mathematical representation of the scattering and absorption of EM radiation by particles. In Mie theory, absorption, scattering and extinction efficiency factors (Qa, Qs, and Qe,) are formulated in terms of size parameter x and refractive index m. Values of x could be from 0 to ∞; m varies from 1 to ∞ for scatterers in vacuum or could be less than 1 in other surrounding media.
Complete computations for arbitrary combinations of x and m values are laborious, thus limiting cases of x and m are usually investigated and approximate computational methods are offered. Available approximate methods (and/or theories) for various scattering cases are conveniently presented in the so-called m-x domain ([37], Section 10.1; [52], p. 408). Various scattering regimes are defined by the values of the scattering parameters following these inequalities ([37], pp. 132–133):
For complex m, condition A.2 is |m – 1| << 1 and it means that both Re{m} – 1 and |Im{m}| should be << 1 ([37], p. 179). Following these conditions, various scattering regimes are assigned to different portions of the m-x domain. These scattering regimes (acronyms in Table A) are shown in Figure 9, which presents a simplified version of the m-x domain given by van de Hulst ([37], Figure 20]).

Table A.
Approximate scattering theories for boundary regions of the m − x domain (modified from Table 8 in van de Hulst ([37], p. 133).
| Region | x | m-1 | x(m − 1) | Regime |
|---|---|---|---|---|
| RG (1) | arb | s | s | Rayleight-Gans |
| AD (2) | l | s | arb | Anomalous Diffraction |
| GO (3) | l | arb | l | Geometric optics |
| TR (4) | arb | l | l | Total Reflector |
| OR (5) | s | l | arb | Optical Resonance (Mie) |
| RS (6) | s | arb | s | Rayleigh scattering |
The upper limits for microwave frequencies in the m-x domain (Figure 9) are as follows. For the size parameter, x > 50 is possible ([52], p. 408). The largest value of Re{m} encountered in practice could be that of pure water, approaching 10 asymptotically for frequencies below 10 GHz ([61], Figure 2). As for |Im{m}|, the high values of the imaginary part of seawater permittivity [62], Figure 3 (cited also by Maul [63], Figure 5.4), keep its upper limit consistently high above 4 (Table 3) for frequencies below 100 GHz.
References
- Gemmrich, J.R.; Banner, M.L.; Garrett, C. Spectrally resolved energy dissipation rate and momentum flux of breaking waves. J. Phys. Oceanogr 2008, 38, 1296–1312. [Google Scholar]
- Andreas, E.L.; Persson, P.O.G.; Hare, J.E. A bulk turbulent air-sea flux algorithm for high-wind, spray conditions. J. Phys. Oceanogr 2008, 38, 1581–1596. [Google Scholar]
- Wanninkhof, R.; Asher, W.; Ho, D.; Sweeney, C.; McGillis, W. Advances in quantifying air-sea gas exchange and environmental forcing. Ann. Rev. Mater. Sci 2009, 1, 213–244. [Google Scholar]
- de Leeuw, G.; Andreas, E.L.; Anguelova, M.D.; Fairall, C.W.; Lewis, E.R.; O’Dowd, C.; Schulz, M.; Schwartz, S.E. Production flux of sea spray aerosol. Rev. Geophys 2011, 49. [Google Scholar] [CrossRef]
- Gordon, H.; Wang, M. Influence of oceanic whitecaps on atmospheric correction of ocean-color sensors. Appl. Opt 1994, 33, 7754–7763. [Google Scholar]
- Padmanabhan, S.; Reising, S.C.; Asher, W.E.; Rose, L.A.; Gaiser, P.W. Effects of foam on ocean surface microwave emission inferred from radiometric observations of reproducible breaking waves. IEEE Trans. Geosci. Remote Sens 2006, 44, 569–583. [Google Scholar]
- Deane, G.B. Sound generation and air entrainment by breaking waves in the surf zone. J. Acoust. Soc. Am 1997, 102, 2671–2689. [Google Scholar]
- Goddijn-Murphy, L.; Woolf, D.K.; Callaghan, A.H. Parameterizations and algorithms for oceanic whitecap coverage. J. Phys. Oceanogr 2011, 41, 742–756. [Google Scholar]
- Piazzola, J.; Forget, P.; Lafon, C.S.; Despiau, S. Spatial variation of sea-spray fluxes over a Mediterranean coastal zone using a sea state model. Bound.-Lay. Meteorol 2009, 132, 167–183. [Google Scholar]
- Sugihara, Y.; Tsumori, H.; Ohga, T.; Yoshioka, H.; Serizawa, S. Variation of whitecap coverage with wave-field conditions. J. Mar. Syst 2007, 66, 47–60. [Google Scholar]
- Thomson, J.; Gemmrich, J.R.; Jessup, A.T. Energy dissipation and the spectral distribution of whitecaps. Geophys. Res. Lett 2009, 36, L11601. [Google Scholar]
- Callaghan, A.H.; White, M. Automated processing of sea surface images for the determination of whitecap coverage. J. Atmos. Ocean. Technol 2009, 26, 383–394. [Google Scholar]
- Jessup, A.T.; Zappa, C.J.; Loewen, M.R.; Hesany, V. Infrared remote sensing of breaking waves. Nature 1997, 385, 52–55. [Google Scholar]
- Nordberg, W.; Conaway, J.; Ross, D.B.; Wilheit, T. Measurements of microwave emission from a foam-covered, wind-driven sea. J. Atmos. Sci 1971, 28, 429–435. [Google Scholar]
- Anguelova, M.D.; Webster, F. Whitecap coverage from satellite measurements: A first step toward modeling the variability of oceanic whitecaps. J. Geophys. Res 2006, 111. [Google Scholar] [CrossRef]
- Anguelova, M.; Bettenhausen, M.; Gaiser, P. Passive Remote Sensing of Sea Foam Using Physically-Based Models. Proceedings of the IEEE 2006 International Geoscience and Remote Sensing Symposium (IGARSS), Denver, CO, USA, 31 July–4 August 2006; pp. 3676–3679.
- Anguelova, M.D.; Bobak, J.P.; Asher, W.E.; Dowgiallo, D.J.; Moat, B.I.; Pascal, R.W.; Yelland, M.J. Validation of Satellite-Based Estimates of Whitecap Coverage: Approaches and Initial Results. Prcoeedings of 16th Conference on Air-Sea Interaction, Phoenix, AZ, USA, 11–15 January 2009; p. 14.
- Anguelova, M.D.; Bettenhausen, M.H.; Johnston, W.F.; Gaiser, P.W. First Extensive Whitecap Database and Its Use to Study Whitecap Fraction Variability. Proceedings of the 17th Conference on Air-Sea Interaction, Annapolis, MD, USA, 27–30 September 2010; p. 8.
- Williams, G.F. Microwave emissivity measurements of bubbles and foam. IEEE Trans. Geosci. Elect 1971, 9, 221–224. [Google Scholar]
- Bordonskiy, G.S.; Vasilkova, I.B.; Veselov, V.M.; Vorsin, N.N.; Militskii, I.U.; Mirovskii, V.G.; Nikitin, V.V.; Raizer, V.I.U.; Khapin, I.U.B.; Sharkov, E.A. Spectral characteristics of the emissivity of foam formations. Izv. Atmos. Ocean. Phys 1978, 14, 464–469. [Google Scholar]
- Smith, P.M. The emissivity of sea foam at 19-GHz and 37-GHz. IEEE Trans. Geosci. Remote Sens 1988, 26, 541–547. [Google Scholar]
- Rose, L.A.; Asher, W.E.; Reising, S.C.; Gaiser, P.W.; St Germain, K.M.; Dowgiallo, D.J.; Horgan, K.A.; Farquharson, G.; Knapp, E.J. Radiometric measurements of the microwave emissivity of foam. IEEE Trans. Geosci. Remote Sens 2002, 40, 2619–2625. [Google Scholar]
- Lewis, E.R.; Schwartz, S.E. Sea Salt Aerosol Production: Mechanisms, Methods, Measurements and Models: A Critical Review; American Geophysical Union: Washington, DC, USA, 2004; p. 413. [Google Scholar]
- Anguelova, M.D. Complex dielectric constant of sea foam at microwave frequencies. J. Geophys. Res 2008, 113, C08001. [Google Scholar] [CrossRef]
- Anguelova, M.D.; Gaiser, P.W. Skin depth at microwave frequencies of sea foam layers with vertical profile of void fraction. J. Geophys. Res 2011, 116, C11002. [Google Scholar] [CrossRef]
- Leifer, I.; de Leeuw, G. Bubbles generated from wind-steepened breaking waves: 1. Bubble plume bubbles. J. Geophys. Res 2006, 111, 18. [Google Scholar] [CrossRef]
- Leifer, I.; Caulliez, G.; de Leeuw, G. Bubbles generated from wind-steepened breaking waves: 2. Bubble plumes, bubbles, and wave characteristics. J. Geophys. Res 2006, 111, 16. [Google Scholar]
- Militskii, Y.A.; Raizer, V.Y.; Sharkov, E.A.; Etkin, V.S. Scattering of microwave radiation by foamy structures. Rad. Eng. Electron Phys 1977, 22, 46–50. [Google Scholar]
- Guo, J.J.; Tsang, L.; Asher, W.; Ding, K.H.; Chen, C.T. Applications of dense media radiative transfer theory for passive microwave remote sensing of foam covered ocean. IEEE Trans. Geosci. Remote Sens 2001, 39, 1019–1027. [Google Scholar]
- Deane, G.B.; Stokes, M.D. Scale dependence of bubble creation mechanisms in breaking waves. Nature 2002, 418, 839–844. [Google Scholar]
- Stokes, M.D.; Deane, G.B.; Vagle, S.; Farmer, D.M. Measurements of Large Bubbles in Open-Ocean Whitecaps. In Gas Transfer at Water Surfaces; Donelan, M.A., Drennan, W.M., Saltzman, E.S., Wanninkhof, R., Eds.; American Geophysical Union: Washington, DC, USA, 2002. [Google Scholar]
- Ulaby, F.; Moore, R.; Fung, A. Microwave Remote Sensing: Active and Passive: From Theory to Applications; Book-Mart Press Inc: North Bergen, NJ, USA, 1982; Volume 2, p. 1064. [Google Scholar]
- Stogryn, A.P. Equations for the Permittivity of Sea Water; Technical Report; GenCorp Aerojet: Azusa, CA, USA, 1997; p. 11. [Google Scholar]
- Sihvola, A. Electromagnetic Mixing Formulas and Applications; The Institute of Electrical Engineers: London, UK, 1999; p. 284. [Google Scholar]
- Ulaby, F.; Moore, R.; Fung, A. Microwave Remote Sensing: Active and Passive: Microwave Remote Sensing Fundamentals and Radiometery; Addison-Wesley Publishing: Reading, MA, USA, 1981; Volume 1, p. 456. [Google Scholar]
- Ulaby, F.; Moore, R.; Fung, A. Microwave Remote Sensing: Active and Passive: From Theory to Applications; Book-Mart Press Inc.: North Bergen, NJ, USA, 1986; Volume 3, p. 2162. [Google Scholar]
- van de Hulst, H.C. Light Scattering by Small Particles; Diver Publications: New York, NY, USA, 1981; p. 470. [Google Scholar]
- Stratton, J.A. Electromagnetic Theory; McGraw-Hill Book Company Inc: New York, NY, USA, 1941; p. 615. [Google Scholar]
- Raizer, V. Macroscopic foam-spray models for ocean microwave radiometry. IEEE Trans. Geosci. Remote Sens 2007, 45, 3138–3144. [Google Scholar]
- Dombrovskiy, L.A. Absorption and scattering of microwave radiation by spherical water shells. Izv. Atmos. Ocean. Phys 1982, 17, 238–241. [Google Scholar]
- Peake, W. Interaction of electromagnetic waves with some natural surfaces. IRE Trans. Ant. Propag 1959, 7, S324–S329. [Google Scholar]
- Brekhovskikh, L.M. Reflection Reduction of Optical Systems. In Waves in Layered Media, 1980 ed.; Academic Press: New York, NY, USA, 1980; p. 503. [Google Scholar]
- Pierson, W.J.; Stacy, R.A. The Elevation, Slope, and Curvature Spectra of a Wind Roughened Sea Surface; Report NASA CR-2247; NASA: Washington, DC, USA, 1973; p. 126. [Google Scholar]
- Komen, G.J.; Cavaleri, L.; Donelan, M.; Hasselmann, K.; Hasselmann, S.; Janseen, P.A.E.M. Dynamics and Modeling of Ocean Waves; Cambridge University Press: Cambridge, London, UK, 1994; p. 532. [Google Scholar]
- Smith, S.D. Coefficients for sea-surface wind stress, heat-flux, and wind profiles as a function of wind-speed and temperature. J. Geophys. Res 1988, 93, 15467–15472. [Google Scholar]
- Fairall, C.W.; Bradley, E.F.; Rogers, D.P.; Edson, J.B.; Young, G.S. Bulk parameterization of air-sea fluxes for tropical ocean global atmosphere coupled ocean atmosphere response experiment. J. Geophys. Res 1996, 101, 3747–3764. [Google Scholar]
- Hwang, P.A. Wave number spectrum and mean square slope of intermediate-scale ocean surface waves. J. Geophys. Res 2005, 110, 7. [Google Scholar]
- Wilheit, T.T. Model for the microwave emissivity of the oceans surface as a function of wind-speed. IEEE Trans. Geosci. Remote Sens 1979, 17, 244–249. [Google Scholar]
- Wentz, F.; Meissner, T. Algorithm Theoretical Basis Document (ATBD): Amsr Ocean Algorithm; RSS Tech. Proposal 121599A-1; Remore Sensing Systems: Santa Rosa, CA, USA, 2000. [Google Scholar]
- Williams, G.F. Microwave radiometry of ocean and possibility of marine wind velocity determination from satellite observations. J. Geophys. Res 1969, 74, 4591–4594. [Google Scholar]
- Webster, W.J.; Wilheit, T.T.; Ross, D.B. Spectral characteristics of microwave emission from a wind-driven foam-covered sea. J. Geophys. Res 1976, 81, 3095–3099. [Google Scholar]
- Sharkov, E.A. Passive Microwave Remote Sensing of the Earth; Praxis: Chichester, UK, 2003; p. 613. [Google Scholar]
- de Wolf, T.; Holvoet, T. Emergence versus Self-Organisation: Different Concepts but Promising When Combined. In Engineering Self-Organising Systems: Methodologies and Applications; Brueckner, S.A., Di Marzo, S., Karageorgos, A., Nagpal, R., Eds.; Springer-Verlag: Berlin/Heidelberg, Germany, 2005; pp. 1–15. [Google Scholar]
- Tsang, L.; Kong, J.A.; Shin, R.T. Theory of Microwave Remote Sensing; Wiley&Sons: New York, NY, USA, 1985; p. 613. [Google Scholar]
- Aden, A.L.; Kerker, M. Scattering of electromagnetic waves from 2 concentric spheres. J. Appl. Phys 1951, 22, 1242–1246. [Google Scholar]
- Dombrovskiy, L.A. Light scattering and absorption by hollow spherical particles. Izv. Atmos.Ocean. Phys 1974, 10, 720–727. [Google Scholar]
- Dombrovskiy, L.A. Calculation of thermal radio emission from foam on the sea surface. Izv. Atmos. Ocean. Phys 1979, 15, 193–198. [Google Scholar]
- Camps, A.; Vall-Ilossera, M.; Villarino, R.; Reul, N.; Chapron, B.; Corbella, I.; Duffo, N.; Torres, F.; Miranda, J.J.; Sabia, R.; et al. The emissivity of foam-covered water surface at l-band: Theoretical modeling and experimental results from the frog 2003 field experiment. IEEE Trans. Geosci. Remote Sens 2005, 43, 925–937. [Google Scholar]
- Anguelova, M.D.; Huq, P. Characteristics of bubble clouds at various wind speeds. J. Geophys. Res 2012, 117, C03036. [Google Scholar] [CrossRef]
- Deane, G.B.; Stokes, M.D. Air entrainment processes and bubble size distributions in the surf zone. J. Phys. Oceanogr 1999, 29, 1393–1403. [Google Scholar]
- Ray, P.S. Broad-band complex refractive indexes of ice and water. Appl. Opt 1972, 11, 1836–1844. [Google Scholar]
- Paris, J.F. Microwave Radiometry and Its Application to Marine Meteorology and Oceanography; Tech. Rep. Ref. No. 69-1T; Department of Oceanography, Texas A&M University: College Station, TX, USA, 1969; p. 210. [Google Scholar]
- Maul, G.A. Introduction to Satellite Oceanography; Martinus Nijhoff Publishers: Boston, MA, USA, 1985; p. 606. [Google Scholar]
Figure 1.
Foam penetration depth as a function of frequency δ (F) obtained with Polder-van Santen mixing rule with exponential void fraction profile ranging from 99% at the air-foam interface and 1% at the foam-seawater boundary at fixed seawater temperature (Ts = 20 °C) and salinity (S = 34 psu) at three values of foam void fraction fa.

Figure 2.
Normalized intrinsic impedance of sea foam obtained from foam permitivity (Equation (4) in Table 1) at fixed seawater temperature (Ts = 20 °C) and salinity (S = 34 psu): (a) as a function of frequency for seawater, air, wet foam (fa = 10%), and dry foam (fa = 98%); (b) as a function of foam void fraction at three frequencies.

Figure 3.
Wavelength in foam λf (cm) (Equation (5) in Table 1) as a function of foam void fraction at fixed seawater temperature (Ts = 20 °C) and salinity (S = 34 psu) and different frequencies. Vertical lines divide the fa range into three regions whose values can be associated with bubble diamaters predominant for each region.

Figure 4.
Size parameter in foam x (Equation (7) in Table 1) as a function of foam void fraction at various frequencies and bubble radius a = 0.3 mm at the peak of the bubble size distribution obtained from oceanographic measuremetns.
Figure 4.
Size parameter in foam x (Equation (7) in Table 1) as a function of foam void fraction at various frequencies and bubble radius a = 0.3 mm at the peak of the bubble size distribution obtained from oceanographic measuremetns.

Figure 5.
Foam refractive index m (Equation (8) in Table 1) as a function of frequency at foam void fractions representing dry foam (fa = 98%), wet foam (fa = 10%) and intermediate stage foam (fa = 60%) at fixed seawater temperature (Ts = 20 °C) and salinity (S = 34 psu): (a) Real part, Re{m}; (b) Imaginary part, |Im{m}|.

Figure 6.
Criteria for surface smoothness (Section 2.3) at the air-foam boundary (solid lines) and foam-water boundary (dashed lines): (a) Fraunhofer criterion; (b) kσ criterion.
Figure 6.
Criteria for surface smoothness (Section 2.3) at the air-foam boundary (solid lines) and foam-water boundary (dashed lines): (a) Fraunhofer criterion; (b) kσ criterion.

Figure 7.
Schematic representation of reflection and transmission of incident (left) and emitted (right) radiation under different conditions at air-sea interface: (a) foam-free interface; (b) foam-covered interface; (c) bubbly mixture in the water without foam on the surface.
Figure 7.
Schematic representation of reflection and transmission of incident (left) and emitted (right) radiation under different conditions at air-sea interface: (a) foam-free interface; (b) foam-covered interface; (c) bubbly mixture in the water without foam on the surface.

Figure 8.
Size parameter in foam x (Equation (7) in Table 1) as a function of frequency and foam void fraction representing: (a) dry foam (fa = 98%); (b) intermediate-wet foam (fa = 60%) and (c) wet foam (fa = 10%). For each fa region the size parameters for three possible bubble radii are shown. The radii least likely for each type of foam are in gray. Fixed seawater temperature (Ts = 20 °C) and salinity (S = 34 psu).

Figure 9.
Scattering regimes (acronyms in Table A) in the m − x domain. A simplified version of the m − x domain given in van de Hulst ([37], Figure 20).

Table 1.
Basic relationships from the electromagnetic theory used to obtain foam dielectric properties.
| Equation # | Property | Symbol (Units) | Formula | Reference | Notes |
|---|---|---|---|---|---|
| Dielectric properties | |||||
| (1) | Dielectric constant | εf | Equation (9.7) in [34] | Seawater is environment with permittivity ε; Bubbles are inclusions with void fraction fa | |
| (2) | Skin depth | d (mm) | p. 847 in [32] | α field attenuation coefficient F frequency (Hz) c speed of light (cm s−1) | |
| (3) | Penetration depth | δ (mm) | ditto | Scattering ignored Extinction ≅ Absorption i.e., ke ≅ ka = 2α | |
| (4) | Intrinsic impedance | η | p. 226 in [35] | Normalized (relative), complex | |
| (5) | Wavelength in foam | λf (cm) | p. 1453 in [36] | λ0 free-space wavelength | |
| (6) | Propagation constant (wave number) | kf (cm−1) | p. 116 in [37] | ||
| Scattering parameters | |||||
| (7) | Size parameter | x | p. 128 in [37] | a bubble radius | |
| (8) | Refraction index | m | p. 116 in [37] | m′ and m″ real and imaginary parts of m | |
Table 2.
Wavelengths at fixed SST (20 °C) and salinity (34 psu) in air (λ0), in seawater (λ), in dry and wet foam (λf).
| F GHz | λ0 cm (in air) | λf cm | λ cm (in seawater) | |
|---|---|---|---|---|
| fa = 98% | fa = 10% | |||
| 1.4 | 21.4 | 20.8 | 2.762 | 2.55 |
| 6.8 | 4.4 | 4.28 | 0.603 | 0.56 |
| 10.7 | 2.8 | 2.72 | 0.414 | 0.38 |
| 18.7 | 1.6 | 1.56 | 0.286 | 0.26 |
| 23.8 | 1.3 | 1.22 | 0.253 | 0.23 |
| 37.0 | 0.8 | 0.79 | 0.207 | 0.19 |
Table 3.
Ranges of variation of size parameter (x), and foam refractive index (Re{m} and |Im{m}|) in foam depth.
| Foam Mixture | x (Figure 4) | Re{m} (Figure 5(a)) | |Im{m}| (Figure 5(b)) |
|---|---|---|---|
| fa = 98% a = 10 mm | 0.2–10 | ≅1 | 6 × 10⁻⁴−3 × 10⁻³ |
| fa = 60% a = 0.3 mm | 0.02–0.6 | 3.5–2.5 | 0.6–1 |
| fa = 10% a = 0.05 mm | 0.01–0.2 | 9–4.5 | 2–4 |
| Foam sublayer | x | m − 1 | x.(m − 1) | Region | Regime |
|---|---|---|---|---|---|
| fa = 98% a = 10 mm | s to arb | s | s | R, RG-R, RG | Rayleigh-Gans |
| fa = 60% a = 0.3 mm | s | arb | s | R | Rayleigh |
| fa = 10% a = 0.05 mm | s | arb | s | R | Rayleigh |
Share and Cite
MDPI and ACS Style
Anguelova, M.D.; Gaiser, P.W. Dielectric and Radiative Properties of Sea Foam at Microwave Frequencies: Conceptual Understanding of Foam Emissivity. Remote Sens. 2012, 4, 1162-1189. https://doi.org/10.3390/rs4051162
AMA Style
Anguelova MD, Gaiser PW. Dielectric and Radiative Properties of Sea Foam at Microwave Frequencies: Conceptual Understanding of Foam Emissivity. Remote Sensing. 2012; 4(5):1162-1189. https://doi.org/10.3390/rs4051162
Chicago/Turabian StyleAnguelova, Magdalena D., and Peter W. Gaiser. 2012. "Dielectric and Radiative Properties of Sea Foam at Microwave Frequencies: Conceptual Understanding of Foam Emissivity" Remote Sensing 4, no. 5: 1162-1189. https://doi.org/10.3390/rs4051162