Article

The Impact of Subscale Inhomogeneity on Oxygen A Band Cloud-Top Pressure Estimates: Using ESA’s MERIS as a Proxy for DSCOVR-EPIC

1
Institut für Weltraumwissenschaften, Freie Universität Berlin, Carl-Heinrich-Becker-Weg 6-10, D-12165 Berlin, Germany
2
Department of Atmospheric and Oceanic Sciences, University of Wisconsin-Madison, 1225 W. Dayton Street, Madison, WI 53706, USA
*
Author to whom correspondence should be addressed.
Remote Sens. 2012, 4(7), 1963-1973; https://doi.org/10.3390/rs4071963
Submission received: 9 May 2012 / Revised: 25 June 2012 / Accepted: 26 June 2012 / Published: 29 June 2012

Abstract

:
Medium Spectral Resolution Imaging Spectrometer (MERIS) oxygen A band measurements were used as a proxy for the Earth Polychromatic Imaging Camera (EPIC), to be launched on NASA’s Deep Space Climate Observatory (DSCOVR). The high spatial resolution of MERIS (1 × 1 km2) is exploited to study the effects of subscale spatial heterogeneity of clouds on the cloud-top pressure retrieved at the coarser spatial resolution of EPIC (10 × 10 km2). In general, for a sub-scale cloud fraction less than 1, a shift of cloud-top pressure toward the middle atmosphere is found, with a low-bias for high clouds and a high-bias for low clouds. In addition, the deviation is found to be a function of surface reflectance. The subscale variability of fully clouded EPIC pixels causes a weak underestimation of cloud-top pressure, when compared to averaged high-resolution retrievals.

1. Introduction

NASA’s Deep Space Climate Observatory (DSCOVR) will observe clouds and radiative fluxes from the L1 Lagrangian point. The Earth Polychromatic Imaging Camera (EPIC) onboard DSCOVR will measure the reflected solar radiation in 10 bands covering the ultraviolet to the near-infrared spectral range. A channel within the oxygen-A absorption band allows retrieving cloud-top pressure (hereafter referred to as CTP) information at a spatial resolution of about 10 × 10 km2. While CTP can be readily inferred from oxygen absorption along the light path, subscale variability and broken clouds will affect the retrieval. This effect will be especially pronounced for EPIC because of its comparably low spatial resolution. We use observations of ESA’s Medium Resolution Imaging Spectrometer (MERIS) to investigate the impact of such subscale inhomogeneities and broken clouds on EPIC retrievals. We perform CTP retrievals on actual MERIS observations at 1 × 1 km2 and, for comparison, on MERIS observations averaged to EPIC spatial resolution. The resulting retrievals are analysed with respect to the effect of cloud height, fraction, subscale inhomogeneity and surface reflectance on the cloud height retrieved from an EPIC-like instrument. In spite of a number of differences between the two instruments, such as the observing geometry and the exact position and width of the spectral response functions, the results of the study can be used to qualitatively estimate the effect of the comparably low spatial resolution on EPIC retrievals.

1.1. The Medium Resolution Imaging Spectrometer (MERIS)

MERIS is a programmable imaging spectrometer [1]. It is one of ten core instruments on the polar orbiter ENVISAT (Environmental Satellite, launched on 1 March 2002) flying at 800 km in a sun-synchronous orbit with an equator crossing time of 10:00 AM, descending node, and 98.5° inclination. MERIS consists of 5 identical push-broom imaging spectrometers operating in the solar spectral range between 390 and 1,040 nm, arranged in a fan shape configuration which covers a total field of view of 68.5° and spans a swath width of around 1,150 km. The spectral dispersion is achieved by mapping the entrance slit of a grating spectrometer onto a CCD array. The integration time, instrument optics and CCD array resolution are adjusted such that MERIS has a spatial resolution of 260 m × 300 m and a spectral sampling of 1.25 nm. The instrument electronic data rate provides 15 channels, which are programmable by ground command in width and in position. In the regular operation mode the spatial resolution is reduced by a factor of 4 along and across track (“reduced resolution” mode). In the “full resolution” mode, the full spatial resolution is transmitted. The central wavelengths of the spectral channels, placed between 400 and 900 nm in the operational mode, vary slightly across the field of view of MERIS. This so-called “spectral smile” is caused by curvature of the image of the slit formed in the focal plane array [2].

1.2. DSCOVR-EPIC

EPIC is part of the payload of NASA’s DSCOVR satellite. The satellite was built for sun and earth observations from the L1 Lagrangian point with the possibility to constantly observe the sun-lit part of the earth. EPIC is a multispectral imager, featuring 10 spectral channels, namely four channels in the UV spectral range at 317.5, 325, 340, and 388 nm and 6 channels in the visible and near infrared region at 443, 551, 680, 687.75, 764 and 779.9 nm. The spatial resolution of EPIC will be 10 × 10 km2. The EPIC oxygen A band channel will thus be somewhat different from the MERIS channel: The central wavelength of the MERIS channel varies between 760.5 nm and 762.5 nm. It has a width of roughly 3.5 nm, compared to the 1 nm wide channel of EPIC, located at 764 nm. Besides, due to the fact that DSCOVR will be placed in the L1 point, it will perform the measurements under different illumination conditions, as the sun will always be in the back of the instrument, resulting in an observed scattering angle close to 180 °.

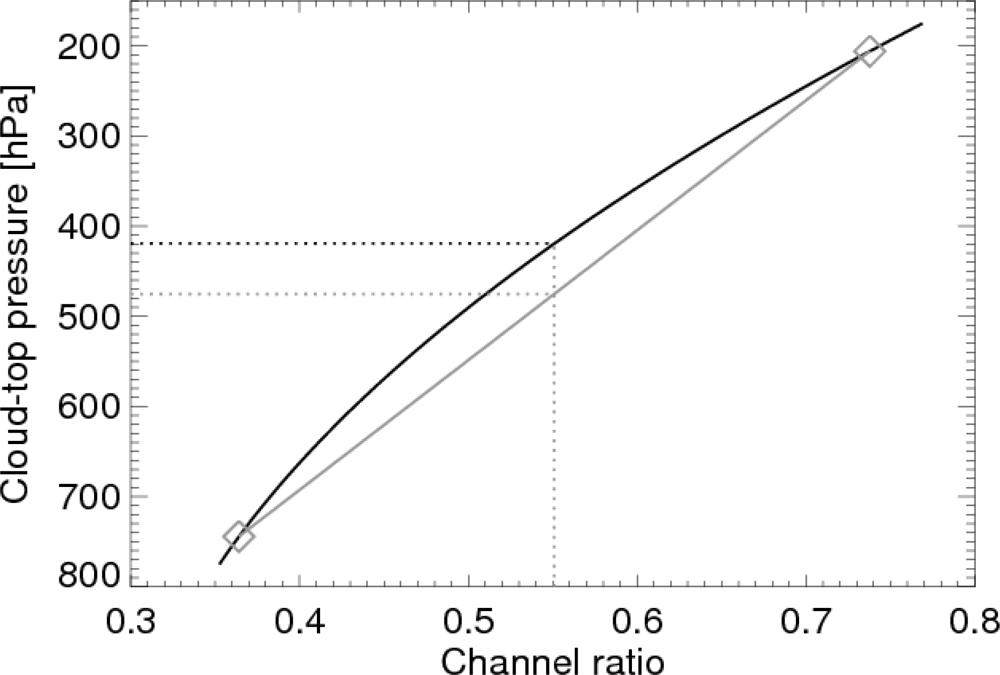
1.3. Oxygen A Band Measurements of Cloud-Top Pressure

The O2 A method for the remote sensing of CTP used in this work is based on the analysis of the absorption of solar radiation by oxygen between 760 nm and 775 nm by relating the strength of absorption to the transmitted air mass: the transmission decreases as the transmitted absorber mass increases. A wide field of remote sensing applications uses this differential absorption technique for the estimation of masses, e.g., the estimation of atmospheric water vapour or trace gases. The presence of clouds significantly alters the path lengths of reflected photons, with high clouds leading to shorter path lengths and high transmission, and low clouds leading to longer path lengths and low transmission (e.g., [39]). The transmission can not be measured directly; it is estimated by the ratio r of the measured radiance in an absorption channel and one spectrally close absorption-free window channel:
r = L O 2 A / L Window
Clouds are formed by a number of liquid droplets or ice particles suspended in a volume of air. Due to the non-solid character of clouds, the majority of the photons detected at the satellite stem from scattering from particles within the cloud rather than from reflection at the cloud-top. The resulting enhancement of the photon path lengths due to in-cloud multiple scattering, as compared to the case of a solid reflector, is a function of the geometrical thickness of the cloud [10], or, more precisely, of the vertical profile of extinction, which is unknown in general. If the oxygen absorption inside the cloud is not accounted for, the derived cloud-top height will always be too low with the magnitude of underestimation being a function of the vertical extinction profile and the observation geometry [10]. To avoid these systematic biases, the window radiance LWindow can be used to estimate the cloud optical thickness, which is to some extent correlated to the cloud’s vertical extent and thus to the photon path inside the cloud [5]. In doing so, it is essential to assume a realistic vertical extinction profile and cloud geometrical thickness for the forward simulation of the oxygen A band channel ratio, in order to ensure that the retrieved cloud-top height is free of bias on average. In this respect, the technique used in this framework is different from other cloud height retrievals based on oxygen absorption (e.g., [7,8,11]), which neglect oxygen absorption and consequently retrieve a pressure level that corresponds to a middle-of-cloud pressure (e.g., [12]).
The retrieval algorithm used in this work is based on radiative transfer simulations using the Matrix Operator Model (MOMO, [1315]). The simulations were used to derive coefficients of a multi-dimensional non-linear regression that relates the measured radiance to CTP. For the radiative transfer simulations, a representative cloud extinction was assumed for every cloud type, in order to avoid the above mentioned bias due to in-cloud multiple scattering. The input to the algorithm is the window radiance at 754 nm, the ratio of the radiance of the absorption channel at 762 nm and the window radiance, the tabulated surface reflectance, the central wavelength of the absorption channel and the observation geometry. In a validation study using airborne LIDAR measurements, it could be shown that the cloud-top pressure derived from MERIS measurements is accurate to 30 hPa for low Stratocumulus clouds [16]. Due to the lack of adequate validation sources, the accuracy of the retrieval is hard to assess for high clouds. It is expected that the measurements are hardly sensitive to optically thin clouds, such as Cirrus. Optically thick, high clouds show a larger variety with respect the vertical extent and extinction profile, resulting in an increased uncertainty of the estimated path length inside the cloud and the retrieved cloud-top pressure. Further details of the MERIS cloud-top pressure algorithm can be found in [17]. As mentioned in Section 1.2, the characteristics of MERIS and EPIC are somewhat different in terms of observation geometry and the spectral location and width of the used channels: The window channel of EPIC is located at 779 nm, at the longwave end of the O2 A band, whereas we use the window radiance at 754 nm. Since neither the gaseous absorption nor the cloud properties vary significantly between the two channels, we do not expect any influence on the general results of this study. The absorption channel of MERIS is spectrally broader than that of EPIC and there is a spectral distance of a few nanometers between them. As shown by [17], the central wavelength as well as the spectral width of the oxygen absorption channel have some effect on both the sensitivity of the measurements to CTP as well as to the susceptibility to certain error sources, mainly uncertainties in spectral calibration. However, the general, qualitative conclusions to be drawn from this study, concerning the effect of spatial resolution on the derived cloud-top pressure, are regarded as unaffected by these differences between the instrument design concepts. The same holds for the different measurement geometries of EPIC and MERIS.

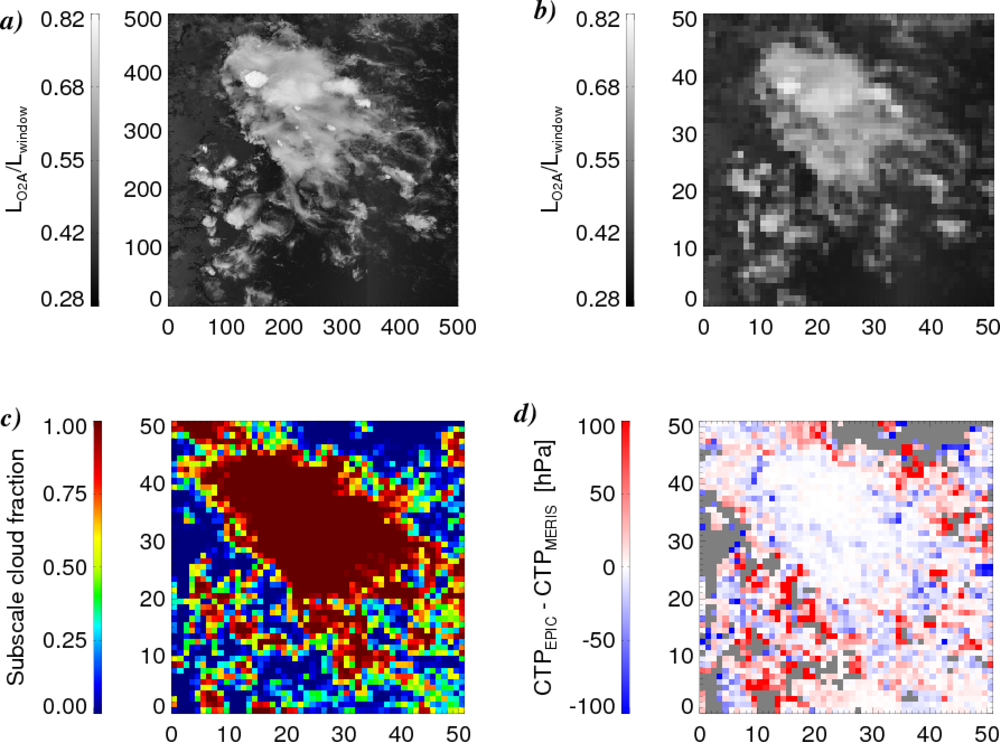
2. Using MERIS to Study the Effect of Degrading the Spatial Resolution
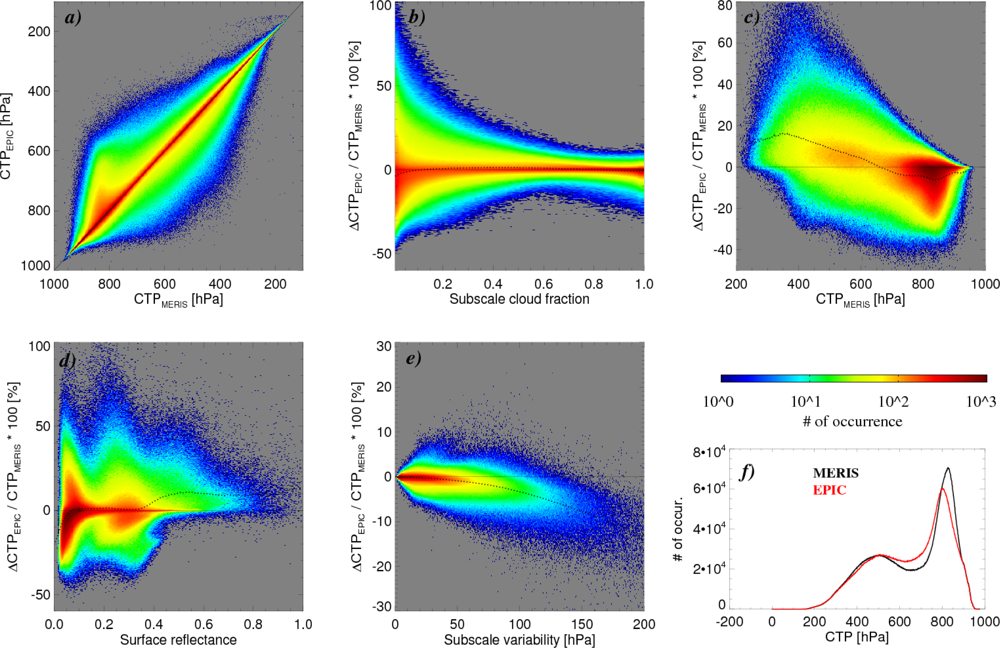
MERIS data was used to simulate EPIC-like measurements by spatially averaging the MERIS radiances over 10 × 10 pixels. The averaged radiances were then fed into the multi-dimensional non-linear regression for the retrieval of CT PEPIC, hereby assuming a constant subscale cloud fraction of 1. In parallel, the same multi-dimensional non-linear regression was used to retrieve CTP at nominal MERIS spatial resolution. In order to compare both retrievals, the MERIS-derived CTP was correspondingly averaged over the cloudy part of the 10 × 10 pixels (CT PMERIS). It is important to bear in mind that in this way all synthetic EPIC pixels including at least one cloudy MERIS pixel are considered for the comparison, where CT PEPIC is then the result of the retrieval of mostly cloud-free pixels, whereas CT PMERIS is the average of cloudy pixels only. A retrieval scheme designed for EPIC will most likely attempt to estimate the subgrid cloud fraction by comparing the observed reflectance in EPIC channels to tabulated cloud-free values. This technique is operationally applied to measurements of GOME and SCIAMACHY [18]. Since the uncertainty of such methods is large, it is worthwhile to study the effect of low cloudiness on the retrieval error. Figure 1(a,b) shows the band ratios r at nominal MERIS spatial resolution and averaged to EPIC resolution for a random maritime cloud system. The subscale cloud fraction in each synthetic EPIC pixel, determined via the fraction of cloudy MERIS pixels, is shown in Figure 1(c). As apparent in Figure 1(d) the error of CT PEPIC strongly depends on the subscale cloud fraction with hardly any difference between CT PMERIS and CT PEPIC for fully clouded pixels and increasing errors for decreasing cloud fraction. The sign of the deviation depends on additional parameters, mainly the cloud height and the surface reflectance, as will be shown below.
The overall results of the comparison are shown in Figure 2 for the analysis of a complete month of MERIS data (May 2005). The conclusions to be drawn from the individual figures shown are discussed in the following.

Overall Comparison

The overall comparison of CT PMERIS and CT PEPIC is shown in Figure 2(a). The root mean square deviation between both datasets is 43 hPa with a correlation coefficient of 0.97. CT PEPIC is 5 hPa lower than CT PMERIS on average. The scatter is mainly due to cases with a low subscale cloud fraction whereas the subscale variability of cloud height has a weaker influence, as will be shown below.

Influence of Subscale Cloud Fraction

The unknown subscale cloud fraction clearly has a large influence on the derived CT P. Globally, 35% of all EPIC pixels were found to be fully cloudy, 50% had a cloud fraction ≥ 0.75. About 20% of EPIC pixels had a cloud fraction of less than 0.1. Figure 2(b) shows the expected decrease in accuracy of CT PEPIC with decreasing cloud fraction. The sign of the deviation mainly is a function of cloud height and surface reflectance, and, to a lesser extent, the subgrid variability of CTP. The spatial resolution of the used MERIS reduced resolution data is 1 km × 1 km. Since the characteristic size of cloud structures is thus below MERIS resolution, it can be expected that similar errors as found for CT PEPIC arise for MERIS in presence of small-scale broken clouds. This does not affect the validity of the above findings.

Influence of Cloud Height

The measured oxygen A band ratio is related to the average photon path length L in the atmosphere. In clear sky cases, L is a function of air mass, the surface reflectance and the vertical distribution of aerosols in the atmosphere and corresponds to an effective reflecting layer located somewhere in the middle atmosphere. Consequently, in cases of broken clouds, the clear-sky contribution on average results in a negative deviation ΔCT PEPIC = CT PEPICCT PMERIS for low clouds and a positive deviation for high clouds. Figure 2(a) exhibits the expected deviations. Figure 2(c) shows ΔCT PEPIC as a function of cloud height for cases with a subscale cloud fraction less than 0.3. Again, the effect of shifting broken clouds towards the middle atmosphere is clearly visible. A corresponding modification of the global histogram of CTP is apparent in Figure 2(f).

Influence of Surface Reflectance

As mentioned above, in clear sky cases, the surface reflectance has a strong influence on the average photon path length L. In this work, in order to simplify the data processing, the surface reflectance is approximated by the average window reflectance at top of atmosphere in the clear fraction of MERIS pixels contributing to each synthetic EPIC pixel. In doing so, the errors caused by neglecting the small atmospheric contribution to the top-of-atmosphere reflectance are accepted, instead of relying on a reflectance database which would be applicable only over land anyway. For cases of broken clouds (subscale cloud fraction less than 0.3), Figure 2(d) shows that the resulting deviation ΔCT P tends to be negative for dark surfaces, since the contribution of the surface to the measured signal is weak and L is mainly determined by scattering in the atmosphere. For brighter surfaces there is a weak tendency for a positive bias of CT PEPIC. The oscillating pattern of the two-dimensional histogram is caused by the different frequencies of occurrence of reflectance values around the oxygen A band, exhibiting maxima below a reflectance of 0.1 (ocean cases) and above 0.2 (land surfaces).

Influence of Subscale Variability

The remote sensing of spatially heterogeneous targets such as clouds is complicated by a number of error sources, such as the assumption of homogeneous pixels and neglecting the horizontal photon transport by assuming radiatively independent pixels (Independent Pixel Approximation, e.g., [19]). While three-dimensional effects are important for spatially highly resolving measurements (resolution ≤200 m), the subscale heterogeneity is the dominant contributor for spatial resolutions of 1 km and larger [20]. In order to determine the influence of heterogeneous clouds on CT PEPIC, all pixels with a subscale cloud fraction of 1 were analysed with respect to the standard deviation σ of CT P among the 100 contributing MERIS values. Figure 2(e) shows the resulting ΔCT P as a function of σ, revealing a slight low bias of CT PEPIC for high values of σ. Only 1%–2% of the analyzed cases exhibit a subscale standard deviation of more than 100 hPa (note the logarithmic color scale), corresponding to an underestimation of CT P by roughly 20 hPa on average. This underestimation of CTP is due to the concavity of the channel ratio r, when plotted against CTP (see Figure 3). The consequence of this is, that (r(CT P1) + r(CT P2))/2 > r((CT P1 + CT P2)/2), where the left side of the equation represents the EPIC measurement and the right side represents the algorithm assumption of a homogeneous cloud layer. For a specific case, this means that the measured channel ratio for a closed, homogeneous cloud layer at a height of 500 hPa is somewhat smaller than that caused by a split cloud deck, with 50% of the clouds residing at 200 hPa and 50% at 800 hPa. The larger channel ratio in cases of a high subscale variability of CTP will therefore always result in a negative bias in retrieved CTP, as compared to the average CTP in the field fo view.

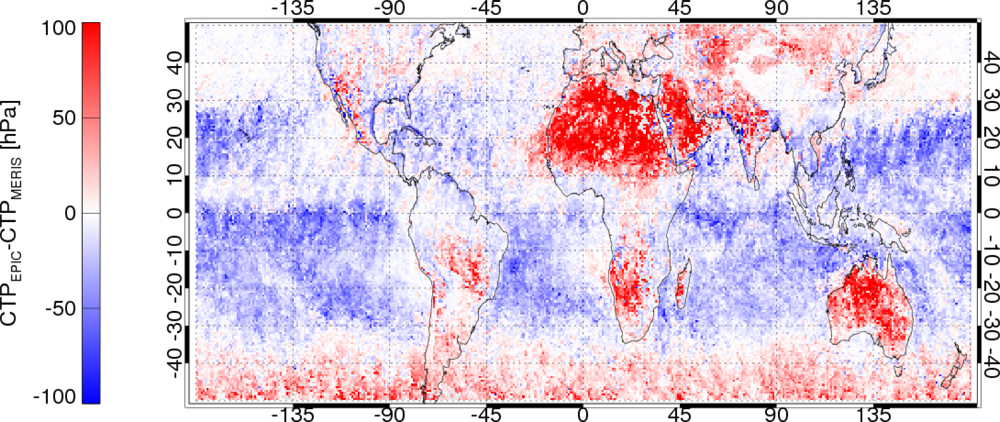
Geographical Distribution of Errors

Figure 4 shows the geographical distribution of errors in monthly averaged CTP (May 2005), as caused by degrading the spatial resolution. The monthly averaged CT PEPIC was calculated at a 0.5° × 0.5° resolution from all synthetic EPIC pixels including at least one cloudy MERIS pixel. The result in each grid box was compared to the average CTP of all cloudy MERIS pixels. Generally, an underestimation of CTP (overestimation of cloud-top height) is found over the dark ocean. In agreement with the interpretation of Figure 2(d), this can be explained with the atmospheric contribution to the signal in cases of broken clouds over dark surfaces, causing the average photon path length to correspond to a level in the middle atmosphere. This effect is reduced in regions with high occurrence of deep convection and the associated high reaching cloud tops, such as found in the ITCZ, and regions with high EPIC subpixel cloud fractions, such as found in regimes with persisting, homogeneous Stratocumulus clouds (e.g. off the South-African Westcoast). Over bright land surfaces with few clouds, such as the Saharan desert, the opposite effect is observed, namely an overestimation of CTP. Again, the sign of the deviation can be explained with the strong surface contribution to the average photon path length. Continental regions with strong cloud contamination, such as found in the mid-latitudes or the inner tropics, do not show a significant error of CT PEPIC.

3. Conclusion

In spite of some technical and conceptual differences between the instruments, MERIS onboard ENVISAT was used as a simulator for oxygen A band measurements of the upcoming DSCOVR-EPIC. The study is focused on the analysis of the effect of the comparably low spatial resolution of EPIC on the retrieval of cloud-top pressure with respect to the influence of subgrid variability, cloud fraction, cloud height and surface reflectance. The main driving parameter for errors in EPIC-derived cloud-top pressure is the subscale cloud fraction: If the cloud fraction is smaller than 1, an overestimation of the height of low clouds and an underestimation of the height of high clouds is caused by the clear sky contribution to the measurement. This emphasizes the need for a strict filtering of cases with low subgrid cloud fraction to avoid large errors in the derived cloud height. In cases of broken clouds, the error of the EPIC-derived cloud height additionally depends on the surface reflectance with bright surfaces causing a tendency toward underestimation and dark surfaces causing a tendency toward overestimation of cloud-top height. These findings are in agreement with other studies, such as [21]. In general, every cloud height retrieval relying on the estimation of the average photon path length from measurements in atmospheric absorption bands is affected by the unknown or uncertain subgrid cloud fraction. Since the spatial resolution of EPIC is far from typical sizes of most cloud cells, this problem can be expected to be met more frequently as compared to higher-resolution measurements. This holds true all the more for lower-resolution measurements such as provided by SCIAMACHY or GOME-type instruments. The subscale variability of cloud-top pressure in fully cloudy EPIC pixels was found to cause a weak underestimation of CTP, as compared to the average CTP in the field of view. In the vast majority of cases, this can be regarded as a minor effect, compared to the other error sources.

Acknowledgments

The authors would like to thank three anonymous reviewers for their advice.

References

  1. Rast, M.; Bezy, J.L.; Bruzzi, S. The ESA Medium Resolution Imaging Spectrometer MERIS—A review of the instrument and its mission. Int. J. Rem. Sens 1999, 20, 1681–1702. [Google Scholar]
  2. Bourg, L.; D’Alba, L.; Colagrande, P. MERIS Smile Effect Characterization and Correction; Technical Report; European Space Agency: Paris, France, 2008. [Google Scholar]
  3. Yamamoto, G.; Wark, D. Discussion of the Letter by R. A. Hanel: Determination of cloud altitude from a satellite. J. Geophys. Res 1961, 66, 3569. [Google Scholar]
  4. Wu, M.L.C. Remote sensing of cloud-top pressure using reflected solar radiation in the oxygen A-band. J. Appl. Meteor 1985, 24, 539–546. [Google Scholar]
  5. Fischer, J.; Grassl, H. Detection of cloud-top height from backscattered radiances within the Oxygen A Band. Part 1: Theoretical study. J. Appl. Meteor 1991, 30, 1245–1259. [Google Scholar]
  6. Fischer, J.; Cordes, W.; Schmitz-Pfeifer, A.; Renger, W.; Mörl, P. Detection of cloud-top height from backscattered radiances within the Oxygen A Band. Part 2: Measurements. J. Appl. Meteor 1991, 30, 1260–1267. [Google Scholar]
  7. Vanbauce, C.; Buriez, J.; Parol, F.; Bonnel, B.; Seze, G.; Couvert, P. Apparent pressure derived from ADEOS-POLDER observations in the Oxygen A-Band over ocean. Geophys. Res. Lett 1998, 25, 3159–3162. [Google Scholar]
  8. Wang, P.; Stammes, P.; van der A, R.; Pinardi, G.; van Roozendael, M. FRESCO+: An improved O2 A-band cloud retrieval algorithm for tropospheric trace gas retrievals. Atmos. Chem. Phys 2008, 8, 6565–6576. [Google Scholar]
  9. Preusker, R.; Lindstrot, R. Remote sensing of cloud-top pressure using moderately resolved measurements within the oxygen A band—A sensitivity study. J. Appl. Meteor. Climat 2009, 48, 1562–1574. [Google Scholar]
  10. Ferlay, N.; Thieuleux, F.; Cornet, C.; Davis, A.B.; Dubuisson; Ducos, F.; Parol, F.; Riedi, J.; Vanbauce, C. Toward new inferences about cloud structures from multidirectional measurements in the Oxygen A Band: Middle-of-cloud pressure and cloud geometrical thickness from POLDER-3/PARASOL. J. Appl. Meteor. Climat 2010, 49, 2492–2507. [Google Scholar]
  11. Acarreta, J.R.; De Haan, J.F.; Stammes, P. Cloud pressure retrieval using the O2-O2 absorption band at 477 nm. J. Geophys. Res 2004, 109, 11. [Google Scholar]
  12. Vanbauce, C.; Cadet, B.; Marchand, R.T. Comparison of POLDER apparent and corrected oxygen pressure to ARM/MMCR cloud boundary pressures. Geophys. Res. Lett 2003, 30, 1212. [Google Scholar]
  13. Fischer, J.; Grassl, H. Radiative transfer in an atmosphere-ocean system: an azimuthally dependent matrix-operator approach. Appl. Opt 1984, 23, 1035–1039. [Google Scholar]
  14. Fell, F.; Fischer, J. Numerical simulation of the light field in the atmosphere-ocean system using the matrix-operator method. J. Quant. Spectrosc. Radiat. Transfer 2001, 3, 351–388. [Google Scholar]
  15. Hollstein, A.; Fischer, J. Radiative transfer solutions for coupled atmosphere ocean systems using the matrix operator technique. J. Quant. Spectrosc. Radiat. Transfer 2012, 113, 536–548. [Google Scholar]
  16. Lindstrot, R.; Preusker, R.; Ruhtz, T.; Heese, B.; Wiegner, M.; Lindemann, C.; Fischer, J. Validation of MERIS cloud top pressure using airborne lidar measurements. J. Appl. Meteor. Climat 2006, 45, 1612–1621. [Google Scholar]
  17. Preusker, R.; Lindstrot, R.; Fischer, J. MERIS Cloud-Top Pressure, Algorithm Theoretical Basis Document ATBD 2.3; Technical Report; European Space Agency: Paris, France, 2010. [Google Scholar]
  18. Fournier, N.; Stammes, P.; de Graaf, M.; van der A, R.; Piters, A.; Grzegorski, M.; Kokhanovsky, A. Improving cloud information over deserts from SCIAMACHY Oxygen A-band measurements. Atmos. Chem. Phys 2006, 6, 163–172. [Google Scholar]
  19. Cahalan, R.F.; Gollmer, S.; Harshvardhan. Independent pixel and Monte Carlo estimates of stratocumulus albedo. J. Atmos. Sci 1994, 51, 3776–3790. [Google Scholar]
  20. Heidinger, A.K.; Stephens, G.L. Molecular line absorption in a scattering atmosphere. Part III: Pathlength characteristics and effects of spatially heterogeneous clouds. J. Atmos. Sci 2002, 59, 1641–1654. [Google Scholar]
  21. Sneep, M.; de Haan, J.F.; Stammes, P.; Wang, P.; Vanbauce, C.; Joiner, J.; Vasilkov, A.P.; Levelt, P.F. Three-way comparison between OMI and PARASOL cloud pressure products. J. Geophys. Res 2008, 113, D15S23. [Google Scholar]
Figure 1. Measured O2 A band ratio at (a) nominal MERIS resolution and (b) averaged to EPIC spatial resolution for maritime cloud system. (c) Subscale cloud fraction in EPIC pixels and (d) resulting deviation in derived CTP.
Remotesensing 04 01963f1
Figure 2. Color-coded frequency of occurrence for (a) comparison of CTP as derived from MERIS nominal resolution (CT PMERIS) and averaged to 10 × 10 km2 resolution (CT PEPIC), ΔCT P in percent as a function of (b) subscale cloud fraction, (c) cloud height (for cases with subscale cloud fraction ≤ 0.3), (d) surface reflectance (subscale cloud fraction ≤ 0.3) and (e) subscale variability (standard deviation) of CT PMERIS. Note the logarithmic color scale shown below (c). In (b)–(e), the dotted line indicates the average of all points within each bin. (f) shows the global histogram of CT PMERIS (black) and CT PEPIC (red), shown for a binsize of 1 hPa. Data basis for all results shown is MERIS L1 data from May 2005.
Remotesensing 04 01963f2
Figure 3. Black solid line: MERIS channel ratio as a function of cloud-top pressure for a pixel filled with clouds of equal height (homogeneous cloud above ocean with an optical thickness of 10, a solar zenith angle of 40°, view zenith angle of 30° and relative azimuth angle of 100°). Grey solid line: MERIS channel ratio for pixel filled with a mixture of high and low clouds. Dashed lines: Cloud-top pressure as retrieved from mean channel ratio (EPIC-like, black) and mean top pressure of clouds (grey) for pixel filled equally by high and low clouds.
Remotesensing 04 01963f3
Figure 4. Difference of monthly averaged cloud-top pressure (CT PEPICCT PMERIS) for May 2005.
Remotesensing 04 01963f4

