Operational Automatic Remote Sensing Image Understanding Systems: Beyond Geographic Object-Based and Object-Oriented Image Analysis (GEOBIA/GEOOIA). Part 1: Introduction

Abstract
:
1. Introduction
- Synonyms of (sub-symbolic or symbolic) deductive inference are: (sub-symbolic or symbolic) deductive learning, top-down inference, coarse-to-fine inference, driven-by-knowledge inference, learning-by-rules, physical model, prior knowledge-based decision system, rule-based system, expert system, syntactic inference, syntactic pattern recognition.
- Synonyms of (sub-symbolic or symbolic) inductive inference are: (sub-symbolic or symbolic) inductive learning, bottom-up inference, fine-to-coarse inference, driven-without-knowledge (knowledge-free) inference, learning-from-examples, statistical model.
- Terms sub-symbolic, sensory, numerical, non-semantic, quantitative, objective, unequivocal are synonyms.
- Terms symbolic, semantic, cognitive, categorical, ordinal, nominal, qualitative, subjective, equivocal are synonyms.
- Mulier and Cherkassky: “induction amounts to forming generalizations from particular true facts. This is an inherently difficult (ill-posed) problem and its solution requires a priori knowledge in addition to data” ([32]; p. 39).
- Marr: “vision goes symbolic almost immediately, right at the level of zero-crossing (first-stage primal sketch)... without loss of information” ([13]; p. 343).
- Vecera and Farah: “we have demonstrated that image segmentation can be influenced by the familiarity of the shape being segmented”, “these results are consistent with the hypothesis that image segmentation is an interactive (hybrid inference) process” “in which top-down knowledge partly guides lower level processing”. “If an unambiguous, yet unfamiliar, shape is presented, top-down influences are unable to overcome powerful bottom-up cues. Some degree of ambiguity is required to overcome bottom-up cues in such situations. The main conclusion from these simulation studies is that while bottom-up cues are sometimes sufficient for processing, these cues do not act alone; top-down cues, on the basis of familiarity, also appear to influence perceptual organization” ([33]; p. 1294).
2. Problem Recognition and Opportunity Identification
- ▪ An appropriate coordinated program of Cal/Val activities throughout all stages of a spaceborne mission, from sensor building to end-of-life, is considered mandatory to ensure the harmonization and interoperability of multi-source multi-temporal observational data and derived products. By definition, radiometric calibration is the transformation of dimensionless digital numbers (DNs) into a community-agreed physical unit of radiometric measure.
- ▪ Sensory data and derived products generated at each step of a satellite-based information processing workflow must have associated with them a set of quantifiable metrological/statistically-based mutually uncorrelated quality indicators (QIs) featuring a degree of uncertainty in measurement to provide a documented traceability of the propagation of errors through the information processing chain in comparison with established community-agreed reference standards.
- ➢ Still now the percentage of data downloaded by stakeholders from the ESA EO databases is estimated at about 10% or less [44].
- ➢ In large portions of the RS literature: (i) The sole mapping accuracy is selected from the possible set of mutually independent OQIs eligible for parameterizing RS-IUSs for assessment and comparison purposes (refer to this section below), (ii) the statistical estimate of the mapping accuracy is not provided with any degree of uncertainty in measurement in compliance with the principles of statistics together with the QA4EO recommendations [2], and (iii) alternative RS data mapping solutions are tested exclusively in toy problems at a small spatial scale (e.g., local scale) or coarse semantic granularity. The practical consequences of these experimental drawbacks are that, firstly, the mapping accuracy of the proposed RS-IUSs remains unknown in statistical terms and, secondly, the robustness of these RS-IUSs to changes in the input data set together with their scalability to real-world RS applications at large (e.g., continental, global) spatial scale and fine semantic granularity remain unknown or appear questionable.
- ➢ In line with the QA4EO recommendations [2] the RS community regards as an indisputable fact that “the prerequisite for physically based, quantitative analysis of airborne and satellite sensor measurements in the optical domain is their calibration to spectral radiance” ([45]; p. 29). Irrespective of this common knowledge, radiometric calibration is often neglected in the RS literature and surprisingly ignored by scientists, practitioners and institutions in RS common practice, including large-scale spaceborne image mosaicking and mapping, e.g., see [46,47]. For example, in conflict with the QA4EO guidelines, popular RS-IUS commercial software products, such as those listed in Table 1, do not consider radiometric calibration of RS imagery as a pre-requisite, with the sole exception of the physical model-based Atmospheric/Topographic Correction (ATCOR-2/3/4) commercial software [48,49]. The relaxation of the requirement of radiometric consistency of multi-source multi-temporal multi-spectral (MS) imagery brings, as an inevitable consequence, that these RS-IUS commercial software products, but ATCOR-2/3/4, are based on (inherently ill-posed) statistical rather than physical models, which means they are intrinsically semi-automatic and site-specific (refer to Section 4 below).
- ➢ In academic and commercial GEOBIA and GEOOIA system implementations, sub-symbolic inductive inference (e.g., image segmentation, unlabeled data clustering) is adopted in the near totality of the pre-attentive vision first stage implementations. The sole exceptions these authors are aware of employ the physical model-based spectral decision-tree classifier (SPECL), implemented as a by-product in the ATCOR-2/3/4 commercial software toolbox [48,49], which is suitable for biophysical variable estimation from RS optical imagery [50,51]. For more details about SPECL, refer to Section 2 in [12]. In addition, supervised data learning classification is employed in a large majority of the attentive vision second stage implementations of the GEOBIA and GEOOIA systems proposed in literature. In practice, inductive inference is dominant in existing GEOBIA/GEOOIA systems. Hence, if a lack of productivity affects these RS-IUSs independently of their implementation, it may be due to an intrinsic insufficiency of inductive inference to accomplish OQIs superior to reference standards.
- ➢ There is an “enigmatic” lack of inter-dependence between machine and human vision, namely, between the CV discipline and the studies of biological vision conducted by neurophysiology and psychophysics [52]. For example, in the CV literature it is acknowledged that “many computer vision systems implicitly use some aspects of processing that can be directly related to the perceptual grouping processes of the human visual system. Frequently, however, no claim is made about the pertinence or adequacy of the digital models as embodied by computer algorithms to the proper model of human visual perception. Edge-linking and region-segmentation, which are used as structuring processes for object recognition, are seldom considered to be a part of an overall attempt to structure the image. “This enigmatic situation arises because research and development in computer vision is often considered quite separate from research into the functioning of human vision. A fact that is generally ignored is that biological vision is currently the only measure of the incompleteness of the current stage of computer vision, and illustrates that the problem is still open to solution” [53].
- ➢ According to philosophical hermeneutics, the impact upon Computer Science (CS), Information Technology (IT), AI and MAL of existing different quantitative and qualitative concepts of information (respectively, ‘information-as-thing’ and ‘information-as-(an intepretation)process’), embedded in more or less explicit information theories, appears largely underestimated (refer to Section 1) [4,5]. It means that fundamental questions—like: When do sub-symbolic data become symbolic information? When does vision go symbolic? etc.—appear largely underestimated and, as a consequence, far from being answered.
- ➢ There is an on-going multi-disciplinary debate about a claimed inadequacy of scientific disciplines such as CV, AI/Machine Intelligence (MAI) and Cybernetics/MAL, whose origins date back to the late 1950s, in the provision of operational solutions to their ambitious cognitive objectives [54,55]. Deductive inference is the main focus of interest of traditional AI. Inductive inference is the basis of the MAL discipline. It may mean that, if they are not combined, deductive and inductive inference show intrinsic weaknesses in operational use, irrespective of implementation.
- ➢ A set of quantifiable metrological/statistically-based OQIs, to be community-agreed in compliance with the GEO-CEOS QA4EO guidelines [2], is proposed to parameterize RS-IUSs for assessment and comparison purposes. The proposed set of OQIs includes: (i) degree of automation (ease-of-use), monotonically decreasing with the number of system free-parameters to be user-defined, it is also affected by the physical meaning, if any, and the range of variation (e.g., bounded, unbounded, normalized) of the system free-parameters; (ii) accuracy, e.g., thematic and spatial accuracy of a classification map; (iii) efficiency, e.g., computation time and memory occupation; (iv) robustness to changes in input parameters; (v) robustness to changes in the input data set acquired across time, space and sensors; (vi) scalability, to cope with changes in input data specifications and user requirements; (vii) timeliness, defined as the time span between sensory data collection and data-derived product generation, it increases monotonically with computer power and manpower (e.g., the manpower required to collect reference samples for training an inductive data learning system); and (viii) costs, which increase monotonically with computer power and manpower.
- ➢ An RS-IUS is called ‘operational’ if and only if all of its OQIs, to be community-agreed (refer to this section above), score high in real-world RS image understanding (classification, mapping, recognition) problems, including RS applications at large spatial (e.g., continental, global) scale and fine semantic granularity. The proposed definition for an RS-IUS to be considered operational is not trivial. In practice, it is in contrast with a large portion of existing RS literature where the sole mapping accuracy is estimated without degree of uncertainty in toy problems at a small spatial scale or coarse semantic granularity (refer to this section above).
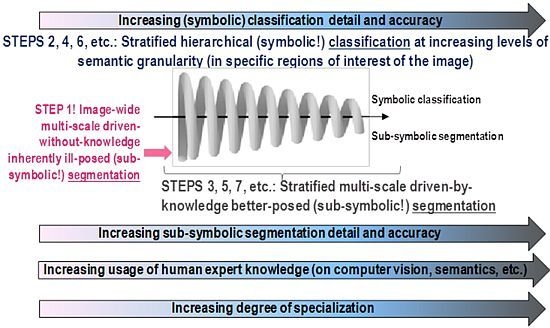
- ➢ An original three-stage, stratified, hierarchical, hybrid RS-IUS architecture is proposed to comprise the following components (for further details, refer to Section 5 in [12]).
- An RS image pre-processing Stage 0 (zero), including the radiometric calibration of DNs into top-of-atmosphere reflectance (TOARF) or surface reflectance (SURF) values, where SURF is a special case of TOARF in very clear sky conditions [58], i.e., TOARF ⊇ SURF. This radiometric calibration is mandatory, in compliance with the QA4EO guidelines [2]. In addition to ensuring the harmonization and interoperability of multi-source observational data, radiometric calibration is considered a necessary not sufficient condition for automatic (hybrid model-based) interpretation of EO imagery.
- A symbolic, physical model-based (refer to Section 4.1 below), per-pixel pre-attentive vision first stage for RS image preliminary classification (pre-classification) (refer to Section 5 below), identified as Stage 1. It is implemented as an original, operational, automatic, near-real-time SIAM™ preliminary classifier (for further details about SIAM™, refer to Section 5.4 in [12]).
- A feedback loop feeds the pre-attentive vision Stage 1 (categorical) output back to the pre-processing Stage 0 input for stratified (driven-by-knowledge, symbolic mask-conditioned) automatic RS image enhancement (e.g., stratified topographic correction [20], stratified image-coregistration, stratified image mosaic enhancement [19], etc.). Thus, depending on the Stage 1 output, the hybrid (numerical and categorical) input of Stage 0 is adjusted so as to reach a system steady state. This means that the proposed hybrid RS-IUS is a feedback system. It is worth mentioning that the principle of stratification is popular in statistics (e.g., refer to the well-known stratified random sampling design [59]). Its advantage is that “stratification will always achieve greater precision provided that the strata have been chosen so that members of the same stratum are as similar as possible in respect of the characteristic of interest” [60]. In other words, (inherently ill-posed) statistical models become better posed (conditioned, constrained) by incorporating the “stratified” or “layered” approach to accomplish driven-by-knowledge regularization (simplification) of the solution space. In general, the problem of stratification is that the collection of appropriate strata may be difficult [60]. In the proposed RS-IUS implementation where SIAM™ is adopted as preliminary classifier, symbolic strata are generated automatically as output of the pre-attentive vision Stage 1.
- An attentive vision second stage battery of stratified, hierarchical, context-sensitive, application-dependent modules for class-specific feature extraction and classification, identified as Stage 2 (refer to Section 5 below). This stratified classification second stage: (i) provides a possible instantiation of a focus-of-visual-attention mechanism to mimic that adopted by attentive vision in mammals [61–64], which increases the overall degree of biological plausibility of the proposed hybrid RS-IUS; and (ii) allows second-stage (inherently ill-posed) inductive data learning algorithms, if any, to be better posed (conditioned) by symbolic prior knowledge (namely, semantic strata) stemming from the preliminary classification first stage.
3. Adopted Terminology
(Sub-symbolic or symbolic) deductive inference, deductive learning, top-down inference system, coarse-to-fine inference, driven-by-knowledge inference, learning-by-rules, physical model, prior knowledge-based decision system, rule-based system, expert system, syntactic inference, syntactic pattern recognition.
(Sub-symbolic or symbolic) inductive inference, inductive learning, bottom-up inference, fine-to-coarse inference, driven-without-knowledge (knowledge-free) inference, learning-from-examples, statistical model.
- Symbolic, semantic, cognitive, categorical, ordinal, nominal, qualitative, subjective, equivocal. For example, (discrete) categorical variable.
- Sub-symbolic, sensory, numerical, non-semantic, quantitative, objective, unequivocal. For example, continuous or discrete sensory variable (data, observables, true facts).
4. Critical Review of AI and MAL Principles
4.1. Deductive Inference at the Basis of AI
- A knowledge base, comprising a set of production rules (such as IF premises, e.g., facts, THEN conclusion, e.g., action) and meta rules (i.e., rules to select other rules). In general, the knowledge base encompasses a structural knowledge and a procedural knowledge [67]. Structural knowledge is a synonym of a 4-D spatio-temporal ontology of the world [65], also called world model [25], whose graphical notation can be a semantic (concept) network or conceptual graph. A semantic network consists of [30,31,67,68]: (i) a hierarchical taxonomy of classes (concepts) of 4-D objects-through-time represented as nodes featuring elementary properties (attributes), called primitives; and (ii) spatial relations (either topological, e.g., adjacency, inclusion, etc., or non-topological, e.g., distance, in-between angle, etc.), non-spatial relations (e.g., is-a, part-of, subset-of) and temporal relations between classes represented as arcs between nodes. Procedural knowledge is concerned with specific computational functions and inference capabilities [67]. Typically, it has to deal with the order of presentation of decision rules in the knowledge base. For each class, a class grammar exists. It consists of a set of substitution rules that must be followed when words of the class-specific description language, which represents the set of all words that can be used to describe objects from one class, are constructed from letters of the alphabet, where each letter corresponds to one primitive in the world model [14].
- A base of input facts, e.g., sensory data, narrative descriptions of spatial facts (e.g., Sicily is at the toe of Italy), etc., and output facts as results of inference rules.
- A knowledge engineering interface, to codify human knowledge of domain experts into the fact base and the knowledge base. This learning paradigm is also called deductive machine teaching (MAT)-by-rules [23,55], complementary to the inductive MAL-from-examples paradigm. In the words of Lang, “transferring existing experience effectively into procedural and structural knowledge remains a challenge of AI systems... we need to carefully feed the (information processing) system with (the interpreter’s) experience in a usable form” [67]. For example, “the entire process of image analysis is characterized by the transformation of knowledge. Finally, a (3-D) scene description representing the (2-D) image content should meet the (equivocal!) conceptual reality of an interpreter” [67]. Hence, there is the need “to carefully feed the system with (intepreter’s or operator’s) experience in a usable form” through “pro-active engagement by the operator” [67]. This must take place within a “pro-active classification” framework based on “systemic” (top-down, syntactic) class modeling, alternative to the “mechanicistic” (bottom-up, inductive) learning-from-data approach typical of the MAL discipline. It is interesting to note that the data interpretation system conceived by Lang, where the inquirer (receiver, knower, cognitive agent) plays a pro-active role in the generation of information from data, is exactly what philosophical hermeneutics calls “fusion of horizons” that always takes place between a speaker and the listener(s) according to the concept of ‘information-as-(an interpretation)process’, complementary to the concept of ‘information-as-thing’, refer to Section 3 [12]. To recapitulate, terms like MAT and knowledge engineering, adopted in AI, and “fusion of horizons”, used in philosophical hermeneutics, are synonyms.
- An inference engine capable of:
- applying class-specific grammars for syntactic pattern recognition, namely, to decide whether an input word, consisting of a combination of letters that identifies a combination of primitives, is or is not syntactically correct according to a particular class grammar.
- Logical reasoning (inference) to generate higher-level information from the knowledge and fact bases based on rules of inference (transformation rules), refer to this section below.
- Deduction (modus ponens) rule of inference or forward chaining: (P; P → R) ⇒ R, meaning that if fact P is true and the rule if P then R is also true, then we derive by deduction that R is also true. It is the way to test the effects of some starting fact or cause.
- Abduction (modus tollens) rule of inference or backward chaining: (R; P → R) ⇒ P, meaning that if R is true and the rule if P then R is also true, then we obtain by abduction that P is also true. It is adopted for diagnosis to discover the potential causes generating the observed facts.
- Induction rule of inference: (P; R) ⇒ (P ↔ R), meaning that if two facts P and R are (always observed as) concomitant, then we can derive (induce) a correlation (!) rule P ↔ R that when P is true, then R is also true and vice versa. It is important to stress that, in general, correlation relationships highlighted by inductive reasoning are statistical relationships which may have little or nothing to do with cause-and-effect relationships in the physical (real) world. For example, it is well known that, in Italy, a high-value correlation exists between tourist road traffic and the leaf phenology. Obviously, this high correlation value has nothing to do with the finding of a cause-and-effect relationship between a monotonically increasing growth of leaves with tourist road traffic or vice versa. To summarize, it is important to remark that inductive inference, which deals with correlation between input facts, has nothing to do with inference by abduction (backward chaining) or deduction (forward chaining) between input and output variables. Unfortunately, in the MAL, CV and RS disciplines, statistical systems dealing with correlation relationships between input variables are sometimes adopted to infer (unknown) cause-and-effect relationships between input and output variables, either sub-symbolic or symbolic, belonging to a 4-D spatio-temporal ontology (model) of the world-through-time.
- Transitivity rule of inference: (P → Q; Q → R) ⇒ (P → R), where a new rule is produced by transitivity if two different rules, the first implying Q and the second starting from Q, hold true.
- ➢ In the words of Sonka et al. ([14]; p. 283), “Syntactic object description should be used whenever (quantitative sub-symbolic) feature description is not able to represent the (semantic) complexity of the described object and/or when the (semantic) object can be represented as a hierarchical structure consisting of simpler parts (simpler semantic objects)” or, in addition to the relation part-of, other relations (e.g., subset-of, spatial relations, etc.) exist between classes of objects to form a semantic network (refer to this section above). “The main difference between statistical and syntactic recognition is in the learning process. (Class) grammar (as well as semantic network) construction can rarely be algorithmic using today’s (automated grammar inference-from-examples) approaches, requiring significant human interaction”. In practice, class grammar and semantic network construction is still left to a human analyst based on his/her own “heuristics, intuition, experience and prior information about the problem”.
- ➢ In the words of Shunlin Liang ([56]; p. 2), physical models (e.g., eligible for assessing categorical variables or continuous biophysical variables from EO sensory data) are provided by a human expert (supervisor) with prior knowledge concerning the physical laws of the (4-D) world-through-time based on his/her own intuition, expertise and evidence from data observations, before the physical model starts examining the objective sensory data at hand. Thus, physical models are human-driven (herein, equivocal, refer to Section 2 [4,5,23]) abstracts (simplified representations, approximations) of reality. Physical models try to establish cause-and-effect relationships, which have nothing to do with statistical correlation (refer to this section above).
- ➢ Typical advantages of (static) syntactic inference systems are listed below:
- ○ They are more intuitive to debug, maintain and modify than statistical models. In other words, if the initial physical model does not perform well, then the system developer knows exactly where to improve it by incorporating the latest knowledge and information [56].
- ○ In the words of Lang: “establishing a (physical model-based) rule set is often time-, labor- and cost-intensive. But once a (physical rule-based) system is set up and proved to be transferable, the effort pays off” [67].
- ➢ Typical limitations of (static) syntactic inference systems are listed below:
- ○ They suffer from an intrinsic lack of flexibility, i.e., decision rules do not adapt to changes in the input data format and users’ needs, hence the knowledge base may soon become obsolete.
- ○ They suffer from an intrinsic lack of scalability, in particular rule-based systems are impractical for complex problems.
4.2. Inductive Inference at the basis of MAL
- ➢ A typical taxonomy of symbolic inference algorithms comprises [32]: (i) Supervised (labeled) data learning algorithms for function regression-from-examples, which deals with the estimation of an output continuous variable from an input discrete and finite training set of data samples with label, where each label is the target value of the output continuous variable for that data sample; and (ii) supervised data learning algorithms for classification-from-examples, which deals with the estimation of an output (discrete) categorical variable from an input discrete and finite training set of data samples with label, where each label is the target value for that data sample of the output categorical variable. A typical taxonomy of sub-symbolic inference algorithms comprises [32]: (i) Unsupervised (unlabeled) data learning algorithms for density function estimation; (ii) unsupervised data learning algorithms for data quantization; (iii) unsupervised data learning algorithms for data clustering (providing as output sub-symbolic labeled data clusters, say, Cluster 1, Cluster 2, etc., provided with no meaning); and (iv) unsupervised (knowledge-free) image segmentation algorithms (providing as output sub-symbolic labeled image-polygons, say, Polygon 1, Polygon 2, etc., provided with no meaning).
- ➢ In the words of Cherkassky and Mulier [32] (p. 39), inductive inference “is an inherently difficult (ill-posed) problem and its solution requires a priori knowledge in addition to data” (refer to Section 1). This is perfectly consistent with Jacques Hadamard’s definition of the ill-posed problem [69,70]. According to Hadamard, mathematical models of physical phenomena are defined as well-posed when they satisfy the following requirements [70]: (1) A solution exists and (2) the solution is unique. Examples of archetypal well-posed problems include the heat equation with specified initial conditions. Problems that are not well-posed in the sense of Hadamard, i.e., problems that admit multiple solutions, are termed ill-posed. Inverse problems are often ill-posed [69]. For example, the inverse heat equation is not well-posed. In addition, a system is called well-conditioned when the solution depends continuously on the input data, in some reasonable topology. Otherwise the model is called ill-conditioned, meaning that a small error in the initial data can result in much larger errors in the answers. Even if a problem is well-posed, it may still be ill-conditioned. The requirement of continuity of changes of the solution with the input data is related to the requirement of stability or robustness of the solution with respect to changes in the input data set. Continuity, however, is a necessary but not sufficient condition for stability [69]. If the problem is well-posed, then it stands a good chance of solution on a computer using a stable algorithm. If it is not well-posed, it needs to be re-formulated to become better conditioned for numerical treatment. Typically, this involves including additional assumptions, equivalent to prior knowledge, to make the problem better posed, e.g., smoothness of solutions known as (Tikhonov) regularization.
- ➢ In the words of Shunlin Liang ([56]; p. 2), “statistical models (e.g., eligible for assessing categorical or continuous biophysical variables from EO sensory data) are based on correlation relationships and... cannot account for cause-effect relationships”, refer to Section 4.1.
- ➢ In the words of Shunlin Liang ([56]; p. 2), statistical models in RS data analysis are effective for summarizing local data exclusively. This means that statistical models are usually site-specific, i.e., they tend to be effective locally with small data sets exclusively. This is a consequence of the well-known central limit theorem [71]: The sum of distributions generated by a large number of independent random variables (equivalent to, say, different LC classes depicted in a RS image) tends to form a Gaussian distribution, where no “meaningful” or “natural” data entity, cluster or (sub-)structure can be identified [23]. For example, in the framework of the Global Forest Cover Change (GFCC) Project [72], a pixel-based support vector machine (SVM) [32] model selection strategy is run for each (!) image of a multi-temporal Landsat image mosaic at global scale and 30 m spatial resolution. This image-based SVM model selection strategy, which is extremely time-consuming, is required to counterbalance the aforementioned well-known limitation of statistical models, which tend to be site-specific [56].
- ➢ In the RS application domain it is well known that supervised data learning algorithms [32,71], whether context-insensitive (e.g., pixel-based) or context-sensitive (e.g., 2-D object-based) [73,74], require the collection of reference training samples, which are typically scene-specific, expensive, tedious and difficult or impossible to collect [1,59]. This means that in RS common practice where supervised data learning algorithms are employed, the cost, timeliness, quality and availability of adequate reference (training/testing) datasets derived from field sites, existing maps and tabular data have turned out to be the most limiting factors on RS data-derived product generation [1].
- ➢ Inductive data learning decision-tree classifiers, developed by statistics and MAL (e.g., Classification And Regression Tree (CART) [75], C5.0 [76], etc.) to overcome limitations of traditional (static) syntactic inference systems developed by AI (refer to Section 4.1), have provided the basis for a rising interest in data mining. Their typical advantages include the following:
- ○ In general, inductive decision-trees are non-parametric distribution-free.
- ○ The tree structure enables interpretation of the explanatory nature of the independent input variables. For example, adaptive decision-trees have been widely used in RS data classification applications at regional scale [77].
- ▪ The problem of learning an optimal decision tree is known to be NP-complete under several aspects of optimality and even for simple relations such as XOR. Consequently, practical decision-tree learning algorithms are based on heuristic algorithms. The result is that decision-tree learners can create over-complex trees that do not generalize the training data well.
- ▪ Inductive data learning systems available to date are unable to find even simple class grammars or discover semantic networks consisting of concepts and inter-concept relations (e.g., part-of, subset-of) [14] (refer to Section 4.1).
- ▪ Sufficient training data usually consists of hundreds or even thousands of training samples to be independently identically distributed (iid).
- ✓ They are based on correlation relationships, not to be confused with cause-and-effect relationships.
- ✓ They are usually site-specific.
- ✓ They are inherently ill-posed and require a priori knowledge in addition to data to become better posed for numerical treatment. It means that, to become better posed, they are semi-automatic, i.e., the user, considered as a source of prior knowledge, is required to define the system free-parameters based on heuristics.
- ✓ They are unable to construct class grammars and semantic networks consisting of (semantic) concepts (as network nodes) and relations between concepts (as arcs between nodes, e.g., part-of, subset-of).
- ✓ They require adequate reference (training/testing) datasets whose cost, timeliness, quality and availability can soon become serious limiting factors on data-derived product generation.
5. Critical Review of Biological and Artificial Vision Concepts and Terminology
- Pre-attentive (low-level) vision extracts picture primitives based on general-purpose image processing criteria independent of the scene under analysis. It acts in parallel on the entire image as a rapid (<50 ms) scanning system to detect variations in simple visual properties [61–63]. It is known that the human visual system employs at least four spatial scales of analysis [64].
- The output of pre-attentive vision is a symbolic primal sketch, also called preliminary classification (pre-classification) map. This is tantamount to saying that:
- Vision goes symbolic within the pre-attentive vision phase. This means that first-stage image segmentation (image feature extraction) and image pre-classification are solved simultaneously.
- The primal sketch is a preliminary semantic map consisting of pre-attentive symbolic labels that belong to the world model, which exists before (prior to) looking at a 3-D viewed-scene.
- The meaning of (the degree of symbolic information collected by) the pre-attentive symbolic labels must be superior to zero and not superior (i.e., equal or inferior) to that of the attentive symbolic labels. The attentive symbolic labels are related to concepts (refer to this section above). Hence, the pre-attentive symbolic labels are called semi-concepts.
- The symbolic output of pre-attentive vision is lossless (or lossy). To be lossless, the pre-attentive mapping of a continuous sub-symbolic variable (e.g., surface reflectance) into a discrete categorical variable (semi-concepts, e.g., ‘vegetation’) must be reversible. If the input image is reconstructed (synthesized) from its discrete semantic description by inverse mapping, then the reconstructed image is a piecewise constant approximation of the input image. The reconstructed image must satisfy the following constraints.
- The image-wide discretization (quantization) error (summary statistic) of the reconstructed image in comparison with the original image must be low.
- Locally, small but genuine image details (high spatial frequency image components) of the original image must be well preserved in the reconstructed image.
This is tantamount to saying that the inverse mapping of the symbolic pre-attentive vision pre-classification map back to the input image domain generates a piecewise constant approximation of the input image equivalent to an edge-preserving smoothing filter.
- Symbolic pre-attentive vision is general-purpose (application-independent), parallel and rapid (efficient) to generate as output a (symbolic) preliminary classification (pre-classification) map of the input image. Hence, symbolic pre-attentive vision accomplishes image feature extraction (image segmentation) and image pre-classification simultaneously (refer to Section 1).
- Pre-attentive semantic labels belong to a discrete and finite set of semi-concepts whose degree of semantic information must be superior to zero and equal or inferior to that of concepts detected by the attentive vision second phase.
- The inverse mapping of the pre-classification map back to the input image domain generates a piecewise constant approximation of the input image equivalent to an edge-preserving smoothing filter.
6. The GEOBIA Paradigm
6.1. Review of the GEOBIA Objectives and Definitions
- The automatic or semi-automatic partitioning (segmentation, aggregation, simplification) of a raster RS image, consisting of sub-symbolic unlabeled pixels, into discrete sub-symbolic labeled image-objects, where the sub-symbolic label is a segment identifier (e.g., an integer number, say, Segment 1, Segment 2, etc.), such that each discrete image-object is a connected set of pixels whose visual (appearance, pictorial) properties are considered relatively homogeneous with respect to their surroundings according to a measure of similarity chosen subjectively based on its ability to create “interesting” (“meaningful”) image-objects.
- The automatic or semi-automatic mapping (projection) of sub-symbolic labeled image-objects onto a discrete and finite set of symbolic 4-D object-models-through-time belonging to a world model (refer to Section 5) [25,65,68], depending on the image-object-specific spatial, spectral and temporal characteristics, so as to generate as output symbolic vector geospatial information in a Geographic Information System (GIS)-ready format.
- (Inductive) Unsupervised data learning (e.g., image segmentation, unlabeled data clustering) pre-attentive vision first stage+ (in series with)
- Attentive vision second stage implemented as an (inductive) 2-D object-based supervised data learning classifier or a (deductive) 2-D object-based syntactic classifier.
6.2. Two-Stage Non-Iterative GEOBIA Architecture
7. Three-Stage Iterative GEOOIA Architecture
- An (inherently ill-posed) driven-without-knowledge (non-stratified, symbolic mask-unconditioned) image segmentation pre-attentive vision first stage, in common with the two-stage non-iterative GEOBIA design (refer to Section 8.2 below),
- An attentive vision second-stage battery of 2-D object-based class-specific classification modules that introduce semantics, implemented as (inductive) 2-D object-specific supervised data learning classifiers (e.g., SVMs) and/or (deductive) 2-D object-specific decision rule-set classifiers (refer to Section 4),
- A battery of stratified (symbolic mask-conditioned) class-specific driven-by-knowledge segmentation algorithms eligible for improving the segmentation locally for each specific class, where steps (2) and (3) can be iterated hierarchically according to the well-known problem-solving principle of divide-and-conquer (dividi et impera) [71], which is typically adopted by decision-trees (where it is known as the “stratified” or “layered” approach) [89,92]. The principle of stratification is also well known in statistics [60] (refer to Section 2 above and also to Section 5.1 in [12]). In the Definiens GEOOIA commercial software products the “stratification” principle is called “class filter” such that image objects will be part of the search domain, called the “image object domain”, if they are classified with one of the classes selected in the class filter [7,8]. In practice, this iterative approach approximates the “focus of visual attention” mechanism adopted by the human attentive vision second phase [16–25] (refer to Section 5). On the contrary, any “layered” approach is absent from the traditional two-stage non-iterative GEOBIA design shown in Figure 2, which is the reason why GEOBIA is outperformed by the GEOOIA scheme [6].
- Whereas GEOOIA inherits from GEOBIA the inherent ill-posedness of the driven-without-knowledge image segmentation pre-attentive vision first stage (refer to Section 5), the iterative GEOOIA second and third stages are expected to hierarchically introduce additional supervised knowledge (for example, in the form of (iv) user-defined parameters, labeled data sets for the training/testing of inductive systems for classification-from-examples, prior knowledge-based syntactic rule sets or prior knowledge-based selection of symbolic strata, etc.). The amount and costs of this supervised knowledge are expected to decrease monotonically with iterations according to a divide-and-conquer problem solving principle. This supervised knowledge is equivalent to assumptions eligible for making the inherently ill-posed RS image mapping problem better posed (conditioned) for numerical treatment (refer to Section 4.2).
- In terms of induction and deduction rules of inference [32] (see Section 4), the GEOOIA system architecture can be summarized as follows:
- (Inductive) Unsupervised data learning (e.g., image segmentation, unlabeled data clustering) pre-attentive vision first stage+ (in series with)
- Attentive vision second stage implemented as an (inductive) 2-D object-based supervised data learning classifier or a (deductive) 2-D object-based syntactic classifier+ (in series with)
- Optional iteration(s): driven-by-knowledge (stratified, symbolic mask-conditioned) sub-symbolic pre-attentive vision first stage followed by driven-by-knowledge attentive vision second stage.
8. SWOT Analysis of GEOBIA/GEOOIA
8.1. GEOBIA/GEOOIA Strengths (Due to Internal Drivers)
- ➢ According to Section 6.1, the aim of GEOBIA/GEOOIA is to partition an image into discrete sub-symbolic 2-D objects and provide a structural description of these 2-D objects in a way akin to that of a human photo interpreter observing a 3-D viewed-scene of the 4-D world-though-time [34,35]. To perform symbolic reasoning together with spatial reasoning as successfully as in biological vision (refer to Section 5) [25], object-based image analysis in place of traditional pixel-based image analysis is required, since image-objects exhibit useful contextual features (e.g., per-object shape, within-segment texture) and spatial topological relationships (e.g., adjacency, inclusion, etc.) that single pixels lack [34,35].
- ➢ Using image-objects reduces the number of information primitives of a classifier by orders of magnitude when basic units are the image pixels [34].
8.2. GEOBIA/GEOOIA Weaknesses (Due to Internal Drivers)
- ➢ Both GEOBIA and GEOOIA commercial software products listed in Table 1 do not comply with the QA4EO requirements (refer to Section 2). The relaxation of the system requirement of radiometric consistency of multi-source, multi-temporal and MS imagery brings with it, as an inevitable consequence, that these RS-IUS commercial software products are based on (inherently ill-posed) statistical rather than physical models, which means they are intrinsically semi-automatic and site-specific (refer to Section 4.2).
- ➢ The fourth conclusion of Section 5 is that, in a hybrid RS-IUS, semantic prior knowledge should be ignited starting at the pre-attentive vision first stage under several functional requirements derived from human vision. For this ignition to occur, a MAT-by-rules paradigm, also called knowledge engineering in AI and “fusion of horizons” in philosophical hermeneutics, must be adopted (refer to Section 4.1). Unfortunately, syntactic pattern recognition requires significant human interaction, but once a physical model-based rule set is tuned and proved to be transferable, the effort pays off (refer to Section 4.1). On the contrary, GEOBIA/GEOOIA systems do the following.
- ✓ The pre-attentive vision first stage is nearly always implemented as a sub-symbolic statistical model-based image segmentation algorithm (refer to Section 2).
- ✓ At the attentive vision second stage, symbolic syntactic inference may or may not be employed. If it is not, the GEEOBIA/GEOOIA system is fully statistical.
- ✓ An attempt to convey additional user knowledge into the GEOBIA framework is provided by the three-stage iterative GEOOIA architecture (see Section 7), but GEOOIA shares with GEOBIA the sub-symbolic statistical model-based pre-attentive vision first stage [6].
- ➢ The inherent ill-posedness of any sub-symbolic inductive image-object extraction/image-contour detection algorithm adopted at the GEOBIA/GEOOIA pre-attentive vision first stage is the driver of both systematic and accidental errors. The former are related to the so-called intrinsic insufficiency of image features (refer to Section 5), the latter are related to the fact that image-objects are always affected by a so-called artificial insufficiency due to the image segmentation algorithm at hand [25]. This second source of segmentation errors is also known as the uncertainty principle according to which, for any contextual (neighborhood) property, we cannot simultaneously measure that property while obtaining accurate localization [82,83]. In practical contexts the inherent ill-posedness of any knowledge-free image segmentation algorithm implies the following.
- ▪ In real-world applications (other than toy problems), it is inevitable for erroneous segments to be detected while genuine segments are omitted ([25]; p. 18).
- ▪ System free-parameters are required to work as additional assumptions necessary to make the inherently ill-posed image segmentation problem better posed for numerical treatment (refer to Section 4.2). Unfortunately, image segmentation parameters are always site-specific and must be user-defined based on heuristics and a trial-and-error approach. For example, in the case of the popular Baatz et al. segmentation algorithm adopted by the pre-attentive vision first stage of the Definiens GEOBIA/GEOOIA commercial software products [10], statistical methods have been developed to automatically optimize the parameters based on a site-specific training set of reference image-objects [9,85,93].
- ➢ Under the guise of ‘flexibility’, current GEOBIA/GEOOIA commercial software products provide at both the pre-attentive vision first stage and the attentive vision second stage overly complicated collections of algorithms to choose from based on heuristics (e.g., the Definiens Developer v8 process list comprises: 6× segmentation, 4× classification, 6× advanced classification, 4× variable operation, 9× reshaping, 3× level operation, etc.) [34,35]. In RS common practice commercial GEOBIA/GEOOIA software products appear affected by a combination of three limitations.
- ✓ Options to choose from mainly consist of statistical models for retrieving land surface variables, either sub-symbolic continuous variables or (symbolic and discrete) categorical variables, from RS imagery. Peculiar properties and limitations of inductive inference in RS data applications are well known in the existing literature, refer to Section 4.2.
- ✓ Lack of physical models, based on prior observations of the physical world-through-time, for retrieving land surface variables, either sub-symbolic continuous variables or (symbolic and discrete) categorical variables, from RS imagery [56]. This holds so true that none of the existing commercial GEOBIA/GEOOIA software products listed in Table 1 considers RS data radiometric calibration, namely, the transformation of DNs into physical units of radiometric measure, as a pre-processing step mandatory before investigating RS images acquired across space, time and sensors. In practice, none of the existing commercial GEOBIA/GEOOIA software products listed in Table 1 agrees with the QA4EO guidelines [2] (refer to Section 2).
- ✓ The RS-IUS free-parameter selection and the combination of pre-attentive vision first-stage segmentation and attentive vision second-stage classification algorithms are delegated to the full responsibility of the user whose scientific rationale and expertise may be extremely subjective, empirical and/or inadequate for such a complex task. This freedom of choice makes the definition and implementation of the GEOBIA and GEOOIA workflows more similar to (subjective, qualitative) art than (objective, quantitative) science.
- ➢ Image-segments can be described by a segment description table [26], whose columns consist of: (a) a segment sub-symbolic label or identifier, typically an integer number; (b) a segment symbolic label, if any, belonging to a 4-D spatio-temporal ontology; and (c) segment-specific quantitative descriptors (primitives) such as [25]: (i) locational properties (e.g., minimum enclosing rectangle); (ii) photometric properties (e.g., mean, standard deviation, etc.); (iii) geometric/shape properties (e.g., area, perimeter, compactness, straightness of boundaries, elongatedness, rectangularity, number of vertices, etc.); (iv) texture properties [94]; (v) morphological properties [95]; (vi) spatial non-topological relationships between objects (e.g., distance, angle/orientation, etc.); (vii) spatial topological relationships between objects (e.g., adjacency, inclusion); (viii) temporal relationships between objects, etc. In common practice image segmentation algorithms are demanding in terms of both computation time and memory occupation. For example, since the second-stage classifiers of both GEOBIA and GEOOIA (see Figures 2 and 4, respectively) employ sub-symbolic image-objects as information units exclusively, when pixel-based spectral properties are sufficient for classification purposes the image segmentation first stage of both GEOBIA and GEOOIA requires the transformation of each pixel into a one-pixel segment, which is trivial and time-consuming. It is noteworthy that, alternative to the GEOBIA/GEOOIA systems, RS-IUS instances found in the existing literature, such as the Shackelford and Davis RS-IUS implementations proposed in [27–29], provide examples of a combined pixel- and 2-D object-based classification approach where pixels and 2-D objects co-exist as spatial information primitives.
- ➢ In general, there are numerous challenges involved in the segmentation of very large data sets such as complex tiling and restricted memory availability, which require close monitoring of the number of image-objects in a project. Recent developments in hardware (e.g., availability of 64-bit central processing units, multiple processing, etc.) and software (e.g., the Definiens 64 bit-based Developer v8.64 software product [8]) may mitigate operational limitations of GEOBIA and GEOOIA systems in dealing with large data sets.
- ➢ As a result of the bullets listed above, to date there is a lack of consensus and research on the conceptual foundations of GEOBIA/GEOOIA [34,35], together with an unquestionable lack of productivity (refer to Section 2). For example, it is acknowledged in the literature that the rule base developed at the attentive vision second stage of a GEOBIA/GEOOIA scheme tends to be non-transferable to other applications [91].
8.3. GEOBIA/GEOOIA Opportunities (Due to External Drivers)
- ➢ There is a steadily growing community of RS and GIS practitioners who currently use image segmentation for different geographic information applications. Thus, as GEOBIA/GEOOIA matures, new commercial/research opportunities will come into existence to customize 2-D object-based solutions for specific fields, disciplines and user needs [34,35].
- ➢ Image segmentation is traditionally computation intensive and requires large memory occupation to deal with a segment description table [26], see Section 8.2. Hardware developments such as symmetric multiprocessing, parallel processing and grid computing, together with software developments (e.g., refer to the Definiens Developer v8.64 software product [8]), are recent technologies that GEOBIA/GEOOIA methods may benefit from in tackling the analysis of large data sets [34,35].
8.4. GEOBIA/GEOOIA Threats (Due to External Drivers)
- ➢ Since much remains to be solved, GEOBIA/GEOOIA is far from being an operationally established paradigm [34,35]. In particular, the inherent ill-posedness of image-region extraction/image-contour detection continues to be largely underestimated or, worse, ignored by a large portion of the RS community, see Section 5.
- ➢ Trying to make GEOBIA/GEOOIA distinct from other object-oriented concepts and methods (e.g., by using terms like ‘object-based’ instead of the traditional expression ‘object-oriented’) may contribute to insulation of GEOBIA/GEOOIA users in an esoteric world of 2-D ‘objects’ and isolation of the GEOBIA/GEOOIA paradigm rather than to its consolidation [34,35].
- ➢ The visual appeal of discrete geographic image-objects (geo-objects [65], geons [67]), their easy integration with GIScience and the enhanced classification possibilities of GEOBIA/GEOOIA systems with respect to traditional pixel-based classifiers have attracted the attention of major RS image processing vendors, who are increasingly incorporating new segmentation tools in their packages. This provides a wider choice for practitioners, but promotes confusion (among different packages, options, syntax, etc.) and makes it more difficult to reach a consensus on what GEOBIA/GEOOIA is all about. A lack of protocols, formats, and standards may lead to a splitting of the GEOBIA/GEOOIA field into sub-fields rather than a consolidation of GEOBIA/GEOOIA as a discipline [34,35].
9. Conclusions
- Vision is a symbolic inductive learning problem (from sub-symbolic true facts to symbolic generalizations). As such, to cope with its inherent ill-posedness due to the information gap and the intrinsic insufficiency of sub-symbolic image features (image-objects or, vice versa, image-contours), any vision system, either biological or artificial, requires symbolic prior knowledge in addition to sub-symbolic data to become better posed (conditioned). It means that any vision system must be a symbolic hybrid inference system, refer to Section 5.
- In the CV literature, according to Marr “vision goes symbolic almost immediately, right at the level of zero-crossing (pre-attentive primal sketch) ... without loss of information” [13] (p. 343). If this conjecture holds true in compliance with evidence provided by Vecera and Farah (image segmentation is an “interactive” (hybrid) inference process “in which top-down knowledge partly guides lower level processing”) [33] (p. 1294), then the symbolic hybrid human vision system comprises a symbolic hybrid pre-attentive vision sub-system subjected to the following constraints (refer to Section 5).
- Symbolic pre-attentive vision is general-purpose (application-independent), parallel and rapid (efficient). It generates as output a (symbolic) preliminary classification (pre-classification) map of the input image. Hence, the symbolic pre-attentive vision first stage accomplishes image feature extraction (image segmentation) and image pre-classification simultaneously.
- Symbolic pre-attentive labels belong to a discrete and finite set of semi-concepts whose degree of semantic information must be superior to zero and equal or inferior to that of concepts detected by the attentive vision second phase.
- The inverse mapping of the pre-classification map back to the input image domain generates a piecewise constant approximation of the input image equivalent to an edge-preserving smoothing filter where image details featuring high spatial-frequency components are well preserved.
- To be considered inspired to human vision, an artificial pre-attentive vision sub-system should comply with the aforementioned requirements (I) to (III), refer to Section 5.
- Despite their commercial success, state-of-the-art two-stage non-iterative Geographic Object-Based Image Analysis (GEOBIA) systems (refer to Section 6) and three-stage iterative Geographic Object-Oriented Image Analysis (GEOOIA) systems, where GEOOIA ⊃ GEOBIA (refer to Section 7), remain affected by a lack of productivity, general consensus and research, as pointed out in existing literature [6,34,35] (refer to Section 2). An original Strengths, Weaknesses, Opportunities and Threats (SWOT) analysis of the GEOBIA/GEOOIA systems highlights the following (see Section 8.2).
- ✓ Popular GEOBIA and GEOOIA commercial software products, like those listed in Table 1, do not comply with the QA4EO requirements (refer to Section 2). The relaxation of the requirement of radiometric consistency of multi-source, multi-temporal and multi-spectral (MS) imagery brings, as an inevitable consequence, that these RS-IUS commercial software products are based on (inherently ill-posed) statistical rather than physical models, which means they are intrinsically semi-automatic and site-specific (refer to Section 4.2).
- ✓ Both GEOBIA and GEOOIA are not biologically plausible, which is in contrast with their original goal of attempting to replicate human vision (refer to Section 6.1).
- ♦ In place of a symbolic pre-attentive vision first stage capable of accomplishing the aforementioned requirements (I) to (III) inspired to replicate human vision, both GEOBIA and GEOOIA adopt the same sub-symbolic statistical approach.
- ♦ At the attentive vision second stage, both GEOBIA and GEOOIA may or may not employ symbolic syntactic inference. If they do not, they are fully statistical systems.
- ✓ Any structural ill-posedness of GEOBIA, which is inherited by GEOOIA at the sub-symbolic pre-attentive vision first stage, is eventually mitigated at the GEOOIA second and third stages iteratively by additional ignitions of user supervision. This iterative process, where human supervision is expected to monotonically decrease with iterations, is equivalent to a well-known divide-and-conquer problem solving approach. In practice, it approximates a “focus of visual attention” mechanism adopted by the human attentive vision second phase (refer to Section 7).
- They encompass the four levels of understanding of a CV system or RS-IUS considered as an information processing system, namely: (a) computational theory (system architecture), (b) information/knowledge representation, (c) algorithm design and (d) implementation (refer to Section 1).
- They are complementary to conclusions proposed by a large portion of the existing literature where RS data mapping algorithms are tested in toy problems at small (e.g., local) spatial scale or coarse semantic granularity. Unfortunately, scalability of these latter approaches to real-world RS image understanding problems at a large (e.g., global) spatial scale and fine semantic granularity appears questionable or remains unknown (refer to Section 2).
Acronyms and Abbreviations
| AI: | Artificial Intelligence |
| ATCOR: | Atmospheric/Topographic Correction |
| Cal/Val: | Calibration and Validation |
| CEOS: | Committee on Earth Observation Satellites |
| CS: | Computer Science |
| CV: | Computer Vision |
| DN: | Digital Number |
| EO: | Earth Observation |
| ESA: | European Space Agency |
| GEO: | Group on Earth Observations |
| GEOBIA: | Geographic Object-Based Image Analysis |
| GEOOIA: | Geographic Object-Observation Image Analysis |
| GEOSS: | Global EO System of Systems |
| GIS: | Geographic Information System |
| GIScience: | Geographic Information Science |
| GMES: | Global Monitoring for the Environment and Security |
| IT: | Information Technology |
| LAI: | Leaf Area Index |
| LC: | Land Cover |
| LCC: | Land Cover Change |
| LCLUC: | Land Cover and Land Use Change program |
| MAI: | Machine Intelligence |
| MAL: | Machine Learning |
| MAT: | Machine Teaching |
| MS: | Multi-Spectral |
| NASA: | National Aeronautics and Space Administration |
| OO: | Object-Oriented |
| OQI: | Quality Index of Operativeness |
| QA: | Quality Assurance |
| QA4EO: | Quality Accuracy Framework for Earth Observation |
| QI: | Quality Index |
| RS: | Remote Sensing |
| RS-IUS: | Remote Sensing Image Understanding System |
| SR: | Spatial Resolution |
| SIAM™: | Satellite Image Automatic Mapper™ |
| SURF: | Surface Reflectance |
| SVM: | Support Vector Machine |
| SWOT: | Strengths, Weaknesses, Opportunities and Threats analysis |
| TM: | Trademark |
| TOA: | Top-Of-Atmosphere |
| TOARF: | TOA Reflectance |
| TOC: | Topographic Correction |
| USGS: | US Geological Survey |
| VHR: | Very High Resolution |
| WELD: | Web-Enabled Landsat Data set project |
| WGCV: | Working Group on Calibration and Validation |
Acknowledgments
References
- Gutman, G.; Janetos, A.C.; Justice, C.O.; Moran, E.F.; Mustard, J.F.; Rindfuss, R.R.; Skole, D.; Turner, B.L.; Cochrane, M.A. (Eds.) Land Change Science; Kluwer: Dordrecht, The Netherlands, 2004.
- GEO/CEOSS. A Quality Assurance Framework for Earth Observation: Operational Guidelines Version 3.0. Available online: http://calvalportal.ceos.org/cvp/c/document_library/get_file?p_l_id=17516&folderId=17835&name=DLFE-304.pdf (accessed on 10 January 2012).
- Shannon, C. A mathematical theory of communication. Bell Syst. Tech. J. 1948, 27. [Google Scholar]
- Capurro, R.; Hjørland, B. The concept of information. Annu. Rev. Inform. Sci 2003, 37, 343–411. [Google Scholar]
- Capurro, R. Hermeneutics and the Phenomenon of Information. In Metaphysics, Epistemology, and Technology. Research in Philosophy and Technology; JAI/Elsevier: Amsterdam, The Netherlands, 2000; Volume 19, pp. 79–85. [Google Scholar]
- Baatz, M.; Hoffmann, C.; Willhauck, G. Progressing from Object-Based to Object-Oriented Image Analysis. In Object-Based Image Analysis: Spatial Concepts for Knowledge-Driven Remote Sensing Applications; Blaschke, T., Lang, S., Hay, G.J., Eds.; Springer-Verlag: New York, NY, USA, 2008; Chapter 1.4; pp. 29–42. [Google Scholar]
- Definiens Imaging GmbH. eCognition Elements User Guide 4; Definiens Imaging GmbH: Munich, Germany, 2004. [Google Scholar]
- Definiens AG. Developer 8 Reference Book; Definiens AG: Munich, Germany, 2011. [Google Scholar]
- Esch, T.; Thiel, M.; Bock, M.; Roth, A.; Dech, S. Improvement of image segmentation accuracy based on multiscale optimization procedure. IEEE Geosci. Remote Sens. Lett 2008, 5, 463–467. [Google Scholar]
- Baatz, M.; Schäpe, A. Multiresolution Segmentation: An Optimization Approach for High Quality Multi-Scale Image Segmentation. In Angewandte Geographische Informationsverarbeitung XII; Strobl, J., Ed.; Herbert Wichmann Verlag: Berlin, Germany, 2000; Volume 58, pp. 12–23. [Google Scholar]
- Nuebert, M.; Herold, H.; Meinel, G. Assessing Image Segmentation Quality-Concepts, Methods and Apllication. In Object-Based Image Analysis: Spatial Concepts for Knowledge-Driven Remote Sensing Applications; Blaschke, T., Lang, S., Hay, G.J., Eds.; Springer-Verlag: New York, NY, USA, 2008; Chapter 8.3; pp. 769–784. [Google Scholar]
- Baraldi, A.; Boschetti, L. Operational automatic remote sensing image understanding systems: Beyond Geographic Object-Based and Object-Oriented Image Analysis (GEOBIA/GEOOIA). Part 2: Novel system architecture, information/knowledge representation, algorithm design and implementation. Remote Sens 2012. accepted.. [Google Scholar]
- Marr, D. Vision; Freeman and Company: New York, NY, USA, 1982. [Google Scholar]
- Sonka, M.; Hlavac, V.; Boyle, R. Image Processing, Analysis and Machine Vision; Chapman & Hall: London, UK, 1994. [Google Scholar]
- Baraldi, A.; Bruzzone, L.; Blonda, P. Quality assessment of classification and cluster maps without ground truth knowledge. IEEE Trans. Geosci. Remote Sens 2005, 43, 857–873. [Google Scholar]
- Baraldi, A. Impact of radiometric calibration and specifications of spaceborne optical imaging sensors on the development of operational automatic remote sensing image understanding systems. IEEE J. Sel. Top. Appl. Earth Obs. Remote Sens 2009, 2, 104–134. [Google Scholar]
- Baraldi, A.; Puzzolo, V.; Blonda, P.; Bruzzone, L.; Tarantino, C. Automatic spectral rule-based preliminary mapping of calibrated Landsat TM and ETM+ images. IEEE Trans. Geosci. Remote Sens 2006, 44, 2563–2586. [Google Scholar]
- Baraldi, A.; Durieux, L.; Simonetti, D.; Conchedda, G.; Holecz, F.; Blonda, P. Automatic spectral rule-based preliminary classification of radiometrically calibrated SPOT-4/-5/IRS, AVHRR/MSG, AATSR, IKONOS/QuickBird/OrbView/GeoEye and DMC/SPOT-1/-2 imagery–Part I: System design and implementation. IEEE Trans. Geosci. Remote Sens 2010, 48, 1299–1325. [Google Scholar]
- Baraldi, A.; Durieux, L.; Simonetti, D.; Conchedda, G.; Holecz, F.; Blonda, P. Automatic spectral rule-based preliminary classification of radiometrically calibrated SPOT-4/-5/IRS, AVHRR/MSG, AATSR, IKONOS/QuickBird/OrbView/GeoEye and DMC/SPOT-1/-2 imagery—Part II: Classification accuracy assessment. IEEE Trans. Geosci. Remote Sens 2010, 48, 1326–1354. [Google Scholar]
- Baraldi, A.; Gironda, M.; Simonetti, D. Operational two-stage stratified topographic correction of spaceborne multi-spectral imagery employing an automatic spectral rule-based decision-tree preliminary classifier. IEEE Trans. Geosci. Remote Sens 2010, 48, 112–146. [Google Scholar]
- Baraldi, A.; Wassenaar, T.; Kay, S. Operational performance of an automatic preliminary spectral rule-based decision-tree classifier of spaceborne very high resolution optical images. IEEE Trans. Geosci. Remote Sens 2010, 48, 3482–3502. [Google Scholar]
- Baraldi, A. Fuzzification of a crisp near-real-time operational automatic spectral-rule-based decision-tree preliminary classifier of multisource multispectral remotely sensed images. IEEE Trans. Geosci. Remote Sens 2011, 49, 2113–2134. [Google Scholar]
- Baraldi, A. Vision Goes Symbolic without Loss of Information within the Preattentive Vision Phase: The Need to Shift the Learning Paradigm from Machine-Learning (from Examples) to Machine-Teaching (by Rules) at the First Stage of a Three-Stage Hybrid Remote Sensing Image Understanding System–Part I and Part II. In Earth Observation; Rustamov, R., Salahova, S., Eds.; InTech Open Access Publisher: Rijeka, Croatia, 2012. [Google Scholar]
- Baraldi, A. Satellite Image Automatic Mapper™ (SIAM™)—A turnkey software button for automatic near-real-time multi-sensor multi-resolution spectral rule-based preliminary classification of spaceborne multi-spectral images. Recent Pat. Space Technol 2011, 1, 81–106. [Google Scholar]
- Matsuyama, T.; Hwang, S.-S.V. SIGMA: A Knowledge-based Aerial Image Understanding System; Plenum Press: New York, NY, USA, 1990. [Google Scholar]
- Nagao, M.; Matsuyama, T. A Structural Analysis of Complex Aerial Photographs; Plenum Press: New York, NY, USA, 1980. [Google Scholar]
- Shackelford, A.K.; Davis, C.H. A hierarchical fuzzy classification approach for high-resolution multispectral data over urban areas. IEEE Trans. Geosci. Remote Sens 2003, 41, 1920–1932. [Google Scholar]
- Shackelford, A.K.; Davis, C.H. A combined fuzzy pixel-based and object-based approach for classification of high-resolution multispectral data over urban areas. IEEE Trans. Geosci. Remote Sens 2003, 41, 2354–2363. [Google Scholar]
- Shackelford, A.K. Development of Urban Area Geospatial Information Products from High Resolution Satellite Imagery Using Advanced Image Analysis Techniques. Ph.D. Dissertation, University of Missouri, Colombia, MO, USA. 2004. [Google Scholar]
- Pakzad, K.; Bückner, J.; Growe, S. Knowledge based Moorland Interpretation Using a Hybrid System for Image Analysis. Proceedings of ISPRS WG III/ 2 & 3 Workshop “Automatic Objects from Digital Imagery”, Munich, Germany, 8–10 September 1999.
- Growe, S. Knowledge based interpretation of multisensor and multitemporal remote sensing images. Int. Arch. Photogramm. Remote Sens 1999, 32, 130–138. [Google Scholar]
- Cherkassky, V.; Mulier, F. Learning from Data: Concepts, Theory, and Methods; Wiley: New York, NY, USA, 1998. [Google Scholar]
- Vecera, S.P.; Farah, M.J. Is visual image segmentation a bottom-up or an interactive process? Percept. Psychophys 1997, 59, 1280–1296. [Google Scholar]
- Hay, G.J.; Castilla, G. Object-based Image Analysis: Strengths, Weaknesses, Opportunities and Threats (SWOT). Proceedings of 1st International Conference on Object-based Image Analysis (OBIA), Salzburg, Austria, 4–5 July 2006.
- Hay, G.J.; Castilla, G. Geographic Object-Based Image Analysis (GEOBIA): A New Name for a New Discipline. In Object-Based Image Analysis: Spatial Concepts for Knowledge-driven Remote Sensing Applications; Blaschke, T., Lang, S., Hay, G.J., Eds.; Springer-Verlag: New York, NY, USA, 2008; Chapter 1.4; pp. 81–92. [Google Scholar]
- Group on Earth Observations. GEO Announces Free and Unrestricted Access to Full Landsat Archive: Universal Availability of Cost-Free Satellite Data and Images will Revolutionize The Use of Earth Observations for Decision-Making. Available online: www.fabricadebani.ro/userfiles/GEO_press_release.doc (accessed on 9 September 2012).
- Sart, F.; Inglada, J.; Landry, R.; Pultz, T. Risk Management Using Remote Sensing Data: Moving from Scientific to Operational Applications. Proceedings of SBSR Workshop, Natal, Brazil, 23–27 April 2001.
- GEO. GEOSS Strategic Targets. Available online: http://www.earthobservations.org/documents/geo_vi/12_GEOSS%20Strategic%20Targets%20Rev1.pdf (accessed on 9 September 2012).
- GEO. The Global Earth Observation System of Systems (GEOSS) 10-Year Implementation Plan. Available online: http://www.earthobservations.org/documents/10-Year%20Implementation%20Plan.pdf (accessed on 9 September 2012).
- Sjahputera, O.; Davis, C.H.; Claywell, B.; Hudson, N.J.; Keller, J.M.; Vincent, M.G.; Li, Y.; Klaric, M.; Shyu, C.R. GeoCDX: An Automated Change Detection and Exploitation System for High Resolution Satellite Imagery. Proceedings of IEEE 2008 International Geoscience and Remote Sensing Symposium (IGARSS), Boston, MA, USA, 6–11 July 2008; pp. 467–470.
- ESA. About GMES—Overview. Available online: http://www.esa.int/esaLP/SEMRRI0DU8E_LPgmes_0.html (accessed on 9 September 2012).
- GMES. GMES Info. Available online: http://www.gmes.info (accessed on 10 January 2012).
- USGS. Web-Enabled Landsat Data (WELD) Project. Available online: http://landsat.usgs.gov/WELD.php (accessed on 9 September 2012).
- D’Elia, S. Personal communication. 2012.
- Schaepman-Strub, G.; Schaepman, M.E.; Painter, T.H.; Dangel, S.; Martonchik, J.V. Reflectance quantities in optical remote sensing-definitions and case studies. Remote Sens. Environ 2006, 103, 27–42. [Google Scholar]
- Herold, M.; Woodcock, C.; Di Gregorio, A.; Mayaux, P.; Belward, A.S.; Latham, J.; Schmullius, C. A joint initiative for harmonization and validation of land cover datasets. IEEE Trans. Geosci. Remote Sens 2006, 44, 1719–1727. [Google Scholar]
- De Lima, M.V.N.; Bielski, C.; Nowak, C. IMAGE2006: A Component of the GMES Precursor Fast Track Service on Land Monitoring. Proceedings of IEEE 2007 International Geoscience and Remote Sensing Symposium (IGARSS), Barcelona, Spain, 23–28 July 2007; pp. 2669–2672.
- Richter, R.; Schlapfer, D. Atmospheric/Topographic Correction for Satellite Imagery—ATCOR-2/3 User Guide, Version 8.0.2;; August 2011. Available online: http://www.rese.ch/pdf/atcor3_manual.pdf (accessed on 10 January 2012).
- Richter, R.; Schlapfer, D. Atmospheric/Topographic Correction for Airborne Imagery—ATCOR-4 User Guide, Version 6.2 BETA;; February 2012. Available online: http://www.dlr.de/eoc/Portaldata/60/Resources/dokumente/5_tech_mod/atcor4_manual_2012.pdf (accessed on 10 January 2012).
- Dorigo, W.; Richter, R.; Baret, F.; Bamler, R.; Wagner, W. Enhanced automated canopy characterization from hyperspectral data by a novel two step radiative transfer model inversion approach. Remote Sens 2009, 1, 1139–1170. [Google Scholar]
- Schlapfer, D.; Richter, R.; Hueni, A. Recent Developments in Operational Atmospheric and Radiometric Correction of Hyperspectral Imagery. Proceedings of 6th EARSeL SIG IS Workshop, Tel Aviv, Isreal, 16–18 March 2009; Available online: http://www.earsel6th.tau.ac.il/~earsel6/CD/PDF/earsel-OCEEDINGS/3054%20Schl%20pfer.pdf (accessed on 14 July 2012).
- McCafferty, J.D. Human and Machine Vision, Computing Perceptual Organization; Ellis Horwood Limited: Chichester, UK, 1990. [Google Scholar]
- Iqbal, Q.; Aggarwal, J.K. Image Retrieval via Isotropic and Anisotropic Mappings. Proceedings of IAPR Workshop on Pattern Recognition in Information Systems, Setubal, Portugal, 6–8 July 2001; pp. 34–49.
- Zamperoni, P. Plus ça va, moins ça va. Pattern Recogn. Lett 1996, 17, 671–677. [Google Scholar]
- Diamant, E. Machine Learning: When and Where the Horses Went Astray? In Machine Learning; Zhang, Y., Ed.; InTech Open Access Publisher: Rijeka, Croatia, 2010; pp. 1–18. [Google Scholar]
- Liang, S. Quantitative Remote Sensing of Land Surfaces; John Wiley & Sons: Hoboken, NJ, USA, 2004. [Google Scholar]
- Cootes, T.F.; Taylor, C.J. Statistical Models of Appearance for Computer Vision, Imaging Science and Biomedical Engineering; University of Manchester: Manchester, UK, 2004. [Google Scholar]
- Chavez, P.S. An improved dark-object subtraction technique for atmospheric scattering correction of multispectral data. Remote Sens. Environ 1988, 24, 459–479. [Google Scholar]
- Stehman, S.V.; Czaplewski, R.L. Design and analysis for thematic map accuracy assessment: Fundamental principles. Remote Sens. Environ 1998, 64, 331–344. [Google Scholar]
- Hunt, N.; Tyrrell, S. Stratified Sampling. Available online: http://www.coventry.ac.uk/ec/~nhunt/meths/strati.html (accessed on 10 January 2012).
- Mason, C.; Kandel, E.R. Central Visual Pathways. In Principles of Neural Science; Kandel, E., Schwartz, J., Eds.; Appleton and Lange: Norwalk, CT, USA, 1991; pp. 420–439. [Google Scholar]
- Gouras, P. Color Vision. In Principles of Neural Science Principles of Neural Science; Kandel, E., Schwartz, J., Eds.; Appleton and Lange: Norwalk, CT, USA, 1991; pp. 467–479. [Google Scholar]
- Kandel, E.R. Perception of Motion, Depth and Form. In Principles of Neural Science; Kandel, E., Schwartz, J., Eds.; Appleton and Lange: Norwalk, CT, USA, 1991; pp. 441–466. [Google Scholar]
- Wilson, H.R.; Bergen, J.R. A four mechanism model for threshold spatial vision. Vision Res 1979, 19, 19–32. [Google Scholar]
- Goodchild, M.F.; Yuan, M.; Cova, T.J. Towards a general theory of geographic representation in GIS. Int. J. Geogr. Inf. Sci 2007, 21, 239–260. [Google Scholar]
- Laurini, R.; Thompson, D. Fundamentals of Spatial Information Systems; Academic Press: London, UK, 1992. [Google Scholar]
- Lang, S. Object-based Image Analysis for Remote Sesning Applications: Modeling Reality-Dealing with Complexity. In Object-Based Image Analysis: Spatial Concepts for Knowledge-Driven Remote Sensing Applications; Blaschke, T., Lang, S., Hay, G.J., Eds.; Springer-Verlag: New York, NY, USA, 2008; Chapter 1.1; pp. 3–27. [Google Scholar]
- Lüscher, P.; Burghardt, D.; Weibel, R. Ontology-Driven Enrichment of Spatial Databases. Proceedings of 10th ICA Workshop on Generalisation and Multiple Representation, Moscow, Russia, 2–3 August 2007.
- Bertero, M.; Poggio, T.; Torre, V. Ill-posed problems in early vision. Proc. IEEE 1988, 76, 869–889. [Google Scholar]
- Hadamard, J. Sur les problemes aux derivees partielles et leur signification physique. Princet. Univ. Bull 1902, 13, 49–52. [Google Scholar]
- Bishop, C.M. Neural Networks for Pattern Recognition; Clarendon Press: Oxford, UK, 1995. [Google Scholar]
- GLCF. Global Forest Cover Change (GFCC) Project. Available online: http://landcover.org/research/portal/gfcc (accessed on 9 September 2012).
- Bruzzone, L.; Carlin, L. A multilevel context-based system for classification of very high spatial resolution images. IEEE Trans. Geosci. Remote Sens 2006, 44, 2587–2600. [Google Scholar]
- Bruzzone, L.; Persello, C. A novel context-sensitive semisupervised SVM classifier robust to mislabeled training samples. IEEE Trans. Geosci. Remote Sens 2009, 47, 2142–2154. [Google Scholar]
- Salford Systems. CART® Classification and Regression Trees. Available online: http://www.salford-systems.com/en/products/cart (accessed on 9 September 2012).
- RuleQuest Research Pty Ltd. Data Mining Tools See5 and C5.0. Available online: http://www.rulequest.com/see5-info.html (accessed on 9 September 2012).
- Hansen, M.C.; Roy, D.P.; Lindquist, E.; Adusei, B.; Justice, C.O.; Altstatt, A. A method for integrating MODIS and Landsat data for systematic monitoring of forest cover and change in the Congo Basin. Remote Sens. Environ 2008, 112, 2495–2513. [Google Scholar]
- Lindeberg, T. Detecting salient blob-like image structures and their scales with a scale-space primal sketch: A method for focus-of-attention. Int. J. Comput. Vis 1993, 11, 283–318. [Google Scholar]
- Carson, C.; Belongie, S.; Greenspan, H.; Malik, J. Region-Based Image Querying. Proceedings of IEEE Workshop on Content-Based Access of Image and Video Libraries, San Juan, Puerto Rico, 20 June 1997; pp. 42–49.
- Yang, J.; Wang, R.S. Classified road detection from satellite images based on perceptual organization. Int. J. Remote Sens 2007, 28, 4651–4669. [Google Scholar]
- Ruiz, L.A.; Recio, J.A.; Fernández-Sarría, A.; Hermosilla, T. A feature extraction software tool for agricultural object-based image analysis. Comput. Electron. Agric 2011, 76, 284–296. [Google Scholar]
- Corcoran, P.; Winstanley, A. Using Texture to Tackle the Problem of Scale in Landcover Classification. In Object-Based Image Analysis: Spatial Concepts for Knowledge-Driven Remote Sensing Applications; Blaschke, T., Lang, S., Hay, G.J., Eds.; Springer-Verlag: New York, NY, USA, 2008; pp. 113–132. [Google Scholar]
- Petrou, M.; Sevilla, P. Image Processing: Dealing with Texture; John Wiley & Sons: Chichester, UK, 2006. [Google Scholar]
- Burr, D.C.; Morrone, M.C. A Nonlinear Model of Feature Detection. In Nonlinear Vision: Determination of Neural Receptive Fields, Functions, and Networks; Pinter, R.B., Bahram, N., Eds.; CRC Press: Boca Raton, FL, USA, 1992; pp. 309–327. [Google Scholar]
- Computer Vision Lab. Segmentation Parameter Tuner (SPT). Available online: http://www.lvc.ele.puc-rio.br/wp/?p=904 (accessed on 3 July 2011).
- Castilla, G.; Hay, G.J.; Ruiz-Gallardo, J.R. Size-constrained region merging (SCRM): An automated delineation tool for assisted photointerpretation. Photogramm. Eng. Remote Sensing 2008, 74, 409–429. [Google Scholar]
- Page-Jones, M. The Practical Guide to Structured Systems Design; Prentice-Hall: Englewood Cliffs, NJ, USA, 1988. [Google Scholar]
- Pekkarinen, A.; Reithmaier, L.; Strobl, P. Pan-european forest/non-forest mapping with Landsat ETM+ and CORINE Land Cover 2000 data. ISPRS J. Photogramm 2009, 64, 171–183. [Google Scholar]
- Mather, P. Computer Processing of Remotely-Sensed Images—An Introduction; John Wiley & Sons: Chichester, UK, 1994. [Google Scholar]
- Tapsall, B.; Milenov, P.; Tasdemir, K. Analysis of RapidEye Imagery for Annual Land Cover Mapping as an Aid to European Union (EU) Common Agricultural Policy. Proceedings of ISPRS TC VII Symposium: 100 Years ISPRS, Vienna, Austria, 5–7 July 2010; XXXVIII, Part 7B. pp. 568–573.
- Lucas, R.; Medcalf, K.; Brown, A.; Bunting, P.; Breyer, J.; Clewley, D.; Keyworth, S.; Blackmore, P. Updating the Phase 1 habitat map of Wales, UK, using satellite sensor data. ISPRS J. Photogramm 2011, 66, 81–102. [Google Scholar]
- Crocetto, N.; Tarantino, E. A class-oriented strategy for features extraction from multidate ASTER imagery. Remote Sens 2009, 1, 1171–1189. [Google Scholar]
- Novack, T.; Esch, T.; Kux, H.; Stilla, U. Machine learning comparison between WorldView-2 and QuickBird-2-simulated imagery regarding object-based urban land cover classification. Remote Sens 2011, 3, 2263–2282. [Google Scholar]
- Baraldi, A.; Parmiggiani, F. Combined detection of intensity and chromatic contours in color images. Opt. Eng 1996, 35, 1413–1439. [Google Scholar]
- Pesaresi, M.; Benediktsson, J.A. A new approach for the morphological segmentation of high-resolution satellite imagery. IEEE Trans. Geosci. Remote Sens 2001, 39, 309–320. [Google Scholar]


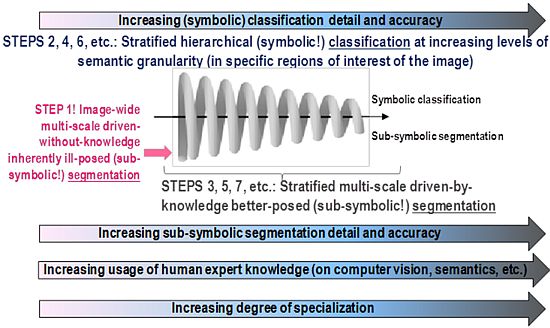
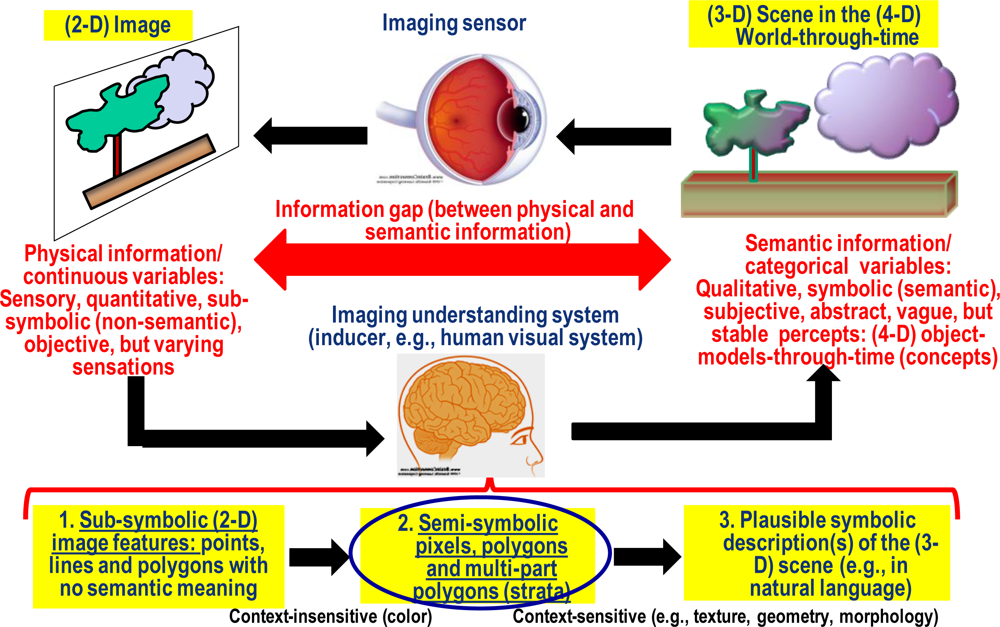
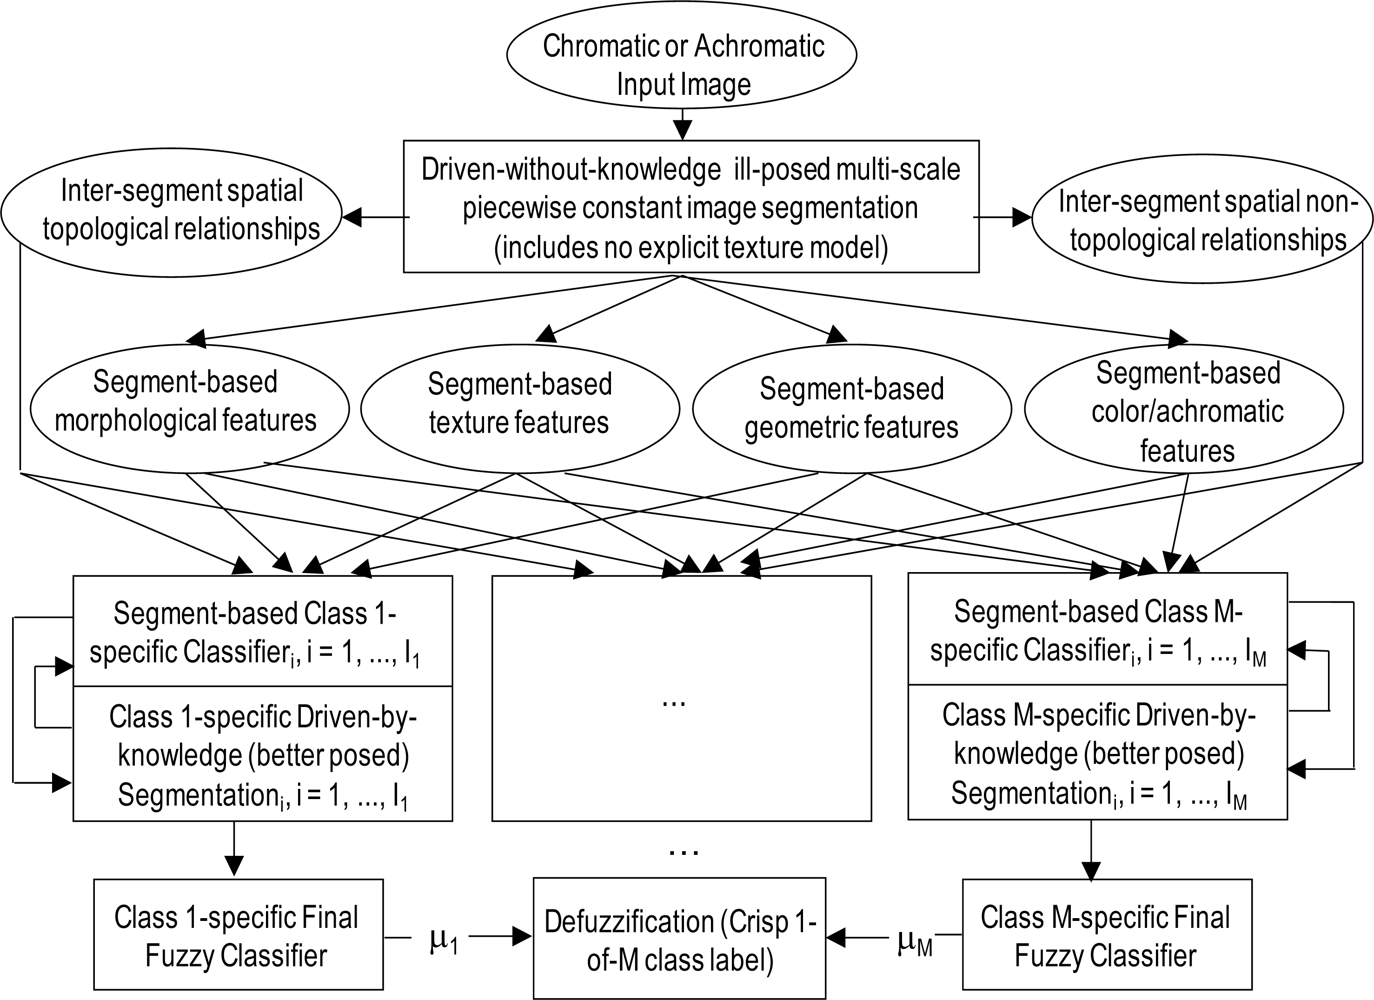
| Commercial RS-IUS Software Products | Sub-Symbolic (Asemantic) Versus Symbolic (Semantic) Information Primitives, Namely, Pixels/Polygons/Multi-Part Polygons (Strata), as Output of the Pre-Attentive Vision First Stage | Radiometric Calibration (RAD. CAL.) Requirement in Compliance with the International QA4EO Guidelines [2] |
|---|---|---|
| PCI Geomatics GeomaticaX | Sub-symbolic pixels | NO RAD. CAL. ⇒ statistical model-based: semi-automatic and site-specific |
| Definiens Developer | Unsupervised data learning sub-symbolic polygons | NO RAD. CAL. ⇒ statistical model-based:semi-automatic and site-specific |
| Pixel- and Segment-based versions of the Environment for Visualizing Images (ENVI) by ITT VIS | Either sub-symbolic pixels or unsupervised data learning sub-symbolic polygons | NO RAD. CAL. ⇒ statistical model-based: semi-automatic and site-specific |
| ERDAS IMAGING Objective | Supervised data learning symbolic polygons | NO RAD. CAL. ⇒ semi-automatic and site-specific |
| Atmospheric/Topographic Correction-2/3/4 (ATCOR-2/3/4) [48,49] | Sub-symbolic pixels or symbolic pixels (where the semantic label is a spectral type provided by the physical model-based spectral decision-tree classifier (SPECL)) | Consistent with the QA4EO recommendations: surface reflectance, SURF ⇒ inherently ill-posed atmospheric correction first stage ⇒ semi-automatic and site-specific. |
| Novel three-stage stratified hierarchical hybrid RS-IUS employing the Satellite Image Automatic Mapper (SIAM™) as its preliminary classification first stage | Physical model-based symbolic pixels ∈ symbolic polygons ∈ symbolic multi-part polygons | Consistent with the QA4EO recommendations: top-of-atmosphere (TOA) reflectance (TOARF) or surface reflectance (SURF) values, with TOARF ⊇ SURF ⇒ atmospheric correction is optional. Automatic and robust to changes in RS optical imagery acquired across time, space and sensors. |
| Helpful in Achieving the Objective | Harmful to Achieving the Objective | |
|---|---|---|
| Internal (attributes of the organisation) | Strengths | Weaknesses |
| External (attributes of the environment) | Opportunities | Threats |
Share and Cite
Baraldi, A.; Boschetti, L. Operational Automatic Remote Sensing Image Understanding Systems: Beyond Geographic Object-Based and Object-Oriented Image Analysis (GEOBIA/GEOOIA). Part 1: Introduction. Remote Sens. 2012, 4, 2694-2735. https://doi.org/10.3390/rs4092694
Baraldi A, Boschetti L. Operational Automatic Remote Sensing Image Understanding Systems: Beyond Geographic Object-Based and Object-Oriented Image Analysis (GEOBIA/GEOOIA). Part 1: Introduction. Remote Sensing. 2012; 4(9):2694-2735. https://doi.org/10.3390/rs4092694
Chicago/Turabian StyleBaraldi, Andrea, and Luigi Boschetti. 2012. "Operational Automatic Remote Sensing Image Understanding Systems: Beyond Geographic Object-Based and Object-Oriented Image Analysis (GEOBIA/GEOOIA). Part 1: Introduction" Remote Sensing 4, no. 9: 2694-2735. https://doi.org/10.3390/rs4092694