Operational Automatic Remote Sensing Image Understanding Systems: Beyond Geographic Object-Based and Object-Oriented Image Analysis (GEOBIA/GEOOIA). Part 2: Novel system Architecture, Information/Knowledge Representation, Algorithm Design and Implementation

Abstract
:
1. Introduction
- (Numerical, sensory) ‘data’ (observables, true facts).
- (Sub-symbolic, quantitative, unequivocal) ‘information-as-thing’ according to the Shannon theory of communication [13].
- (Symbolic, qualitative, equivocal) ‘information-as-(an intepretation)process’, i.e., information as interpreted data.
- ○ Terms sub-symbolic, sensory, numerical, non-semantic, quantitative, objective, unequivocal are considered synonyms.
- ○ Terms symbolic, semantic, cognitive, categorical, ordinal, nominal, qualitative, subjective, equivocal are considered synonyms.
- ○ Synonyms of (sub-symbolic or symbolic) deductive inference are: (sub-symbolic or symbolic) deductive learning, top-down inference, coarse-to-fine inference, driven-by-knowledge inference, learning-by-rules, physical model, prior knowledge-based decision system, rule-based system, expert system, syntactic inference, syntactic pattern recognition.
- ○ Synonyms of (sub-symbolic or symbolic) inductive inference are: (sub-symbolic or symbolic) inductive learning, bottom-up inference, fine-to-coarse inference, driven-without-knowledge (knowledge-free) inference, learning-from-examples, statistical model.
2. Problem Recognition and Opportunity Identification
- Popular GEOBIA and GEOOIA commercial software products, like those listed in Table 1 of [3], do not comply with the QA4EO requirements, where radiometric calibration of RS imagery is considered a pre-requisite to ensure the harmonization and interoperability of multi-source multi-temporal observational data and derived products. By definition, radiometric calibration is the transformation of dimensionless digital numbers (DNs) into a community-agreed physical unit of radiometric measure. The relaxation of the requirement of radiometric consistency of multi-source, multi-temporal and multi-spectral (MS) imagery brings, as an inevitable consequence, that these RS-IUS commercial software products are based on (inherently ill-posed) statistical rather than physical models. In the MAL and RS literature it is acknowledged that, due to their inherent ill-posedness, inductive inference systems: (i) are intrinsically semi-automatic and site-specific and (ii) require prior knowledge in addition to data to become better conditioned for numerical treatment (refer to Section 4.2 in [3]). In practice, to become better posed for numerical treatment, any statistical system requires ignition of deductive inference which makes the resulting inference system hybrid.
- In the CV literature, according to Marr “vision goes symbolic almost immediately, right at the level of zero-crossing (pre-attentive primal sketch) ... without loss of information” ([14]; p. 343). If this conjecture holds true, then the symbolic hybrid human vision system comprises a symbolic hybrid pre-attentive vision sub-system subjected to the following constraints (refer to Section 5 in [3]).
- Symbolic pre-attentive vision is general-purpose (application-independent), parallel and rapid (efficient). It generates as output a (symbolic) preliminary classification (pre-classification) map of the input image. Hence, the symbolic pre-attentive vision first stage accomplishes image feature extraction (image segmentation) and image pre-classification simultaneously.
- Symbolic pre-attentive semantic labels belong to a discrete and finite set of semi-concepts whose degree of semantic information must be superior to zero and equal or inferior to that of concepts detected by the attentive vision second phase.
- The inverse mapping of the pre-classification map back to the input image domain generates a piecewise constant approximation of the input image equivalent to an edge-preserving smoothing filter where image details featuring high spatial-frequency components are well preserved.
- ✓ in place of a symbolic pre-attentive vision first stage capable of accomplishing the aforementioned requirements (I) to (III), both GEOBIA and GEOOIA adopt the same sub-symbolic (inherently ill-posed) statistical approach.
- ✓ At the attentive vision second stage, both GEOBIA and GEOOIA may or may not employ symbolic syntactic inference. If they do not, they are fully statistical systems.
- the QA4EO guidelines (refer to Section 2 in [3]),
- the symbolic pre-attentive vision sub-system constraints (I) to (III) listed in this section above (refer to Section 5 in [3]),
- the requirements specification for an RS-IUS to be considered operational. In particular, all OQIs featured by an operational RS-IUS must score “high” (i.e., be superior to community-agreed reference standards) in real-world applications, including RS image classification at large (e.g., continental, global) spatial scale and fine semantic granularity (refer to Section 2 in [3]).
- The SPECL class grammars consist of one single spectral rule per spectral category (surface type) [37], while the SIAM™ class grammars consist of logical combinations of so-called spectral rules with spectral fuzzy sets [17], where: (i) a so-called spectral rule defines a buffer zone of spectral tolerance, irrespective of the absolute intensity of spectral bands, by means of relational operators (<, >, ≤, ≥) between spectral bands, (ii) spectral fuzzy sets (e.g., low, medium, high) are extracted from spectral variables, namely, spectral bands or spectral indexes, and (iii) one class grammar is a combination of logical operators (AND, OR, NOT) with one or more spectral buffer zones and spectral fuzzy sets.
- The hierarchical (sorted) list of class grammars detected by SPECL includes: (1) snow/ice, (2) cloud, (3) bright bare soil/sand/soil/cloud, (4) dark bare soil, (5) average vegetation, (6) bright vegetation, (7) dark vegetation, (8) yellow vegetation, (9) mix of vegetation/soil, (10) asphalt/dark sand, (11) sand/bare soil/cloud, (12) bright sand/soil/cloud, (13) dry vegetation/soil, (14) sparse vegetation/soil, (15) turbid water, (16) clear water, (17) clear water over sand, (18) shadow, (19) not classified. The list of class grammars (structural knowledge, refer to Section 4.1 in [3]) and their order of presentation (procedural knowledge, refer to Section 4.1 in [3]) is completely different from SPECL to SIAM™, e.g., refer to [17]. In terms of semantic granularity SPECL is quite coarser (simpler) than SIAM™. The latter generates as output three standard preliminary classification maps at fine, intermediate and coarse semantic granularities, where a symbolic parent-child relationship is enforced (refer to Section 5.4 below). Depending on the spectral resolution of the input image, SIAM™ detects up to 95 spectral categories at fine semantic granularity (see Table 1 below).
3. Proposed Hybrid RS-IUS Architecture Employing a Symbolic Deductive Context-Insensitive Pre-Attentive Vision First Stage
- A MS image enhancement phase (identified as Stage 0 (zero)), including: (a) a RS image radiometric calibration of DNs into top-of-atmosphere (TOA) reflectance (TOARF) or surface reflectance (SURF) values, where SURF is a special case of TOARF in very clear sky conditions, i.e., TOARF ⊇ SURF, considered mandatory in compliance with the QA4EO guidelines, and (b) an optional battery of stratified (driven-by-knowledge, symbolic mask-conditioned) image enhancement algorithms, e.g., stratified topographic correction [20],
- + (in series with)
- Symbolic, physical model-based, application-independent, context-insensitive (per-pixel) pre-attentive vision first stage (preliminary classification, identified as Stage 1), provided with a feedback loop to feed the pre-attentive vision Stage 1 (categorical) output back to the pre-processing Stage 0 input for stratified MS image enhancement,
- + (in series with)
- Attentive vision second phase (identified as stage 2) comprising a hierarchical battery of stratified application-, sensor- and class-specific, context-sensitive, statistical model-based and/or physical model-based algorithms for feature extraction and one-class classification.
- An RS image enhancement (pre-processing) block, identified as Stage 0 (zero) to account for its preliminary contribution to RS data classification, considered as the core of the proposed RS-IUS design. By definition, a data enhancement algorithm is input with numerical (sensory) data to generate as output numerical data of enhanced quality, e.g., geometric and/or radiometric quality. By definition, a data classification system is input with sub-symbolic numerical data, e.g., an RS image, to provide as output a semantic labeling of the input dataset, e.g., a classification (2-D) map. The proposed image enhancement Stage 0 consists of two parts, the first one compulsory and the second part optional as described below.
- A RS image radiometric calibration considered mandatory to accomplish the transformation of dimensionless DNs into a community-agreed physical unit of radiometric measure, in compliance with: (a) the QA4EO guidelines, where calibration and validation (Cal/Val) activities are considered critical to a GEO data quality assurance (QA) strategy and thus to data usability [2] (refer to Section 2 in [3]), (b) common knowledge in the RS community, where “the prerequisite for physically based, quantitative analysis of airborne and satellite sensor measurements in the optical domain is their calibration to spectral radiance” ([41], p. 29) and (c) the thesis that radiometric calibration is a necessary not sufficient condition for automatic interpretation of input EO imagery [15–23]. In particular, the radiometric calibration at Stage 0 is required to transform DNs into TOARF or SURF values, with TOARF ⊇ SURF, the latter being an ideal case of the former in very clear sky conditions [42]. The requirement for RS data to be calibrated into TOARF or SURF values means that solving the inherently difficult-to-solve (ill-posed) atmospheric correction problem is considered optional, rather than compulsory. It is noteworthy that, among popular RS-IUS commercial software products listed in Table 1 of [3], only the physical model-based ATCOR-2/3/4 (where the syntactic pixel-based SPECL preliminary classifier alternative to SIAM™ is implemented as a by-product, refer to Section 2) considers radiometric calibration mandatory [35,37]. It means that the other RS-IUS commercial software products, including popular GEOBIA/GEOOIA systems (refer to Section 2), are based on inherently ill-posed, semi-automatic and site-specific statistical models, refer to Section 4.2 in [3].
- A feedback loop feeds the symbolic deductive pre-attentive vision Stage 1 (categorical) output back to the pre-processing Stage 0 input for stratified (driven-by-knowledge, symbolic mask-conditioned) RS image enhancement. Thus, depending on the Stage 1 output, the hybrid (numerical and categorical) input of Stage 0 is adjusted so as to reach a system steady-state. This means that the proposed hybrid RS-IUS is a feedback system. The principle of stratification is popular in statistics (e.g., refer to the well-known stratified random sampling design [43]). Its advantage is that “stratification will always achieve greater precision provided that the strata have been chosen so that members of the same stratum are as similar as possible in respect of the characteristic of interest” [44]. In other words, (inherently ill-posed) statistical models become better posed (conditioned, constrained) by incorporating the “stratified” or “layered” approach, which is typical of decision-trees [45], to accomplish driven-by-knowledge regularization (simplification) of the solution space. In general, “to reduce the effect of multiple solutions, regularization is required, which involves the introduction of additional constraints or the introduction of some a priori information about the expected estimates of the statistical variables” [37]. In common practice the statistical principle of stratification is equivalent to the well-known divide-and-conquer (dividi et impera) problem-solving approach [45–47]. The same stratification principle is exploited at the second stage of the RS-IUS instantiations presented by Shackelford and Davis in RS literature [28–30], see Figure 1. The “stratified” approach is also employed in the GEOOIA scheme (see Figure 4 in [3]) at the attentive vision second phase, where driven-by-knowledge class-specific image-object-based classification and segmentation algorithms can be iterated. For example, in the Definiens GEOOIA commercial software products, the stratification principle is called “class filter”, such that image objects will be part of the search domain, called “image object domain”, if they are classified with one of the classes selected in the class filter [5–8]. On the contrary, any “layered” approach is absent from the traditional two-stage non-iterative GEOBIA design shown in Figure 2 in [3], which is the reason why it is outperformed by the GEOOIA scheme [4]. A possible disadvantage of stratification is that identification of appropriate strata may be difficult [44]. To recapitulate, in agreement with a well-known divide-and-conquer problem-solving approach, Stage 0 is eligible for combining as input sub-symbolic sensory (numerical) data with semantic information to accomplish any of the following driven-by-knowledge RS image enhancement tasks.
- ✓ Stratified RS image topographic correction (TOC). It is well known in existing literature that TOC is an ill-posed circular dilemma (chicken-and-egg problem): while image classification benefits from preliminary TOC, the latter requires a priori knowledge of surface roughness which is land cover class specific. To overcome the TOC inherent ill-posedness, “more research regarding the use of better stratification methods” was strongly encouraged [48,49] and accomplished in practice via SIAM™ [20].
- ✓ Stratified RS image co-registration between a geo-referenced master image and an input image, where a preliminary classification map is input to a stratified image feature extraction and a stratified image feature matching phase where semantic and iconic image features are combined according to a convergence-of-evidence approach [50].
- ✓ Stratified image mosaicking, e.g., refer to [19].
- A symbolic, syntactic, application-independent, per-pixel (non-contextual) pre-attentive vision first stage, identified as Stage 1 (refer to Section 5 in [3]) [14]. Since it is pixel-based, this preliminary classification (pre-classification) first stage investigates spectral information exclusively, i.e., chromatic and achromatic (brightness) information that is the sole non-contextual level of information in a (2-D) image (unlike, say, texture, shape, spatial relationships between image-objects, etc.). For example, if a pixel’s color value is red (i.e., if a pixel’s color value is [255, 0, 0] in a standard Red-Green-Blue color space), that color value depends not at all on the color values of neighboring pixels (although the way that pixel is perceived by a human observer may change with its context). To the best of these authors’ knowledge, in existing RS literature there are three examples of symbolic per-pixel pre-attentive vision first stage implementations, including one statistical and two syntactic models.
- In their original works Shackelford and Davis implemented the non-contextual preliminary classification first stage as a pixel-based, statistical, parametric, plug-in (non-adaptive to input data) maximum-likelihood (MXLKL) classifier [28–30]. Unfortunately, OQIs (refer to Section 2 in [3]) featured by an MXLKL classifier are well known to score low, in particular: (i) the MXLKL (Gaussian) parameters must be plugged-in (set) by a human operator based on class-specific (Gaussian) parameter estimation from a reference data distribution, thus timeliness together with costs can be high due to the collection of reference samples and (ii) MXLKL is typically affected by salt-and-pepper classification noise effects, which means its accuracy, robustness to changes in the input data set and scalability tend to be low (refer to Section 2 in [3]) [28–30].
- To improve the OQIs featured by a pre-attentive vision first-stage MXLKL classifier adopted by Shackelford and Davis, the syntactic, operational, automatic, near-real-time, multi-sensor, multi-resolution, application-independent, pixel-based SIAM™ preliminary classifier has been proposed at the symbolic pre-attentive vision first stage of an hybrid RS-IUS in recent years [15–23] (for more details about SIAM™, refer to Section 5 below).
- An attentive vision second stage battery of stratified, hierarchical, context-sensitive, application- and sensor-dependent modules for class-specific feature extraction and one-class classification, identified as stage 2. This attentive vision second-stage stratified classification: (i) provides a possible instantiation of a focus-of-visual-attention mechanism to mimic that adopted by attentive vision in mammals (refer to Section 5 in [3]), which increases the overall degree of biological plausibility of the proposed hybrid RS-IUS, and (ii) allows second-stage inductive data learning algorithms, if any, to be better posed (conditioned) by symbolic prior knowledge (namely, semantic strata) stemming from the preliminary classification first stage (refer to Section 4.2 in [3]). Context-dependent image information to be investigated at the attentive vision second stage on a stratified class-, sensor- and application-specific basis exclusively, encompasses:
- Both the two-stage non-iterative GEOBIA scheme (see Figure 2 in [3]) and the three-stage iterative GEOOIA design (see Figure 4 in [3]) adopt a sub-symbolic statistical model-based pre-attentive vision first stage (refer to Section 8.2 in [3] and Section 5.2 in this paper). Neither GEOBIA nor GEOOIA consider RS image radiometric calibration as compulsory, which disagrees with the QA4EO guidelines.
- Both the Shackelford and Davis RS-IUS design, shown in Figure 1, and the proposed hybrid RS-IUS architecture, instantiated in Figure 2, employ a symbolic pre-attentive vision first stage [14] (refer to Section 5 in [3]). Hence, these two RS-IUS schemes are both alternative to the GEOBIA and GEOOIA architectures. However, their symbolic pre-attentive vision first stage differs in terms of both algorithm design and implementation.
- ○ The Shackelford and Davis pre-attentive vision first stage consists of a symbolic statistical model. It is implemented as a plug-in, parametric, pixel-based MXLKL classifier [28–30], which requires no radiometric calibration pre-processing Stage 0, in disagreement with the QA4EO guidelines, and whose OQIs are well known to score low [46,53].
- ○ The proposed hybrid RS-IUS pre-attentive vision first stage consists of a symbolic syntactic model. It is implemented as an operational, automatic, near-real-time, per-pixel SIAM™ preliminary classifier, which requires a radiometric calibration pre-processing Stage 0 (see Figure 2), in compliance with the QA4EO guidelines, and whose OQIs are claimed to score high by existing literature [15–23], refer to Section 5 below.
4. Application Example of the Proposed Hybrid RS-IUS Implementation: Stratified Multi-Scale Texture Detection in the Preliminary Classification Map
- Selection from the first-stage SIAM™ preliminary classification map of a target (F/W or AC/HR) class-specific semantic stratum (binary mask, focus of visual attention, refer to Section 5 in [3]), capable of capturing (mapping) the colors of the target class-specific texture foregrounds and backgrounds. For example, the binary mask considered as a candidate area for the presence of classes (F/W or AC/HC) is selected as the logical-OR combination of the SIAM™ spectral categories ‘strong vegetation’ or ‘average vegetation’ or ‘dark vegetation’ or ‘shadow vegetation’, etc. (refer to Section 5.2 below).
- A stratified two-scale (7 m, 15 m in size) texture detector is run upon the SIAM™ preliminary classification map. A simple single-scale texture feature is estimated as the number of different spectral categories (NSC) whose occurrence is >0 in the local histogram collected from a semantic mask-conditioned moving window. Finally, a simple decision-tree separates low-texture AC/HR from high-texture F/W based on the multi-scale NSC values (e.g., if NSC_15m < 4 then AC/HC else if NSC_15m > 4 then F/W). The occurrence of specific spectral categories, e.g., ‘strong vegetation’, is checked in ambiguous texture cases (e.g., if NSC_15m == 4 AND ‘strong vegetation’ occurs in the local histogram then AC/HR). This simple attentive vision second-stage rule-set tested in 350 ground truth samples collected for each class F/W and AC/HR in ten VHR images collected across Europe provides omission and commission error between 4% and 6% in a computation time which is negligible.
5. Degrees of Novelty of the Proposed Hybrid RS-IUS Architecture and Operational Implementation Employing SIAM™ as Its Symbolic Deductive Context-Insensitive Pre-Attentive Vision First Stage
5.1. Computational Theory (System Architecture)
- RS-IUS requirements specification (A) and (C), OQI: ease of use. In compliance with the QA4EO guidelines, the proposed hybrid RS-IUS requires radiometric calibration of DNs into TOARF or SURF values, with TOARF ⊇ SURF. Hence, it considers the inherently ill-posed (difficult-to-solve) atmospheric correction an optional rather than compulsory pre-processing step (refer to Section 3), which increases its ease of use. Among the existing RS-IUS commercial software products listed in Table 1 of [3], the physical model-based ATCOR-2/3/4 is the sole to require the radiometric calibration of the input MS imagery (refer to Section 3).
- RS-IUS pre-attentive vision sub-system requirements specification (B)-(I) to (III). To develop a new generation of operational hybrid RS-IUSs whose pre-attentive and attentive vision stages are both symbolic and hybrid (refer to Section 2), a machine teaching (MAT)-by-rules paradigm, also called knowledge engineering in artificial intelligence (AI) and “fusion of horizons” in philosophical hermeneutics, must be adopted for the ignition of deductive inference capabilities. Unfortunately, syntactic pattern recognition requires significant human interaction, but once a physical model-based syntactic inference system is tuned and proved to be transferable, the effort pays off (refer to Section 4.1 in [3]).
- RS-IUS requirements specification (C), OQI: computation efficiency. A syntactic inference system driven from prior physical knowledge is static, i.e., it is one-pass (non-iterative, non-adaptive to input data). In addition, the proposed symbolic syntactic pre-attentive vision first stage is pixel-based. Hence, it is eligible for being computationally efficient, its computation complexity increasing linearly with the number of pixels, the number of MS bands and the cardinality of the class taxonomy adopted by the pre-classification map products.
- RS-IUS pre-attentive vision sub-system requirements specification (B)-(I), RS-IUS requirements specification (C), OQI: computation efficiency. It is well known that the generation of a segmentation map from a binary or multi-level image (e.g., a classification map) is a well-posed problem (in the Hadamard sense, i.e., it admits a solution and this solution is unique, refer to Section 4.2 in [3]) which can be solved efficiently by a two-pass connected-component image labeling algorithm ([10]; p. 197). Hence, a syntactic pixel-based preliminary classifier can accomplish image symbolic pre-classification and image sub-symbolic segmentation in sequence and efficiently.
- RS-IUS requirements specification (C), OQI: degree of automation. A syntactic image preliminary classifier is prior knowledge-based and non-adaptive to input data, thus it tends to have few system-free parameters to be user-defined, possibly none (like SIAM™ and SPECL, which are both “fully automatic”, refer to Section 5.4 below). Hence, its degree of automation (ease of use) tends to be high.
- RS-IUS requirements specification (C), OQIs: mapping accuracy; robustness to changes in the input data set. Since it is pixel-based, the proposed symbolic syntactic pre-attentive vision first stage is not affected by the uncertainty principle according to which, for any contextual (neighborhood) property, we cannot simultaneously measure that property while obtaining accurate localization [57,58], refer to Section 8.2 in [3]. On the other hand, traditional pixel-based statistical classifiers (e.g., MXLKL, support vector machines (SVMs), etc.) are typically affected by a salt-and-pepper classification noise effect [46,53]. This is not the case of existing per-pixel physical model-based preliminary classifiers, like SIAM™ (or SPECL), whose robustness to changes in the input data set is claimed to be high by existing literature [15–23] (this is possible because, to score high in accuracy and robustness, these preliminary classifiers score “low” in informative content of their output spectral categories, refer to Section 5.4 below).
- RS-IUS requirements specification (C), OQIs: degree of automation; mapping accuracy; computation efficiency; robustness to changes in the input data set. The proposed hybrid RS-IUS scheme (see Figure 2) adopts (inherently ill-posed) statistical models in the attentive vision second stage if and only if they incorporate the “stratified” or “layered” approach, typical of decision-trees [45], to become better posed for numerical treatment. A possible disadvantage of stratification is that identification of appropriate strata may be difficult [44] (refer to Section 3). This is not the case with existing per-pixel physical model-based preliminary classifiers, like SIAM™ (or SPECL), whose output spectral categories (symbolic strata, symbolic masks) are detected automatically (where automation does not come on the expenses of accuracy or robustness to changes in the input data set, but on the expenses of the informative content of the output spectral categories, refer to Section 5.4 below). To summarize, in RS common practice, exploitation of a pixel-based, symbolic, syntactic pre-attentive vision first stage allows the attentive vision second-stage classification to benefit from driven-by-knowledge regularization of the multiple solution space while avoiding the typical disadvantage of stratification (where identification of informative strata may be difficult).
- RS-IUS requirements specification (C), OQIs: mapping accuracy; robustness to changes in the input data set. In the proposed hybrid RS-IUS scheme (see Figure 2), a feedback loop feeds the symbolic deductive pre-attentive vision Stage 1 (categorical) output back to the pre-processing Stage 0 input for stratified RS image enhancement (e.g., stratified RS image TOC [20], etc., refer to Section 3).
- RS-IUS requirements specification (A). Availability of symbolic information right at the output of the pre-attentive vision first stage allows the introduction of OQIs suitable for parameterizing categorical variables (e.g., preliminary classification map accuracy in range [0, 1] ± δ1,) in addition to traditional OQIs suitable for parameterizing sub-symbolic variables (e.g., image sub-symbolic segmentation map accuracy in range [0, 1] ± δ2), in compliance with the international QA4EO guidelines [2] (refer to Section 2 in [3]). Examples of novel OQIs suitable for the parameterization of pre-attentive vision first-stage categorical variables can be found in [20] and [22].
- RS-IUS requirements specification (C), OQIs: ease of use; mapping accuracy; efficiency; robustness to changes in the input data set. The proposed symbolic pre-attentive vision first stage generates as output symbolic information primitives featuring three spatial types (according to the nomenclature proposed by the Open Geospatial Consortium, OGC [59]): symbolic pixels belong to symbolic polygons which belong to symbolic multi-part polygons, also called symbolic strata. In any symbolic map these three symbolic spatial types co-exist, i.e., they are not alternative. Thus, they can be made simultaneously available to the attentive vision second phase as viable inputs to choose from on a target LC class-specific basis (see Figure 2). For example, the Shackelford and Davis RS-IUS adopts as input to the attentive vision second stage a combination of symbolic pixels and symbolic polygons, depending on the target LC class [28–30] (see Figure 1), The following considerations hold.
- Humans are naturally familiar with symbolic reasoning. Availability of semantic information right at the output of the symbolic pre-attentive vision first stage makes the proposed hybrid RS-IUS more powerful (in terms of symbolic reasoning) and more intuitive to use than traditional two-stage non-iterative GEOBIA systems (see Section 6 in [3]) and three-stage iterative GEOOIA systems (see Section 7 in [3]) whose pre-attentive vision first stage is sub-symbolic.
- Generated as output by the symbolic pre-attentive vision first stage, symbolic pixels, symbolic polygons and symbolic multi-part polygons co-exist as viable inputs to the attentive vision second stage. This would end the ill-fated antagonism between unlabeled sub-symbolic pixels versus labeled sub-symbolic image-objects which are used as alternative inputs to different attentive vision second-stage implementations, namely, traditional pixel-based classifiers, either inductive (e.g., artificial neural network, SVM, MXLKL, adaptive decision-tree [45,46,53]) or deductive (symbolic syntactic rule set, expert system [45,46,53]), or GEOBIA/GEOOIA classifiers, either inductive or deductive [47,60–63], refer to Table 1 in [3].
5.2. Information/Knowledge Representation
- RS-IUS requirements specification (A). SIAM™ (like SPECL) is a physical model-based preliminary classifier that requires input sensory data be provided with a community-agreed physical radiometric unit of measure, namely, TOARF or SURF values, in compliance with the QA4EO guidelines, refer to Section 3.
- RS-IUS pre-attentive vision sub-system requirements specification (B)-(I) and (II). SIAM™ (like SPECL) is application domain-independent, i.e., it is a unifying preliminary classification first stage. This holds true because, as output, SIAM™ (like SPECL) provides (semi-)symbolic image-objects (namely, symbolic pixels in symbolic polygons in symbolic multi-part polygons, refer to Section 5.1) whose symbolic labels belong to a discrete and finite set of spectral-based semi-concepts, also called symbolic spectral categories, e.g., ‘vegetation’, ‘either water or shadow’, ‘either bare soil or built-up’, etc. The semantic content of spectral-based semi-concepts is superior to zero and not superior (i.e., equal or inferior) to that of target (4-D) LC classes-through-time (concepts, e.g., ‘deciduous forest’) to be detected by the attentive vision second stage (refer to Section 5 in [3]). Symbolic spectral categories are equivalent to semantic conjectures based exclusively on non-contextual spectral properties, either chromatic or achromatic (since color is the sole pixel-based, context-insensitive level of information in an image, refer to Section 3) [18]. Each spectral category is also equivalent to one LC class-set comprising either one or more LC classes [18,29]. In particular, a spectral category (e.g., ‘cloud’) is one-to-one related with a single LC class if this class is separable from the rest of the world in a hyper-dimensional spectral space. A spectral category (e.g., ‘either water or shadow’) is related to more than one LC class if these LC classes feature a statistically relevant spectral overlap in a hyper-dimensional spectral space. Thus, by definition [18], different spectral categories do not overlap in the SIAM™ measurement space consisting of spectral bands together with spectral indexes [15–23]. In other words, spectral categories must be mutually exclusive by definition. As a consequence, spectral categories are eligible for splitting into their component LC classes in a context-sensitive attentive vision second stage, where additional sources of contextual evidence (e.g., texture, morphology, per-object geometric properties, inter-object spatial relations, etc.) are taken into consideration, see Figure 2. For example, the spectral-based semi-concept ‘vegetation’ identifies an image candidate area (semantic mask, semantic stratum or focus of visual attention, refer to Section 5 in [3]) where image-objects belonging to a target LC class, say, ‘deciduous forest’, may be located, refer to Section 3. In SIAM™ there are six parent spectral categories (also called super-categories) or parent spectral-end-members. They are presented hereafter according to their order of detection (for comparison with the SPECL sorted set of class grammars, refer to Section 2):
- ‘clouds’,
- ‘either snow or ice’,
- ‘either water or shadow’,
- ‘vegetation’, equivalent to ‘either woody vegetation or cropland or grassland or (shrub and brush) rangeland’,
- ‘either bare soil or built-up’ and
- ‘outliers’ (for further comments about the presence of class ‘unknowns’ in compliance with the Congalton requirements of a classification scheme [65], refer to this text below).
- RS-IUS pre-attentive vision sub-system requirements specification (B)-(II). Since the semantic content of spectral-based semi-concepts is (refer to this section above) superior to zero and equal or inferior to the semantic content of concepts (4-D object-models-through-time [25], LC classes-through-time, e.g., ‘needle-leaf forest’) belonging to a (4-D) world model (refer to Section 5 in [3]), then spectral-based semi-concepts are eligible for filling in the well-known information gap between sub-symbolic (2-D) image features (image-objects or, vice versa, image-contours) and symbolic concepts in the (3-D) imaged-scene, refer to Section 5 in [3,14,18,25,33].
- Due to the presence of the class ‘outliers’ (refer to this section above), SIAM™ provides a mutually exclusive and totally exhaustive mapping of the input MS image into a discrete and finite set of spectral categories. This is in line with the Congalton requirements of a classification scheme [65]; although, the definition of a rejection rate is a well-known objective of any RS image classification system, e.g., refer to [66], in RS common practice image classifiers are often applied without any outlier detection strategy.
- Unlike the crisp SIAM™, the fuzzy SIAM™ is capable of modeling component cover classes of mixed pixels (class mixture) [22]. This means that the information/knowledge representation of the fuzzy SIAM™ is superior to that of its crisp counterpart.
5.3. Algorithm Design
- RS-IUS requirements specification (C), OQIs: mapping accuracy; robustness to changes in the input data set; scalability to cope with changes in input data specifications and user requirements. Due to its internal design and implementation strategies [17], the physical model-based SIAM™ preliminary classifier inherits advantages of traditional static (non-adaptive to input data) syntactic classifiers, developed by symbolic AI [67], while overcoming their well-known limitations, refer to Section 4.1 in [3]. In particular:
- ▪ SIAM™ is more intuitive to debug than statistical models, refer to Section 4.1 in [3].
- ▪ SIAM™ pursues convergence-of-evidence and information redundancy [25]. This design strategy makes SIAM™:
- ♦ scalable, to cope with changes in input data specifications and user requirements, refer to Section 5.4 below, and
- ♦ robust to changes in the input MS image acquired across time, space and sensors, e.g., SIAM™ is capable of mapping RS imagery acquired by all existing and future planned spaceborne optical imaging sensors provided with calibration metadata files, in agreement with the QA4EO guidelines and the visionary goal of a Global Earth Observation System of Systems (GEOSS) (refer to Section 1 in [3]) [68,69]. This achievement is made possible because SIAM™ is implemented as an integrated system of six sub-systems, refer to Table 1 and Section 5.4 below [17,18].
- RS-IUS requirements specification (C), OQI: scalability to cope with changes in input data specifications and user requirements. Unlike the crisp SIAM™ implementation, the fuzzy SIAM™ version adopts an internal horizontal (flat) modular structure independent of hierarchy, which means that the latter requires no procedural knowledge and, therefore, benefits of a maintainability/ scalability/ reusability superior to that of the former [22].
- RS-IUS requirements specification (C), OQIs: mapping accuracy; scalability to cope with changes in input data specifications and user requirements. In [17], to reduce the number of the physical model-based system free-parameters to be set by the human system developer based on his intuition, expertise and evidence from data observations, SIAM™ adopts crisp (hard), rather fuzzy (soft) membership functions to pursue an irregular, but complete grid partitioning of the measurement space (see Figures 2–6 in [17]). In [17], Table 3 provides the hard thresholds employed to generate the crisp SIAM™ membership functions. In [22], these crisp decision rules are fuzzified in line with the principles of fuzzy logic [71,72].
5.4. Implementation
- RS-IUS requirements specification (C), OQI: degree of automation. To run, SIAM™ requires neither user-defined parameters nor reference samples, hence it is termed “fully automatic” [73] (refer to Section 1). This definition implies that the SIAM™ degree of automation cannot be surpassed by any alternative approach. It is noteworthy that the proposed definition of automatic system is more restrictive than those commonly adopted in the RS literature where so-called automatic inductive data learning classifiers, e.g., artificial neural networks, do not satisfy either one or both of the two requirements listed above [73–76]. In general, it is assumed that automation can come on the expenses of accuracy, efficiency or robustness (refer to Section 2 in [3]). This is not the case of SIAM™, which is considered operational because all of its OQIs score high according to existing literature [15–23] (refer to Section 1). In the case of SIAM™ (and SPECL, refer to Section 2), automation comes on the expenses of the informative content of the output spectral categories, which is superior to zero, but equal or inferior to that of target LC classes to be detected by the attentive vision second stage (refer to Section 5 in [3]).
- RS-IUS requirements specification (C), OQI: scalability, to cope with changes in input data specifications and user requirements. To employ as input a radiometrically calibrated MS image acquired by almost any of the ongoing or future planned satellite optical missions, SIAM™ is implemented as an integrated system of systems, in line with the visionary goal of a GEOSS [68,69] (refer to Section 1 in [3]). In particular, SIAM™ comprises a “master” 7-band Landsat-like SIAM™ (L-SIAM™) together with five down-scaled (“slave”, derived) versions of L-SIAM™ whose input is a MS image featuring a spectral resolution that overlaps with, but is inferior to, Landsat’s. It is important to observe that the high-degree of scalability of L-SIAM™ is made possible by the high-degree of redundancy of its class grammars implemented in compliance with a convergence-of-evidence approach (refer to Section 5.3). To summarize, SIAM™ combines the following six sub-systems (refer to Table 1) [15–23].
- A “master” 7-band L-SIAM™ capable of detecting 95/47/18 mutually exclusive and totally exhaustive spectral categories at fine/ intermediate/ coarse semantic granularity (see Figure 6), where symbolic parent-child relationships can be leveraged to improve the RS image interpretation process (see Figure 7). The legend of the preliminary classification map generated by L-SIAM™ at fine semantic granularity and consisting of 95 spectral categories is shown in Table 2.
- A four-band Satellite Pour l’Observation de la Terre (SPOT)-like SIAM™ (S-SIAM™), which detects 68/40/15 mutually exclusive and totally exhaustive spectral categories at fine/intermediate/coarse semantic granularity (see Figure 8).
- A four-band National Oceanic and Atmospheric Administration (NOAA) Advanced Very High Resolution Radiometer (AVHRR)-like SIAM™ (AV-SIAM™), which detects 82/42/16 mutually exclusive and totally exhaustive spectral categories at fine/intermediate/coarse semantic granularity (see Figure 9).
- A five-band ENVISAT Advanced Along-Track Scanning Radiometer (AATSR)-like SIAM™ (AA-SIAM™), which detects 82/42/16 mutually exclusive and totally exhaustive spectral categories at fine/ intermediate/ coarse semantic granularity (see Figure 10).
- A four-band QuickBird-like SIAM™ (Q-SIAM™), which detects 52/28/12 mutually exclusive and totally exhaustive spectral categories at fine/intermediate/coarse semantic granularity (see Figure 11). The legend of the preliminary classification map generated by Q-SIAM™ at fine semantic granularity and consisting of 52 spectral categories is shown in Table 3. In Figure 12 a zoom of Figure 11 is shown together with two of the output products, such as a segment contour map and a binary semantic mask (e.g., a binary vegetation mask), automatically generated by SIAM™ from its preliminary classification maps.
- A three-band Disaster Monitoring Constellation (DMC)-like SIAM™ (D-SIAM™), which detects 52/28/12 mutually exclusive and totally exhaustive spectral categories at fine/intermediate/coarse semantic granularity (see Figure 13).
The output spectral categories detected by the six SIAM™ sub-systems at fine, intermediate and coarse semantic granularities, described in Table 1 are summarized in Table 4. It is noteworthy that since its 2006 release presented in [17], L-SIAM™ has increased its number of output spectral categories from 46 to 95 (see Table 4). This shows that, in line with theory [32,54], there is a slow “learning curve” in the development and fine-tuning of the SIAM™ physical model (refer to Section 4.1 in [3]). - RS-IUS requirements specification (C), OQIs: mapping accuracy; robustness to changes in the input data set. Unlike traditional pixel-based statistical classifiers (e.g., plug-in MXLKL, SVMs, etc.), which are typically affected by a salt-and-pepper classification noise effect [46,53], the pixel-based syntactic SIAM™ preliminary classifier is, according to existing literature, effective (accurate) and robust to changes in the input data set acquired across time, space and sensors at local, regional and continental spatial scale [15–23,77,78]. For example, in a test area of approximately 2,000 km2 located in central Italy, a vegetation/nonvegetation (V/NV) binary map generated by SIAM™ from a Landsat-7 ETM+ scene provided an overall accuracy of 98.2% ± 0.0% in comparison with a reference data set of 500 random samples validated with 1 m resolution orthophotos [17]. At the University of Maryland, the validation of the SIAM™ preliminary map generated from the 2006 Web-Enabled Landsat Data (WELD) project mosaic at the US scale [79] (e.g., see Figures 6 and 14(b)) has been recently accomplished in comparison with the reference National Land Cover Dataset (NLCD) 2006 provided by the US Environmental Protection Agency (EPA) [80], see Figure 14(d) [77,81]. An additional quantitative assessment of SIAM™ at regional scale can be found in [78]. Finally, a comparison between the syntactic SIAM™ and the ATCOR-2/3/4 SPECL preliminary classifier (refer to Section 2) is currently on-going based on a test data set consisting of both spaceborne and airborne images radiometrically calibrated into TOARF or SURF values [82].
- RS-IUS pre-attentive vision sub-system requirements specification (B)-(III), RS-IUS requirements specification (C), OQI: mapping accuracy. An intuitive proof of the SIAM™ mapping accuracy stems from the assessment of the SIAM™ capability of providing a lossy (almost lossless) compression of a sensory image onto a discrete and finite set of semi-concepts. This means that when an input image is reconstructed from the SIAM™ preliminary classification map, then the piecewise constant approximation of the input image must preserve small, but genuine image details (refer to Section 5 in [3]). For example, a piecewise constant approximation of the input MS image, called 2-D object-based mean image, is generated by replacing each symbolic polygon detected in the SIAM™ preliminary classification map with its mean radiometric value extracted from the input image. Results, shown in Figures 4 and 5, reveal that SIAM™ is a MS image preliminary classifier provided with an edge-preserving smoothing capability [18–20] (refer to Section 5 in [3]).
- RS-IUS requirements specification (C), OQI: efficiency, namely, computation time and memory occupation. In 2010, to increase its computational efficiency and decrease its dynamic and central memory requirements, the integrated SIAM™ system of systems was submitted to a source-to-source code transformation from the Interactive Data Language (IDL) to the C programming language. In September 2010, the University of Maryland, College Park, Maryland, filed the Invention Disclosure No. IS-2010-103 entitled: Satellite Image Automatic Mapper™ (SIAM™) (patent pending, © Andrea Baraldi and University of Maryland). In 2012, a parallel implementation of the SIAM™ code has been released. On a standard laptop computer provided with an Intel Core i7 processor @ 2.67 GHz the SIAM™ implementation in the C programming language requires less than three minutes to map a 7-band Landsat scene of approximately 8,000 × 7,000 pixels in size at the three standard levels of semantic granularity (fine, intermediate and coarse). The SIAM™ computational complexity increases linearly with the number of pixels, bands and output spectral categories. The parallel implementation of the SIAM™ reduces computation time by 15% to 40%, depending on the image size. The well-posed two-pass connected-component image labeling algorithm [10] takes approximately three more minutes to generate three sub-symbolic segmentation maps and contour maps from the three SIAM™ standard preliminary classification maps (at fine, intermediate and coarse semantic granularity, see Table 4. In comparison with the crisp SIAM™ implementation, the fuzzy SIAM™ is affected by a computation time increased by 30% in a single-process single-thread implementation [22]. This computation overload reduces to 15% in a single-process multi-thread implementation. Hence, both the crisp and the fuzzy SIAM™ implementations can be considered near-real-time. In fact, without considering stereo acquisitions in satellite sensors such as GeoEye-1 and WorldView-2, a time interval between two consecutive spaceborne image acquisitions may be as short as 15 min in a geostationary spaceborne platform such as the Meteosat Second Generation (MSG) [83].
- RS-IUS requirements specification (C), OQIs: all (refer to Section 2 in [3]). Table 5 shows that, based on existing literature [15–23], the OQIs (to be maximized) featured by the syntactic automatic SIAM™ preliminary classifier are superior to those of existing commercial RS-IUS software products that employ a sub-symbolic statistical model-based pre-attentive vision first stage, refer to Table 1 in [3]. This means that SIAM™ can be termed operational (refer to Section 2 in [3]).
- The operational automatic near real-time SIAM™ preliminary classifier is not useful exclusively for categorical variable estimation from MS imagery, but also for MS image pre-processing (enhancement), e.g., stratified topographic correction [20], stratified image mosaic enhancement [17], stratified image pair co-registration [50], etc. (refer to Section 5.1).
- A symbolic syntactic pre-attentive vision first stage, like SIAM™ (or SPECL), is preliminary to the exploitation of inherently ill-posed, semi-automatic and site-specific statistical models (refer to Section 4.2 in [3]), to be run exclusively at the attentive vision second stage on a stratified basis to become better posed for numerical treatment, refer to Section 3. This is tantamount to saying that the syntactic SIAM™ preliminary classifier is by no means alternative, but complementary in nature to any (inherently ill-posed) inductive data learning system, either symbolic or sub-symbolic (refer to Section 4.2 in [3]). For example, the automatic SIAM™ preliminary classifier is alternative to the Definiens semi-automatic multi-scale image segmentation algorithm proposed by Baatz et al. [5–9] if and only if the latter is employed as sub-symbolic pre-attentive vision first stage in a GEOBIA/GEOOIA approach. On the contrary, the stratified use of the Definiens image segmentation algorithm in series with the SIAM™ preliminary classifier is perfectly reasonable according to the hybrid RS-IUS architecture proposed in Figure 2. As another example of complementarity of the symbolic syntactic pre-attentive vision first stage with statistical models, consider the case of supervised data learning classifiers traditionally adopted in the attentive vision second stage (e.g., MXLKL, nearest neighbor, neural networks, SVMs, adaptive decision-trees, etc.) [6,33,34,53,54,67,84–90]. The output thematic maps of the former, consisting of spectral-based semi-concepts (e.g., ‘vegetation’), should never be compared with thematic maps of the latter, consisting of concepts (namely, LC classes-through-time, e.g., ‘deciduous forest’), unless the taxonomy of the former coincides as a special case with the taxonomy of the latter, since the relation concepts ⊇ semi-concepts always holds (refer to Section 5 in [3]).
- The symbolic, syntactic, pixel-based SIAM™ pre-attentive vision first stage generates as output, automatically and in near real-time, first, multi-granularity image pre-classification maps and, second, multi-scale image segmentation maps (refer to Section 1). The SIAM™ output products, namely, multi-granularity semi-symbolic and multi-scale sub-symbolic image-objects, are similar to those of a traditional two-stage non-iterative GEOBIA system, namely, multi-scale sub-symbolic and symbolic image-objects. Their difference is twofold: (i) they are generated in reverse order (in GEOBIA, sub-symbolic image-object detection comes before symbolic image-object labeling), (ii) the semantic level of information of semi-concepts is never superior to that of concepts because the relation concepts ⊇ semi-concepts always holds (refer to Section 5 in [3]) and (iii) semi-concepts are provided at multiple granularities while concepts belong to a target LC class taxonomy, which must be unique.
- It is worth mentioning that recent developments in the attentive vision second stage in series with the syntactic SIAM™ preliminary classification (refer to Section 3) encompass driven-by-knowledge, class-specific, multi-scale texture detection in the PAN image by means of a multi-scale, multi-orientation wavelet filter bank with mirror padding to remove boundary effects due to stratification [51]. For example, Figure 14(a) shows a 30 m resolution MS Landsat-7 ETM+ image tile of the 2006 WELD mosaic [79] where the PAN image local areas overlapping with the SIAM™ spectral category (symbolic stratum) ‘vegetation’, see Figure 14(b), are classified into several vegetated LC classes (e.g., “broad-leaf forest”, “needle-leaf forest”, “grassland”, “rangeland”, etc.) by the attentive vision second stage employing: (i) a stratified multi-scale texture feature extraction from the 30 m resolution PAN image generated from the MS Landsat image and (ii) a decision rule-set whose inputs comprise: (a) continuous variables, namely, the stratified multi-scale texture features and (b) categorical variables, namely, the child spectral categories forming the parent-category ‘vegetation’ in the SIAM™ preliminary classification map (also refer to Figure 7). For validation purposes, the attentive vision second stage LC map, shown in Figure 14(c), is compared with the NLCD 2006 reference map shown in Figure 14(d) [77,80].
6. New Inter-Disciplinary Research and Market Opportunities
- The proposed hybrid RS-IUS employing SIAM™ as its symbolic, deductive, pixel-based pre-attentive vision first stage (see Figure 2) should be integrated with a graphic user interface (GUI) into a complete desktop RS-IUS software product. It would consist of: (i) an automatic, unifying (e.g., application- and sensor-independent) and standardized (e.g., based on RS data calibrated into physical radiometric units of measure) SIAM™ pre-attentive vision first stage and (ii) an automatic, but incremental (e.g., user-, application-, class- and sensor-dependent) battery of attentive vision second-stage feature extractors and one-class classification modules. Based on an original combination of physical knowledge-based syntactic inference with stratified statistical data analysis capabilities, this novel hybrid RS-IUS software product would make spaceborne MS image understanding automatic, more intuitive to understand (since the RS-IUS is physical model-based and goes symbolic right at the output of the pre-attentive vision first stage, refer to Section 5 in [3]), accurate and robust to changes in the input data set. In line with the QA4EO guidelines [2], the new hybrid RS-IUS software product would contain metrological/statistically-based OQIs provided with a degree of uncertainty in measurement, in addition to a novel set of OQIs suitable for the accuracy assessment of preliminary classification maps, to achieve a seamless quantitative intercomparison with alternative pertinent results [15–23].
- Integration of internet-based satellite mapping on demand with virtual earth geo-browsers such as the hugely popular Google Earth, NASA’s World Wind and Microsoft Virtual Earth, see Figure 15.
- Automatic transformation of sub-symbolic raster RS imagery into symbolic vector geospatial information in a Geographic Information System (GIS)-ready format, see Figure 16. In other words, SIAM™ provides seamless integration of RS imagery with Geographic Information science (GIScience).
- Development of operational satellite-based information processing systems of systems, such as those envisaged under the ongoing international research programs GEOSS, Global Monitoring for the Environment and Security (GMES) [91], WELD [79] and Land Cover Land Use Change (LCLUC) [77] (refer to Section 1 in [3]).
- Development of semantic querying systems of large-scale multi-source RS image databases, where SIAM™ can be exploited as an automatic source of reference classification maps. This would represent a dramatic improvement over non-semantic query modes currently available in image database retrieval systems based on text-driven query strategies and query by either an image, object or multi-object example [92,93].
- Development of so-called fourth generation future intelligent earth observation satellites (FIEOSs, [94]) where the operational automatic near-real time RS-IUS software proposed herein can be mounted on board. The same consideration holds for ground receiving stations which could be provided with an operational automatic “intelligent” data processing chain.
- Dissemination of advanced EO expertise, science and technology in developing countries and emerging countries. EO researchers and institutions should perceive operational automatic EO image understanding technologies like SIAM™ as a novel technical opportunity to pursue ethical goals.
7. Conclusions and Summary
- they encompass the four levels of understanding of an RS-IUS considered as an information processing system, namely: (a) computational theory (system architecture), (b) information/knowledge representation, (c) algorithm design and (d) implementation (refer to Section 1 in [3]);
- they are complementary to conclusions proposed by a large portion of existing literature where RS data mapping solutions are tested in toy problems at small (e.g., local) spatial scale and/or coarse semantic granularity. Unfortunately, scalability of these latter approaches to real-world RS applications at large (e.g., global) spatial scale and fine semantic granularity appears questionable or remains unknown (refer to Section 1 in [3]).
- Popular GEOBIA and GEOOIA commercial software products, like those listed in Table 1 of [3], do not comply with the QA4EO requirements, where radiometric calibration of RS imagery is considered a pre-requisite (refer to Section 2 in [3]). As a consequence, these RS-IUS commercial software products are based on statistical rather than physical models. In the MAL and RS literature it is well known that, due to their inherent ill-posedness, inductive inference systems are intrinsically semi-automatic and site-specific and require prior knowledge in addition to sensory data to become better posed (conditioned) for numerical treatment (refer to Section 4.2 in [3]).
- Both GEOBIA and GEOOIA systems are not biologically plausible, which is in contrast with their original goal of attempting to replicate human vision (refer to Section 6.1 in [3]). A human vision system is a symbolic hybrid inference system where symbolic deductive inference is ignited in both the pre-attentive vision first stage (in compliance with a quote from Marr [14]) and the attentive vision second stage to deal with the well-know information gap and the intrinsic insufficiency of image features (refer to Section 5 in [3]). If vision goes symbolic at the pre-attentive vision first stage, then symbolic pre-attentive vision accomplishes image sub-symbolic segmentation (image feature extraction) and image symbolic pre-classification simultaneously (refer to Section 5 in [3]). On the contrary, both GEOBIA and GEOOIA systems:
- ✓ Employ the same sub-symbolic pre-attentive vision first stage implemented as a sub-symbolic (inherently ill-posed) statistical approach,
- ✓ May or may not employ symbolic syntactic inference at the attentive vision second stage. If they do not, they are fully statistical systems.
- the QA4EO guidelines (refer to Section 2 in [3]).
- The symbolic pre-attentive vision sub-system constraints driven from human vision (refer to Section 5 in [3]). In the CV literature, according to Marr “vision goes symbolic almost immediately, right at the level of zero-crossing (pre-attentive primal sketch) ... without loss of information” [14] (p. 343). If this conjecture holds true, then the symbolic hybrid (combined deductive and inductive) human vision system comprises a symbolic hybrid pre-attentive vision sub-system subjected to the following constraints (refer to Section 5 in [3]).
- Symbolic pre-attentive vision is general-purpose (application-independent), parallel and rapid (efficient). It generates as output a (symbolic) preliminary classification (pre-classification) map of the input image. Hence, the symbolic pre-attentive vision first stage accomplishes image feature extraction (image segmentation) and image pre-classification simultaneously.
- Symbolic pre-attentive semantic labels belong to a discrete and finite set of semi-concepts whose degree of semantic information must be superior to zero and equal or inferior to that of concepts detected by the attentive vision second phase.
- The inverse mapping of the pre-classification map back to the input image domain generates a piecewise constant approximation of the input image equivalent to an edge-preserving smoothing filter where image details featuring high spatial-frequency components are well preserved.
- The requirements specification for an RS-IUS to be considered operational. In particular, all Quality Indexes of Operativeness (OQIs) featured by an operational RS-IUS (e.g., degree of automation, accuracy, efficiency, robustness to changes in the input data set, robustness to changes in input parameters, scalability and timeliness) must score “high” (i.e., be superior to community-agreed reference standards) in real-world applications, including RS image classification at large (e.g., continental, global) spatial scale and fine semantic granularity (refer to Section 2 in [3]).
remotesensing-04-02768-s001.doc
Acronyms and Abbreviations
| AI: | Artificial Intelligence |
| ATCOR: | Atmospheric / Topographic Correction |
| B: | (visible) Blue |
| CEOS: | Committee on Earth Observation Satellites |
| CV: | Computer Vision |
| DN: | Digital Number |
| EO: | Earth Observation |
| FIEOS: | fourth-generation Future Intelligent Earth Observation Satellites |
| G: | (visible) Green |
| GEO: | Group on Earth Observations |
| GEOBIA: | Geographic Object-Based Image Analysis |
| GEOOIA: | Geographic Object-Observation Image Analysis |
| GEOSS: | Global EO System of Systems |
| GIS: | Geographic Information System |
| GIScience: | Geographic Information Science |
| GMES: | Global Monitoring for the Environment and Security |
| IR: | Infra-Red |
| LAI: | Leaf Area Index |
| LC: | Land Cover |
| LCLUC: | Land Cover and Land Use Change program |
| MAL: | Machine Learning |
| MAT: | Machine Teaching |
| MIR: | Medium-IR |
| MXLKL: | Maximum Likelihood |
| MS: | Multi-Spectral |
| NASA: | National Aeronautics and Space Administration |
| OO: | Object-Oriented |
| OQI: | Quality Index of Operativeness |
| QA: | Quality Assurance |
| QA4EO: | Quality Accuracy Framework for Earth Observation |
| QI: | Quality Index |
| R: | (Visible) Red |
| RS: | Remote Sensing |
| RS-IUS: | Remote Sensing Image Understanding System |
| SIAM™: | Satellite Image Automatic Mapper™ |
| SURF: | Surface Reflectance |
| SVM: | Support Vector Machine |
| SWOT: | Strengths, Weaknesses, Opportunities and Threats analysis |
| TIR: | Thermal IR |
| TM: | Trademark |
| TOA: | Top-Of-Atmosphere |
| TOARF: | TOA Reflectance |
| TOC: | Topographic Correction |
| USGS: | US Geological Survey |
| VHR: | Very High Resolution |
| WELD: | Web-Enabled Landsat Data set project |
| WGCV: | Working Group on Calibration and Validation |
Acknowledgments
References and Notes
- Gutman, G.; Janetos, A.C.; Justice, C.O.; Moran, E.F.; Mustard, J.F.; Rindfuss, R.R.; Skole, D.; Turner, B.L.; Cochrane, M.A. Land Change Science: Observing, Monitoring and Understanding Trajectories of Change on the Earth’s Surface (Remote Sensing and Digital Image Processing); Kluwer: Dordrecht, The Netherlands, 2004. [Google Scholar]
- GEO/CEOSS. A Quality Assurance Framework for Earth Observation, Version 3.0; July 2009. Available online: http://calvalportal.ceos.org/cvp/c/document_library/get_file?p_l_id=17516&folderId=17835&name=DLFE-304.pdf (accessed on 10 January 2012).
- Baraldi, A.; Boschetti, L. Operational automatic remote sensing image understanding systems: Beyond Geographic Object-Based and Object-Oriented Image Analysis (GEOBIA/GEOOIA). Part 1: Introduction. Remote Sens 2012, 4, 2694–2735. [Google Scholar]
- Baatz, M.; Hoffmann, C.; Willhauck, G. Progressing from Object-Based to Object-Oriented Image Analysis. In Object-Based Image Analysis: Spatial Concepts for Knowledge-Driven Remote Sensing Applications; Chapter 1.4; Blaschke, T., Lang, S., Hay, G.J., Eds.; Springer-Verlag: New York, NY, USA, 2008; pp. 29–42. [Google Scholar]
- Definiens Imaging GmbH, eCognition User Guide 4; Definiens Imaging GmbH: Munich, Germany, 2004.
- Definiens Imaging GmbH, Developer 8 Reference Book; Definiens Imaging GmbH: Munich, Germany, 2011.
- Esch, T.; Thiel, M.; Bock, M.; Roth, A.; Dech, S. Improvement of image segmentation accuracy based on multiscale optimization procedure. IEEE Geosci. Remote Sens. Lett 2008, 5, 463–467. [Google Scholar]
- Baatz, M.; Schäpe, A. Multiresolution segmentation: An optimization approach for high quality multi-scale image segmentation. ISPRS J. Photogramm 2000, 58, 12–23. [Google Scholar]
- Nuebert, M.; Herold, H.; Meinel, G. Assessing Image Segmentation Quality: Concepts, Methods and Application. In Object-Based Image Analysis: Spatial Concepts for Knowledge-Driven Remote Sensing Applications; Chapter 8.3; Blaschke, T., Lang, S., Hay, G.J., Eds.; Springer-Verlag: New York, NY, USA, 2008; pp. 769–784. [Google Scholar]
- Sonka, M.; Hlavac, V.; Boyle, R. Image Processing, Analysis and Machine Vision; Chapman & Hall: London, UK, 1994. [Google Scholar]
- Capurro, R.; Hjørland, B. The concept of information. Annu. Rev. Inform. Sci. Technol 2003, 37, 343–411. [Google Scholar]
- Capurro, R. Hermeneutics and the Phenomenon of Information. In Metaphysics, Epistemology, and Technology: Research in Philosophy and Technology; JAI/Elsevier: Amsterdam, The Netherlands, 2000; Volume 19, pp. 79–85. [Google Scholar]
- Shannon, C. A mathematical theory of communication. Bell Syst. Tech. J. 1948, 27. [Google Scholar]
- Marr, D. Vision; Freeman and C: New York, NY, USA, 1982. [Google Scholar]
- Baraldi, A. Vision Goes Symbolic without Loss of Information within the Preattentive Vision Phase: The Need to Shift the Learning Paradigm from Machine-Learning (from Examples) to Machine-Teaching (by Rules) at the First Stage of a Three-Stage Hybrid Remote Sensing Image Understanding System—Part I and Part II. In Earth Observation; InTech Open Access Publisher: Rijeka, Croatia, 2012; pp. 63–136. [Google Scholar]
- Baraldi, A. Impact of radiometric calibration and specifications of spaceborne optical imaging sensors on the development of operational automatic remote sensing image understanding systems. IEEE J. Sel. Top. Appl. Earth Obs. Remote Sens 2009, 2, 104–134. [Google Scholar]
- Baraldi, A.; Puzzolo, V.; Blonda, P.; Bruzzone, L.; Tarantino, C. Automatic spectral rule-based preliminary mapping of calibrated Landsat TM and ETM+ images. IEEE Trans. Geosci. Remote Sens 2006, 44, 2563–2586. [Google Scholar]
- Baraldi, A.; Durieux, L.; Simonetti, D.; Conchedda, G.; Holecz, F.; Blonda, P. Automatic spectral rule-based preliminary classification of radiometrically calibrated SPOT-4/-5/IRS, AVHRR/MSG, AATSR, IKONOS/QuickBird/OrbView/GeoEye and DMC/SPOT-1/-2 imagery—Part I: System design and implementation. IEEE Trans. Geosci. Remote Sens 2010, 48, 1299–1325. [Google Scholar]
- Baraldi, A.; Durieux, L.; Simonetti, D.; Conchedda, G.; Holecz, F.; Blonda, P. Automatic spectral rule-based preliminary classification of radiometrically calibrated SPOT-4/-5/IRS, AVHRR/MSG, AATSR, IKONOS/QuickBird/OrbView/GeoEye and DMC/SPOT-1/-2 imagery—Part II: Classification accuracy assessment. IEEE Trans. Geosci. Remote Sens 2010, 48, 1326–1354. [Google Scholar]
- Baraldi, A.; Gironda, M.; Simonetti, D. Operational two-stage stratified topographic correction of spaceborne multi-spectral imagery employing an automatic spectral rule-based decision-tree preliminary classifier. IEEE Trans. Geosci. Remote Sens 2010, 48, 112–146. [Google Scholar]
- Baraldi, A.; Wassenaar, T.; Kay, S. Operational performance of an automatic preliminary spectral rule-based decision-tree classifier of spaceborne very high resolution optical images. IEEE Trans. Geosci. Remote Sens 2010, 48, 3482–3502. [Google Scholar]
- Baraldi, A. Fuzzification of a crisp near-real-time operational automatic spectral-rule-based decision-tree preliminary classifier of multisource multispectral remotely sensed images. IEEE Trans. Geosci. Remote Sens 2011, 49, 2113–2134. [Google Scholar]
- Baraldi, A. Satellite Image Automatic Mapper™ (SIAM™)—A turnkey software button for automatic near-real-time multi-sensor multi-resolution spectral rule-based preliminary classification of spaceborne multi-spectral images. Recent Patents Space Tech 2011, 1, 81–106. [Google Scholar]
- Baraldi, A.; Bruzzone, L.; Blonda, P. Quality assessment of classification and cluster maps without ground truth knowledge. IEEE Trans. Geosci. Remote Sens 2005, 43, 857–873. [Google Scholar]
- Matsuyama, T.; Hwang, V.S. SIGMA: A Knowledge-Based Aerial Image Understanding System; Plenum Press: New York, NY, USA, 1990. [Google Scholar]
- Pakzad, K.; Bückner, J.; Growe, S. Knowledge Based Moorland Interpretation Using a Hybrid System for Image Analysis. Proceedings of ISPRS WG III/ 2 & 3 Workshop “Automatic Objects from Digital Imagery”, Munich, Germany, 8–10 September 1999; Available online: http://www.tnt.uni-hannover.de/papers/view.php?ind=1999&ord=Authors&mod=ASC (accessed on 10 January 2012).
- Growe, S. Knowledge based interpretation of multisensor and multitemporal remote sensing images. Int. Arch. Photogramm. Remote Sens 1999, 32, Part 7-4-3 W6. 130–138. [Google Scholar]
- Shackelford, A.K.; Davis, C.H. A hierarchical fuzzy classification approach for high-resolution multispectral data over urban areas. IEEE Trans. Geosci. Remote Sens 2003, 41, 1920–1932. [Google Scholar]
- Shackelford, A.K.; Davis, C.H. A combined fuzzy pixel-based and object-based approach for classification of high-resolution multispectral data over urban areas. IEEE Trans. Geosci. Remote Sens 2003, 41, 2354–2363. [Google Scholar]
- Shackelford, A.K. Development of Urban Area Geospatial Information Products from High Resolution Satellite Imagery Using Advanced Image Analysis Techniques. Ph.D. Dissertation, University of Missouri, Colombia, MO, USA. 2004. [Google Scholar]
- Nagao, M.; Matsuyama, T. A Structural Analysis of Complex Aerial Photographs; Plenum Press: New York, NY, USA, 1980. [Google Scholar]
- Lang, S. Object-Based Image Analysis for Remote Sensing Applications: Modeling Reality: Dealing with Complexity. In Object-Based Image Analysis: Spatial Concepts for Knowledge-Driven Remote Sensing Applications; Chapter 1.1; Blaschke, T., Lang, S., Hay, G.J., Eds.; Springer-Verlag: New York, NY, USA, 2008; pp. 3–27. [Google Scholar]
- Hay, G.J.; Castilla, G. Object-Based Image Analysis: Strengths, Weaknesses, Opportunities and Threats (SWOT). Proceedings of 1st International Conference on Object-Based Image Analysis (OBIA), Salzburg, Austria, 4–5 July 2006; Available online: www.commission4.isprs.org/obia06/Papers/01_Opening%20Session/OBIA2006_Hay_Castilla.pdf (accessed on 10 January 2012).
- Hay, G.J.; Castilla, G. Geographic Object-Based Image Analysis (GEOBIA): A New Name for a New Discipline. Object-Based Image Analysis: Spatial Concepts for Knowledge-Driven Remote Sensing Applications; Chapter 1.4. Blaschke, T., Lang, S., Hay, G.J., Eds.; Springer-Verlag: New York, NY, USA, 2008; pp. 81–92. [Google Scholar]
- Richter, R.; Schlapfer, D. Atmospheric/Topographic Correction for Satellite Imagery: ATCOR-2/3 User Guide, Version 8.0.2; ReSe: Wil, Switzerland, August 2011. Available online: http://www.rese.ch/pdf/atcor3_manual.pdf (accessed on 10 January 2012).
- Richter, R.; Schlapfer, D. Atmospheric/Topographic Correction for Airborne Imagery: ATCOR-4 User Guide, Version 6.2; BETA, ReSe: Wil, Switzerland, February 2012. Available online: http://www.dlr.de/eoc/Portaldata/60/Resources/dokumente/5_tech_mod/atcor4_manual_2012.pdf (accessed on 10 January 2012).
- Dorigo, W.; Richter, R.; Baret, F.; Bamler, R.; Wagner, W. Enhanced automated canopy characterization from hyperspectral data by a novel two step radiative transfer model inversion approach. Remote Sens 2009, 1, 1139–1170. [Google Scholar]
- Schlapfer, D.; Richter, R.; Hueni, A. Recent Developments in Operational Atmospheric and Radiometric Correction of Hyperspectral Imagery. Proceedings of 6th EARSeL SIG IS, Workshop, Tel Aviv, Israel, 16–19 March 2009; Available online: http://www.earsel6th.tau.ac.il/~earsel6/CD/PDF/earsel-PROCEEDINGS/3054%20Schl%20pfer.pdf (accessed on 14 July 2012).
- Kathryn, M.; Korenberg, M. On the use of separable Volterra networks to model discrete-time Volterra systems. IEEE Trans. Geosci. Remote Sens 2001, 12, 174–175. [Google Scholar]
- Page-Jones, M. The Practical Guide to Structured Systems Design; Prentice-Hall: Englewood Cliffs, NJ, USA, 1988. [Google Scholar]
- Schaepman-Strub, G.; Schaepman, M.E.; Painter, T.H.; Dangel, S.; Martonchik, J.V. Reflectance quantities in optical remote sensing—Definitions and case studies. Remote Sens. Environ 2006, 103, 27–42. [Google Scholar]
- Chavez, P.S. An improved dark-object subtraction technique for atmospheric scattering correction of multispectral data. Remote Sens. Environ 1988, 24, 459–479. [Google Scholar]
- Stehman, S.V.; Czaplewski, R.L. Design and analysis for thematic map accuracy assessment: Fundamental principles. Remote Sens. Environ 1998, 64, 331–344. [Google Scholar]
- Stratified Sampling. Available online: http://nestor.coventry.ac.uk/~nhunt/meths/strati.html (accessed on 11 September 2012).
- Mather, P. Computer Processing of Remotely-Sensed Images: An Introduction; John Wiley & Sons: Chichester, UK, 1994. [Google Scholar]
- Bishop, C.M. Neural Networks for Pattern Recognition; Clarendon Press: Oxford, UK, 1995. [Google Scholar]
- Crocetto, N.; Tarantino, E. A class-oriented strategy for features extraction from multidate ASTER imagery. Remote Sens 2009, 1, 1171–1189. [Google Scholar]
- Bishop, M.P.; Colby, J.D. Anisotropic reflectance correction of SPOT-3 HRV imagery. Int. J. Remote Sens 2002, 23, 2125–2131. [Google Scholar]
- Bishop, M.P.; Shroder, J.F.; Colby, J.D. Remote sensing and geomorphometry for studying relief production in high mountains. Geomorphology 2003, 55, 345–361. [Google Scholar]
- Netanyahu, N.; Le Moigne, J.; Masek, J.G. Georegistration of Landsat data via robust matching of multiresolution features. IEEE Trans. Geosci. Remote Sens 2004, 42, 1586–1600. [Google Scholar]
- Baraldi, A.; Parmiggiani, F. Combined detection of intensity and chromatic contours in color images. Opt. Eng 1996, 35, 1413–1439. [Google Scholar]
- Pesaresi, M.; Benediktsson, J.A. A new approach for the morphological segmentation of high-resolution satellite imagery. IEEE Trans. Geosci. Remote Sens 2001, 39, 309–320. [Google Scholar]
- Cherkassky, V.; Mulier, F. Learning from Data: Concepts, Theory, and Methods; Wiley: New York, NY, USA, 1998. [Google Scholar]
- Liang, S. Quantitative Remote Sensing of Land Surfaces; John Wiley and Sons: Hoboken, NJ, USA; p. 2004.
- Ruiz, L.A.; Recio, J.A.; Fernández-Sarría, A.; Hermosilla, T. A feature extraction software tool for agricultural object-based image analysis. Comput. Electron. Agr 2011, 76, 284–296. [Google Scholar]
- Trias-Sanz, R. Texture orientation and period estimator for discriminating between forests, orchards, vineyards, and tilled fields. IEEE Trans. Geosci. Remote Sens 2006, 44, 2755–2760. [Google Scholar]
- Corcoran, P.; Winstanley, A. Using Texture to Tackle the Problem of Scale in Landcover Classification. In Object-Based Image Analysis: Spatial Concepts for Knowledge-Driven Remote Sensing Applications; Blaschke, T., Lang, S., Hay, G.J., Eds.; Springer-Verlag: New York, NY, USA, 2008; pp. 113–132. [Google Scholar]
- Petrou, M.; Sevilla, P. Image Processing: Dealing with Texture; John Wiley & Sons: Chichester, UK, 2006. [Google Scholar]
- Goodchild, M.F.; Yuan, M.; Cova, T.J. Towards a general theory of geographic representation in GIS. Int. J. Geogr. Inf. Sci 2007, 21, 239–260. [Google Scholar]
- Conrad, C.; Fritsch, S.; Zeidler, J.; Rücker, G.; Dech, S. Per-field irrigated crop classification in arid Central Asia using SPOT and ASTER data. Remote Sens 2010, 2, 1035–1056. [Google Scholar]
- Gibbes, C.; Adhikari, S.; Rostant, L.; Southworth, J.; Qiu, Y. Application of object based classification and high resolution satellite imagery for savanna ecosystem analysis. Remote Sens 2010, 2, 2748–2772. [Google Scholar]
- Heumann, B.W. An object-based classification of mangroves using a hybrid decision tree—Support Vector Machine approach. Remote Sens 2011, 3, 2440–2460. [Google Scholar]
- Kamal, M.; Phinn, S. Hyperspectral data for mangrove species mapping: A comparison of pixel-based and object-based approach. Remote Sens 2011, 3, 2222–2242. [Google Scholar]
- Wang, F. Fuzzy supervised classification of remote sensing images. IEEE Trans. Geosci. Remote Sens 1990, 28, 194–201. [Google Scholar]
- Congalton, R.G.; Green, K. Assessing the Accuracy of Remotely Sensed Data; Lewis Publishers: Boca Raton, FL, USA; p. 1999.
- Swain, P.H.; Davis, S.M. Remote Sensing: The Quantitative Approach; McGraw Hill: New York, NY, USA, 1978. [Google Scholar]
- Cootes, T.F.; Taylor, C.J. Statistical Models of Appearance for Computer Vision; Imaging Science and Biomedical Engineering, University of Manchester, Manchester, UK; 2004; Available online: www.isbe.man.ac.uk/~bim/Models/app_model.ps.gz (accessed on 10 January 2012).
- GEO. GEO 2007–2009 Work Plan: Toward Convergence. 2008. Available online: http://earthobservations.org (accessed on 10 January 2012).
- GEO. The Global Earth Observation System of Systems (GEOSS) 10-Year Implementation Plan. 2005. Available online: http://www.earthobservations.org/docs/10-Year%20Implementation%20Plan.pdf (accessed on 10 January 2012).
- EU Landslide Early Warning Integrated Project: LEWIS-EVG1-CT-2001-00055. In Deliverable N. 20, Last Version; Report on Software Package for Warning Map Production; 28 June 2005.
- Zadeh, L.A. Fuzzy sets. Inform. Control 1965, 8, 338–353. [Google Scholar]
- Kosko, B. Fuzzy Thinking; Flamingo: London, UK, 1994. [Google Scholar]
- Yuan, H.; Van Der Wiele, C.F.; Khorram, S. An automated artificial neural network system for land use/land cover classification from Landsat TM imagery. Remote Sens 2009, 1, 243–265. [Google Scholar]
- Elmahboub, W.; Scarpace, F.; Smith, B. A highly accurate classification of TM data through correction of atmospheric effects. Remote Sens 2009, 1, 278–299. [Google Scholar]
- Potter, J.F. Haze and sun effects on automatic classification of satellite data—Simulation and correction in scanners and imagery systems for Earth observation. Proc. SPIE 1974, 51, 73–83. [Google Scholar]
- Shorter, N.; Kasparis, T. Automatic vegetation identification and building detection from a single nadir aerial image. Remote Sens 2009, 1, 731–757. [Google Scholar]
- Baraldi, A.; Boschetti, L. Fine Resolution Automated Mapping. Proceedings of Land Cover and Land Use Change (LCLUC) Science Team Meeting, Alexandria, VA, USA, 6 October 2011.
- Kleyn, L.; Mangara, P.; Remas, H. Implementation of Automatic Spectral Rule-Based Preliminary Mapping for Enhanced Object-Based Classification of South African Land Cover Classes. Proceedings of AfricaGEO Conference, Cape Town, South Africa, 31 May–2 June 2011. Paper ID 57.
- Web-Enabled Landsat data (WELD) Project. Available online: http://landsat.usgs.gov/WELD.php (accessed on 11 September 2012).
- National Land Cover Data (NLCD 2006). 2006. Available online: http://www.epa.gov/mrlc/nlcd-2006.html (accessed on 11 September 2012).
- Boschetti, L.; Baraldi, A.; Roy, D.; Justice, C. Validation of the preliminary classification map generated by the Satellite Image Automatic Mapper™ (SIAM™) from the Web-Enabled Landsat Data set (WELD) at the US scale. In Remote Sens. Environ; 2012; in preparation. [Google Scholar]
- Humber, M.L.; Baraldi, A.; Boschetti, L.; Schlaepfer, D. Quantitative comparison of the syntactic Satellite Image Automatic Mapper™ (SIAM™) and Spectral Classification (SPECL) software products. In Remote Sens; 2012; in preparation. [Google Scholar]
- Meteosat Second Generation. Available online: http://www.eumetsat.int/Home/Main/Satellites/MeteosatSecondGeneration/index.htm (accessed on 11 September 2012).
- Navulur, K. Multispectral Image Analysis Using the Object-Oriented Paradigm; CRC Press: Boca Raton, FL, USA, 2007. [Google Scholar]
- Pao, Y. Adaptive Pattern Recognition and Neural Networks; Addison-Wesley: Reading, MA, USA; p. 1989.
- Jain, A.; Healey, G. A multiscale representation including opponent color features for texture recognition. IEEE Trans. Image Process 1998, 7, 124–128. [Google Scholar]
- Jain, A.; Farrokhnia, F. Unsupervised texture segmentation using Gabor filters. Pattern Recog 1991, 24, 1167–1186. [Google Scholar]
- Bandos, T.V.; Bruzzone, L.; Camps-Valls, G. Classification of hyperspectral images with regularized linear discriminant analysis. IEEE Trans. Geosci. Remote Sens 2009, 47, 862–873. [Google Scholar]
- Huang, C.; Song, K.; Kim, S.; Townshend, J.R.G.; Davis, P.; Masek, J.G.; Goward, S.N. Use of a dark object concept and support vector machines to automate forest cover change analysis. Remote Sens. Environ 2008, 112, 970–985. [Google Scholar]
- Hansen, M.C.; Roy, D.P.; Lindquist, E.; Adusei, B.; Justice, C.O.; Altstatt, A. A method for integrating MODIS and Landsat data for systematic monitoring of forest cover and change in the Congo Basin. Remote Sens. Environ 2008, 112, 2495–2513. [Google Scholar]
- GMES. Available online: http://www.gmes.info (accessed on 10 January 2012).
- Shyu, C.-R.; Klaric, M.; Scott, G.J.; Barb, A.S.; Davis, C.H.; Palaniappan, K. GeoIRIS: Geospatial Information Retrieval and Indexing System—Content mining, semantics modeling, and complex queries. IEEE Trans. Geosci. Remote Sens 2007, 45, 839–852. [Google Scholar]
- Mantovani, S.; Natali, S.; Baraldi, A. Soil Mapper® Multi-Sensor and Multi-Temporal Applications for Semantic-Based Image Information Mining. In Geoscience Visual Analytics, NATO Science for Peace and Security Series C: Environmental Security; Springer: Dordrecht, The Netherlands, 2009; Part 3; pp. 167–176. [Google Scholar]
- Zhou, G.; Kafatos, M. Future Intelligent Earth Observing Satellites (FIEOS). Proceedings of ISPRS Comission I Mid-Term Symposium in Conjunction with Pecora 15/Land Satellite Information IV Conference, Denver, CO, USA, 10–15 November 2002; Available online: http://www.isprs.org/commission1/proceedings02/paper/00031.pdf (accessed on 10 January 2012).


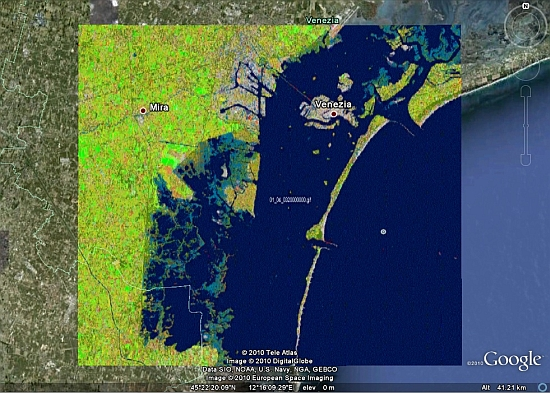
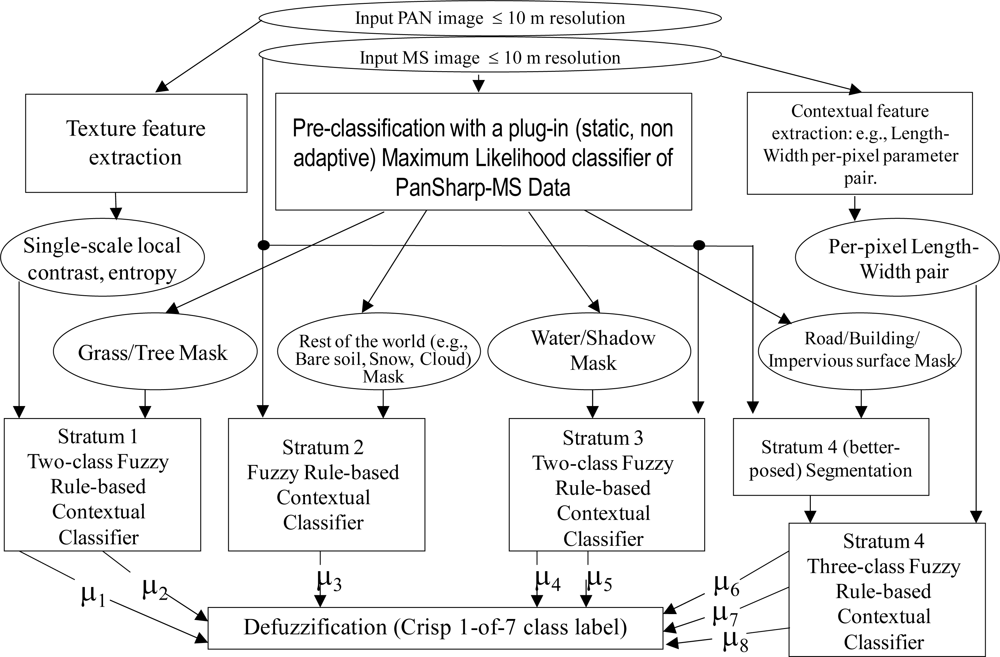
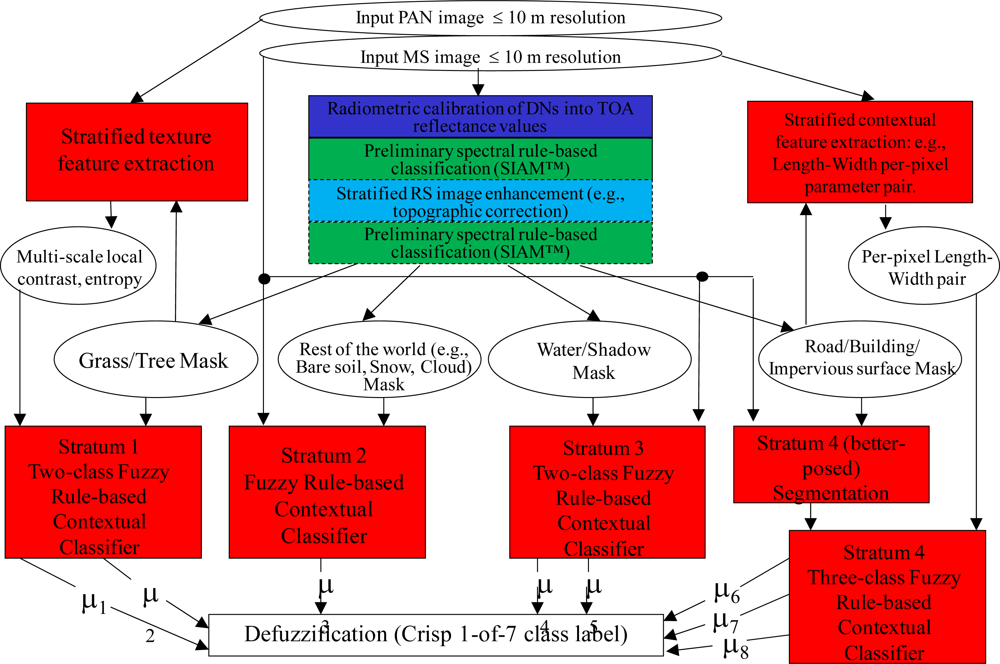
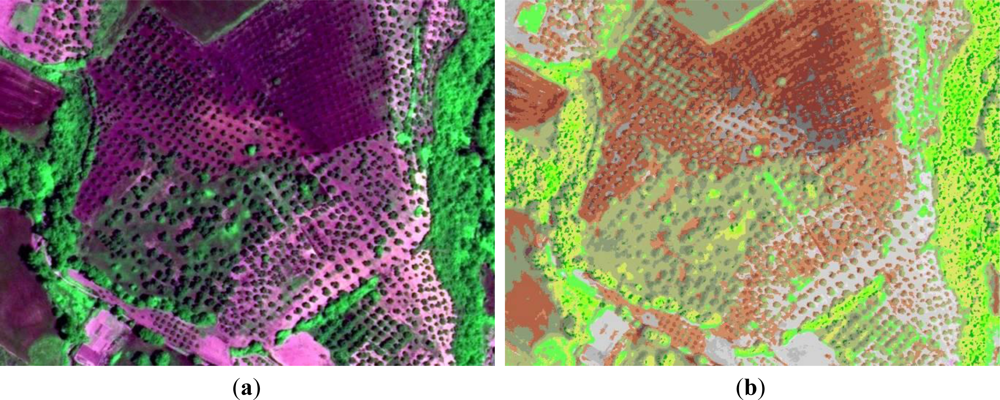
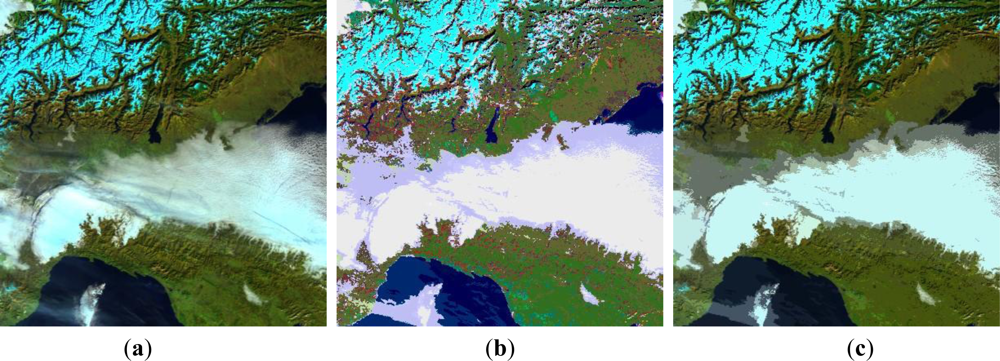
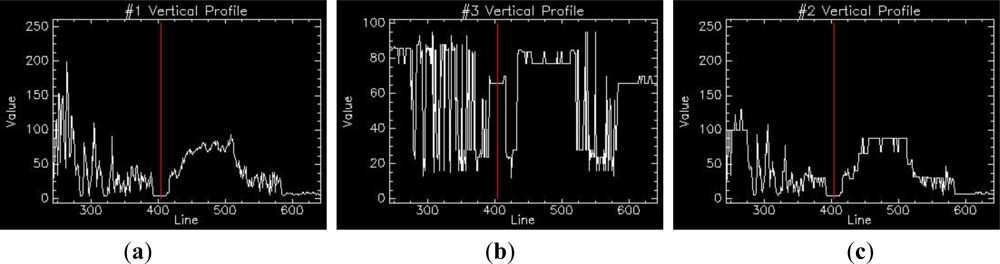
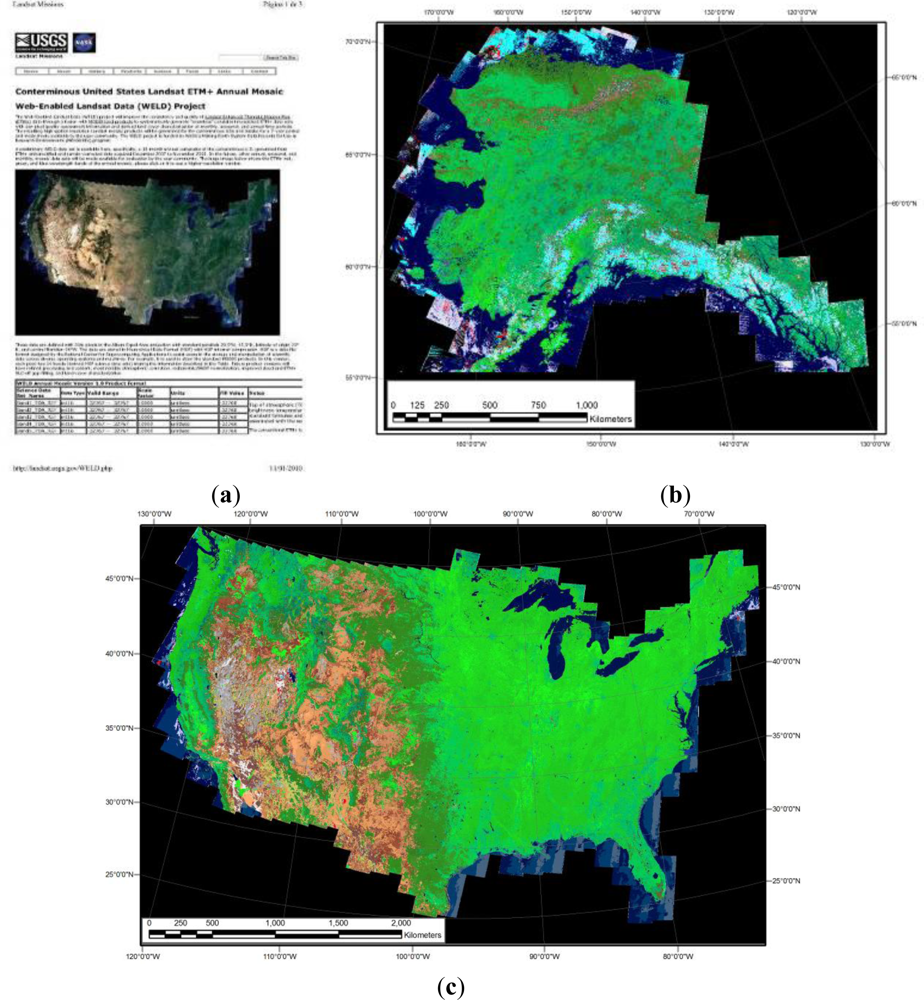
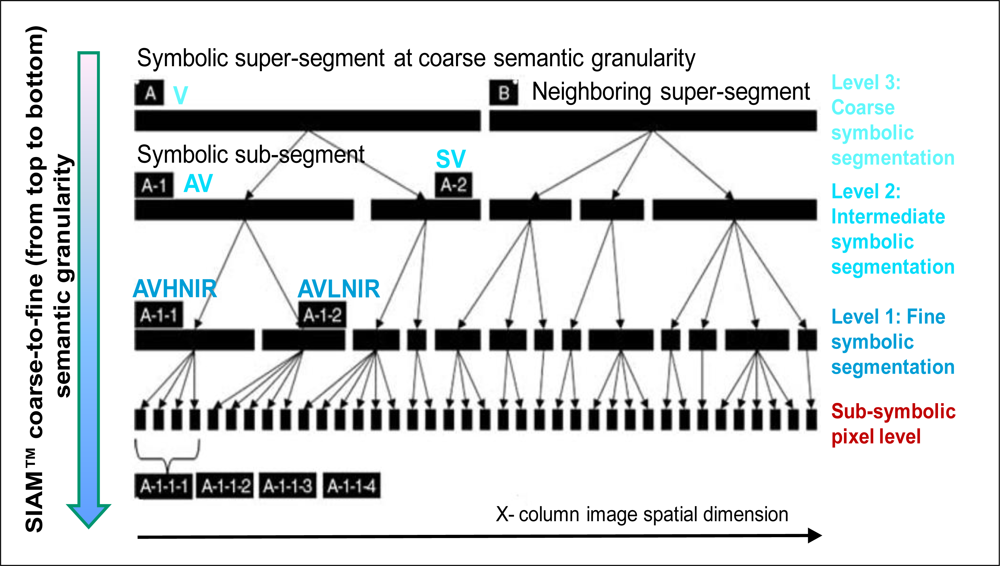
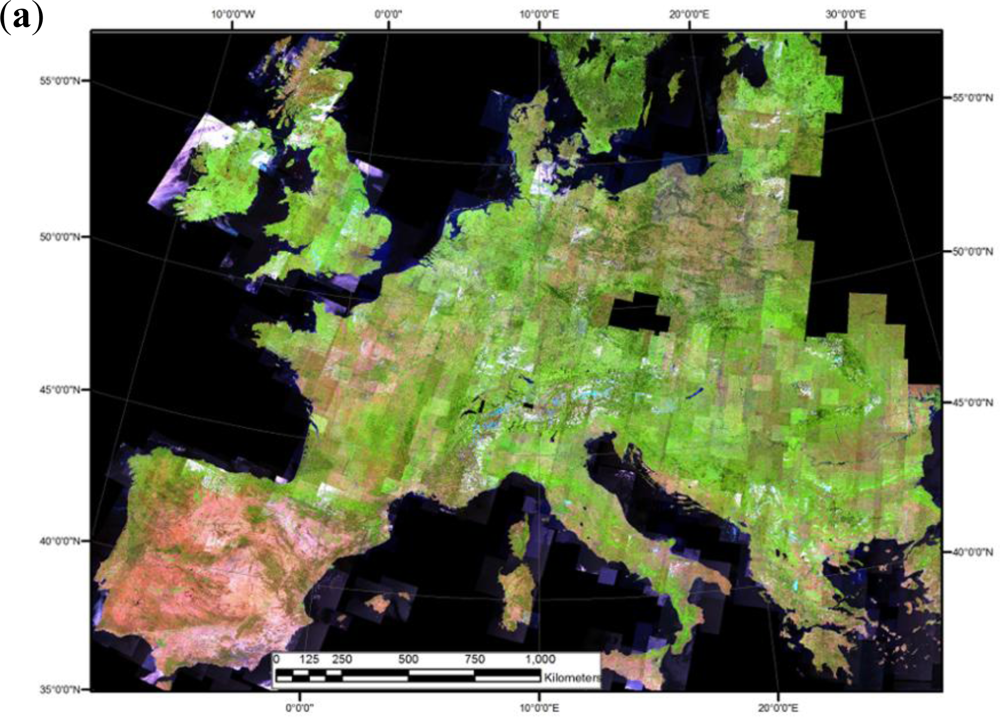
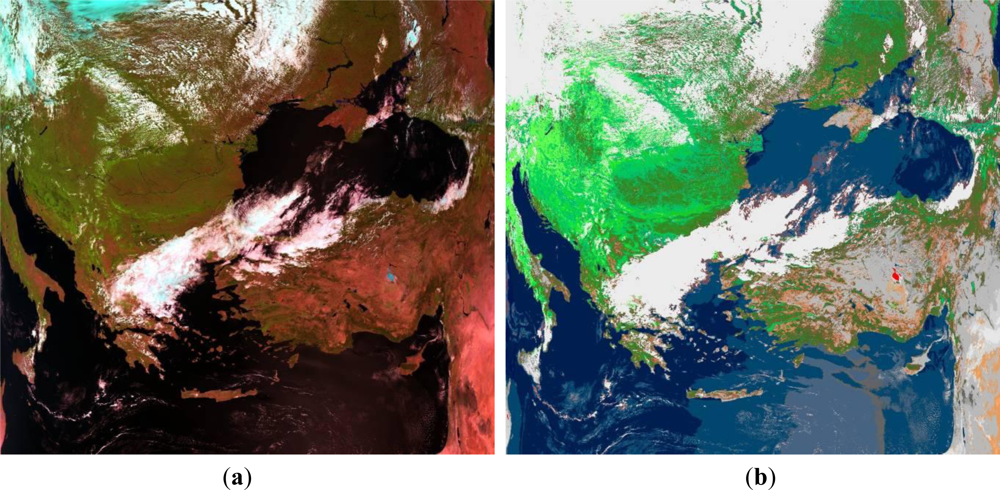
| SIAM™ system of systems | B –(E)TM1, 0.45–0.52 (μm) | G –(E)TM2, 0.52–0.60 (μm) | R –(E)TM3, 0.63–0.69 (μm) | NIR –(E)TM4, 0.76–0.90 (μm) | MIR1 –(E)TM5, 1.55–1.75 (μm) | MIR2 –(E)TM7, 2.08–2.35 (μm) | TIR –(E)TM6, 10.4–12.5 (μm) | SR (m) | Rad. Cal. Y/N, C/I | Pan SR (m) | Notes | |
|---|---|---|---|---|---|---|---|---|---|---|---|---|
| L-SIAM™ (46 Sp. Cat.) | Landsat-4/-5 TM | × | × | × | × | × | × | × | 30 | Y-C | Refer to Table I in [18]. | |
| Landsat-7 ETM+ | × | × | × | × | × | × | × | 30 | Y-C | 15 | Same as above. | |
| MODIS | × | × | × | × | × | × | × | 250, 500, 1000 | Y-C | Same as above. | ||
| ASTER | × | × | × | × | × | × | 15–30 | Y-C | Same as above. | |||
| CBERS-2B | × | × | × | × | × | × | × | N | ||||
| APEX | × | × | × | × | × | × | 1.8 | Y | Airborne hyperspectral, 285 bands | |||
| S-SIAM™ (32 Sp. Cat.) | SPOT-4 HRVIR | × | × | × | × | 20 | Y-I | 10 | Refer to Table II in [18]. | |||
| SPOT-5 HRG | × | × | × | × | 10 | Y-I | 2.5 - 5 | Same as above. | ||||
| SPOT-4/-5 VMI | × | × | × | × | 1100 | Y-I | Same as above. | |||||
| IRS-1C/-1D LISS-III | × | × | × | × | 23.5 | Y-I | ||||||
| IRS-P6 LISS-III | × | × | × | × | 23.5 | Y-I | ||||||
| IRS-P6 AWiFS | × | × | × | × | 56 | Y-I | ||||||
| AV-SIAM™ (39 Sp. Cat.) | NOAA AVHRR | × | × | × | × | 1100 | Y | Refer to Table II in [18]. | ||||
| MSG | × | × | × | × | 3000 | Y | Same as above. | |||||
| AA-SIAM™ (39 Sp. Cat.) | ENVISAT AATSR | × | × | × | × | × | 1000 | Y | Same as above. | |||
| ERS-2 ATSR-2 | × | × | × | × | × | 1000 | Y | |||||
| Q-SIAM™ (25 Sp. Cat.) | IKONOS-2 | × | × | × | × | 4 | Y | 1 | ||||
| QuickBird-2 | × | × | × | × | 2.4 | Y | 0.61 | |||||
| GeoEye-1 | × | × | × | × | 1.64 | Y | 0.41 | |||||
| OrbView-3 | × | × | × | × | 4 | N | 1 | |||||
| RapidEye-1 to -5 | × | × | × | × | 6.5 | Y-I | ||||||
| ALOS AVNIR-2 | × | × | × | × | 10 | Y | ||||||
| KOMPSAT-2 | × | × | × | × | 4 | N | 1 | |||||
| TopSat | × | × | × | × | 5 | N | 2.5 | |||||
| FORMOSAT-2 | × | × | × | × | 8 | Y | 2 | |||||
| ENVISAT MERIS | × | × | × | × | 300 | Y | Super-spectral, 15 bands | |||||
| Leica ADS40/80 | × | × | × | × | 0.25 | Y | 0.25 | Airborne, 4 bands + PAN | ||||
| D-SIAM™ (25 Sp. Cat.) | Landsat-1/-2/-3/-4/-5 MSS | × | × | × | 79 | Y | ||||||
| IRS-P6 LISS-IV | × | × | × | 5.8 | Y-I | |||||||
| SPOT-1/-2/-3 HRV | × | × | × | 20 | Y-I | 10 | ||||||
| DMC | × | × | × | 22–32 | N |
| “High” leaf area index (LAI) vegetation types (LAI values decreasing left to right) | |||||||||||||||||||||||||||||||||||||||||
| “Medium” LAI vegetation types (LAI values decreasing left to right) | |||||||||||||||||||||||||||||||||||||||||
| Shrub or herbaceous rangeland | |||||||||||||||||||||||||||||||||||||||||
| Other types of vegetation (e.g., vegetation in shadow, dark vegetation, wetland) | |||||||||||||||||||||||||||||||||||||||||
| Bare soil or built-up | |||||||||||||||||||||||||||||||||||||||||
| Deep water, shallow water, turbid water or shadow | |||||||||||||||||||||||||||||||||||||||||
| Thick cloud and thin cloud over vegetation, or water, or bare soil | |||||||||||||||||||||||||||||||||||||||||
| Thick smoke plume and thin smoke plume over vegetation, or water, or bare soil | |||||||||||||||||||||||||||||||||||||||||
| Snow and shadow snow | |||||||||||||||||||||||||||||||||||||||||
| Shadow | |||||||||||||||||||||||||||||||||||||||||
| Flame | |||||||||||||||||||||||||||||||||||||||||
| Unknows | |||||||||||||||||||||||||||||||||||||||||
| “High” leaf area index (LAI) vegetation types (LAI values decreasing left to right) | |||||||||||||||||||||||||||||
| “Medium” LAI vegetation types (LAI values decreasing left to right) | |||||||||||||||||||||||||||||
| Shrub or herbaceous rangeland | |||||||||||||||||||||||||||||
| Other types of vegetation (e.g., vegetation in shadow, dark vegetation, wetland) | |||||||||||||||||||||||||||||
| Bare soil or built-up | |||||||||||||||||||||||||||||
| Deep water or turbid water or shadow | |||||||||||||||||||||||||||||
| Smoke plume over water, over vegetation or over bare soil | |||||||||||||||||||||||||||||
| Snow or cloud or bright bare soil or bright built-up | |||||||||||||||||||||||||||||
| Unknowns | |||||||||||||||||||||||||||||
| SIAM™ | Input Bands (B: Blue, G: Green, R: Red, NIR: Near Infra-Red, MIR: Medium IR, TIR: Thermal IR) | Preliminary Classification Map Output Products: Number of Output Spectral Categories. | |||
|---|---|---|---|---|---|
| Fine Semantic Granularity | Intermediate Semantic Granularity | Coarse Semantic Granularity | Inter-Sensor Semantic Granularity (*) | ||
| L-SIAM™ | 7 – B, G, R, NIR, MIR1, MIR2, TIR | 95 | 47 | 18 | 33 |
| S-SIAM™ | 4 – G, R, NIR, MIR1 | 68 | 40 | 15 | |
| AV-SIAM™ | 4 – R, NIR, MIR1, TIR | 82 | 42 | 16 | |
| AA-SIAM™ | 5 – G, R, NIR, MIR1, TIR | 82 | 42 | 16 | |
| Q-SIAM™ | 4 – B, G, R, NIR | 52 | 28 | 12 | |
| D-SIAM™ | 3 – G, R, NIR | 52 | 28 | 12 | |
| Quality Indicators of Operativeness (OQIs) | Existing RS-IUS Software Products | SIAM™ Software Product |
|---|---|---|
| Degree of automation: (a) number, physical meaning and range of variation of user-defined parameters, (b)collection of the required training data set, if any. | VL, L | VH (fully automatic, it cannot be surpassed) |
| Effectiveness : (a) semantic accuracy and (b) spatial accuracy. | M, H, VH | VH |
| Semantic information level. | Land cover class (e.g., deciduous forest) | Spectral semi-concept (e.g., vegetation) |
| Efficiency: (a) computation time and (b) memory occupation. | VL, L in training (hours per images) | VH (5 m to 30 s per Landsat image in a laptop) |
| Robustness to changes in the input image. | VL (site-specific) | VH |
| Robustness to changes in input parameters. | VL | VH (it cannot be surpassed) |
| Scalability to changes in the sensor’s specifications or user’s needs. | VL | VH (it works with any existing spaceborne sensor) |
| Timeliness (from data acquisition to high-level product generation, increases with manpower and computing power). | VH (e.g., the collection of reference samples is a difficult and expensive task) | VL, i.e., timeliness is reduced to almost zero |
| Costs (increasing with manpower and computing power). | VL, L, high costs in manpower and also computing power | VH, i.e., costs in manpower and computing power are reduced to almost zero |
Share and Cite
Baraldi, A.; Boschetti, L. Operational Automatic Remote Sensing Image Understanding Systems: Beyond Geographic Object-Based and Object-Oriented Image Analysis (GEOBIA/GEOOIA). Part 2: Novel system Architecture, Information/Knowledge Representation, Algorithm Design and Implementation. Remote Sens. 2012, 4, 2768-2817. https://doi.org/10.3390/rs4092768
Baraldi A, Boschetti L. Operational Automatic Remote Sensing Image Understanding Systems: Beyond Geographic Object-Based and Object-Oriented Image Analysis (GEOBIA/GEOOIA). Part 2: Novel system Architecture, Information/Knowledge Representation, Algorithm Design and Implementation. Remote Sensing. 2012; 4(9):2768-2817. https://doi.org/10.3390/rs4092768
Chicago/Turabian StyleBaraldi, Andrea, and Luigi Boschetti. 2012. "Operational Automatic Remote Sensing Image Understanding Systems: Beyond Geographic Object-Based and Object-Oriented Image Analysis (GEOBIA/GEOOIA). Part 2: Novel system Architecture, Information/Knowledge Representation, Algorithm Design and Implementation" Remote Sensing 4, no. 9: 2768-2817. https://doi.org/10.3390/rs4092768