Remote Sensing in Mapping Mangrove Ecosystems — An Object-Based Approach


1
German Remote Sensing Data Center, German Aerospace Center, Oberpfaffenhofen, D-82234 Wessling, Germany
2
Remote Sensing & Environmental Modelling, Department of Geography, Kiel University, Ludewig-Meyn-Str 14, D-24098 Kiel, Germany
*
Author to whom correspondence should be addressed.
Remote Sens. 2013, 5(1), 183-201; https://doi.org/10.3390/rs5010183
Submission received: 20 November 2012
/
Revised: 28 December 2012
/
Accepted: 28 December 2012
/
Published: 7 January 2013
Abstract
:Over the past few decades, clearing for shrimp farming has caused severe losses of mangroves in the Mekong Delta (MD) of Vietnam. Although the increasing importance of shrimp aquaculture in Vietnam has brought significant financial benefits to the local communities, the rapid and largely uncontrolled increase in aquacultural area has contributed to a considerable loss of mangrove forests and to environmental degradation. Although different approaches have been used for mangrove classification, no approach to date has addressed the challenges of the special conditions that can be found in the aquaculture-mangrove system in the Ca Mau province of the MD. This paper presents an object-based classification approach for estimating the percentage of mangroves in mixed mangrove-aquaculture farming systems to assist the government to monitor the extent of the shrimp farming area. The method comprises multi-resolution segmentation and classification of SPOT5 data using a decision tree approach as well as local knowledge from the region of interest. The results show accuracies higher than 75% for certain classes at the object level. Furthermore, we successfully detect areas with mixed aquaculture-mangrove land cover with high accuracies. Based on these results, mangrove development, especially within shrimp farming-mangrove systems, can be monitored. However, the mangrove forest cover fraction per object is affected by image segmentation and thus does not always correspond to the real farm boundaries. It remains a serious challenge, then, to accurately map mangrove forest cover within mixed systems.
1. Introduction
The mangrove forests of Vietnam are among the most productive and biologically complex ecosystems in the world. Mangrove ecosystems are highly productive and provide many ecosystem services for human wellbeing [1–5]. The importance of mangrove forests as a coastal resource is well acknowledged [2,6,7]. Not only do mangrove forests provide commercial fishery resources by acting as nurseries, breeding places and habitat for offshore fisheries [8–11], they also play an important role in stabilizing coastlines, where they serve as natural barriers, dissipating the destructive energy of waves and reducing the impact of hurricanes, cyclones, tsunamis and storm surges [12]. Many studies have acknowledged that regions with intact mangroves have been exposed to significantly lower levels of devastation from cyclones than those with degraded or converted mangroves [6,12–15]. Mangroves are known as a resource for exporting organic matter to the marine environment, producing nutrients for fauna in both the mangroves themselves and adjacent marine and estuarine ecosystems [16]. Additionally, mangrove forests are often a rich source of timber, fuel wood, honey, medicinal plants and other raw materials for local consumption [17]. Finally, mangrove forests attract eco-tourists, fishers, hunters, hikers and birdwatchers, providing valuable or potential sources of national income; moreover, they provide high economic value for residents, who depend on their natural resources [2,18,19].
There are different approaches to quantifying the economic value of goods and services provided by mangrove ecosystems. These approaches include total economic value (TEV) derivation, cost and benefit analysis (CBA), and the contingent valuation method (CVM) [4]. However, mangrove ecosystems also provide economic value that decision-makers often do not recognize [2,20–22]. The importance of mangroves is reflected in the high variability of their economic value, which ranges between US $ 475 and US $ 11,675 ha−1·year−1 globally, depending on the selection of the valuation approach or market conditions [20]. Therefore, rehabilitation and restoration projects are conducted worldwide to prevent further degradation and loss of mangrove areas.
Mangrove forests are declining worldwide [2,5,23]. In various countries, mangrove areas have been rapidly converted to other types of land cultivation. According to [24], “approximately one third of the mangrove forests over the world have been lost in the past 50 years”. The main threats to mangroves are the overexploitation of natural resources, deforestation, mining, pollution and industrial or urban development spreading into coastal forest areas [2,6,14,25–27], and conversion to aquaculture and salt-ponds. Seto and Fragkias [10], for instance, analyzed mangrove changes in the Red River Delta (Vietnam) utilizing Landsat images from 1975 to 2002. They calculated the conversion rate between mangrove area and aquaculture development and found a strong correlation between the decrease of mangrove areas and the increase of aquaculture area [10].
Kuenzer et al.[6] recently published a detailed review on remote sensing methods for mangrove mapping, with approaches ranging from employing aerial photography to multispectral satellite imagery and hyperspectral and radar data. Their paper summarized the most commonly applied methodologies applied over the last 20 years and gave an overview of the sensors and approaches that might be best suited for a particular focus. For a detailed overview of the numerous techniques and approaches applicable to the mapping of mangrove ecosystems, readers can refer to their paper. Pixel-based classification approaches are most frequently applied for mapping mangrove forests [28–34]. Tong et al.[31], for example, applied Maximum Likelihood classification to map the mangrove distribution in Ca Mau province based on SPOT 4 images. Pixel-based approaches are the subject of a study by Béland et al.[35], who investigated land cover changes related to aquaculture in the Red River Delta (Vietnam). The authors used multi-temporal Landsat data (1986, 1992 and 2001) to detect changes from mangrove forest to aquaculture using Tasseled Cap-derived information. In addition to these pixel-based approaches, several applications use spatial neighborhood information in object-based classification. Recently, object-based approaches have been applied successfully in many ecology-related remote sensing studies, such as landslide inventories [36], mapping burned areas using different sensors [37,38], monitoring land conversion [39], or assessing forest structural complexity [40]. In mangrove studies, for example, Conchedda et al.[41] used an object-based approach to map mangrove cover change in Casamance (Senegal) based on SPOT XS data. The authors performed a change-detection analysis based on object-based mapping results. For their mapping, they applied a multi-resolution segmentation and class-specific rules incorporating spectral properties and spectral/spatial relationships between image objects. Also, Wang et al.[42] demonstrated in their study on mangrove mapping for the coast of Panama that an improvement of classification accuracy resulted from object-based classification in comparison to pixel-based classification. Heumann [43] applied object-based image analysis and support vector machines for differentiating fringe-mangrove and true mangrove species. The result showed an overall accuracy greater than 94% (kappa = 0.863). Myint et al.[44] used spatial data as an input into the image object segmentation process and reported an accuracy greater than 90%. The superiority of object-based approaches over traditional pixel-based classification exercises for high-resolution satellite data has been demonstrated in numerous studies [26,33,40,42,43,45].
As outlined above, most applications related to mangrove mapping usually focus on the discrete differentiation between mangrove and non-mangrove areas or on the qualitative assessment of species, growth status, or condition to derive classes such as “dense” or “sparse” mangrove forests. The mangrove ecosystem of Ca Mau in the Mekong Delta (MD), however, is characterized by a very special integrated farming system consisting of mixed aquaculture farming and mangrove cultivation, with governmental guidelines on the exact share of mangrove forest that a farmer should maintain on his land. Against this background, the current study presents an object-based classification approach that allows the quantitative estimation of mangrove fractions within the aquatic shrimp farming system of Ca Mau province in the MD.
2. Study Area and Data
2.1. Study Area
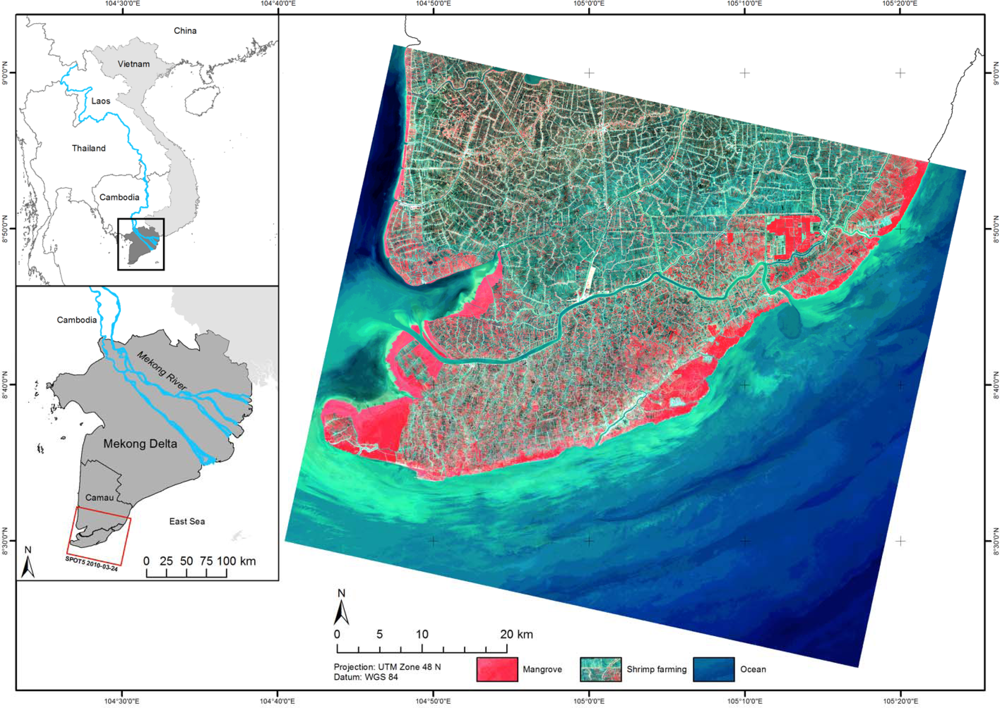
Located between 8°33′–10°55′N and 104°30′–106°50′E; the MD is one of the largest river deltas in the world; it consists of 13 Vietnamese provinces inhabited by approximately 18 million people [46]. The MD comprises an area of approximately 39,000 km2; of which 24,000 km2 is now used for agriculture and aquaculture; 4,000 km2 for forestry; and the remaining area for settlement and construction [47,48]. In the coastal provinces, the main forms of cultivation are irrigated rice and aquaculture. Primary products from the MD contribute more than 30% of the Gross Domestic Product of Vietnam. The MD produces 50% of the nation’s rice; contributing to Vietnam’s place as the second-largest rice exporter in the world [49,50].
Mangrove forests cover the intertidal area created by coastal accretion as a result of the interaction between river and sea. Our main study area, Ca Mau province, is located in the southwest of the MD, is one of the largest delta provinces and hosts some of Vietnam’s largest mangrove areas (Figure 1). The province has an area of 5,331 km2 and a population of 1.2 million inhabitants [51]. The mangrove forest area has declined significantly in Ca Mau, primarily due to the expansion of shrimp farming and ongoing population pressure. Because of its high economic return, shrimp farming has been promoted to boost the national economy, to provide a potential source of income for local communities and to alleviate poverty [52,53].
2.2. Mangrove Forest Management in Ca Mau
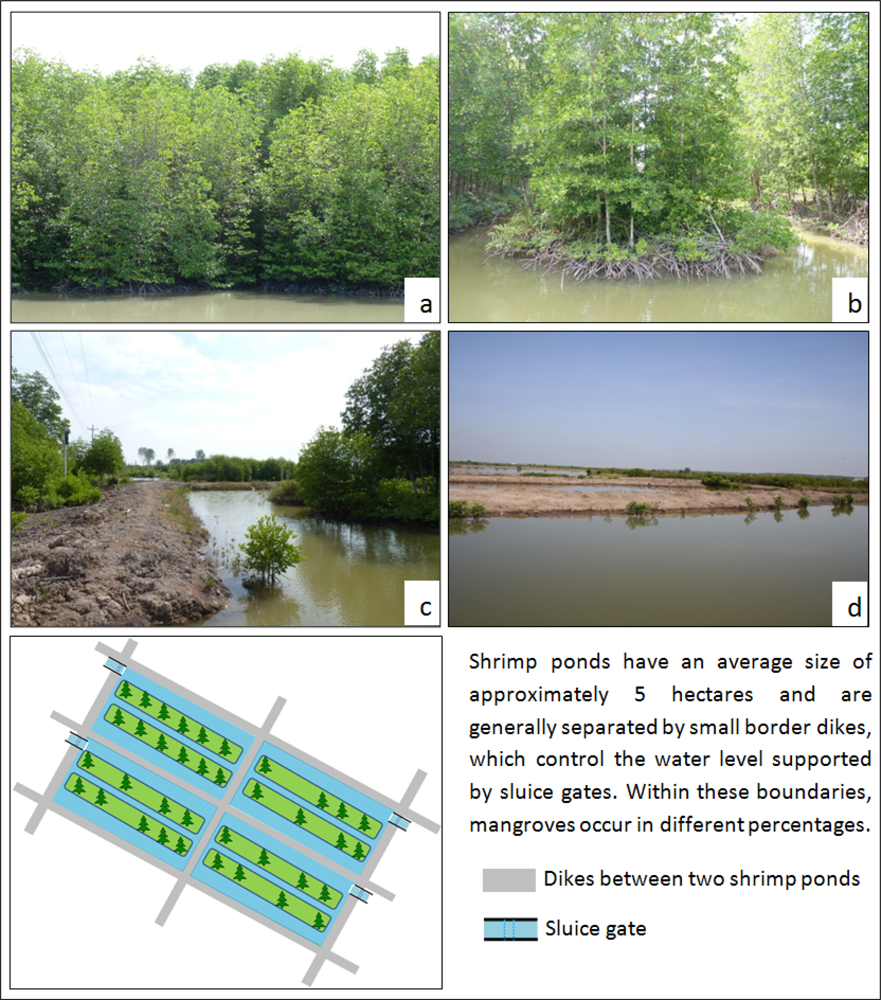
During the Vietnam war, approximately 100,000 ha of mangrove forests were destroyed due to the spraying of aerial defoliants [28]. In the early 1970s, the mangrove forest area in Ca Mau province covered approximately 200,000 ha. In the 1980s and early 1990s, the mangroves were further reduced due to the overexploitation of timber for construction and charcoal [29,31,53] and the conversion of forest land into shrimp-farming land [55] (Figure 2). Forest enterprises were established to ensure the sustainable management of mangroves. However, the forest area in Ca Mau was at its minimum of 51,000 ha in 1992 [47]: the highly diverse mangrove forests of Ca Mau had been turned into monoculture forests consisting primarily of planted Rhizophora apiculata[56]. By the mid-1990s, deforestation bans had been imposed, and the forest enterprises were now replanting and protecting forests rather than utilizing them [57]. Currently, the mangrove forests in Ca Mau province are divided into two main land use zones. The first is a conservation zone named the Full Protection Zone (FPZ), in which all land must be forested and conserved; no human settlement is allowed except for fishing communities at the river mouths [57]. The second is the Buffer Zone (BZ), where 60% of the area must be covered by mangrove forests, while the other 40% can be used for aquaculture or agriculture [58]. Consequently, the shrimp-mangrove integrated farming system in the BZ is characterized by a highly structured geometrical pattern. Typically, shrimp ponds have an area of approximately 5 ha and are surrounded by small dikes that control the water level and form a border with neighboring shrimp farms (Figure 3). Within the ponds, the remaining mangrove forests are typically replanted in a row pattern. The mangrove forest in Ca Mau province is under the state-owned management of the provincial Department of Agriculture and Rural Development (DARD) [31,32]. Farmers lease a 20-year land-use right on forest-farm land, which can be renewed provided that they adequately protect the 60% forest cover. For these farmers, shrimp farming and catching natural fish resources in tide-operated sluice gates on the shrimp-ponds remain the main sources of income [31,57]. The high income from shrimp farming encourages the farmers to increase the area of aquaculture by cutting off mangroves, which may result in a further increase of land used for aquaculture and domestic purposes instead of maintaining the status of the mangroves and complying with the demanded 60% coverage.
2.3. Data
The remote sensing data available for this study consist of multi-spectral SPOT5 data and TerraSAR-X (used for geometric correction). All scenes were stored in the GeoTIFF format and featured in a UTM map projection (UTM-48N, WGS-84 datum). Table 1 presents configuration details of the SPOT5 imagery. A provincial forest map for 2006 was provided by the Institute of Forest Inventory and Planning (FIPI) together with an administrative map of the study area. In addition, 222 validation points were collected during field research in 2010. A wide range of ground-truth information on mangrove conditions, density and species composition was collected. Mangrove forest cover density and additional information were retrieved via extensive household interviews (including a question on how many hectares of mangrove the household owns per total area) and were further validated by field observation. The location of each point was measured using a Trimble GPS (Trimble Navigation Limited, Sunnyvale, CA, USA).
3. Methodology
3.1. Preprocessing
The SPOT scene (acquired on 23 April 2010, 10 m spatial resolution) was geometrically registered to the TerraSAR-X data (acquired on 24 February 2010, with 2.75 m resolution). Polynomial coefficients were estimated using ground control points, and a root mean square error (RMSE) of 0.83 pixels was obtained. Next, atmospheric correction was conducted using ATCOR-2 software. ATCOR contains a large number of pre-calculated atmospheric conditions based on the MODTRAN radiative transfer code. Standard parameters for tropical maritime land surfaces were used, and sun and sensor geometries were modified according to the image recording conditions as extracted from the image’s metadata. Due to the low topographic variation in Ca Mau province, the incorporation of a DEM for topographic radiometric correction was omitted. The detailed parameters applied for atmospheric correction are presented in Table 2. More information about the functionality of ATCOR-2 can be found in [59].
3.2. Image Segmentation
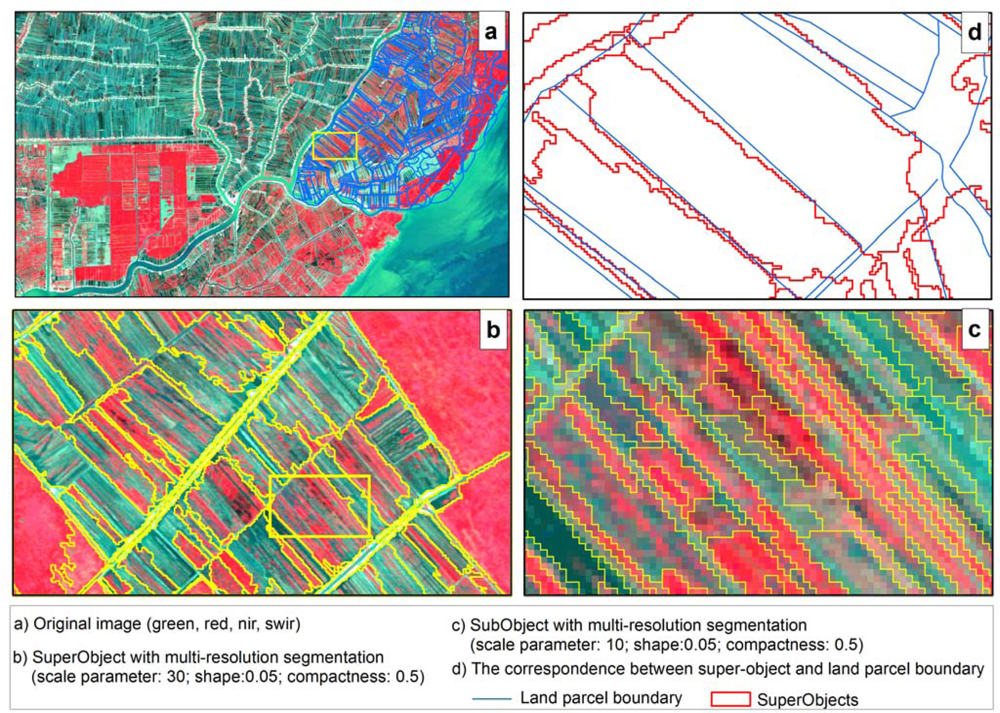
The segmentation was performed using the eCognition 8.7 image analysis software [60] Two segmentation levels were generated in a top-down hierarchy. The first coarse segmentation level holds large objects, meant to represent the individual pond areas in the scene. As illustrated in Figure 4, the pond areas are clearly demarcated by circumjacent dikes, providing an ideal structure for segmentation. The super-objects are further segmented by a second, finer layer that allows differentiation of the super-objects into water and mangrove components.
The segmentation algorithm applied in this study is the so-called “multi-resolution segmentation”. The algorithm was applied to all four SPOT bands (green, red, NIR and SWIR) with the same weight for each band; the NDVI was calculated and added as a fifth band with the same weighting. A scale factor and a heterogeneity criterion control the outcome of the segmentation algorithm. The scale factor is indirectly related to the average size of the objects to be detected. The heterogeneity criterion controls the merging decision process and is computed using spectral layers. This involves evaluation of two mutually exclusive properties, color and shape. Color refers to spectral homogeneity, whereas shape considers the semantic characteristics of the objects. Shape is divided into two equally exclusive properties: smoothness and compactness [61]. For a deeper understanding of the algorithm, the reader is referred to [62].
The most important and most critical aspect of this approach is the parameterization of the coarse segmentation layer so that each shrimp pond is represented by an individual object. Therefore, the different parameters were tested systematically by comparing the resulting objects with a cadastral map that was available for a small test case area (Figure 4). Starting with a low scale parameter, the threshold was increased until the super-objects had an average size that corresponded to the mean shrimp pond size of approximately five hectares (scale parameter = 30, shape = 0.05, and compactness = 0.5). The parameters for the second segmentation level were defined so that the resulting objects represented the smallest isolated mangrove forest patches within the shrimp pond areas (scale parameter = 10, shape = 0.05, and compactness = 0.5).
3.3. Classification
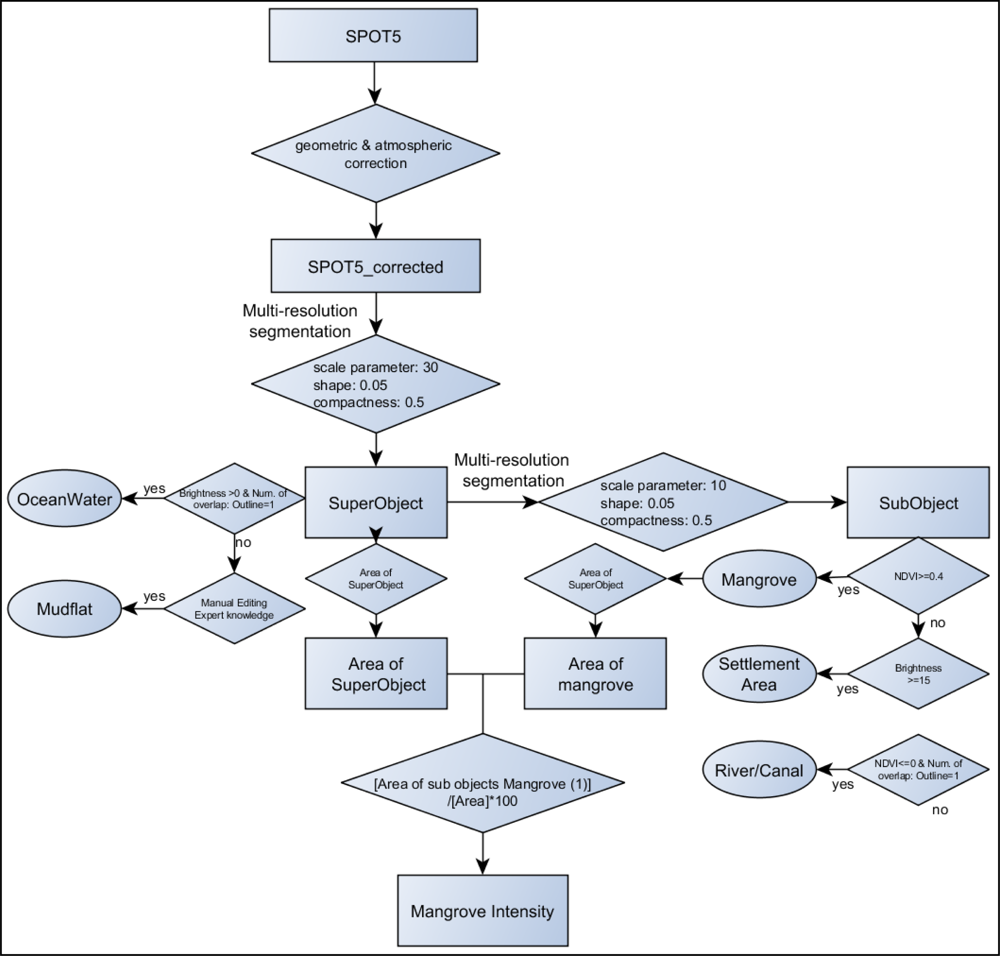
The definition of the classification scheme was based on existing provincial map legends and field surveys. In addition to the mangrove classes, four non-vegetative classes, i.e., settlement area, river/canal, mud flat and ocean water, were defined for the study area. The classes were derived utilizing a decision tree approach in combination with interactive visual interpretation, expert knowledge, training data, and existing maps of the area (Figure 5).
At the super-object level, the ocean water was separated from land based on the object feature “brightness” (brightness > 0, number of overlapping pixels = 1), the threshold of which was defined using an administrative map available for the area. The mud flat class was manually edited using expert image interpretation. At the sub-object level, settlement areas were identified based on the object feature “brightness” (brightness ≥ 15), and rivers and canals were classified by applying an NDVI threshold (NDVI ≤ 0, number of overlapping pixels = 1). Mangrove patches within the super-objects were classified using an NDVI threshold of 0.4.
Finally, the area of each super- and sub-object was calculated. Mangrove fractions for each pond were defined as the sum of the classified mangrove patches within each super-object divided by the total pond area. The mangrove fractions for each super-object were further grouped into four density classes, i.e., below 30%, 31–50%, 51–70%, and 71–100% mangrove forest.
3.4. Validation
Accuracy assessment is an important part of the image classification procedure and can be computed by assessing either positional or thematic accuracies. Positional accuracy is defined as the accuracy of the location of a point in the satellite imagery with reference to its location on the ground, whereas thematic accuracy is the accuracy of a mapped land cover class at a certain time compared with what was actually on the ground at that time [63]. In this study, a total of 222 reference points were surveyed in the field to serve as validation samples for the classification (Figure 6). The number of validation samples selected for each class was proportional to its importance in terms of area covered, with a minimum of 10 samples for each class. At each reference location, the respective land cover class and mangrove density within a farmer’s parcel were visually estimated, and GPS coordinates were recorded. Each land cover class was then compared with the results of the classified image. A confusion matrix together with descriptive statistics (user’s accuracy, producer’s accuracy and overall accuracy) was then computed to conduct an accuracy assessment for the land cover classification.
4. Results
As previously stated in Section 1, a major focus of this study is the derivation of the mangrove cover fraction. Figure 7 presents the results of the image classification, including four mangrove classes with different densities, rivers/canals, mud flats and settlement areas. The dense mangrove areas were found primarily along the coastline, where more than 70% of farmland is occupied by mangroves. Low amounts of forest cover (e.g., 31% to 50%) were distributed inland, where land is utilized for aquaculture and shrimp farming. Water canals and small tidal creeks are distributed within the entire area. Mud flats occur along the southwestern corner of the Ca Mau Peninsula. These flats are a result of the accumulation of coastal sediments during monsoons and sediment transport from the Mekong River. Table 3 shows a comparison of the mangrove fraction with estimates from the field data. The classification resulted in an overall accuracy of 75.68%. The “pure” classes had particularly high accuracies. For example, settlement areas, patches with less than 30% mangrove coverage, and rivers-canals had accuracies of 68.00%, 89.86% and 94.44%, respectively. The mixed classes, however, i.e., the classes with 30–50% or 51–70% mangrove forest cover, show lower accuracies, with omission and commission errors between approximately 39% and 58%. This result means that misclassification occurred primarily for ponds with more balanced fractions of mangroves and aquaculture.
5. Discussion
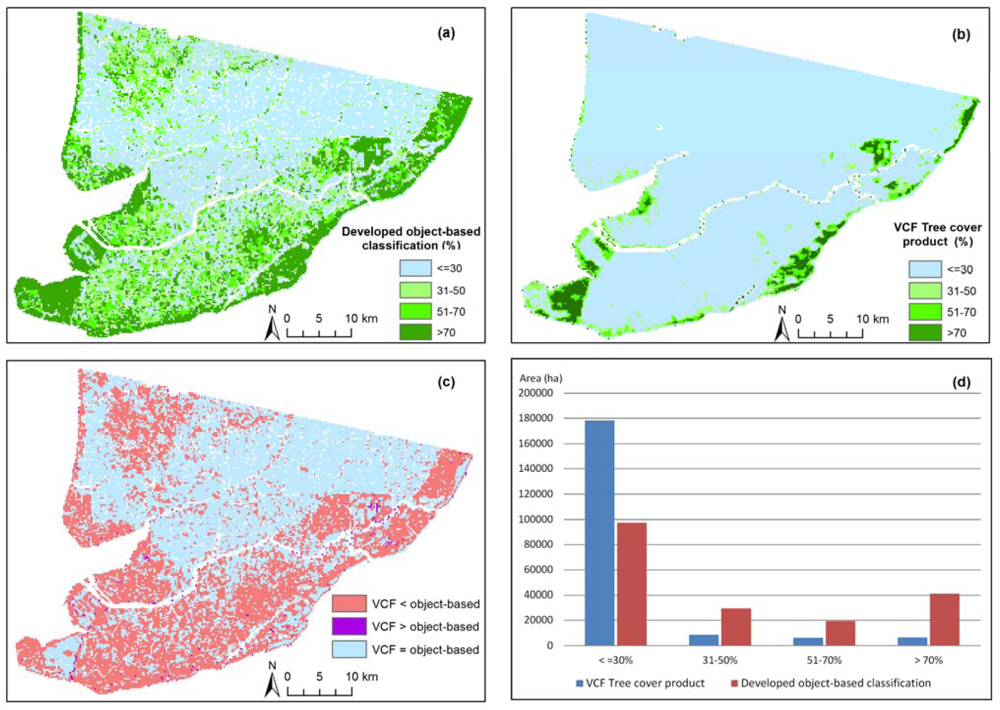
To our knowledge, no study or region-specific dataset on the quantification of mangrove cover exists for the Ca Mau Peninsula in the MD. The only available dataset on forest cover quantification for this region is the global MOD44B vegetation continuous fields (VCF) product. MOD44B VCF is a standard product of the Land Processes Distributed Active Archive Center (LP DAAC) and holds sub-pixel estimates of tree cover at 250 m resolution that were derived from the MODIS sensor aboard the platforms Aqua and Terra [64]. The MODIS VCF tree cover product is frequently used for validation and comparison at regional to local scales [64–66]. Figure 8 shows the MODIS VCF product in comparison to our object-based classification result. To achieve a better comparison, we resampled our object-based classification to a 250 m spatial resolution and reclassified the MODIS VCF product into the four mangrove fraction classes corresponding to our classification.
Although the same general patterns of forest fractions can be observed in both products, significant differences were evident in the comparisons of the actual proportions in the mangrove fraction classes (Figure 8(c–d)). Although there was an overall agreement of approximately 100,000 ha between the two products, approximately 45% of the study area showed different class assignments. From the difference image (Figure 8(c)), it is evident that there is a clear trend toward lower forest fractions in the MODIS VCF product compared with those of our approach. Although the proportions of very low mangrove fractions (≤30%) are nearly twice as high in the MODIS VCF product compared with our results, the proportions of MODIS VCF estimates in the intermediate classes are less than one-third of those obtained with the regional classification approach. The lowest agreement can be found for the highest fraction class (>70%), where the MODIS VCF product estimated only one-sixth of the area of our approach.
The results of the comparison demonstrate the shortcomings of global products based on low-resolution data compared with the regionally tuned approach utilizing high-resolution image data. The MODIS VCF product is derived through a regression model based on a global data set of tree cover densities. However, the structure of the mangrove forests in Ca Mau province differs substantially from the global average forest structures (Figure 3). The very distinct spectral properties of the surface water among the forest areas significantly influence the overall spectral response of the MODIS pixels. The object-based approach, in comparison, classifies patches of mangrove forests and water areas separately at the pond level. Even for the very dense mangrove patches at the corner, water still influences a pixel’s overall spectral appearance as a canopy background signal. This influence is particularly apparent for the dense mangrove forests along the coast, which are planted for coastal protection.
Although the results of the accuracy assessment demonstrated that the overall agreement between the estimated fractions and the field data was satisfactory, the intermediate fractions showed larger disagreements. As noted by many authors [36,39–42], multi-resolution segmentation is a powerful technique, and the selection of an appropriate scale parameter is crucial for creating meaningful objects. As illustrated in Figure 4, the super-object segments in this study correspond reasonably well to the shrimp pond boundaries. It must be noted, however, that the shapes and sizes of the resulting super-objects, with an average size of five hectares, are only an approximation to the underlying shrimp pond structure and that a substantial number of plots in the field, as well as super-objects in the segmentation layer, showed large deviations from this average size. Furthermore, the image segmentation is influenced by physically visible natural boundaries such as the shrimp pond dikes and, therefore, does not necessarily correspond to actual ownership structures. During the field trip, however, interviews and mangrove quantification were performed for each farming system. In addition, the estimation of mangrove fractions in the field for plot areas of 5 ha is not straightforward and introduces additional uncertainties into the field data. A further source of uncertainty is that even though mangroves are the dominant vegetation type in this area, the mangrove class may contain other types of vegetation (e.g., garden trees). Because we decided not to further differentiate between different vegetation types, the derived mangrove fractions may be overestimated in certain areas.
Despite these limitations, the results demonstrate the general suitability of the object-based approach for the quantification of the mangrove fraction in a highly structured environment, such as the integrated aquaculture-mangrove farming system of the Ca Mau Peninsula. Further reseach will focus on the integration of additional geodata, such as cadastral maps in the segementation process, and on the general transferability of the approach to comparably structured environments. Although most previous studies related to mangrove mapping generally focus on the discrete differentiation between mangrove and non-mangrove areas, qualitative descriptions of mangrove densities, and mangrove species, our study focuses on the quantitative estimation of mangrove fractions at the parcel level.
6. Conclusions
The approach followed in this study represents a first attempt to quantitatively assess mangrove percentages within the special mangrove-aquaculture farming system in the MD. Existing approaches on mangrove classification are limited to qualitative mangrove characteristics such as “dense”, “medium” and “low” densities. Our approach, in contrast, provides continuous forest fractions at the “pond level” without utilizing auxiliary information on ownership structures. This precondition is of high importance, particularly in developing countries where geoinformation is rare or nonexistent. Because no comparable information on mangrove percentages exists for the region, the results are of great value to natural resource managers in terms of mangrove inventory mapping and enforcing the guidelines related to mangrove fractions in the respective zones.
The results demonstrate that the predominantly mono-cultivation areas, i.e., above 70% or below 30% mangrove forests, were detected with high accuracies compared with existing approaches. The quantification of mangrove-aquaculture percentages toward more balanced fractions, however, is becoming increasingly challenging. This challenge can also be attributed to the difficulties of obtaining reliable and consistent field estimates for validation.
Although there are still a number of challenges, the derived super-objects and the resulting mangrove fractions reflect the given conditions in the delta better than using a regular grid, for example, when applying spectral unmixing approaches based on medium-resolution data. Further improvements of the approach could include the incorporation of information on ownership structures, such as cadastral maps, in the segmentation process once such geo-information is available for this region.
Acknowledgments
This research was undertaken within the framework of the German-Vietnamese research project “WISDOM”, funded by the German Ministry of Education and Research-BMBF and the Ministry of Science and Technology of Vietnam (MOST). We thank three anonymous reviewers for their valuable and instructive comments on the manuscript.
References
- Rönnbäck, P.; Rona, B.; Ingwall, L. The return of ecosystem goods and services in replanted mangrove forests—Perspectives from local communities in Gazi Bay, Kenya. Environ. Conserv 2007, 34, 313–324. [Google Scholar]
- Alongi, D.M. Present state and future of the world’s mangrove forests. Environ. Conserv 2002, 29, 331–349. [Google Scholar]
- Kathiresan, K.; Bingham, B.L. Biology of mangroves and mangrove ecosystems. Adv. Mar. Biol 2001, 40, 1–145. [Google Scholar]
- Vo, Q.T.; Kuenzer, C.; Vo, Q.M.; Moder, F.; Oppelt, N. Review of valuation methods for mangrove ecosystem services. Ecol. Indic 2012, 23, 431–446. [Google Scholar]
- Giri, C.; Muhlhausen, J. Mangrove forest distributions and dynamics in madagascar (1975–2005). Sensors 2008, 8, 2104–2117. [Google Scholar]
- Kuenzer, C.; Bluemel, A.; Gebhardt, S.; Quoc, T.V.; Dech, S. Remote sensing of mangrove ecosystems: A review. Remote Sens 2011, 3, 878–928. [Google Scholar]
- Thampanya, U.; Vermaat, J.E.; Sinsakul, S.; Panapitukkul, N. Coastal erosion and mangrove progradation of Southern Thailand. Estuar. Coast. Shelf Sci 2006, 68, 75–85. [Google Scholar]
- Hammer, M.; Holmlund, C.M.; Aqvist, M. Social-ecological feedback links for ecosystem management: A case study of fisheries in the Central Baltic Sea archipelago. Ocean Coast. Manag 2003, 46, 527–545. [Google Scholar]
- De Groot, R. A typology for the classification, description and valuation of ecosystem functions, goods and services. Ecol. Econ 2002, 41, 393–408. [Google Scholar]
- Ronnback, P.; Crona, B.; Ingwall, L. The return of ecosystem goods and services in replanted mangrove forests: Perspectives from local communities in Kenya. Environ. Conserv 2007, 34, 313–324. [Google Scholar]
- Seto, K.C.; Fragkias, M. Mangrove conversion and aquaculture development in Vietnam: A remote sensing-based approach for evaluating the Ramsar Convention on Wetlands. Glob. Environ. Change 2007, 17, 486–500. [Google Scholar]
- Badola, R.; Hussain, S.A. Valuing ecosystem functions: an empirical study on the storm protection function of Bhitarkanika mangrove ecosystem, India. Environ. Conserv 2005, 32, 85–92. [Google Scholar]
- Dahdouh-Guebas, F.; Jayatissa, L.P.; Di Nitto, D.; Bosire, J.O.; Lo Seen, D.; Koedam, N. How effective were mangroves as a defence against the recent tsunami? Curr. Biol 2005, 15, R443–7. [Google Scholar]
- Barbier, E.B. Natural barriers to natural disasters: replanting mangroves after the tsunami. Front. Ecol. Environ 2006, 4, 124–131. [Google Scholar]
- Gstaiger, V.; Huth, J.; Gebhardt, S.; Kuenzer, C. Multi-sensoral and automated derivation of inundated areas using TerraSAR-X and ENVISAT ASAR data. Int. J. Remote Sens 2012, 33, 37–41. [Google Scholar]
- Bann, C. The Economic Valuation of Tropical Forest Land Use Options: A Manual for Researchers; Economy and Environment Program for Southest Asia: Singapore, 1997. [Google Scholar]
- Walters, B.B.; Rönnbäck, P.; Kovacs, J.M.; Crona, B.; Hussain, S.A.; Badola, R.; Primavera, J.H.; Barbier, E.; Dahdouh-Guebas, F. Ethnobiology, socio-economics and management of mangrove forests: A review. Aquat. Bot 2008, 89, 220–236. [Google Scholar]
- Primavera, J.H. The values of wetlands: landscape and institutional development and conservation of Philippine mangroves: Institutional issues. Ecol. Econ 2000, 35, 91–106. [Google Scholar]
- Penha-Lopes, G.; Bartolini, F.; Limbu, S.; Cannicci, S.; Mgaya, Y.; Kristensen, E.; Paula, J. Ecosystem engineering potential of the gastropod Terebralia palustris (Linnaeus, 1767) in mangrove wastewater wetlands—A controlled mesocosm experiment. Environ. Pollut 2010, 158, 258–266. [Google Scholar]
- Rönnbäck, P. The ecological basis for economic value of seafood production supported by mangrove ecosystems. Ecol. Econ 1999, 29, 235–252. [Google Scholar]
- Costanza, R.; d’Arge, R.; De Groot, R.; Farber, S.; Grasso, M.; Hannon, B.; Limburg, K.; Naeem, S.; O’Neill, R.V.; Paruelo, J.; et al. The value of the world’s ecosystem services and natural capital. Nature 1997, 387, 253–260. [Google Scholar]
- Tue, N.T.; Ngoc, N.T.; Quy, T.D.; Hamaoka, H.; Nhuan, M.T.; Omori, K. A cross-system analysis of sedimentary organic carbon in the mangrove ecosystems of Xuan Thuy National Park, Vietnam. J. Sea Res 2012, 67, 69–76. [Google Scholar]
- Valiela, I.; Bowen, J.L.; York, J.K. Mangrove forests: One of the world’ s threatened major tropical environments. BioScience 2001, 51, 807–815. [Google Scholar]
- Alongi, D.M. Mangrove forests: Resilience, protection from tsunamis, and responses to global climate change. Estuar. Coast. Shelf Sci 2008, 76, 1–13. [Google Scholar]
- Barbier, E.; Cox, M. Economic and demographic factors affecting mangrove loss in the coastal provinces of Thailand, 1979–1996. Ambio 2002, 31, 351–357. [Google Scholar]
- Huth, J.; Kuenzer, C.; Wehrmann, T.; Gebhardt, S.; Tuan, V.Q.; Dech, S. Land cover and land use classification with TWOPAC: Towards automated processing for pixel- and object-based image classification. Remote Sens 2012, 4, 2530–2553. [Google Scholar]
- Kuenzer, C.; Renaud, F.G. Climate Change and Environmental Change in River Deltas Globally: Expected Impacts, Reilience, and Adaptation. In The Mekong Delta System—Interdisciplinary Analyses of a River Delta; Springer: Rotterdam, The Netherlands, 2012; pp. 7–48. [Google Scholar]
- Binh, T.N.K.; Vromant, N.; Hung, N.T.; Hens, L.; Boon, E.K. Land cover changes between 1968 and 2003 in Cai Nuoc, Ca Mau Peninsula, Vietnam. Area 2003, 7, 519–536. [Google Scholar]
- Green, E.P.; Cb, C.; Clark, C.D.; Mumby, P.J.; Edwards, A.J.; Ne, T.; Ellis, A.C. Remote sensing techniques for mangrove mapping. Int. J. Remote Sens 1998, 19, 935–956. [Google Scholar]
- Rasolofoharinoro, M.; Blasco, F. A remote sensing based methodology for mangrove studies in Madagascar. Int. J. Remote Sens 1998, 19, 1873–1886. [Google Scholar]
- Tong, P.H.S.; Auda, Y.; Populus, J.; Aizpuru, M.; Al Habshi, A.; Al Blasco, F. Assessment from space of mangroves evolution in the Mekong delta, in relation with extensive shrimp-farming. Int. J. Remote Sens 2004, 25, 4795–4812. [Google Scholar]
- Thu, P.M.; Populus, J. Status and changes of mangrove forest in Mekong Delta: Case study in Tra Vinh, Vietnam. Estuar. Coast. Shelf Sci 2007, 71, 98–109. [Google Scholar]
- Kamal, M.; Phinn, S. Hyperspectral data for mangrove species mapping: A comparison of pixel-based and object-based approach. Remote Sens 2011, 3, 2222–2242. [Google Scholar]
- Lee, T.; Yeh, H. Applying remote sensing techniques to monitor shifting wetland vegetation: A case study of Danshui River estuary mangrove communities, Taiwan. Ecol. Eng 2008, 5, 487–496. [Google Scholar]
- Béland, M.; Goïta, K.; Bonn, F.; Pham, T.T.H. Assessment of land-cover changes related to shrimp aquaculture using remote sensing data: A case study in the Giao Thuy District, Vietnam. Int. J. Remote Sens 2006, 27, 1491–1510. [Google Scholar]
- Hölbling, D.; Füreder, P.; Antolini, F.; Cigna, F.; Casagli, N.; Lang, S. A semi-automated object-based approach for landslide detection validated by persistent scatterer interferometry measures and landslide inventories. Remote Sens 2012, 4, 1310–1336. [Google Scholar]
- Polychronaki, A.; Gitas, I.Z. Burned area mapping in Greece using SPOT-4 HRVIR images and object-based image analysis. Remote Sens 2012, 4, 424–438. [Google Scholar]
- Polychronaki, A.; Gitas, I.Z. The development of an operational procedure for burned-area mapping using object-based classification and ASTER imagery. Int. J. Remote Sens 2010, 31, 1113–1120. [Google Scholar]
- Dupuy, S.; Barbe, E.; Balestrat, M. An object-based image analysis method for monitoring land conversion by artificial sprawl use of RapidEye and IRS data. Remote Sens 2012, 4, 404–423. [Google Scholar]
- Lamonaca, A.; Corona, P.; Barbati, A. Exploring forest structural complexity by multi-scale segmentation of VHR imagery. Remote Sens. Environ 2008, 112, 2839–2849. [Google Scholar] [Green Version]
- Conchedda, G.; Durieux, L.; Mayaux, P. An object-based method for mapping and change analysis in mangrove ecosystems. ISPRS J. Photogramm 2008, 63, 578–589. [Google Scholar]
- Wang, L.; Sousa, W.P.; Gong, P. Integration of object-based and pixel-based classification for mapping mangroves with IKONOS imagery. Int. J. Remote Sens 2004, 25, 5655–5668. [Google Scholar]
- Heumann, B.W. An object-based classification of mangroves using a hybrid decision tree—Support vector machine approach. Remote Sens 2011, 3, 2440–2460. [Google Scholar]
- Myint, S.W.; Giri, C.P.; Wang, L.; Zhu, Z.; Gillette, S.C. Identifying mangrove species and their surrounding land use and land cover classes using an object-oriented approach with a lacunarity spatial measure. GIScience Remote Sens 2008, 45, 188–208. [Google Scholar]
- Hay, G.J.; Castilla, G.; Wulder, M.A.; Ruiz, J.R. An automated object-based approach for the multiscale image segmentation of forest scenes. Int. J. Appl. Earth Obs. Geoinf 2005, 7, 339–359. [Google Scholar]
- Kuenzer, C.; Campbell, I.; Roch, M.; Leinenkugel, P.; Vo, Q.T.; Dech, S. Understanding the impacts of hydropower developments in the context of upstream-downstream relations in the Mekong River Basin. Sustainability Science 2012, 11, 1–20. [Google Scholar]
- Clough, B.; Tan, D.T.; Phuong, D.X.; Buu, D.C. Canopy leaf area index and litter fall in stands of the mangrove Rhizophora apiculata of different age in the Mekong Delta, Vietnam. Aquat. Bot 2000, 66, 311–320. [Google Scholar]
- Leinenkugel, P.; Esch, T.; Kuenzer, C. Settlement detection and impervious surface estimation in the Mekong Delta using optical and SAR remote sensing data. Remote Sens. Environ 2011, 115, 3007–3019. [Google Scholar]
- Evers, H.-D.; Benedikter, S. Strategic Group Formation in the Mekong Delta—The Development of a Modern Hydraulic Society. In ZEF Working Paper Series No 35; Center for Development Research (ZEF), University of Bonn: Bonn, Germany, 2009. [Google Scholar]
- Gebhardt, S.; Huth, J.; Nguyen, L.D.; Kuenzer, C. A comparison of TerraSAR-X Quadpol backscattering with RapidEye multispectral vegetation indices over rice fields in the Mekong Delta, Vietnam. Int. J. Remote Sens 2012, 33, 37–41. [Google Scholar]
- Goverment of Vietnam General Statistics Office. Available online: www.gso.gov.vn (accessed on 20 August 2012).
- Corps, C. Case Study 2: Mangrove Conservation vs. Shrimp Farming in Thailand. 2007, pp. 1–4. Available online: http://vancouveraccord.org/resources (accessed on 20 August 2012).
- Lebel, L.; Tri, N.H.; Saengnoree, A.; Pasong, S.; Buatama, U.; Thoa, L.K. Industrial transformation and shrimp aquaculture in Thailand and Vietnam: pathways to ecological, social, and economic sustainability? Ambio 2002, 31, 311–23. [Google Scholar]
- Government of Vietnam. Mangrove Forest Area. Available online: www.kiemlam.org.vn (accessed on 25 June 2011).
- Kovacs, J.M.; Flores-verdugo, F.; Wang, J.; Aspden, L.P. Estimating leaf area index of a degraded mangrove forest using high spatial resolution satellite data. Aquat. Bot 2004, 80, 13–22. [Google Scholar]
- Vaiphasa, C.; Ongsomwang, S.; Vaiphasa, T.; Skidmore, A.K. Tropical mangrove species discrimination using hyperspectral data: A laboratory study. Estuar. Coast. Shelf Sci 2005, 65, 371–379. [Google Scholar]
- Christensen, S.M.; Tarp, P.; Hjortsø, C.N. Mangrove forest management planning in coastal buffer and conservation zones, Vietnam: A multimethodological approach incorporating multiple stakeholders. Ocean Coast. Manag. 2008, 51, 712–726. Goverment of Vietnam. The Rule for Land Use and Natural Resource Utilization Based on the Decision No. 116/1999/QD-TTg of 3 March 1999 for Reforestation of Mangrove Forest in Ca Mau, Bac Lieu, Soc Trang and Tra Vinh Provinces. 1999; pp. 3–4. Available online: http://vbqppl.moj.gov.vn/vbpq/Lists/Vn%20bn%20php%20lut/View_Detail.aspx?ItemID=5538 (accessed on 25 June 2011). [Google Scholar]
- Richter, R.; Schläpfer, D. Atmospheric/Topographic Correction for Satellite Imagery; DLR Report DLR-IB 565-02/11; DLR: Wessling, Germany, 2011; p. 202. [Google Scholar]
- eCognition 8.7 Image Analysis Software. Trimble: Munich, Germany. Available online: http://www.ecognition.com/ (accessed on 25 June 2011).
- Baatz, M.; Benz, U.; Dehghani, S.; Heynen, M.; Astrid, H.; Hofmann, P.; Lingenfelder, I.; Mimler, M.; Sohlbach, M.; Weber, M.; Willhauck, G. User Guide 4—Introducing Ecognition Elements. 2004. Available online: www.gis.unbc.ca/help/software/ecognition4/ELuserguide.pdf (accessed on 25 June 2011).
- Baatz, M.; Schäpe, A. Multiresolution Segmentation: An Optimization Approach for High Quality Multi-Scale Image Segmentation. In Angewandte Geographische Informationsverarbeitung XII: Beiträge zum AGIT-Symposium Salzburg 2000 (German Edition); Strobl, J., Blaschke, T., Griesebner, G., Eds.; Wichmann-Verlag: Heidelberg, Germany, 2000; pp. 12–23. [Google Scholar]
- Congalton, R.; Green, K. Assessing the Accuracy of Remotely Sensed Data: Principles and Practices; CRC Press: Boca Raton, FL, USA, 2009; p. 183. [Google Scholar]
- Hansen, M.C.; Townshend, J.R.G.; DeFries, R.S.; Carroll, M. Estimation of tree cover using MODIS data at global, continental and regional/local scales. Int. J. Remote Sens 2005, 26, 4359–4380. [Google Scholar]
- Montesano, P.M.; Nelson, R.; Sun, G.; Margolis, H.; Kerber, a.; Ranson, K.J. MODIS tree cover validation for the circumpolar taiga–tundra transition zone. Remote Sens. Environ 2009, 113, 2130–2141. [Google Scholar]
- Ranson, K.J.; Montesano, P.M.; Nelson, R. Object-based mapping of the circumpolar taiga–tundra ecotone with MODIS tree cover. Remote Sens. Environ 2011, 115, 3670–3680. [Google Scholar]
Figure 1.
Overview of the Ca Mau province of the MD (SPOT5 data acquired on 24 March 2010, RGB = NIR-red-green).
Figure 1.
Overview of the Ca Mau province of the MD (SPOT5 data acquired on 24 March 2010, RGB = NIR-red-green).

Figure 2.
Mangrove distribution in Vietnam (Source: [54]).
Figure 2.
Mangrove distribution in Vietnam (Source: [54]).
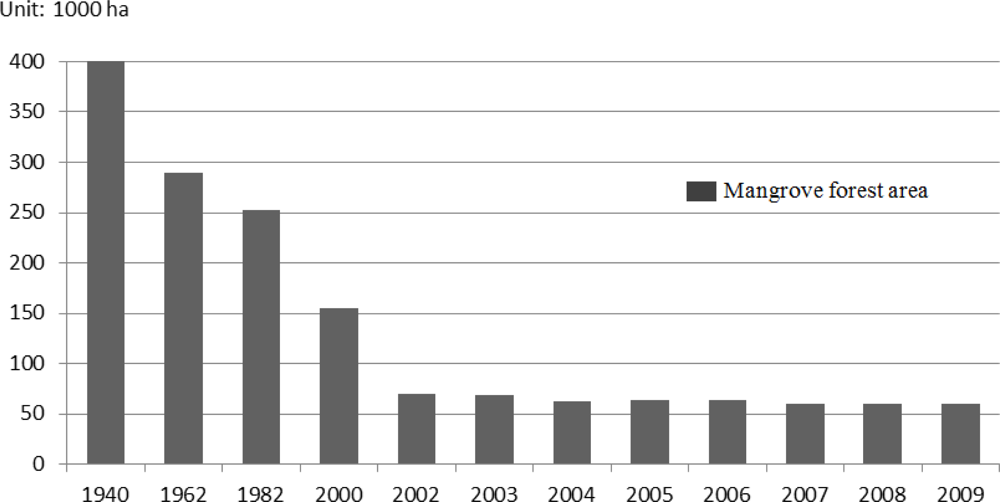
Figure 3.
Examples of different mangrove cover and schematic sketch of an integrated shrimp-mangrove farming system: (a) dense mangrove, more than 70%; (b) less dense mangrove forest: density 50% to 70%; (c) mixed mangrove and shrimp farming: density 30% to 50%; and (d) shrimp farming with less than 30% mangrove. (Source: own photographs, 2011).

Figure 4.
Segmentation layers and correspondence of super-objects to cadastral map.

Figure 5.
Object-based image analysis decision tree (rectangle = image; diamond = rule; oval = class).
Figure 5.
Object-based image analysis decision tree (rectangle = image; diamond = rule; oval = class).

Figure 6.
The distribution of validation points in the test area.
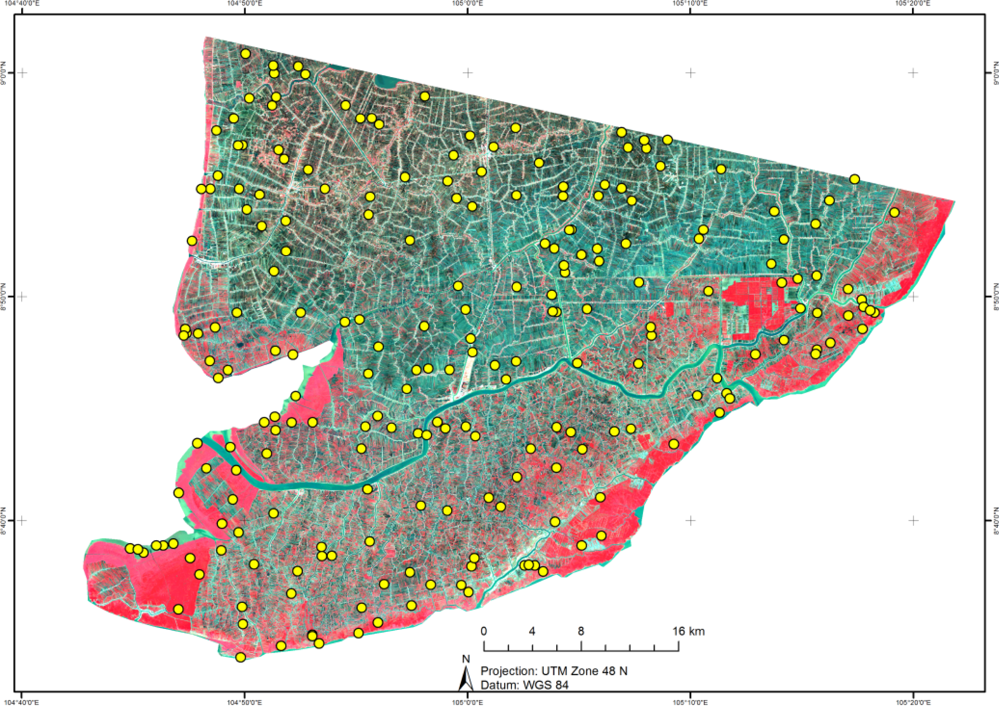
Figure 7.
Land cover classification results in Ca Mau province.
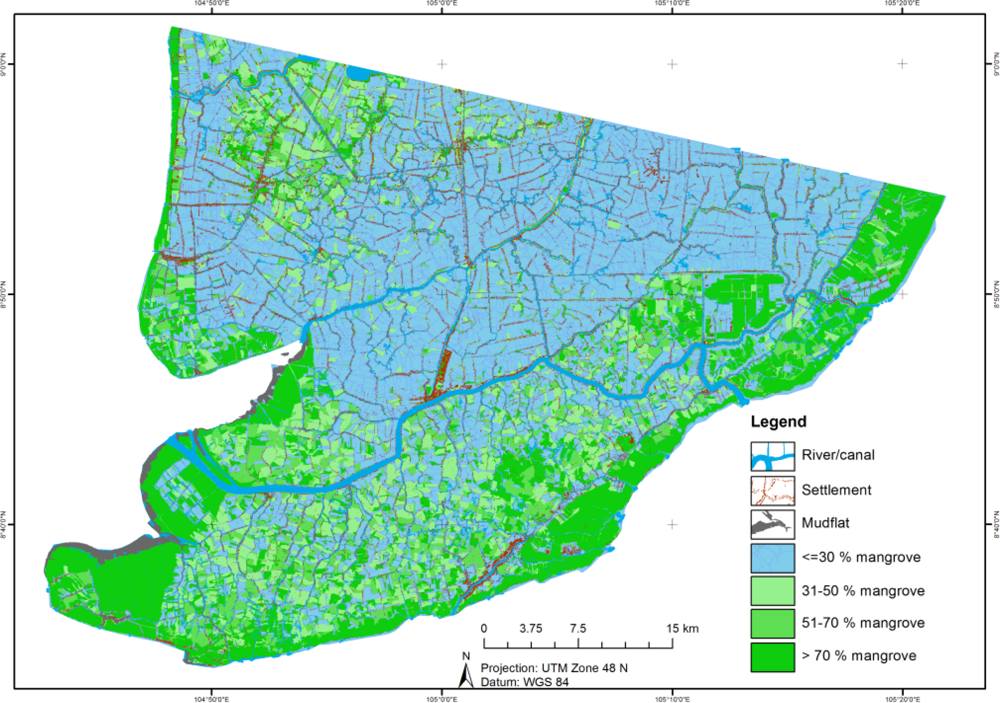
Figure 8.
(a) Developed object-based classification result derived from SPOT5, (b) VCF tree cover product derived from MODIS, (c) spatial agreement between two products, and (d) comparison between the two products in the area.
Figure 8.
(a) Developed object-based classification result derived from SPOT5, (b) VCF tree cover product derived from MODIS, (c) spatial agreement between two products, and (d) comparison between the two products in the area.


| SPOT-5 (HRG) | |
|---|---|
| Band Wavelength (nm) | 480–710 (pan) |
| 500–590 (green) | |
| 610–680 (red) | |
| 790–890 (NIR) | |
| 1580–1750 (mid IR) | |
| Spatial Resolution (m) | 2.5 × 2.5 (pan) |
| 10 × 10 (multi) | |
| Swath Width (km) | 60 |
| Revisit Time (days) | 26 |
| Sensor | SPOT-5 MS |
|---|---|
| Date | 24.03.2010 |
| Solar zenith angle (deg) | 27.3 |
| Solar azimuth angle (deg) | 105.0 |
| Sensor tilt angle (deg) | 19.7 |
| Sensor view azimuth angle (deg) | 102.5 |
| Water vapor category | Tropical |
| Aerosol type | Maritime |
| Average visibility (km) | 80.0 |
| ≤30% | 31%–50% | 51%–70% | >70% | River-Canal | Mudflat | Settle-Ment | Producers Accuracy | Users Accuracy | |
|---|---|---|---|---|---|---|---|---|---|
| ≤30% | 62 | 11 | 5 | 0 | 1 | 0 | 2 | 89.86% | 76.54% |
| 31%–50% | 3 | 16 | 10 | 1 | 0 | 0 | 1 | 53.33% | 51.61% |
| 51%–70% | 2 | 1 | 14 | 3 | 0 | 0 | 3 | 42.42% | 60.87% |
| >70% | 1 | 2 | 4 | 32 | 0 | 0 | 1 | 86.49% | 80.00% |
| River-canal | 1 | 0 | 0 | 0 | 17 | 0 | 1 | 94.44% | 89.47% |
| Mudflat | 0 | 0 | 0 | 0 | 0 | 10 | 0 | 100.00% | 100.00% |
| Settlement | 0 | 0 | 0 | 1 | 0 | 0 | 17 | 68.00% | 94.44% |
*Overall Classification Accuracy = 75.68%. Overall Kappa Statistics = 0.6975.
Share and Cite
MDPI and ACS Style
Vo, Q.T.; Oppelt, N.; Leinenkugel, P.; Kuenzer, C. Remote Sensing in Mapping Mangrove Ecosystems — An Object-Based Approach. Remote Sens. 2013, 5, 183-201. https://doi.org/10.3390/rs5010183
AMA Style
Vo QT, Oppelt N, Leinenkugel P, Kuenzer C. Remote Sensing in Mapping Mangrove Ecosystems — An Object-Based Approach. Remote Sensing. 2013; 5(1):183-201. https://doi.org/10.3390/rs5010183
Chicago/Turabian StyleVo, Quoc Tuan, Natascha Oppelt, Patrick Leinenkugel, and Claudia Kuenzer. 2013. "Remote Sensing in Mapping Mangrove Ecosystems — An Object-Based Approach" Remote Sensing 5, no. 1: 183-201. https://doi.org/10.3390/rs5010183