4.1. Crop Mask and Sources
The resulting crop mask is delivered in Geographic projection (WGS84) at a spatial resolution of 0.00208333 degrees (equivalent to 233 m at the equator). It is publicly available for download at the following address: ftp://mars.jrc.ec.europa.eu/Public/cropmask/.
Figure 1 shows the source that has been used for each pixel as well as the number of datasets that were available (Globcover included). Of the 44 countries with significant cropland areas, 23 are covered by a dataset derived from Landsat images, three are covered by regional land cover products and 18 by a global land cover product (Globcover). For eight countries (Burkina Faso, Chad, Mali, Mauritania, Mozambique, Niger, Tanzania and Zimbabwe), two or three Landsat-based products were available and it was thus necessary to compare carefully the different cropland maps. Based on the knowledge of experts and high resolution images (GE), either the best product was selected or the classes derived from different products were spatially combined.
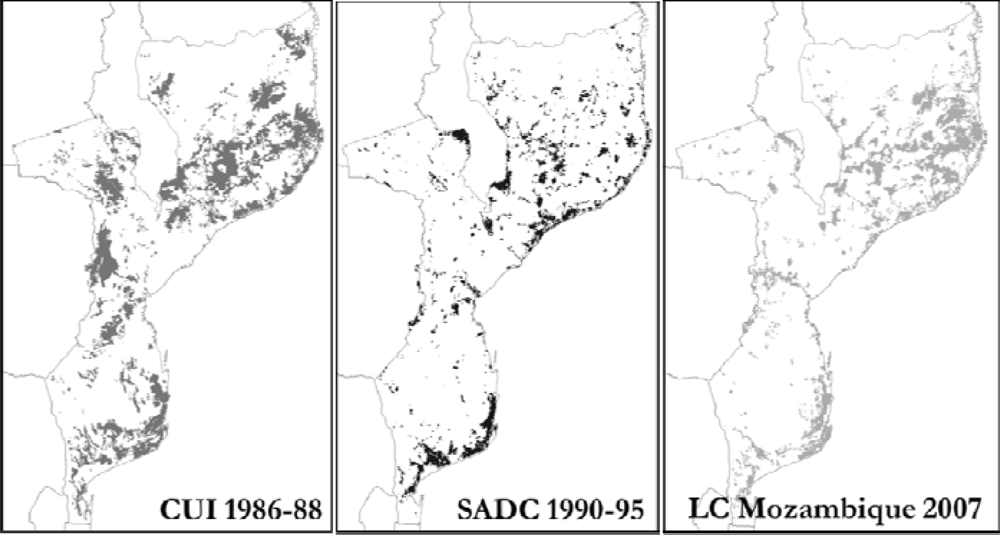
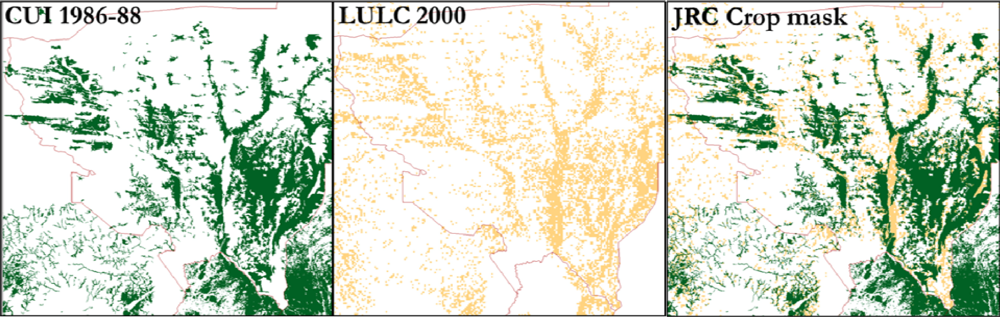
For Mozambique, three products were available (
Figure 2): the Cropland Use Intensity dataset (USGS 1986–1988), the SADC land cover database (CSIR, South-Africa) and the land cover of Mozambique (the National Directorate of Land and Forests (DNTF)). According to the experts and the visual analysis with GE, the SADC product was missing cropland areas mainly in the Nampula region (North-East) and in the Manica region (from Manica to Chimoio, Center of the country), which disqualified the product for selection. However, the choice between the two other products was not obvious. An overestimation of the cropland areas has been observed in the CUI dataset whereas some crops were missing in the DNTF dataset, in particular in the regions of Tete and Nampula. As no product seemed better than the other one (and the best probably is somewhere between the two products), priority was given to the most recent product,
i.e., the DNTF dataset.
For West African countries covered by the CUI dataset and the LULC 2000 (Burkina Faso, Chad, Mali, Mauritania, and Niger), the cropland classes of both products were found to miss important cropland areas. Fortunately, a meticulous analysis of both products showed that the nature of the omissions is different and that they appear to be complementary. In the CUI dataset (1986–1988), the images used are outdated especially for agriculture as cultivated areas expanded considerably in these areas during the last 20 years. In the LULC dataset, omission errors have also been observed most likely due to the coarse resolution (2 km) of the available product (the original product is at 30 m but is not available). Therefore, both datasets have been combined and a better product has been obtained.
Figure 3 shows an example of this spatial combination for South-West Niger.
In Tanzania, the Africover dataset was preferred to the SADC dataset, mainly because important cropland areas were missing in the SADC product, notably in the region of Dodoma between Lake Rukwa and the border with Zambia (South-West), and in the North-East of Lake Tanganyika close to the border with Burundi.
For Zimbabwe and Malawi, based on comparison with high resolution images (GE), the SADC map was preferred to the CUI dataset as omission and commission errors were observed in the latter. For instance in Malawi, few cropland areas were identified in the Lilongwe districts (around the capital) whereas GE imagery clearly shows cultivated areas. On the other end of the spectrum, the Dzalanyama Forest (in the West of Lolongwe) and the Majete Wildlife Reserve (in the South) were partially identified as crops.
In the Democratic Republic of the Congo (DRC), the Africover dataset seemingly misses vast cropland areas. Some of those areas are labeled as pure and mixed cropland classes in the DRC map based on SPOT VEGETATION time series [
14] and are combined within the cropland areas of the Africover dataset.
For the countries where Globcover and only one Landsat-based product were available, the Landsat-derived product was selected. These countries are (i) Burundi, Egypt, Eritrea, Kenya, Rwanda, Somalia, Sudan, and Uganda, covered by Africover, (ii) South-Africa, covered by the SADC dataset, (iii) Senegal, covered by the GLCN dataset, (iv) Ethiopia with the Woody Biomass product and (v) Zambia, covered by the CUI dataset.
In Nigeria, the Globcover and another product derived from MODIS data were available (MODIS-JRC, [
15]). The second product was preferred to the first because (i) of the better spatial resolution and (ii) of the classification methodology, which focuses on agricultural lands.
Finally, the crop mask derived from Globcover (classes 10 and 20, plus class 30 for the equatorial countries) was used for the remaining countries.
4.2. Validation
4.2.1. Qualitative Assessment
The first step in the validation process of the three cropland products,
i.e., MARS-JRC and the maps produced by Pittman
et al.[
3] (referred to hereafter as Global Croplands) and the IIASA African cropland product beta version of Fritz
et al.[
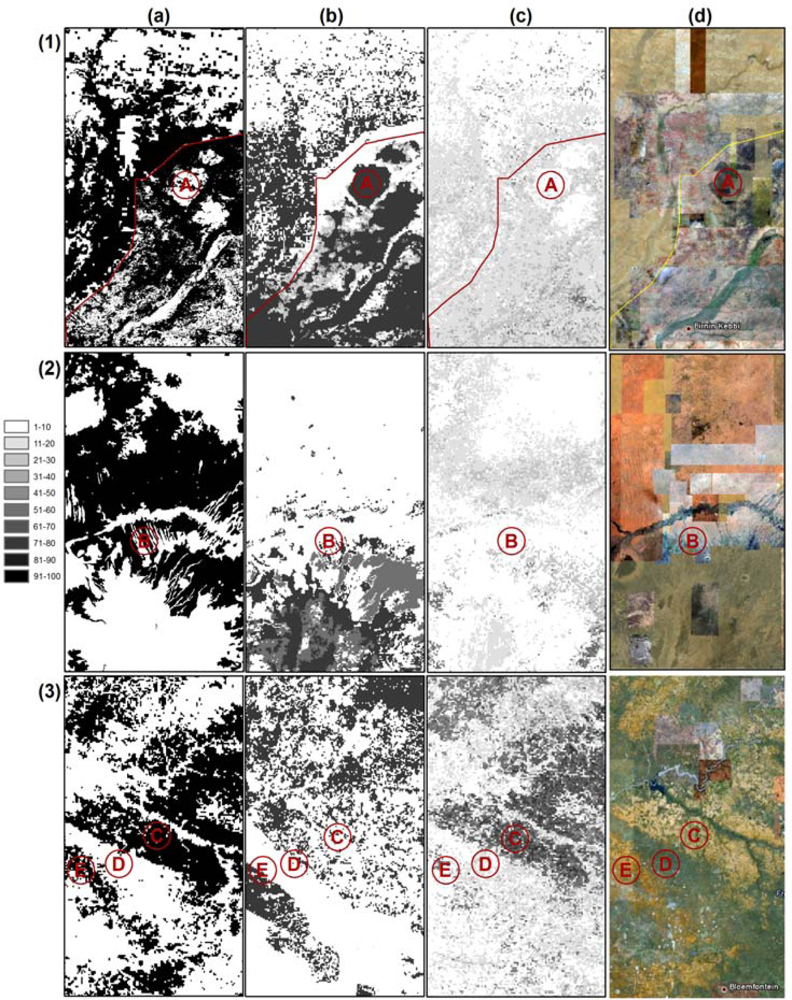
11] (referred to hereafter as the IIASA product), is an expert visual assessment assisted by high resolution images available on GE. For this purpose, vast territories, randomly distributed throughout Africa, have been visually analyzed, from which three regions,
i.e., Niger/Nigeria, Sudan, and South Africa (
Figure 4) have been selected to be the focus of this section. These regions are characterized by (i) substantial discrepancies between the three cropland maps, (ii) cultivated areas that can be spotted with high confidence levels using GE imagery and (iii) a large spectrum of agricultural intensity, from extensive farming in Sudan to intensive farming in South Africa. The observed differences between the three products are:
For Nigeria (1) and Sudan (2), the IIASA product appears as the inverse of the two other products from what can be observed on GE images. For instance, in Nigeria, the west Tangaza Forest Reserve, characterized by a savannah land cover (see A at
Figure 4), has been classified as crops in the IIASA product while the surrounding cropland areas have been classified as natural vegetation. The use of Globcover and GLC2000, which do not have agriculture as their specific focus, in the IIASA product, may explain these mis-interpretations. The same is not observed in the other two products that correctly exclude/include the savannah and surrounding croplands in the crop mask. In Sudan, the IIASA product and the MARS-JRC product are based on the Africover dataset. Therefore, we would have expected a similar result to the MARS-JRC crop mask. However, the product is missing cropland areas in the North and overestimates crop areas in the South.
The Global Croplands and the MARS-JRC products have similar patterns especially for regions (1), and (2) but the Global Croplands product shows a lower percentage of crops.
In Sudan, the MARS-JRC crop mask correctly depicts cropland areas south of the river, in particular the linear structures in the South of Umm Ruwaba,
i.e., the succession of crop and fallow areas (see B at the
Figure 4). These areas have not been detected by the two other products.
In South-Africa, the MARS-JRC and Global Croplands crop masks identify the Hoopstad region (in light orange on GE, C at the
Figure 4), which is the richest maize-production district in South Africa, while it is missed by the IIASA product. However, the savannah area in the south of Hoopstad (in green on GE, D at the
Figure 4) and the cropland areas in the South of Christiana (in dark orange, E at the
Figure 4) are not well identified on the Global Croplands product as opposed to the MARS-JRC map and partially in the IIASA product.
Large discrepancies and sometimes inverted classifications have been observed between the three products. The largest errors primarily result from the use of global land cover products, where the thresholds are optimized for multi-class identification problems and are not specifically dedicated to agriculture. Moreover, coarse resolution data, which is suitable for global and continental products, performs worse than Landsat-derived datasets. Therefore, the use of a unique satellite image processing chain at the global scale, even when dedicated to agriculture like that of Global Croplands, cannot depict all the cropland areas of the globe with the same intensity, even if the spatial patterns are correct. Finally, the calibration using national statistics may induce errors whereas the satellite-derived map is correct (e.g., Africover in Sudan).
4.2.2. Consistency between Experts
Before proceeding to the quantitative accuracy assessment, which takes as reference the expert interpretations coming from the Geo-wiki tool, one has to evaluate the extent of the agreement between experts. Indeed, high accuracy levels are expected if and only if experts agree between them. Otherwise, divergences between the views of the experts should be taken into account in the interpretation of the results of the accuracy assessment.
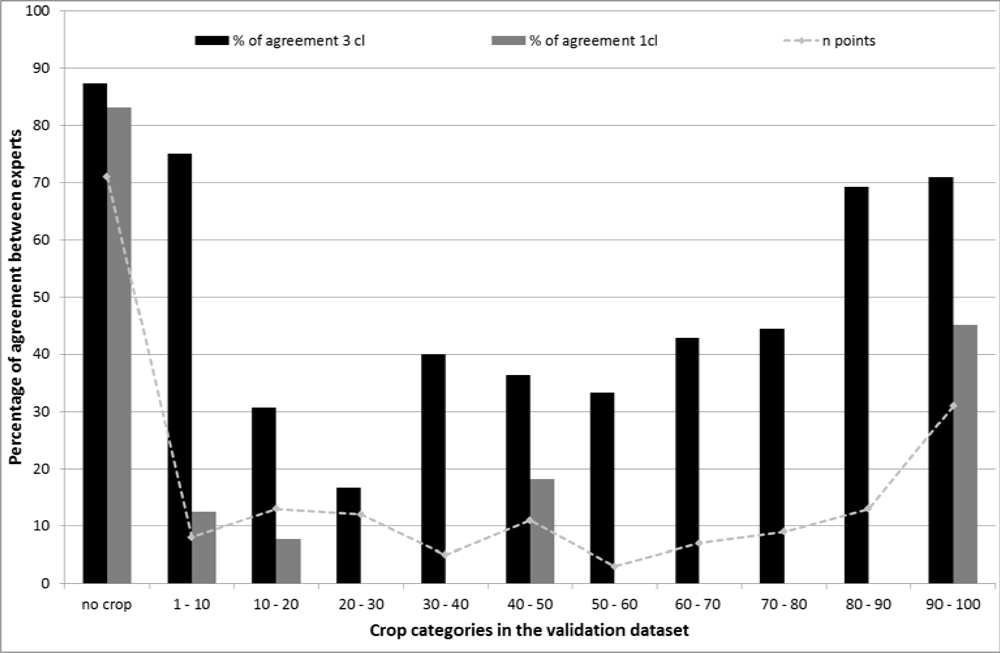
For the Niger-Nigeria validation window, the sampling was defined in order to have an overlap of 180 pixels between two experts, where both experts were confident regarding their interpretation of 130 pixels. For the remaining 50 pixels, at least one of the experts was unsure or did not give any interpretation. The percentage of agreement between both experts was computed in two ways: (i) for each category of percentage of croplands (% of agreement for 1 class), and (ii) given the difficulties of determining percentages in a 250 m box, by accepting confusions between neighboring percentage classes (% of agreement for 3 classes).
Figure 5 shows that higher agreement levels between experts are observed for classes with no or almost full agricultural coverage (90%–100%), with respectively 83.1% and 45.2% of agreement. It is worth noting that those classes are the ones most commonly represented—together they include 78.5% of the assessed pixels—as a consequence of the usual clustering of agricultural areas. However, agreement strongly deteriorates for classes with partial agricultural land coverage. Although the agreement estimates for those classes are quite unreliable given the fact each one has only 5 to 10 overlapping pixels, this can be taken as evidence of how difficult it is for a human being to assess the percentage of coverage.
This is confirmed by an increase in the percentage of agreement when confusions between neighboring classes are not taken as errors (dark bars). Although higher agreement levels are still observed for classes with high or low agricultural coverage, a significant increase in the agreement is observed for all intermediate classes.
Table 4 presents the agreements and disagreements between experts and for each category. For 13 pixels, the disagreement is high as a difference of at least 50% is observed between the percentages given by the two experts. These results highlight the difficulty to map different agricultural land use intensities, even with labor intensive procedures such as visual interpretation, in particular in semi-arid areas. Despite the use of high resolution imagery and visual interpretation, experts only agree on the extreme intensity values. When considering only two classes of presence (more than 50%) and absence (less than 30%), the level of consistency between experts is respectively 65.1% and 70.2%, which is acceptable for the validation process if we consider only these classes of low and high crop densities (see confusion matrixes in
Table 5).
4.2.3. Accuracy Assessment
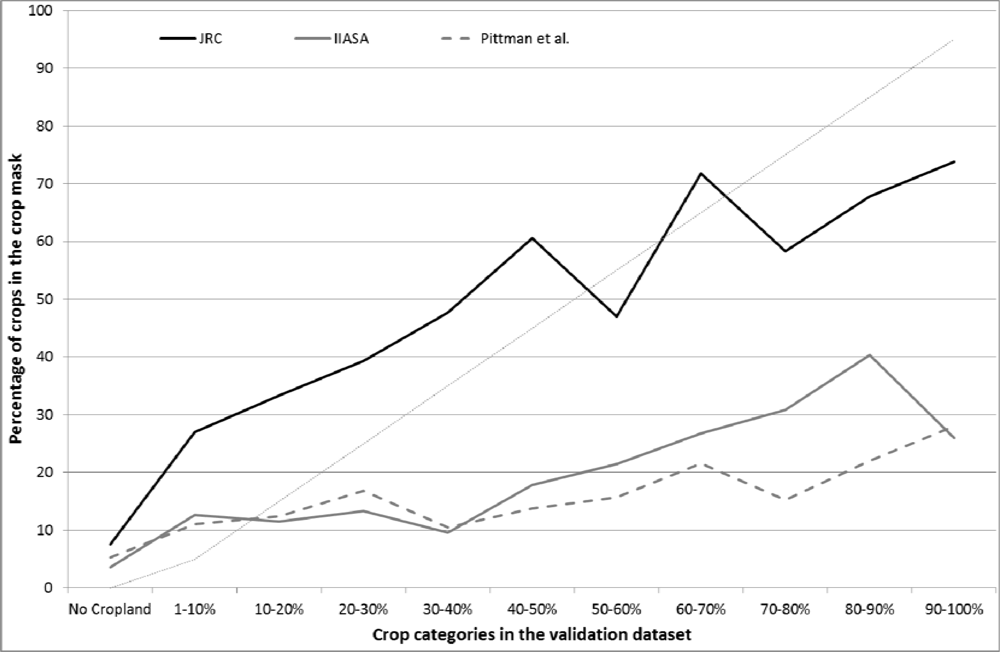
The percentage of pixels detected as cropland for the three crop masks is plotted in
Figure 6 against each category of crop coverage intensity for the African validation datasets (2,942 pixels). The more accurate a crop mask is, the closer it will be to the diagonal. Indeed, within the area of each crop coverage intensity class, the ideal crop mask is expected to provide the same percentage of crop coverage. However, given the inconsistencies between experts for the middle range classes and the limited number of validation pixels, especially for the Niger-Nigeria area, notable deviations are anticipated in this part of the graph.
Over Africa, the MARS-JRC crop mask performs remarkably better than the two other products. Indeed, while the IIASA Africa and the Global Croplands products appear to underestimate crop areas in all pixels having more than 30% of agricultural coverage (i.e., the point from which the lines start to steadily diverge from the diagonal), the MARS-JRC product better characterizes the increase on cropland surfaces. The deviation from the diagonal indicates a considerable underestimation, greater than 70% in the 90%–100% crop coverage class, for both the IIASA Africa and the Global Croplands crop masks, while the MARS-JRC product underestimates this crop cover class by roughly 30%. However, for the category “no cropland”, the three masks have a similar percentage of crops, i.e., between 3.5% and 7.7%.
The analysis of the consistency between experts presented in the last section motivates the next step in our assessment where confusion matrixes were calculated for the three assessed crop masks in the cases where the agricultural land intensity is converted to a binary variable based on the following three thresholds: 1%, 30% and 50% (
Table 5).
The MARS-JRC product appears to markedly better identify crops than the other products regardless of the threshold adopted. For example, the MARS-JRC product is able to detect between 46.7% to 65.1% of the cropland areas whereas the IIASA product detects between 32.8% to 39.4%. The Global Croplands product detects only 10.1% to 16.1% respectively with the thresholds 30 and 50% but it detects 99.3% of the cropland areas when aggregating all the crops from 1% to 100%. This happens because the majority of the values for the Global Croplands product vary between 1% and 10%. On the other hand, the IIASA and Global Croplands products suffer from smaller commission errors except for the Global Croplands products and the first category.
Although less validation pixels are available over the area covering Niger and Nigeria, some interesting results can be observed from the confusion matrices for the three types of aggregation (1%–100%, 30%–100%, 50%–100%) (
Table 6). A threshold of no crops-30 percent was chosen but it is not easy to detect cropland below this threshold using medium resolution remote sensing. However, particularly in areas of low population density and in areas of shifting cultivation, these lower percentages will occur. Future products, which are based on classification of Landsat [
17], should be able to detect these smaller scale cultivation patterns and it will be possible to lower this threshold for the validation.
The IIASA crop mask performs better than for Africa as a whole with better percentages than the MARS-JRC product for the “crops 1%–100%” class, and presents similar results for the second category (30%–100%). However, the MARS-JRC product better identifies crops than the other products for the third category (50%–100%) and always performs better for the “no crop” class. The Global Croplands product tends to underestimate the percentage of crops for the categories above 30% and 50% (9.8% and 3%) but less contamination errors are observed.
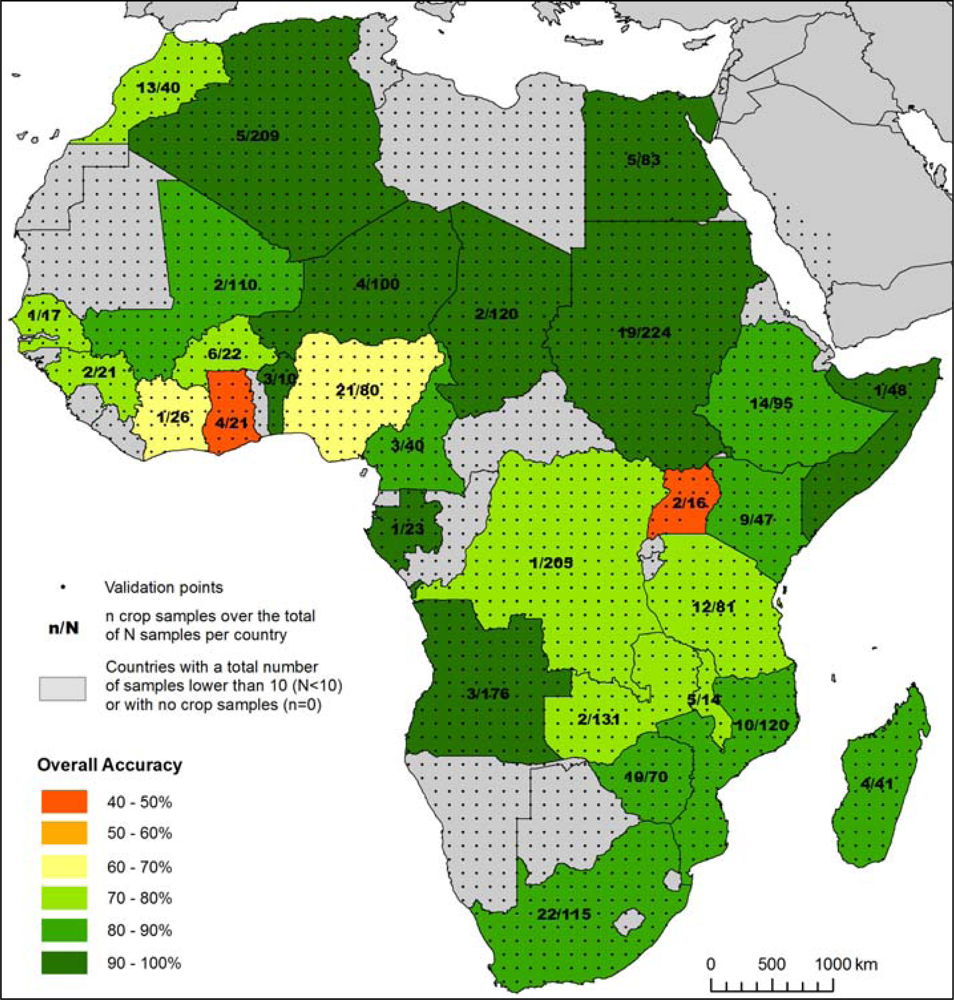
Finally, for the cropland map produced (MARS-JRC), the overall accuracy was computed for each country based on the two categories: no cropland (0–50%) and cropland (50%–100%). It was computed only for countries where the total number of samples (N) is at least 10 and at least one sample was interpreted by the validator as cropland,
i.e., cropland covers at least 50% of the 1 km pixel. The results are presented in
Figure 7. Due to the different sizes and different environmental conditions of each country,
Figure 7 should be interpreted with care, although it does provide a general overview of where the map is performing well. This figure shows that the overall accuracy per country is higher than 70% except for four countries,
i.e., Ghana, Uganda, Ivory Coast and Nigeria with an overall accuracy respectively of 42.8%, 43.7%, 65.4%, and 67.5%. For Uganda, this result may seem surprising since the cropland map for this country is based on the Africover dataset. However, the number of samples used for the validation is quite low (16) and only nine “no cropland (0–50%)” samples have been classified as cropland whereas the two unique crop samples have been well classified. Therefore, the accuracy figure should be interpreted with caution. For Ghana and Ivory Coast, the number of samples is also low (respectively 21 and 26). In addition, the cropland map is derived from Globcover. For Nigeria (accuracy of 67.5%), the datasets used are Globcover in the South and a MODIS-derived cropland classification in the northern part of the country. Even if the latter brings some improvements compared to Globcover, it remains a medium resolution product (250 m). It is also worth mentioning that few omission and contamination errors (for the category cropland 50%–100%) have been observed. Indeed omission errors are lower than 20% for all the countries where the number of crop samples is higher than five, except for six countries: Ethiopia (35.7%), Zimbabwe (35.7%), Kenya (44.4%), South Africa (45.4%), Nigeria (56.5%) and Morocco (61.7%). The sources used for these countries are Globcover for Morocco, medium-resolution datasets (250–300 m) for Nigeria and Landsat-derived datasets for the others. For four countries, these error percentages have to be interpreted with caution as the number of crop samples is lower than 15. Finally contamination errors,
i.e., the percentage of pixels classified as “no cropland” whereas it has been interpreted as “crops (50%–100%)” by the validator, are lower than 30% for all the countries where the total number of samples (N) is lower than ten, except for four countries: Ivory Coast (32%), Burkina Faso (38%), Ghana (59%), and Uganda (64%).


 and
and 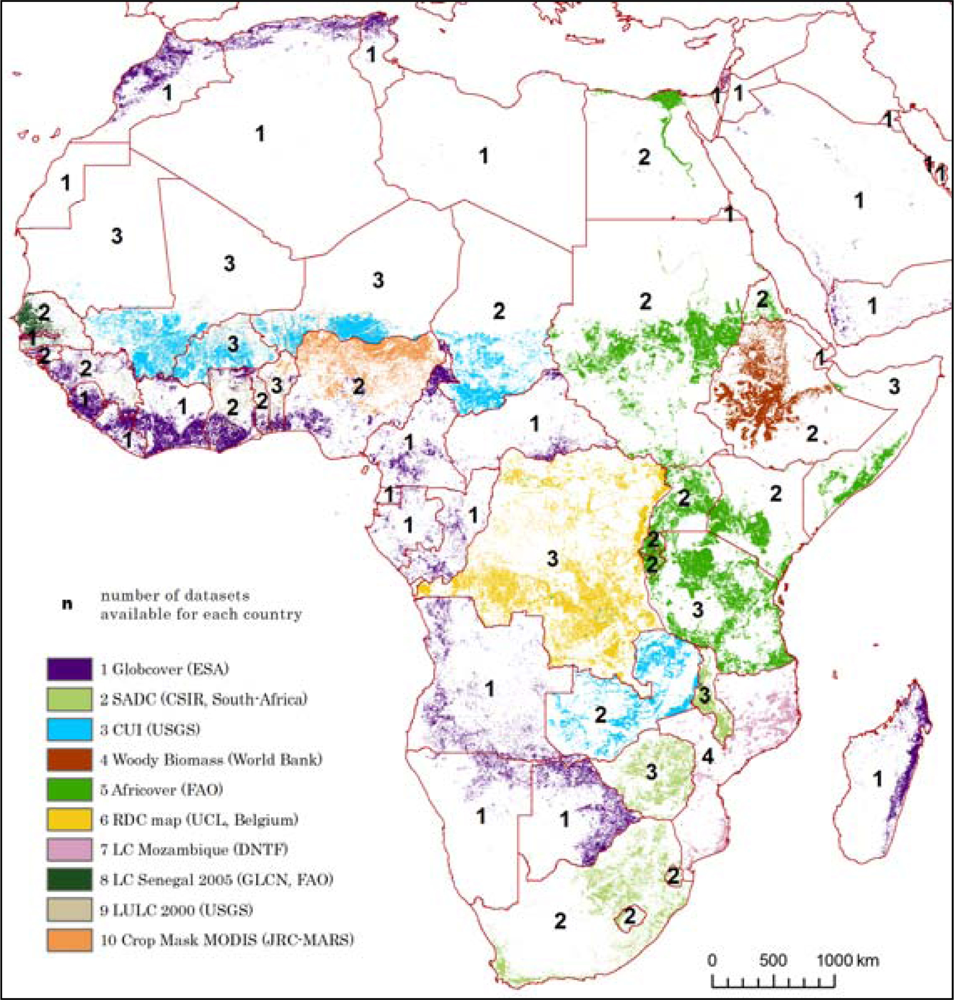


