Article

Monitoring Volumetric Surface Soil Moisture Content at the La Grande Basin Boreal Wetland by Radar Multi Polarization Data

1
Centre Eau Terre Environnement, Institut National de la Recherche Scientifique (INRS), 490 rue de la Couronne, Québec, QC G1K 9A9, Canada
2
Institut de Recherche d'Hydro-Québec, 1800 Boulevard Lionel Boulet, Varennes, QC J3X 1S1, Canada
*
Author to whom correspondence should be addressed.
Remote Sens. 2013, 5(10), 4919-4941; https://doi.org/10.3390/rs5104919
Submission received: 5 August 2013 / Revised: 22 September 2013 / Accepted: 23 September 2013 / Published: 9 October 2013

Abstract

:
Understanding the hydrological dynamics of boreal wetland ecosystems (peatlands) is essential in order to better manage hydropower inter-annual productivity at the La Grande basin (Northern Quebec, QC, Canada). Given the remoteness and the huge dimension of the La Grande basin, it is imperative to develop remote sensing monitoring techniques to retrieve hydrological parameters. The main objective of this study is to find out if multi-date and multi-polarization Radar Satellite 2 (RADARSAT-2) (C-band) image analysis could detect seasonal variations of surface soil moisture conditions of the acrotelm. A change detection approach through the use of multi temporal indexes was chosen based on the assumption that the temporal variability of surface roughness and natural vegetation biomass is generally at a much longer time scale than that of surface soil moisture (Δ-Index is based on a reference image that represents dry soil, in order to maximize the sensitivity of σ° to changes in soil moisture with respect to the same location when soil is wet). The Δ-Index approach was tested with each polarization: σ° for fully polarimetric mode (HH, HV, VV) and the cross-polarization coefficient (HV/HH). Results show that the best regression adjustment with regard to surface soil moisture content in boreal wetlands was obtained with the cross-polarization coefficient. The cross-polarization multi-temporal index enables precise volumetric surface soil moisture estimation and monitoring on boreal wetlands, regardless of the influence of vegetation cover and surface roughness conditions (bias was under 1%, standard deviation and RMSE were under 10% for almost all estimation errors). Surface soil moisture estimation was more precise over permanently flooded areas than seasonally flooded ones (standard deviation is systematically greater for the seasonally flooded areas, at all analyzed scales), although the overall quality of the estimation is still precise. Cross-polarization ratio image analysis appears to be a useful mean to exploit radar data spatially, as we were able to relate changes in wetland eco-hydrological dynamics to variations in the intensity of the ratio.

1. Introduction

Wetlands are fragile and complex ecosystems that provide many ecological, biological, and hydrological functions. They might have an important role in the regulation of water flow of the basin as they can retain or decelerate downstream contributions in rivers and tanks. In order to manage wetland resources efficiently, it is essential to have up-to-date information of wetland distribution and rates of change [1]. The inventory and the characterization of wetlands are an important stake from both an environmental and a socio-economic point of view. This importance is even greater for the province of Quebec, as the La Grande hydroelectric complex is responsible for almost 40% of its energy production. This vast basin (240,000 km2) has a high proportion of peatlands; which represents about 20% of its surface. The National Wetlands Working Group [2] reported that Canada has about 25% of the world’s wetland area (over 148 million ha). Boreal and subarctic peatlands cover ∼3.46 × 10⁶ km2 of the global land mass and represent 87% of the world’s peatlands [3].
Given the remoteness and the huge dimension of the La Grande basin, the use of ground survey methods for wetland mapping and regular updating is not practical [4,5]. Instead, satellite remote sensing has many advantages, including synoptic view, multi-spectral data collection, multi-temporal coverage and cost-effectiveness [6]. Therefore, satellite remote sensing is arguably the only practical approach that can map and monitor boreal wetlands in a timely manner. Synthetic Aperture Radar (SAR) images have an interesting potential for monitoring surface soil moisture content and water table dynamics in wetlands [7,8]. This has already been explored at the La Grande basin [912], under a low density of vegetation and a low incidence angle, for mapping wetland regions.
It is well known that radar sensor configuration and environmental parameters, within the resolution cell on the ground, affect the backscattering coefficient. In order to subtract the influence of the vegetation cover in radar backscatter applications on surface soil moisture, several studies have been carried out on agricultural bare soils [1320]. Nonetheless, boreal wetlands are very complex ecosystems, with frequent terrestrial and aquatic environments interconnected changes over the season. This surface dynamic implies a mixed response from the environment, which is not a favorable condition for the use of SAR images in soil moisture content estimation.
Co-polarization and cross-polarization ratios (HH/VV and HH/HV, respectively), from SAR images, are frequently used in soil moisture content estimation as a way to minimize the effect of surface roughness and/or vegetation on radar signal backscattering [13,2124]. The co-polarization ratio shows complete independence of the radar signal from the surface roughness [13,23,25]. Further, Holah et al. [26] showed that the cross-polarization ratio (HH/HV) weakly depends on surface roughness, regardless of the incidence angle, and a linear relationship with soil moisture ground measurements could be established. The slope of this relationship gets weaker as the incident angle gets higher, and at 40°–43° the cross-polarization ratio becomes independent of soil moisture.
Relative soil moisture content estimation from SAR images through the use of multi-temporal indexes for change detection may have better potential than an absolute estimation [27,28]. This approach is based on the assumption that the temporal variability of surface roughness and natural vegetation biomass is generally at a much longer time scale than that of soil moisture [29,30]. Thus, the change in SAR between repeat passes results from the change in soil moisture (with images acquired under similar satellite configuration and incidence angle). Two SAR indexes have been thus proposed, the Normalized Backscattering Soil Moisture Index (NBMI) [31] and the Delta Index (Δ-Index) [30]. NBMI is derived from σ° measurements at two times (t1 and t2) over one location, where
NBMI = σ ° t 1 + σ ° t 2 σ ° t 1 σ ° t 2
NBMI is an index appropriate for a range of soil moisture between 0% and 40%. Δ-Index is based on a reference image that represents dry soil (σ°dry), in order to maximize the sensitivity of σ° to changes in soil moisture with respect to the same location when soil is wet (σ°wet) obtained from imagery other than the reference image. Δ-Index and is defined as,
Δ index = | σ ° wet σ ° dry σ ° dry |
The objective of this study is to estimate volumetric surface soil moisture content of the acrotelm with the use of an empirical approach based on a multi-date and multi-polarimetric SAR index (RADARSAT-2 C-band). We focused here on the use of multi polarization data in spite of the availability of quadrature polarization (Quad-POL) images, since the limited spatial extent of the last (25 × 25 km2) does not allow an operational survey for such a huge territory (Figure 1). From here, a multi-scale spatial analysis is established to study the empirical approach at different levels of landscape aggregation.

2. Study Site

La Grande river basin is located in northwestern Quebec, Canada, which rises in the highlands of the north central part of the province and flows roughly 900 km west to drain into James Bay (Figure 1). It is the second largest river in Quebec, surpassed only by the Saint Lawrence River. The river has been extensively developed as a source of hydroelectric power by Hydro-Québec, starting in 1974. This hydroelectric complex generates about 40% of the Quebec’s needs in electricity.
La Grande river basin sits on the Canadian Shield, ancient Precambrian rocks that contain some of the oldest igneous rocks in the world (over 1 billion years). Most recently the topography of the Shield has been shaped by the successive ice ages, the last of which ended over 10,000 years ago and covered most of its territory in giant sheets of ice. The study area is located at “La Forge” site (Figure 1), to the upstream of the basin. It is a hilly relief over a drumlinoid glacial till, with a thick organic deposit. The direction of ice movement is illustrated by denoting the trends of drumlins (elongated or oval hills of glacial drift) from northeast to southwest [32].
The land cover of the basin is characterized by a high proportion of peatlands [33]. Peatlands are ecosystems in which the production of organic compounds has exceeded decomposition over thousands of years, resulting in a great accumulation over time of organic matter rich in carbon (peat) [1]. Peat-forming plants (coniferous and evergreen vegetation) are most prevalent in cold temperate boreal forest, with short summers and long winters, and podzolic upland soils.

3. Methodology and Data Sets

3.1. Ground Measurements

Two peatlands at the La Forge site (A and B) were instrumented to measure some hydrological parameters. A previous optical high resolution image (GeoEye) classification was used [34] to help delineate landscape units. Peatland seasonally flooded (SF) areas were separated from permanently flooded (PF) areas (SF polygons are in yellow and PF polygons in red, Figure 2). Those areas surrounding the pond of a peat bog where that water table is near the surface (or at the surface) for almost the whole year are called permanently flooded. Seasonally flooded areas are transitory zones from the aquatic (ponds and lakes) to the terrestrial (forest and lichen) landscape, where the water table is near the surface for some periods of time, depending on the hydrological cycle at the peatland.
Surface soil moisture (FDR probes, or “frequency domain reflectometry”) and water table depth (wells) were collected at both surveyed peatlands, as well as ground photos with a one hour frequency, only at peatland A (fixed ground camera, Figure 2). A data transfer error caused the loss of registered terrain information for almost the entire year of 2009.
FDR probes were established 5 cm under the soil surface or 5 cm under the interface, “vegetation cover-atmosphere” (when there was a foam cover). FDR probes measure soil’s dielectric properties (via the dielectric permittivity, Ka) and, thus, indirectly monitor soil water content. Levrel and Rousseau [35] determined a general equation Ka-hv for the study area, which is required to make specific FDR probe calibrations for organic soils (default calibrations consistently underestimated actual volumetric moisture contents). In the literature, it is possible to find equations connecting Ka to the volumetric water content (hv). However, most Ka-hv equations and FDR probes’ calibration methods are exclusively adapted to mineral soils (or partially organic soils), and they do not take into account the influence of bulk density variations on the recorded values of Ka [36,37].
There were four monitored areas at the study site: one set of seasonally flooded (SF) and permanently flooded (PF) areas for each monitored peatland. A spatial disaggregation of the landscape was used in this research (Table 1); from a detailed scale represented by permanently and seasonally flooded polygons in a given peatland, to a generalized approach, where all wetlands are comprised in a sole polygon.

3.2. Satellite Images

A set of 36 RADARSAT-2 images was acquired over two vegetative seasons (from May to October 2009 and May to November 2010), with the following configuration: C band wavelength (5.4 GHz or 5.6 cm); quad polarization; incidence angle range: Fine Quad (FQ)12 (from 31.5° to 32.9°), FQ16 (from 35.6° to 37.0°) and FQ20 (from 39.4° to 40.7°); resolution at azimuth: 5.2 m × 7.6 m; nominal pixel spacing: 4.7 m × 5.1 m; scene size: 25 km; descending orbit; direction of antenna: right looking (Table 2).
The data processing sequence is shown in Figure 3. At first, it includes RADARSAT-2 image processing. Once the multi-polarization coefficients are extracted, a geometric correction is applied with the use of a Digital Elevation Model and two corner reflectors (coordinates latitude/longitude, respectively: 54.1158/−72.5235 and 54.1109/−72.5096). Special attention was taken in this step in order to guarantee geographical coherence between spatial information from different sources: radar images and ground measurements, as well as optical images used as reference for landscape delineation.
In order to accentuate differences in backscattering with regard to changes in surface moisture conditions, the image difference or delta index approach (Δ-Index) [30] was used. To do so, each year’s reference image was selected using cumulated precipitation data. Two time period (5 and 10 days) were tested to calculate the cumulative precipitation prior to the image acquisition date. Since a 5 days’ time period allows a better separation of individual precipitation events (as shown in Figure 4), it was retained to characterize the hydrological status of each image and therefore, to select the “driest” one to be used as the reference image.
RADARSAT-2 images were regrouped by their incidence angle, keeping differences no longer than 4 degrees between them, as pointed out by Baghdadi et al. [17]. Two groups of images combined from their incidence angle were analyzed separately: FQ12 (32°) with FQ16 (36°), and FQ16 (36°) with FQ20 (40°).
An arithmetic mean for the radar backscattering coefficient was calculated in each polygon (as well for ground measurements, as the spatial analysis generalizes). A surface weighted mean was used for the water table depth measurements on permanently flooded peatland A, based on the characteristics of the area cover by each observation well: Site 2 for vegetated areas and Site 3 for the water pond (Figure 2).

4. Results

4.1. Ground Measurements

Statistics for the ground measurements for soil moisture FDR probes and water table wells show low variability in the data. Consequently, there are slight changes in those measured parameters during the time period monitored; a low standard deviation indicates that data values tend to be very close to the mean (Table 3). As expected, mean volumetric soil moisture is higher for permanently flooded wetlands, for each peatland monitored. Mean volumetric soil moisture values are significantly higher for peatland B than for peatland A. Inversely, mean water table depth values are deeper for peatland B, over permanently and seasonally flooded areas.
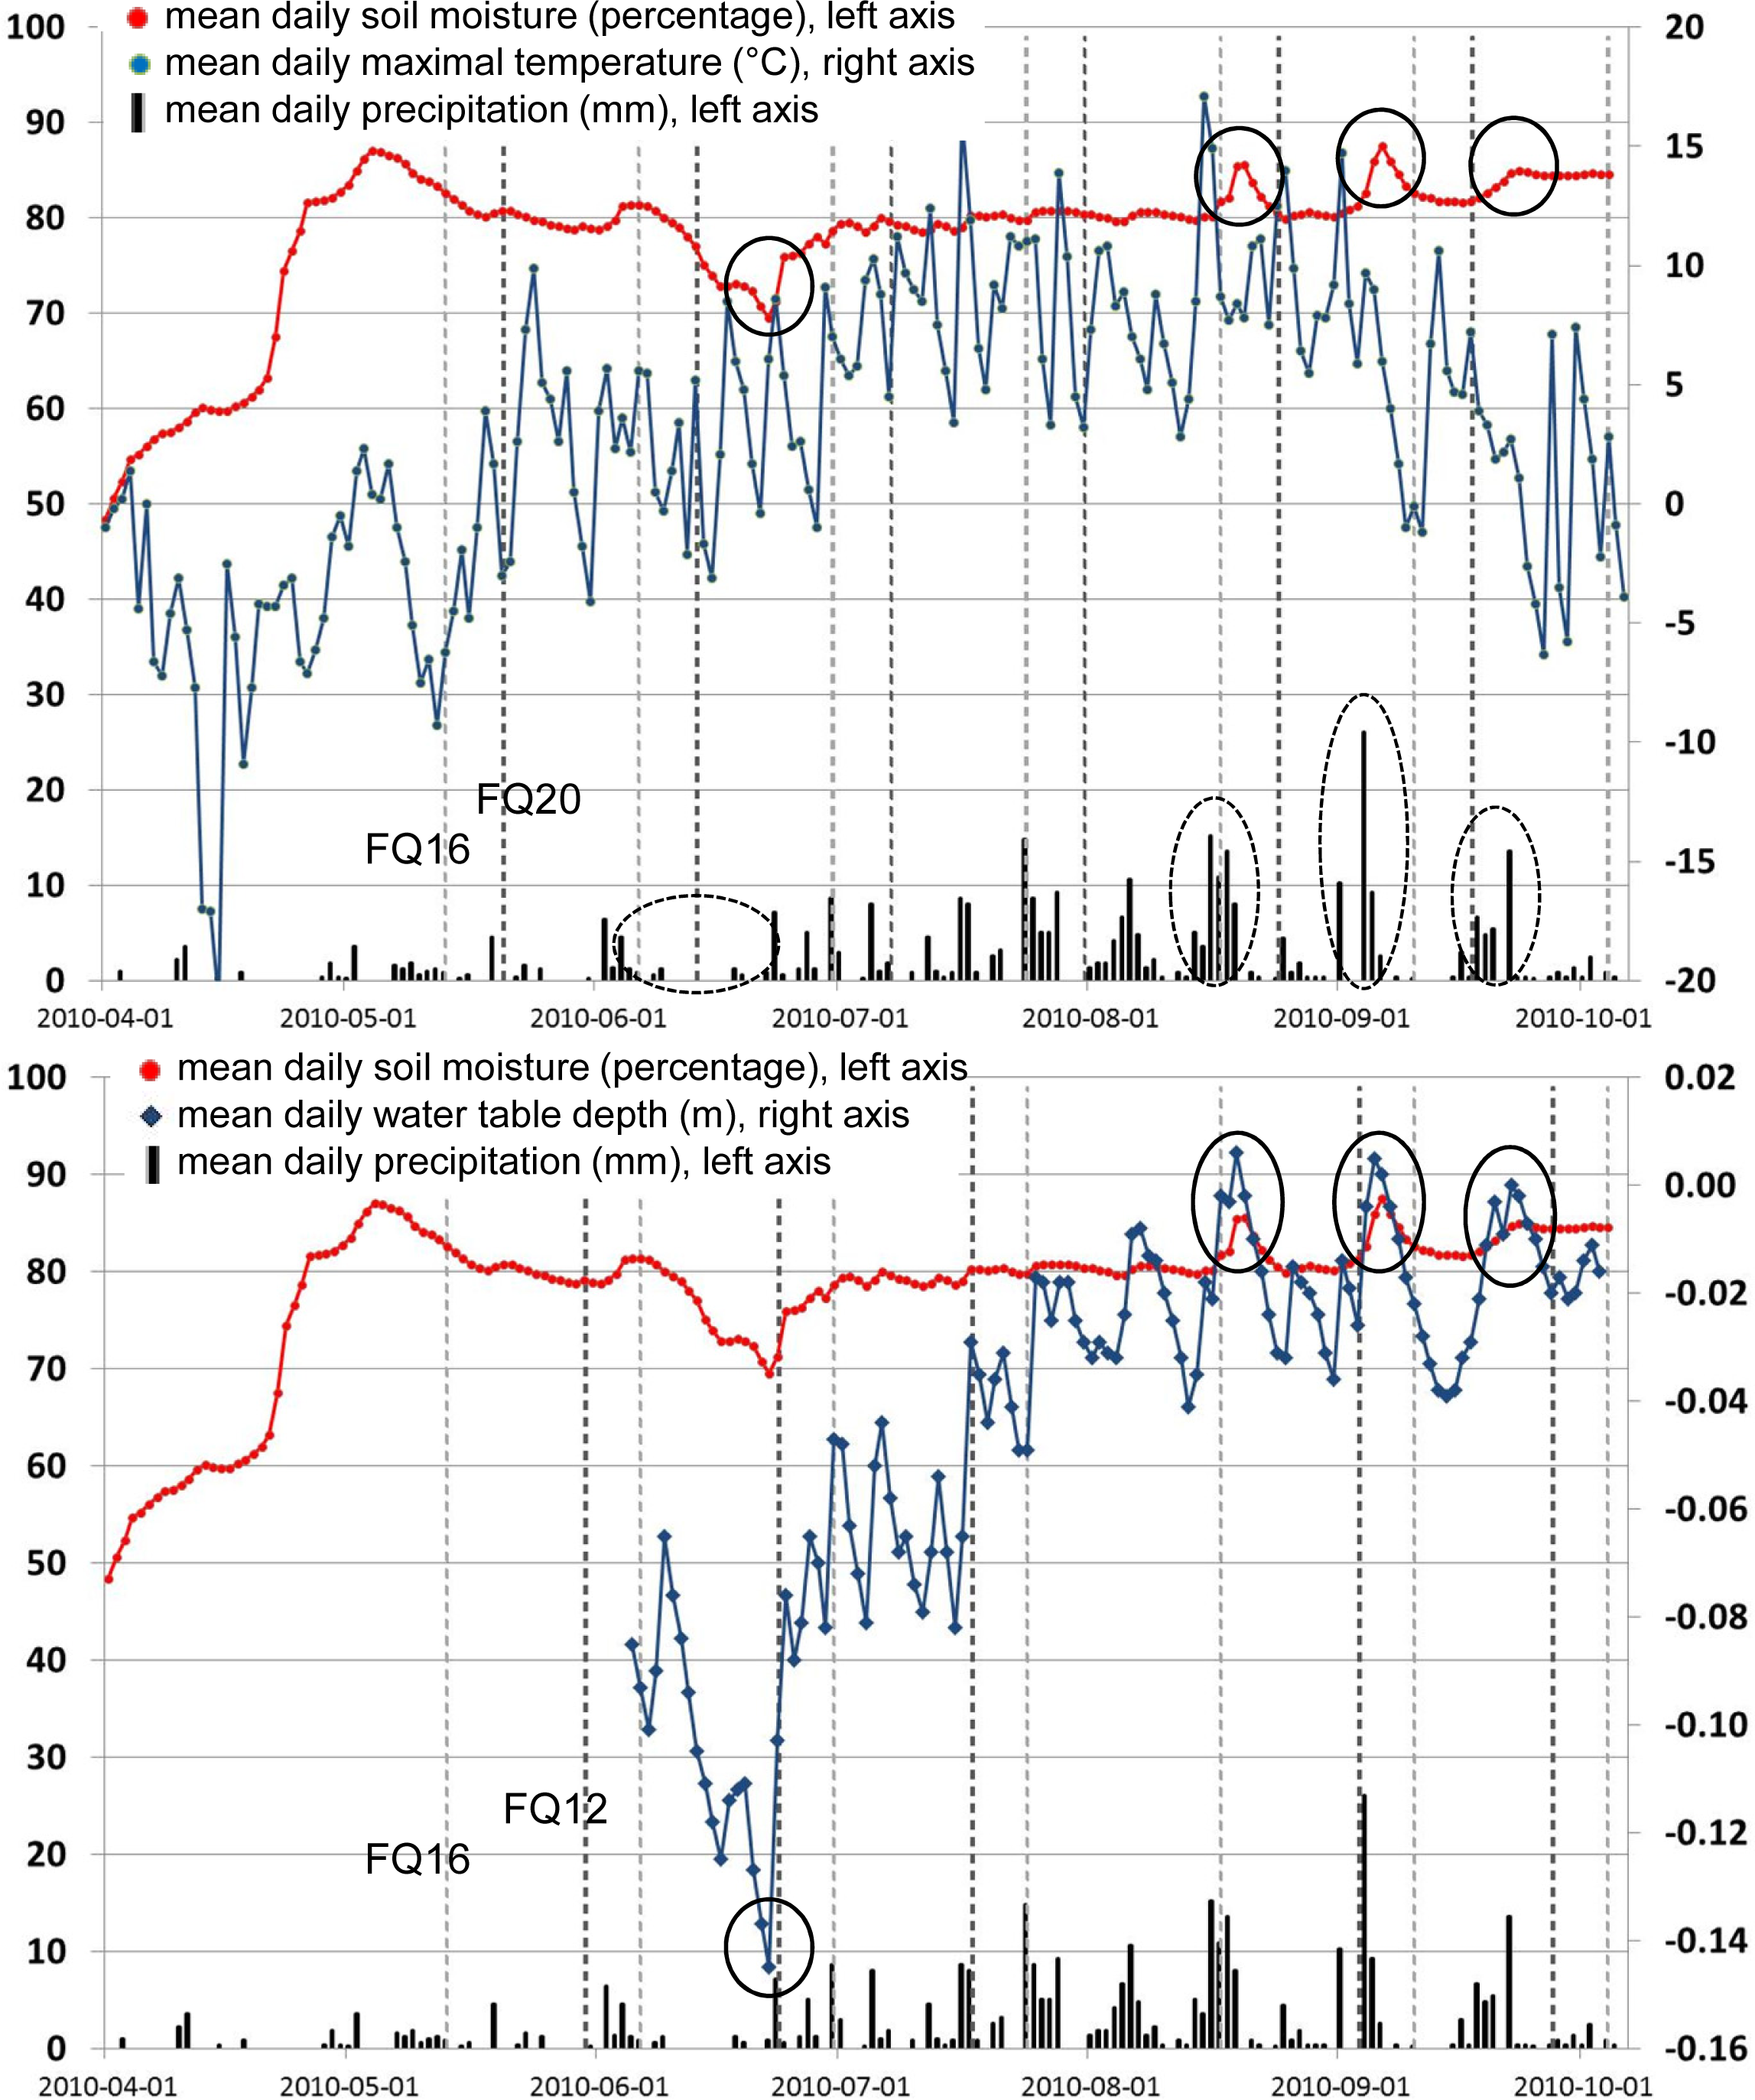
We looked at the evolution of surface soil moisture measurements with regard to seasonally changes, for year 2010, in temperature and precipitation (mean daily values) of one monitored wetland, in order to characterize their dynamic interaction for the season (Figure 4).
The increase in soil moisture content at the beginning of April 2010 is strongly associated with the melt of the snow, as it matches the increase in the mean daily maximal temperature. Once snow melting is completed, a plateau of soil moisture content is reached in the peatland at about 80% of saturation (buffer value). During this more stable period in surface soil moisture’s dynamics on the monitored wetland, important variations are more associated with the amount and distribution of precipitation during the summer and early autumn seasons, as can be seen in the lower values of precipitation throughout June and the peaks in mid-August and early September 2010 (circled in Figure 4 upper). Surface soil moisture’s dynamic changes to significant meteorological events in precipitation showed a temporal shift of three to four days (circled peaks in early autumn). It took almost two months of a drought in summer to cut down the values in surface soil moisture to almost 10%.
Water table depth mean daily values showed a significant correlation to surface soil moisture (r2 = 0.72). Nonetheless, they revealed a stronger sensitivity to variations in precipitation during the summer and autumn seasons in 2010 than surface soil moisture mean daily values (Figure 4 lower). Lows and peaks in water table depth are in direct relationship to precipitation values, and they did not show a buffer value in the wetland as surface soil moisture did.
The range of variation in soil moisture captured by radar images was more representative of the stable period in the hydrological dynamics of the surveyed wetlands. The few meteorological events that affected this stability were missed by the RADARSAT-2 image acquisition schedule. This situation illustrates the importance of a more frequent temporal resolution and the potential of the future “RADARSAT Constellation Mission” in such an application, in order to be able to capture dynamic and rapid variation of soil moisture.

4.2. Regression Analysis

A direct regression was established between multi-polarization backscattering coefficients (HH, HV, VV) and volumetric soil moisture content (hv in m3·m−3), as well as water table depth (wtd in m), as an empirical approach to estimate those variables from RADARSAT-2 images. A cross-polarization ratio (HH/HV) [26] was also tested as a way to minimize the effect of surface roughness and/or vegetation on radar signal backscattering. Generally, direct regressions showed poor dynamics. Most adjustments (r2) were under 0.3 for all landscape units and multi-polarization parameters (Table 4). Although not shown, poor adjustments were obtained when considering water table depths, regardless of incidence angle range (IA) or the level of landscape disaggregation.
Regression adjustments with regard to surface soil moisture were remarkably lower for RADARSAT-2 images acquired at incidence angles (IA) between FQ12 and FQ16 (from 31.5° to 37.0°), regardless of landscape disaggregation (Table 4). Regression analysis with the combination of incidence angles FQ16 and FQ20 (from 35.6° to 40.7°) showed more potential to monitor changes in surface soil moisture content, under the specific conditions of this study. Returns due to surface scattering are normally strong at low IA and decrease with increasing IA, with a slower rate of decrease for rougher surfaces, although there are no significant differences in backscattering behavior in the IA range between 32° and 40° used in this study (FQ12–FQ16–FQ20) [38].
Nevertheless, radar backscatter has an angular dependence, and there is a potential for choosing optimum configurations for different applications, as in this specific case on boreal wetland ecosystems. Surface roughness and natural vegetation biomass are key factors that affect the potential of SAR images multi-polarization backscattering coefficients to detect changes in soil moisture [39]. This is why the best regression adjustment were obtained with the cross-polarization ratio (HH/HV) analysis, as this ratio weakly depends on surface roughness, regardless of the incidence angle.
We combined the cross-polarization ratio with a multi-temporal index, or Δ-Index [30], in order to improve the quality of regression adjustments with ground measurements. With a multi temporal approach, the change in SAR backscattering between repeat passes results from changes in hv (with images acquired under the same satellite configuration and incidence angle). A significant improvement in the quality of the regression was obtained using the Δ-Index cross-polarization ratio (HH/HV) and soil moisture content (r2 = 0.92), for an incidence angle range between FQ16–FQ20 on the permanently flooded peatland A (Figure 5).
Complete regression analysis results for the Δ-Index cross-polarization ratio (HV/HH) and soil moisture content are shown in Table 5. The use of SAR images with an incidence angle range between FQ16 and FQ20 (from 35.6° to 40.7°) allows us to obtain a significant leap in the quality on the regression adjustment. The quality of the adjustment is higher as the scale of landscape disaggregation is generalized (Table 5). Good adjustments were also obtained at a more detailed scale of spatial disaggregation on peatland A. Still, no quality adjustments were obtained for radar images acquired with an IA range between FQ12 and FQ16 (from 31.5° to 37.0°).
Better adjustments were systematically obtained on permanently flooded areas over seasonally flooded ones, for both peatlands analyzed. This is also pointed out, as the landscape disaggregation is generalized, showing a significant difference in the quality of the adjustment (r2 ranging from 0.81 to 0.21 for permanently flooded and seasonally flooded areas, respectively). This behavior can be explained by the nature of boreal wetland eco-hydrological landscapes. Dribault et al. [34] proposed an eco-hydrological hierarchical classification of boreal wetlands in three groups, water, peat and forest, representing three types of landscape: aquatic, semi-aquatic and terrestrial. Permanently flooded areas can be assigned to the aquatic group, while seasonally flooded areas to the semi-aquatic group, which represents a transitory environment onto terrestrial groups.
The nature of the semi-aquatic group is a mixed environment that evolves constantly in both senses (aquatic and terrestrial) depending on the wetland’s water balance changes over the season, which implies a mixed radar backscattering response, too. Further, this landscape is characterized by small and dispersed spatial units not easy to detect with satellite radar imagery, due to pixel size (8 m) and the speckle effect.
Even though these results show the strong potential of the multi-temporal cross-polarization index approach to monitor seasonal variations in surface soil moisture content on boreal wetland ecosystems, the conditions for how these results are likely to occur should be pointed out. As demonstrated in Figure 5 (Δ-Index: HV/HH; IA range: FQ16–FQ20; permanently flooded peatland A), regression adjustment results mainly from four points in the curve (hv in m3·m−3 and image acquisition date): 0.32 for 2009-05-18, 0.56 for 2009-05-25, 0.82 for 2010-06-30, and 0.88 for 2009-06-11 or 2010-08-17. The ground measurements showing low variation on soil moisture content to saturation have a weak impact on the regression adjustment. The sensitivity of the multi-temporal index from the cross-polarization ratio to variations in the eco-hydrological dynamics of the soil-vegetation complex depends on the magnitude of changes in the soil moisture content. Weak changes in soil moisture on boreal wetlands (lower than 10%) over the season would not be detected by the multi-temporal cross-polarization index.

4.3. SAR Cross-Polarization Ratio Image Analysis

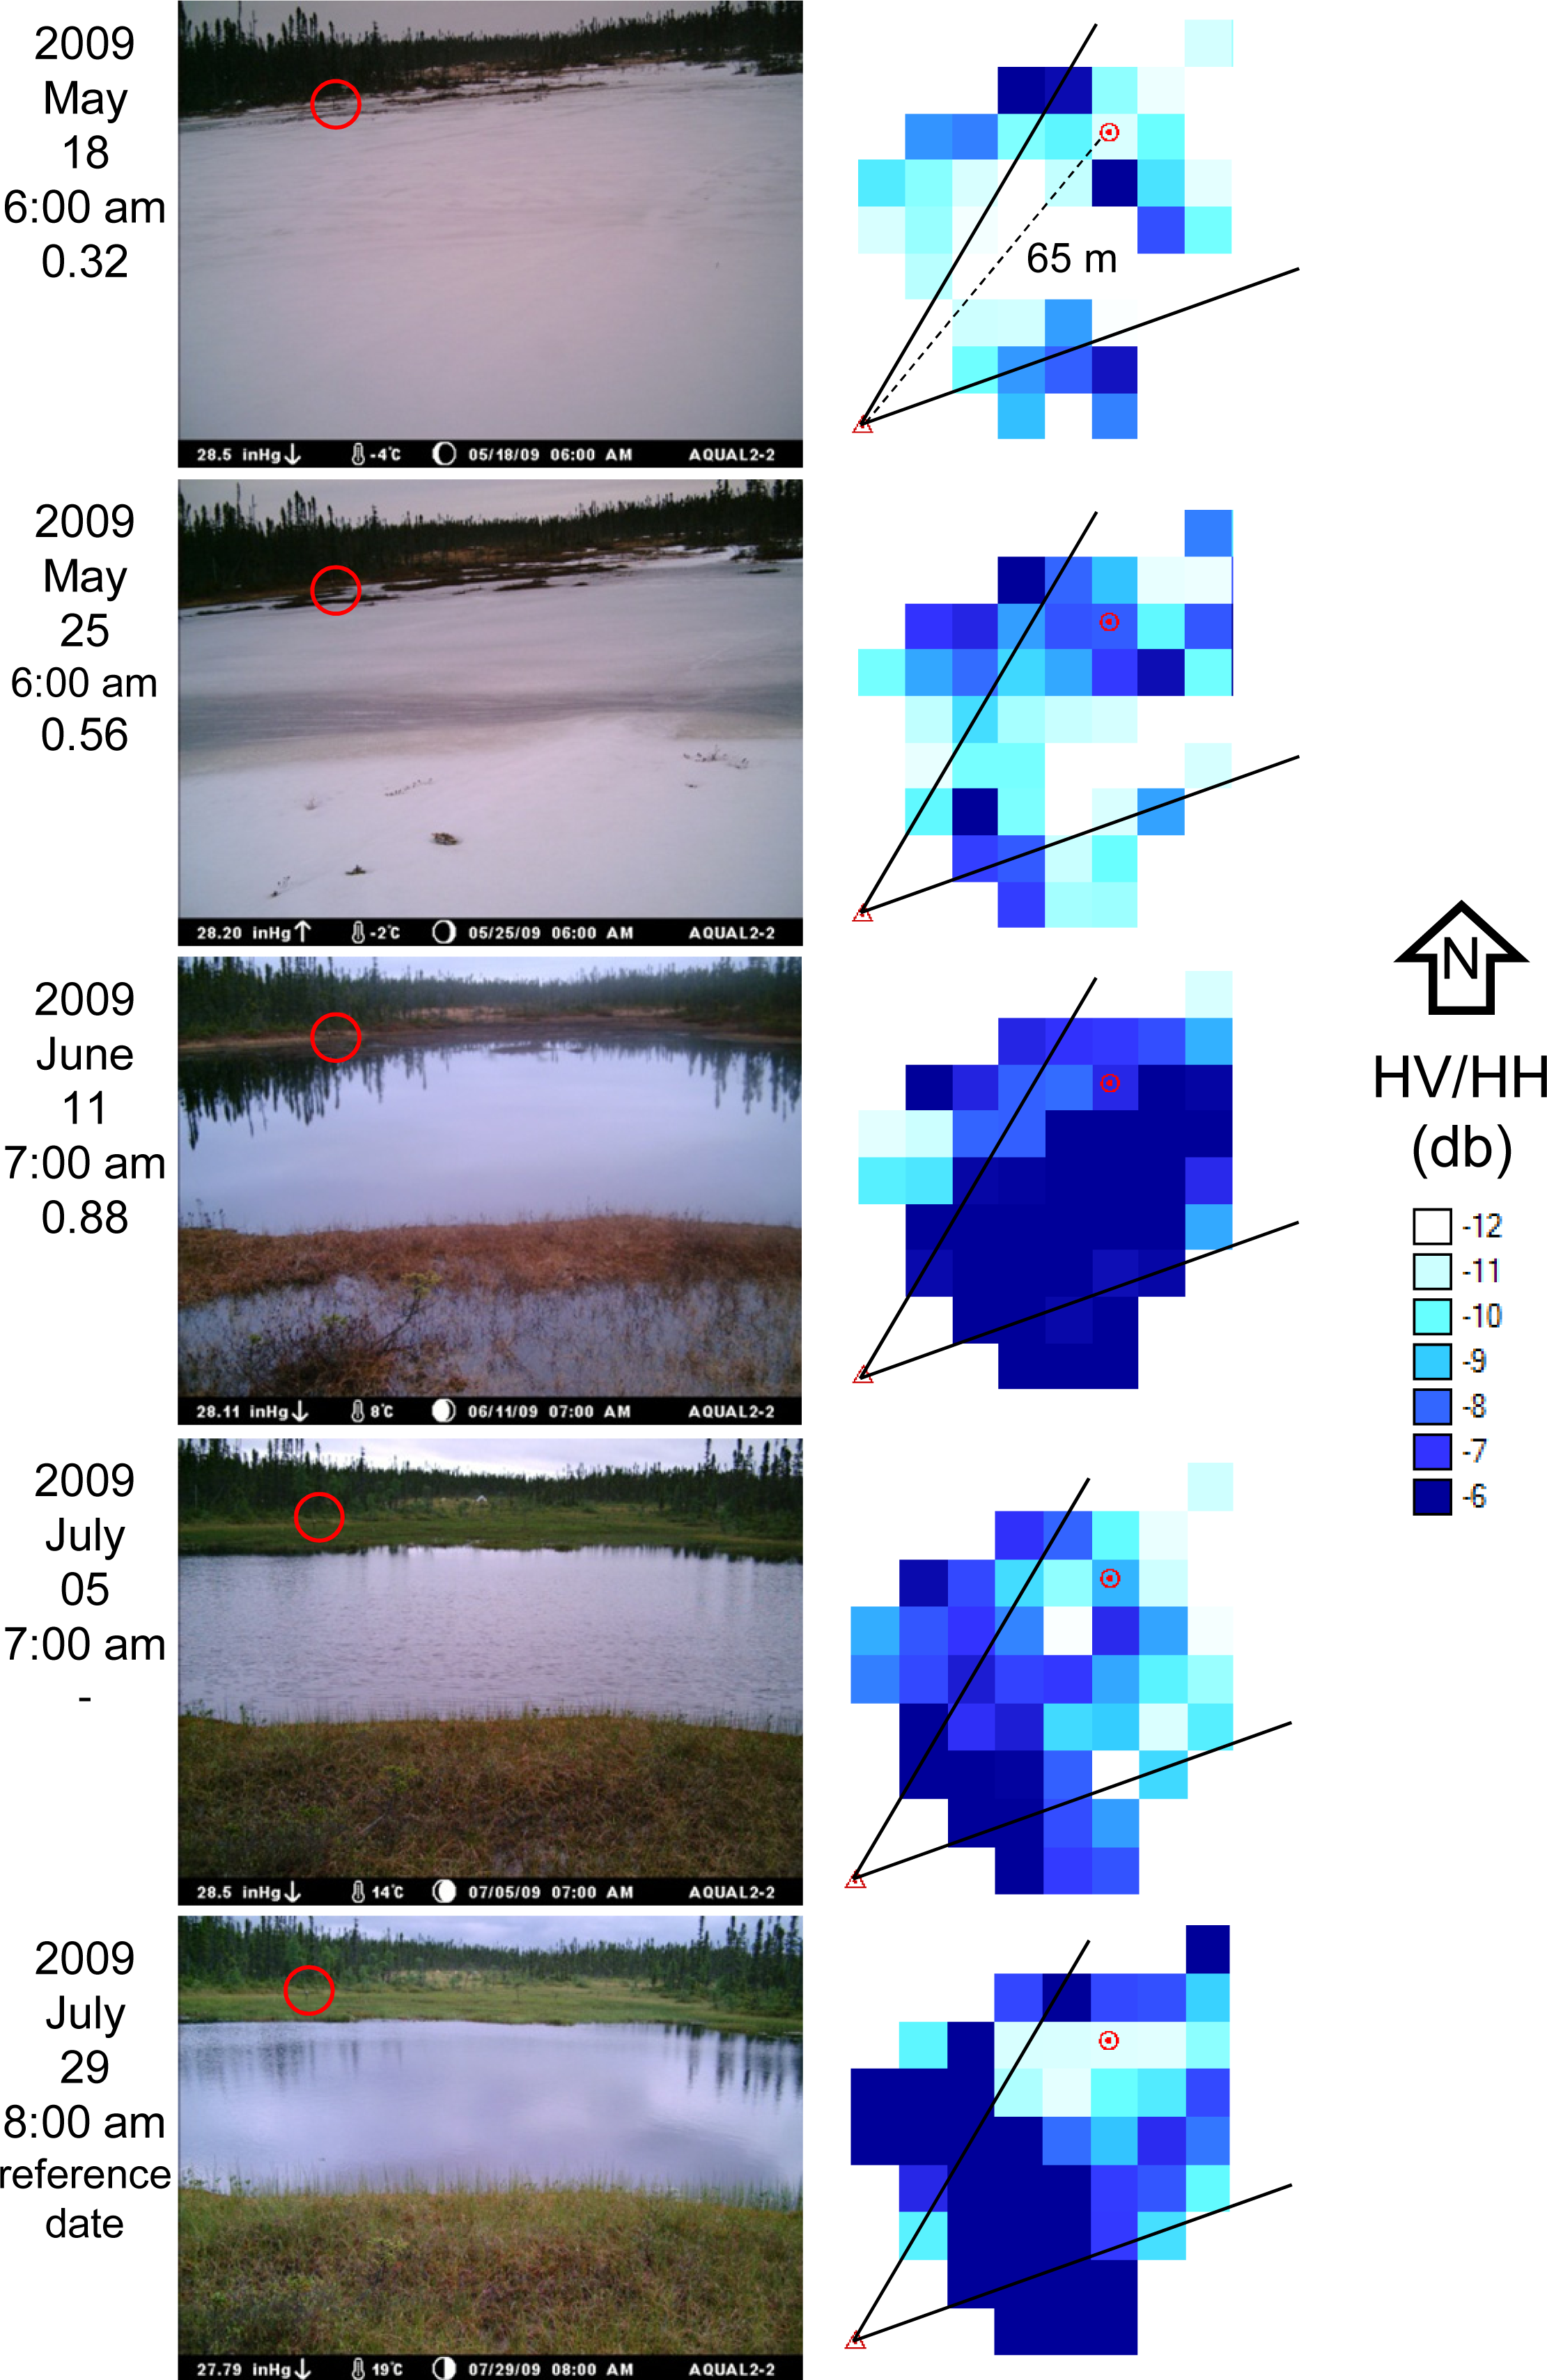
To better understand the relationship between the cross-polarization ratio and the changes in the wetland’s eco-hydrological dynamics, we looked at a series of ground photos and its corresponding cross-polarization ratio image (pseudo-color), at the radar’s pixel scale (Figure 6).
Ground photos in Figure 6 shows the evolution of the main pool at peatland A during the first five acquisition dates of 2009, as well as pseudo-color representation (in a blue palette) of the cross-polarization ratio for the corresponding date and time of ground photos. In the first two ground photos we notice that most of the landscape is still covered by snow. On the second one, the snow melting process is more advanced; the snow seems more humid in the corresponding ground photo, as evidenced by the measured volumetric surface soil moisture increases from 0.32 to 0.56 m3·m−3 from 18 May to 25 May. For the third ground photo (11 June), all snow cover is melted and the wetland shows a maximum water level at the main pool (as the measured soil moisture increase up to 0.88 m3·m−3).
The follow up ground photos of 5 and 29 July show a decrease of the main pool water level, as the wetland reaches a stable period in the hydrological dynamic, and the peat (lawn-grass) gains some surface in the wetland (mainly to the pool edges). From mid-June to the beginning of August 2009, there were weak and scattered events of precipitation, which led to this dryer condition in the wetland.
Before analyzing the relationship between the eco-hydrological dynamic evolution of the soil-vegetation complex and the pseudo color cross polarization ratio images, we should look first at the backscattering values (σ° in db) for HH and HV (as well as the cross-polarization ratio) for different sites at the permanently flooded peatland A (Table 6, same dates as cited above). Two sites were selected: the FDR probe location (red circle in Figure 6) and the main pool.
Interpretation of these results must be carried out separately, considering two different environmental conditions: with snow and without snow (radar data interpretation might defer significantly due to dissimilar microwave-object interactions). Likewise, we will be using the panoramic photos as the ground truth to the corresponding radar images date-time of acquisition (Figure 6). With respect to the first date at the FDR probe site, we have the snow melting process as the main cause of absorption in radar microwave (thus the increase in liquid water). Under melting conditions, the liquid water content in a snow pack gives rise to considerable absorption and strong reduction of penetration depth [40,41]. The increasing values of the cross-polarization ratio with the increasing humidity in the snow must be inversely interpreted as the HH and HV backscattering (Table 6).
At the main pool site, backscattering is influenced by the humidity of the snow pack over the frozen pool. The 18 May 2009 ground photo shows a homogeneous snow pack, which is reflected in the corresponding pseudo color cross polarization image (Figure 6). As the snow pack and the subjacent ice cover continue to melt (25 May), the absorption is higher and the backscatter lower in HH polarization (thus the cross-polarization value increases). When the snow cover melts away, a different interaction microwave-object takes place with open water pool and vegetation (low lawn-grass) over organic soils (as this could be seen on the three last ground photos, Figure 6). At the main pool site in a snow-free wetland, reflection at an open water pool is a matter of surface roughness due to small waves, as noticed in Table 6 and Figure 6 (from 11 June to 29 July ground photos). Lower values of the cross-polarization ratio are associated with mirror reflection in calm open water surface.
At the FDR probe site without snow, higher values of the cross-polarization ratio are associated with a highly saturated soil-vegetation complex. The pseudo color cross-polarization ratio image representation for 11 June shows a predominance of high values over most of the wetland, which represents open water and a water table level at the surface at the main pool and its edges, as well as highly saturated soils. As the water level falls in the wetland (5 and 29 July ground photos in Figure 6), there are changes especially in the vegetation physiognomy, as the low lawn-grass gains some surface to the edges of the main pool. The follow-up corresponding pseudo color cross-polarization ratio images (5 and 29 July) show low values particularly on the northeast side of the main pool, which represents lesser humid peatland over organic soils (FDR probe site, Table 6). In fact, a decrease in the soil or lawn-peat moisture content generally provokes a change in the dielectric properties of natural materials with decreased radar reflectivity.
The use of a fixed ground camera represented an appropriate approach to interpret radar images, with the purpose of understanding the complexity of the eco-hydrological dynamics in boreal wetlands over the season. It allowed a better understanding of the natural phenomena that was being capture by the satellite sensor. A higher number of fixed ground cameras, properly distributed at different landscapes, will allow for a better calibration of the cross-polarization ratio image representation. Torbick et al. [42] used the same approach with a GPS-enabled moving camera (“geofield photos”), during field work.

4.4. Cross-Validation of the Empirical Approach

A cross-validation method was applied in order to estimate how accurately our predictive model will perform. The predictive model is an empirical approach developed to estimate surface soil moisture from a SAR image difference index (Δ-Index), using a cross-polarization coefficient (HV/HH, range of IA: FQ16–FQ20). As no ground data is available for validation, a leave-one-out cross-validation method was used. This method involves using a single observation from the original sample as the validation data, and the remaining observations as the training data. This is repeated such that each measured surface soil moisture data in the sample is used once as the validation data.
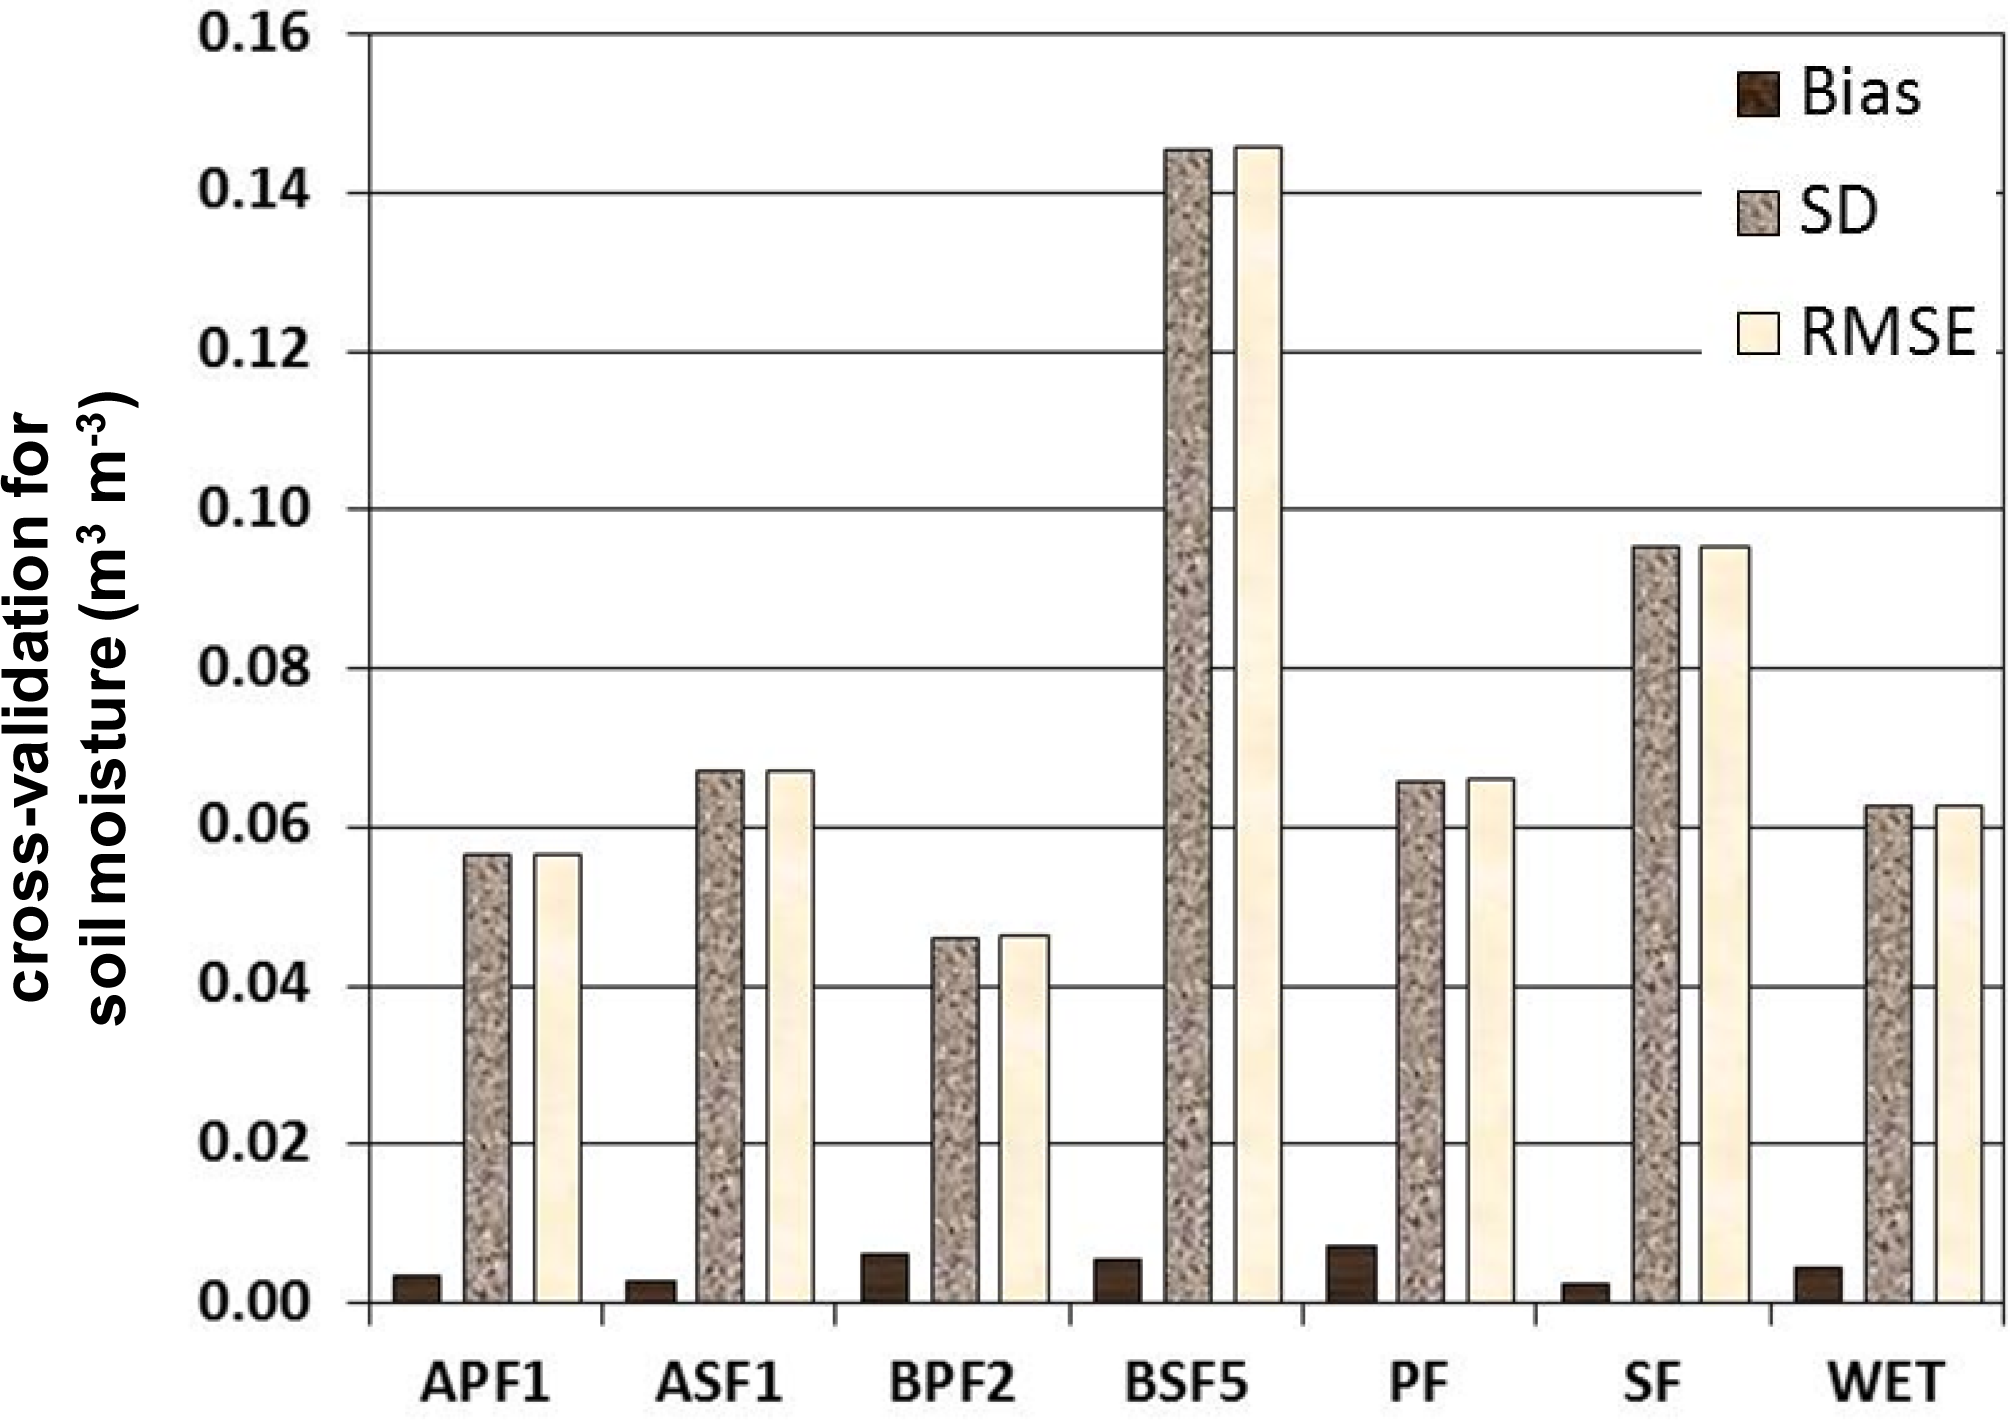
A total of 14 dates were used: 3 for 2009 and 11 for 2010. Bias (systematic error), standard deviation (SD) and root mean square error (RMSE) statistics were calculated from the leave-one-out cross-validation method (Figure 7), for each spatial unit: permanent flooded peatland A (APF1), seasonally flooded peatland A (ASF1), permanent flooded peatland B (BPF2) and seasonally flooded peatland B (BSF5); as well for the different levels of spatial disaggregation used in the analysis: permanent flooded wetland (PF), seasonally flooded wetland (SF) and all wetlands (A + B) altogether (WET).
Bias = 1 n i = 1 n ( xe i xo i )
SD = 1 n i = 1 n ( xe i xe ¯ i ) 2
RMSE = 1 n i = 1 n ( xe i xo i ) 2
where xei and xoi are estimated and observed surface soil moisture, respectively, xe ¯ i is mean value of the estimated surface soil moisture, n is the number of paired datasets (14 used in this research) and SD is the standard deviation of the estimated values.
All regression adjustments were statistical significant (p-value under 1%). Cross-validation results show excellent accuracy in surface soil moisture estimation, where almost all errors (bias and SD) were under 0.10 m3 m
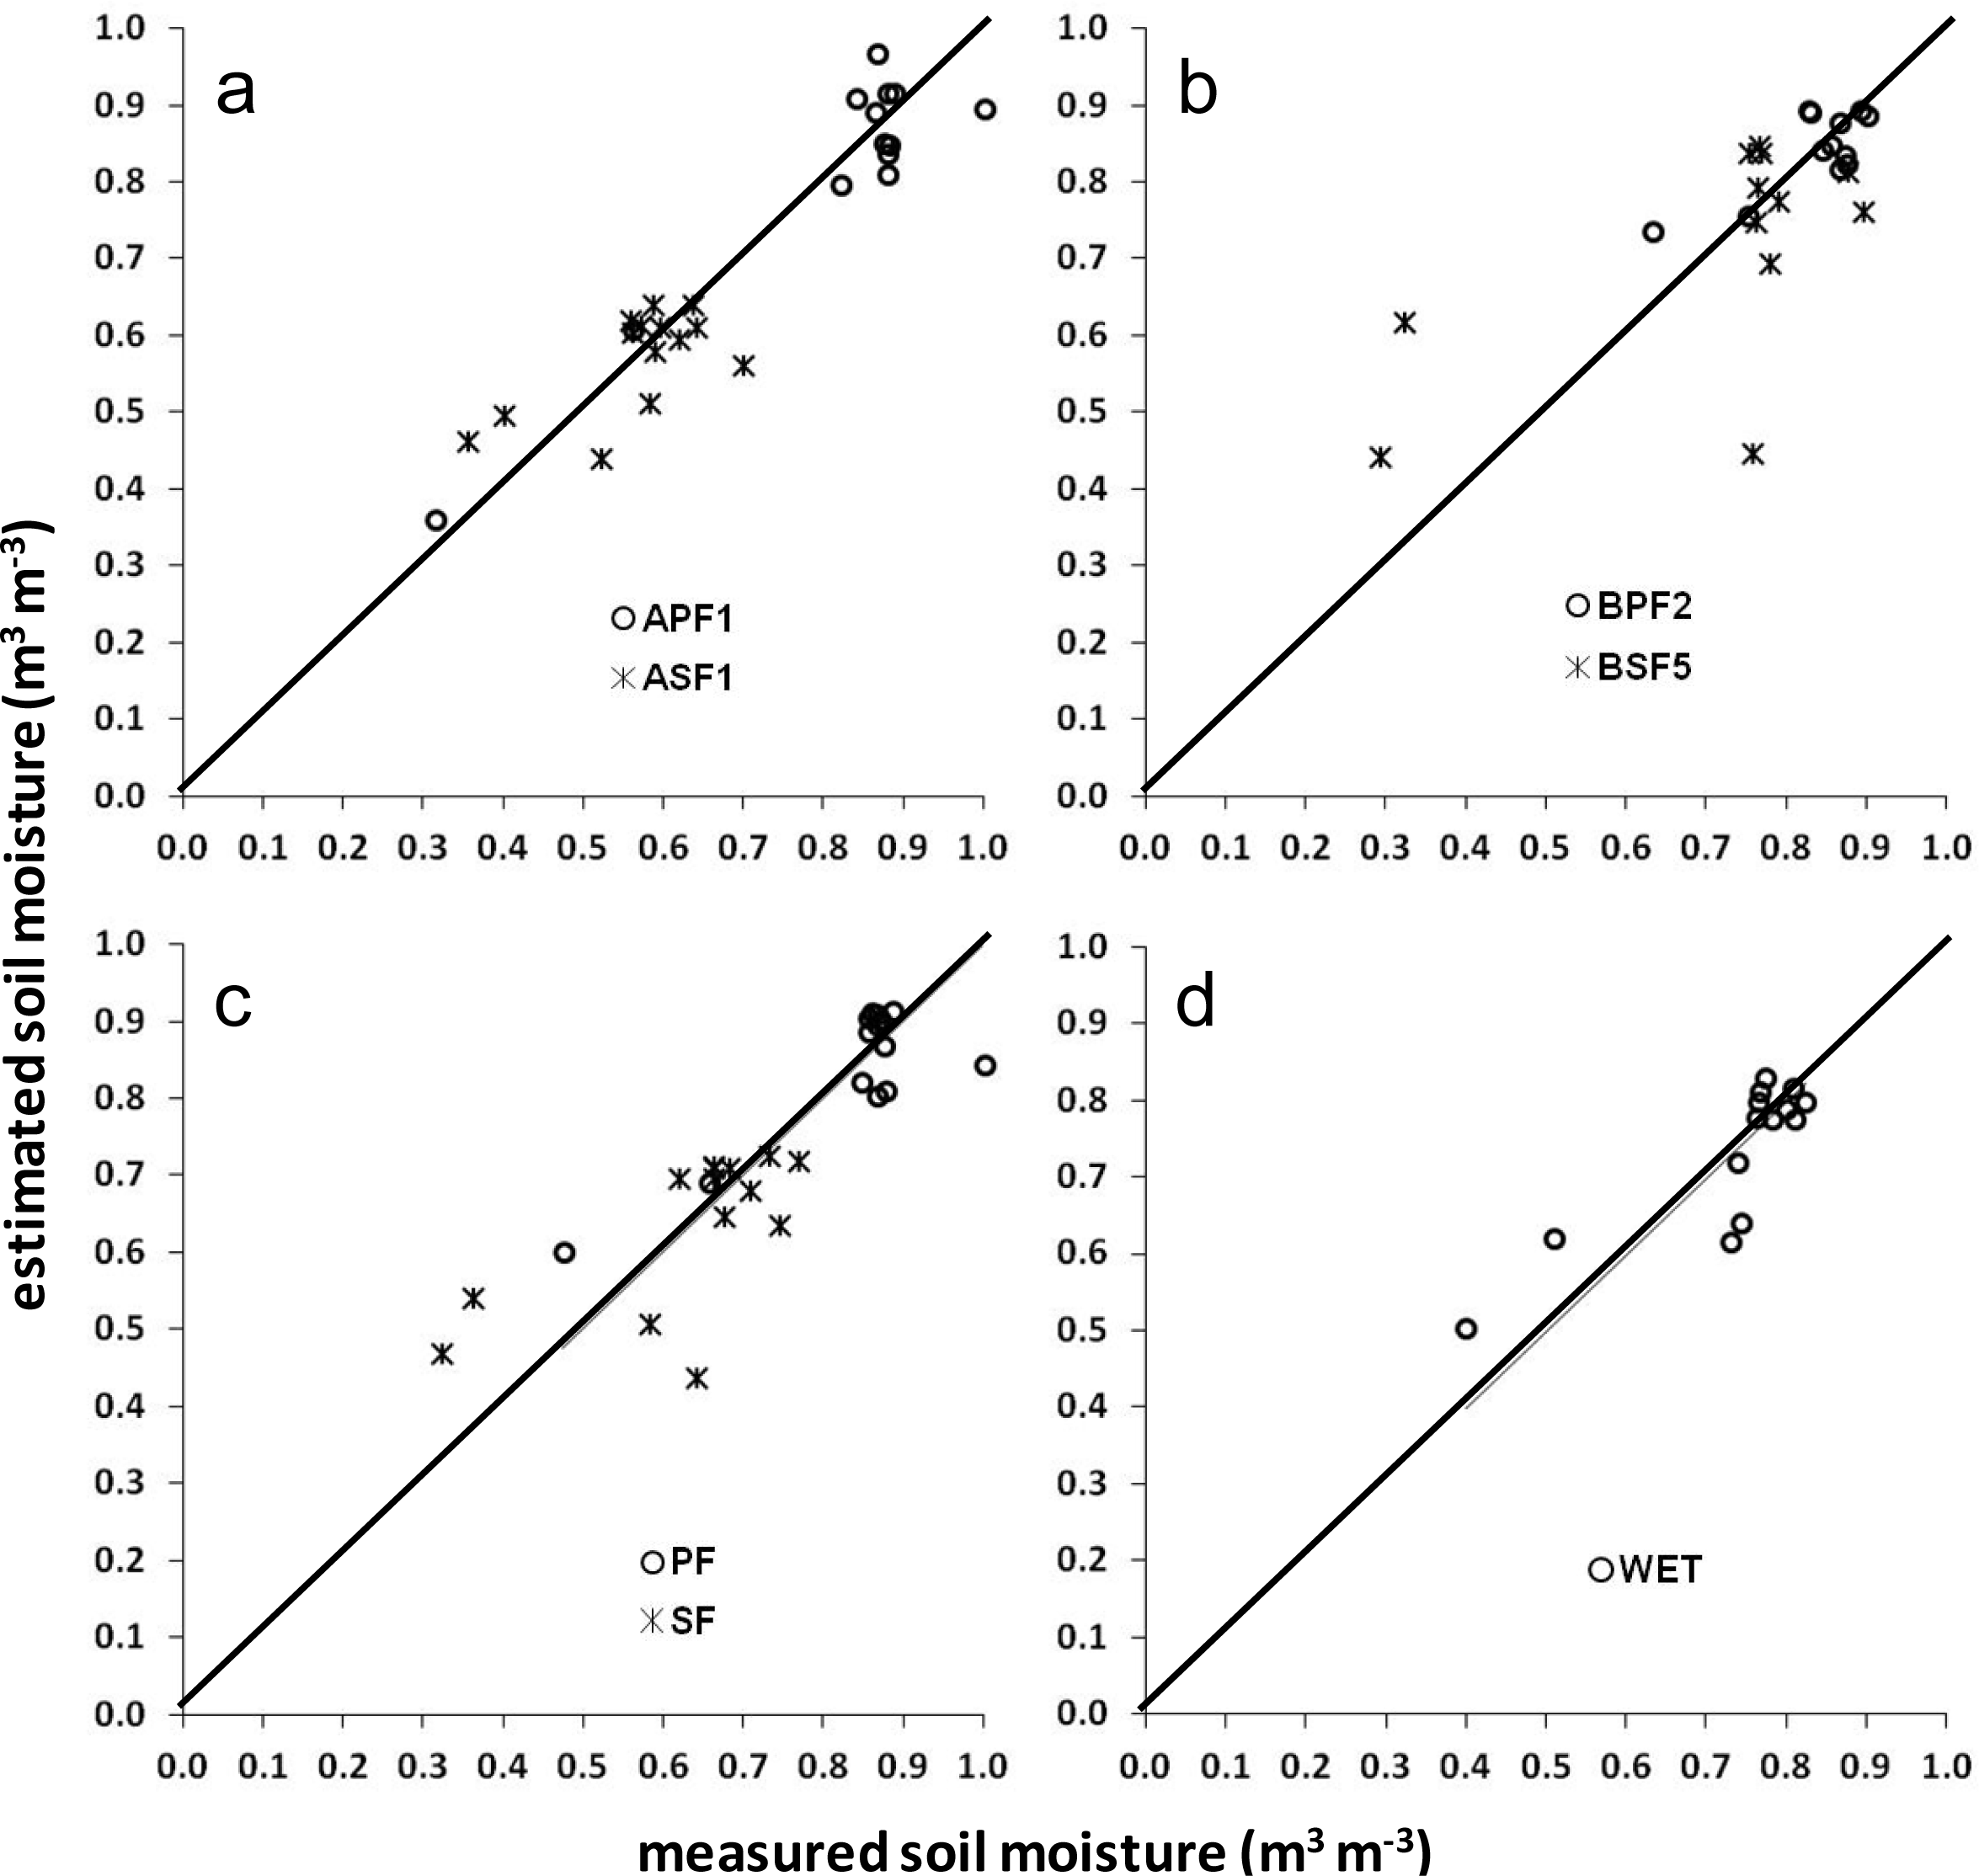
−3. Some interesting patterns are also shown. Random errors were systematically greater than statistical bias, especially in peatland B (BSF5), where it reached a maximum value. With regard to the RMSE, it shows that the quality of estimation of volumetric surface soil moisture is systematically better in permanently flooded than seasonally flooded peatlands. When analyzing all wetlands together, results were similar to the permanently flooded peatland. We also looked at the error distribution with regard to the estimated and measured surface soil moisture (Figure 8) in order to have a graphic representation of these patterns.
Error distribution in peatland A (Figure 8a) shows a precise estimation at the whole range of surface soil moisture content, and it is also noticeable that the range of changes in soil moisture in seasonally flooded areas is smaller than those in the permanently flooded ones. Error distribution in peatland B (Figure 8b) in seasonally flooded areas shows more dispersion, as the quality of the estimation is less important (Figure 7). This pattern is still obvious when we analyze permanently and seasonally flooded areas separately (Figure 8c). As the level of landscape generalization increases, and the error distribution analysis is set for all peatlands altogether (Figure 8d), the effect of error dispersion caused by the seasonally flooded areas is largely reduced (diluted).
Surface soils in seasonally flooded areas do not reach saturation during both monitored seasons (years 2009 and 2010), which might allow for the growth of more structured vegetation. Surface soils in permanently flooded areas almost reach saturation (0.8 m3·m−3 or higher) in spring as the snow melts and sustain a high surface soil moisture content all along the season (as seen previously in Figure 4). As cited before, wetland eco-hydrological hierarchical classification [34] consists of three groups: Water, Peat and Forest; each group also has many classes and subclasses. Nonetheless, we take only the classes necessary to explain the differences in vegetation cover on permanently flooded and seasonally flooded areas (one Water class and all Peat classes, but no Forest classes, shown in Table 7).
Permanently flooded areas would be represented by one eco-hydrological class from the Water group (shallow water, or pond of peat bogs) and two classes from the Peat group (lawn and water, low lawn), whereas seasonally flooded areas would be represented by two eco-hydrological classes from the Peat group (upper land, hummock and forest edge). All eco-hydrological classes and subclasses representing permanently flooded areas have low water table depth or at the surface, as well as low vegetation cover (low lawn-grass or herbaceous). Eco-hydrological classes and subclasses representing seasonally flooded areas have a deeper water table, and a more developed and structured vegetation cover (shrubs).
Vegetation cover composition could explain the differential behavior between seasonally and permanently flooded (PF) areas. Peatland PF areas keep more saturated (and stable) soil moisture conditions over the growing season (late spring, summer and early autumn, after snow melting), with a low lawn-grass vegetation cover and water table near the surface (aquatic eco-hydrological class), which can be related to a more homogeneous backscattering response. Peatland seasonally flooded (SF) areas, as a transitory eco-hydrological unit between aquatic and terrestrial landscapes, have deeper water table depth and less saturated surface soils, allowing the development of more structured vegetation (shrubs), as well as more seasonal changes. Eco-hydrological conditions described for SF will eventually result in a more mixed backscattering response over the season (stronger variations in vegetation cover and surface roughness), affecting the possibility of a precise prediction in surface soil moisture from SAR multi-date indexes.
This explains why the prediction of surface soil content on permanently flooded areas from the Δ-Index cross-polarization coefficient, analyzed individually, is more precise than that of all wetlands altogether. Nevertheless, the fact that seasonally flooded areas are characterized by small and disperse spatial units allows good results in prediction precision when we analyze the whole wetland spatial unit. This result confirms the capacity of the empirical approach from the Δ-Index cross-polarization coefficient to precisely estimate surface soil moisture in boreal wetlands. The quality of the estimations obtained from C-band SAR are as strong as those obtained from L-band SAR [42], even though the longer wavelength of the L-band would allow for a more detailed detection of flood status in different wetlands types [43,44].
The shorter wavelength C-band platform has the advantages of increased coverage and data availability. Other multi-temporal C-band SAR applications in northern wetland [45,46] showed that it can distinguish inundation from areas highly saturated with water, although at a different scale platform (European Space Agency Environmental Satellite or ENVISAT ASAR) Wide Swath, spatial resolution of 150 m). With regard to optical images applications at the same study area [34,47], they provided a satisfactory level of accuracy both for the delineation of peatlands and for the distinction of their internal structures. Whereas Dribault et al. [34] were able to relate the observed spatial dynamics to the evolution of the measured water levels (discharge), our approach with a multi-date and multi-polarimetric C-band SAR index allowed for quality estimations of surface soil moisture on the peatlands’ internal structures.

5. Conclusion

The objective of this study was to estimate the volumetric surface soil moisture content of the acrotelm in boreal wetlands with the use of an empirical approach based on a multi-date and multi-polarimetric C-band SAR index. The combination of the Δ-Index and the cross-polarization coefficient (HV/HH) allows for a better adjustment in regression with regard to volumetric surface soil moisture content, with the use of RADARSAT-2 images at an incidence angle range from FQ16 (36°) to FQ20 (39°). This approach enables precise estimation and monitoring of surface soil moisture content on boreal wetlands (RMSE < 0.07 m3·m−3). These estimations were more precise over permanently flooded areas than seasonally flooded, although the overall quality of the estimation is still precise. Differences in eco-hydrological conditions between these landscapes explain this behavior. Permanently flooded areas keep a water table level near (or at) the surface, as well as soil moisture near saturation for almost the entire growing season, with low vegetation cover (low lawn-grass). Seasonally flooded areas are transitional landscapes from aquatic to terrestrial, thus a deeper water level and lower soil moisture, allowing the growth of a more structured vegetation cover (shrubs) and more changes over the season.
While we were able to precisely estimate surface soil moisture from a C-band SAR cross-polarization coefficient multi-date index, the generalized empirical approach seems to sub-utilize the spatiality of radar data (especially RADARSAT-2 Quad POL fine mode) and its capacity to monitor eco-hydrological changes in boreal wetlands. In this framework, surface soil moisture punctual measurement probably is not the appropriate approach to calibrate SAR images in a spatially complex environment as boreal wetland. Cross-polarization ratio image analysis appears to be a useful means to spatially exploit SAR images in this type of application, as we were able to relate changes in wetland’s eco-hydrological dynamics to variations in the intensity of the ratio. Under snow cover, lower values of the ratio were associated with humid snow. Without snow cover, lower values of the ratio were associated with less humid terrestrial surfaces (low vegetation cover over organic soils), and higher values were associated with saturated soil-vegetation complex, as well as open water surface.
Further development will use those RADARSAT-2 Quad POL images to investigate how some C-band polarimetric parameters (associated with soil moisture) allow for monitoring differences in eco-hydrological conditions at boreal wetlands.

Acknowledgments

This research was funded by the Natural Sciences and Engineering Research Council of Canada (NSERC) and Hydro-Quebec as part of the multidisciplinary project “Ecohydrology in highly aqualysed fens of La Grande River watershed” under the leadership of Serge Payette (University Laval). The authors would like to gratefully acknowledge them for their financial support for over three years. RADARSAT-2 images were kindly provided by the Science and Operational Applications Research (SOAR)-Education Program from the Canadian Space Agency.
The authors wish to thank G. Carrer, N. Cliche Trudeau, Y. Dribault, G. Levrel, S. Proulx-McInnis and M. White for their commitment to the field work, under the leadership of Sylvain Jutras (Institut National de la Recherche Scientifique, INRS). The authors are grateful for the hydrological data provided by the INRS hydrology team under the leadership of André St-Hilaire and Alain Rousseau, and the wetland’s expertise of Michelle Garneau (Université du Québec à Montréal, UQAM) and Serge Payette (University Laval). We thank also Frederic Poisson at the Department of Sustainable Development of Québec (MDDEFP) for providing the ecological maps, and Angus Calderhead from Natural Resources Canada for his assistance.

Conflict of Interest

The authors declare no conflict of interest.

References

  1. Vitt, D.H. Functional Characteristics and Indicators of Boreal Peatlands. In Boreal Peatland Ecosystems; Wieder, R.K., Vitt, D., Eds.; Springer-Verlag: Berlin/Heidelberg, Germany, 2006; Volume 188, pp. 9–24. [Google Scholar]
  2. National Wetlands Working Group. Wetlands of Canada. In Ecological Land Classification Series; Sustainable Development Branch, Environment Canada: Ottawa, ON, Canada, 1988; Volume 24, p. 425. [Google Scholar]
  3. Joosten, H.; Clarke, D. Wise Use of Mires and Peatlands; International Mire Conservation Group and International Peat Society: Saarijärvi, Finland, 2002; p. 304. [Google Scholar]
  4. Ozesmi, S.L.; Bauer, M.E. Satellite remote sensing of wetlands. Wetl. Ecol. Manag 2002, 10, 381–402. [Google Scholar]
  5. National Round Table on the Environment and the Economy (NRTEE). Cleaning Up the Past, Building the Future: A National Brownfield Redevelopment Strategy for Canada; Report 1; NRTEE: Ottawa, ON, Canada, 2003; p. 4. [Google Scholar]
  6. Rundquist, D.; Gitelson, A.A.; Derry, D.; Ramirez, J.; Stark, R.; Keydan, G. Remote Estimation of Vegetation Fraction in Corn Canopies. Proceedings of the Third European Conference on Precision Agriculture, Montpellier, France, 18–20 June 2001; pp. 301–306.
  7. Pietroniro, A.; Prowse, T.; Peters, D.L. Hydrologic assessment of an inland freshwater delta using multi-temporal satellite remote sensing. Hydrol. Process 1999, 13, 2483–2498. [Google Scholar]
  8. Töyrä, J.; Pietroniro, A.; Martz, L.W. Multisensor hydrologic assessment of a freshwater wetland. Remote Sens. Environ 2001, 75, 162–173. [Google Scholar]
  9. Ménard, E.; Gauthier, Y.; Garneau, M.; Bernier, M.; Kettles, I. Utilisation d’images Radarsat pour l’inventaire de milieux tourbeux au Québec Nordique (Région de la Baie James, Canada). Proceedings of Fifth International Workshop on Application of Remote Sensing in Hydrology, Montpellier, France, 2–5 October 2001.
  10. Baghdadi, N.; Bernier, M.; Gauthier, R.; Neeson, I. Evaluation of C-band SAR data for wetlands mapping. Int. J. Remote Sens 2001, 22, 71–88. [Google Scholar]
  11. Bernier, M.; Ghedira, H.; Gauthier, Y.; Magagi, R.D.; Filion, R.; De Sève, D.; Ouarda, T.; Villeneuve, J.-P.; Buteau, P. Détection et classification de tourbières ombrotrophes du Québec à partir d’images RADARSAT-1. Can. J. Remote Sens 2003, 29, 88–98. [Google Scholar]
  12. Racine, M.-J.; Bernier, M.; Ouarda, T. Evaluation of RADARSAT-1 images acquired in fine mode for the study of boreal peatlands: A case study in James Bay, Canada. Can. J. Remote Sens 2005, 31, 450–467. [Google Scholar]
  13. Chen, K.S.; Yen, S.K.; Huang, W.P. A simple model for retrieving bare soil moisture from radar-scattering coefficients. Remote Sens. Environ 1995, 54, 121–126. [Google Scholar]
  14. Hoeben, R.; Troch, P.A.; Su, Z.; Mancini, M.; Chen, K.S. Sensitivity of Radar Backscattering to Soil Surface Parameters: A Comparison between Theoretical Analysis and Experimental Evidence. Proceedings of the International Geoscience and Remote Sensing Symposium (IGARSS), Singapore, 3–8 August 1997; pp. 1368–1370.
  15. Sano, E.E.; Moran, M.S.; Huete, A.R.; Miura, T. C- and multiangle Ku-band synthetic aperture radar data for bare soil moisture estimation in agricultural areas. Remote Sens. Environ 1998, 64, 77–90. [Google Scholar]
  16. Zribi, M.; Dechambre, M. A new empirical model to retrieve soil moisture and roughness from C-band radar data. Remote Sens. Environ 2003, 84, 42–52. [Google Scholar]
  17. Baghdadi, N.; Cerdan, O.; Zribi, M.; Auzet, V.; Darboux, F.; El Hajj, M.; Kheir, R.B. Operational performance of current synthetic aperture radar sensors in mapping soil surface characteristics in agricultural environments: Application to hydrological and erosion modelling. Hydrol. Process 2008, 22, 9–20. [Google Scholar]
  18. Anguela, T.P.; Zribi, M.; Baghdadi, N.; Loumagne, C. Analysis of local variation of soil surface parameters with TerraSAR-X radar data over bare agricultural fields. IEEE Trans. Geosci. Remote Sens 2010, 48, 874–881. [Google Scholar]
  19. Baghdadi, N.; Cresson, R.; Pottier, E.; Aubert, M.; Zribi, M.; Jacome, A.; Benabdallah, S. A potential use for the C-band polarimetric SAR parameters to characterize the soil surface over bare agriculture fields. IEEE Trans. Geosci. Remote Sens 2012, 50, 3844–3858. [Google Scholar]
  20. Trudel, M.; Charbonneau, F.; Leconte, R. Using RADARSAT-2 polarimetric and ENVISAT-ASAR dual-polarization data for estimating soil moisture over agricultural fields. Can. J. Remote Sens 2012, 38, 514–527. [Google Scholar]
  21. Duncan, R.G.; Pultz, T.J.; Boisvert, J.B.; Brown, R.J. Estimation of Soil Moisture Using Polarimetric Radar Data. Proceedings of the 2nd International Workshop Application of Remote Sensing in Hydrology, Saskatoon, SK, Canada, 18–20 October 1994; pp. 43–51.
  22. Baronti, S.; del Frate, F.; Ferrazzoli, P.; Paloscia, S.; Pampaloni, P.; Schiavon, G. SAR polarimetric features of agricultural areas. Int. J. Remote Sens 1995, 16, 2639–2656. [Google Scholar]
  23. Autret, M.; Bernard, R.; Vidal-Madjar, D. Theoretical study of the sensitivity of the microwave backscattering coefficient to the soil surface parameters. Int. J. Remote Sens 1989, 10, 171–179. [Google Scholar]
  24. Mattia, F.; Le Toan, T.; Souyris, J.C.; de Carolis, G.; Floury, N.; Posa, F.; Pasquariello, G. The effect of surface roughness on multifrequency polarimetric SAR data. IEEE Trans. Geosci. Remote Sens 1997, 35, 954–966. [Google Scholar]
  25. Magagi, R.D.; Kerr, Y.H. Estimating surface soil moisture and soil roughness over semiarid areas from the use of the copolarization ratio. Remote Sens. Environ 2001, 75, 432–445. [Google Scholar]
  26. Holah, N.; Baghdadi, N.; Zribi, M.; Bruand, A.; King, C. Potential of ASAR/ENVISAT for the characterization of soil surface parameters over bare agricultural fields. Remote Sens. Environ 2005, 96, 78–86. [Google Scholar] [Green Version]
  27. Engman, E.T.; Chauhan, N. Status of microwave soil moisture measurements with remote sensing. Remote Sens. Environ 1995, 51, 189–198. [Google Scholar]
  28. Moran, M.S.; Hymer, D.C.; Qi, J.; Sano, E.E. Soil moisture evaluation using multi-temporal synthetic aperture radar (SAR) in semiarid rangeland. Agric. For. Meteorol 2000, 105, 69–80. [Google Scholar]
  29. Moran, M.S.; Peters-Lidard, C.D.; Watts, J.M.; McElroy, S. Estimating soil moisture at the watershed scale with satellite-based radar and land surface models. Can. J. Remote Sens 2004, 30, 805–826. [Google Scholar]
  30. Thoma, D.P.; Moran, M.S.; Bryant, R.; Rahman, M.; Holifield-Collins, C.D.; Skirvin, S.; Sano, E.E.; Slocum, K. Comparison of four models to determine surface soil moisture from C-band radar imagery in a sparsely vegetated semiarid landscape. Water Resour. Res. 2006. [Google Scholar] [CrossRef]
  31. Shoshany, M.; Svoray, T.; Curran, P.J.; Foody, G.M.; Perevolotsky, A. The relationship between ERS-2 SAR backscatter and soil moisture: Generalization from a humid to semi-arid transect. Int. J. Remote Sens 2000, 21, 2337–2343. [Google Scholar]
  32. Jurdant, M.; Bélair, J.-L.; Gérardin, V.; Ducruc, J.-P. Inventaire du Capital-Nature. In Série de la Classification Écologique du Territoire; Pêches et Océans Canada: Québec, QC, Canada, 1977; Volume 2, p. 202. [Google Scholar]
  33. Tarnocai, C.; Kettles, I.M.; Lacelle, B. Peatlands of Canada Digital Database; Open File 3834; Geological Survey of Canada: Ottawa, ON, Canada, 2000. [Google Scholar]
  34. Dribault, Y.; Chokmani, K.; Bernier, M. Monitoring seasonal hydrological dynamics of minerotrophic peatlands using multi-date GeoEye-1 very high resolution imagery and object-based classification. Remote Sens 2012, 4, 1887–1912. [Google Scholar]
  35. Levrel, G.; Rousseau, A.N. Étalonnage de sondes FDR («frequency domain reflectometry») sur les cinq premiers centimètres des sols et des couverts de bryophytes de deux tourbières minérotrophes du milieu boréal Québécois (Canada). Can. J. Remote Sens 2010, 36, 313–331. [Google Scholar]
  36. Cobos, D.R.; Chambers, C. Calibrating ECH2O Soil Moisture Sensors. Available online: http://es.ddi.quinn.com/assets/Uploads/13393-04-CalibratingECH2OSoilMoistureProbes.pdf (accessed on 1 Octobre 2009).
  37. Campbell, C.S. Calibrating ECH 2O Soil Moisture Probes—Onset Computer Corporation. Available online: http://www.onsetcomp.com (accessed on 1 Octobre 2009).
  38. Ulaby, F.; Moore, R.K.; Fung, A.K. Microwave Remote Sensing Volume III: From Theory to Applications; Artech House, Inc.: Dedham, MA, USA, 1986; p. 1100. [Google Scholar]
  39. Jensen, J.R. Remote Sensing of the Environment: An Earth Resource Perspective, 2nd ed; Prentice Hall, Inc: Upper Saddle River, NJ, USA, 2006; p. 608. [Google Scholar]
  40. Bernier, M.; Gauthier, Y.; Dedieu, J.-P. Interprétation d’une image radar du satellite ERS-1 prise en période de fonte au Québec: Illustration du phénomène de diffusion dans les hyperfréquences. Photo-Interprét 1996, 34, 3–11. [Google Scholar]
  41. Schneider, C.; Wunderle, S.; Friedrich, M. Snow cover investigations by means of ERS-SAR imagery on the Antarctic Peninsula. EARSeL Adv. Remote Sens 1997, 5, 71–81. [Google Scholar]
  42. Torbick, N.; Persson, A.; Olefeldt, D.; Frolking, S.; Salas, W.; Hagen, S.; Crill, P.; Li, C. High resolution mapping of peatland hydroperiod at a high-latitude Swedish mire. Remote Sens 2012, 4, 1974–1994. [Google Scholar]
  43. Whitcomb, J.; Moghaddam, M.; McDonald, K.; Kellndorfer, J.; Podest, E. Mapping vegetated wetlands of Alaska using L-band radar satellite imagery. Can. J. Remote Sens 2009, 35, 54–72. [Google Scholar]
  44. Touzi, R.; Deschamps, A.; Rother, G. Phase of target scattering for wetland characterization using polarimetric C-band SAR. IEEE Trans. Geosci. Remote Sens 2009, 47, 3241–3261. [Google Scholar]
  45. Reschke, J.; Bartsch, A.; Schlaffer, S.; Schepaschenko, D. Capability of C-band SAR for operational wetland monitoring at high latitudes. Remote Sens 2012, 4, 2923–2943. [Google Scholar]
  46. Bartsch, A.; Trofaier, A.M.; Hayman, G.; Sabel, D.; Schlaffer, S.; Clark, D.B.; Blyth, E. Detection of open water dynamics with ENVISAT ASAR in support of land surface modelling at high latitudes. Biogeosciences 2012, 9, 703–714. [Google Scholar] [Green Version]
  47. Dissanska, M.; Bernier, M.; Payette, S. Object-based classification of very high resolution panchromatic images for evaluating recent change in the structure of patterned peatlands. Can. J. Remote Sens 2009, 35, 189–215. [Google Scholar]
Figure 1. Location of the “La Grande” basin in the north-central part of the Province of Quebec (Canada).
Remotesensing 05 04919f1
Figure 2. The distribution of studied “La Forge” peatlands (A and B), as well as the ground measurement location (background: GeoEye Satellite image). Below, ground photos showing a landscape view of permanently flooded (PF) and seasonally flooded peatlands (SF). FDR, frequency domain reflectometry.
Remotesensing 05 04919f2
Figure 3. The data processing sequence to extract the backscattering coefficients and to compare with ground measurements.
Remotesensing 05 04919f3
Figure 4. Distribution of mean daily measurements of surface soil moisture and precipitation with regard to maximal temperature (upper) and water table depth (lower) for year 2010 over peatland A, as well as RADARSAT-2 image acquisition dates.
Remotesensing 05 04919f4
Figure 5. Regression analysis for Δ-Index (multi-polarization and cross-polarization ratio) and surface soil moisture content (IA: FQ16–FQ20) (permanently flooded peatland A).
Remotesensing 05 04919f5
Figure 6. Ground photos taken in front of the principal pool on peatland A (date and hour; measured volumetric soil moisture in m3·m−3; red circle: FDR probe); to the right of the figure: pseudo-color representation of the cross-polarization ratio for the corresponding dates and time of ground photos (red circle = FDR probe; red triangle = ground camera; black lines = estimated perspective of the ground photos).
Remotesensing 05 04919f6
Figure 7. Error statistics of the empirical approach (Δ-Index cross polarization coefficient): bias and standard deviation (SD), as well as the RMSE. IA: FQ16 (36°) and FQ20 (39°). APF1: permanently flooded peatland A; ASF1: seasonally flooded peatland A; BPF2: permanently flooded peatland B; BSF5: seasonally flooded peatland B; PF: permanently flooded peatland; SF: seasonally flooded peatland; WET: wetlands altogether.
Remotesensing 05 04919f7
Figure 8. Error distribution from cross-validation: estimated and measured surface soil moisture. IA: FQ16 (36°) and FQ20 (39°): (a) peatland A, (b) peatland B, (c) permanently and seasonally flooded peatlands, (d) all peatlands.
Remotesensing 05 04919f8
Table 1. Specifications on peatland polygons studied (A and B) at three levels of the landscape’s spatial disaggregation, from detailed to general scales (from I to III, respectively).
I Landscape “Detailed”II LandscapeIII Landscape “General”
A PF1PFA + B (WET)
A SF1
B PF2SF
B SF5
PF: permanently flooded; SF: seasonally flooded; WET: wetlands altogether.
Table 2. Dates and mode of the RADARSAT-2 images acquired in 2009 and in 2010, as well as environmental conditions (5 days cumulated precipitation, mean surface soil moisture and mean water table depth).
Year 2009*
Year 2010
Month DayIAPPC5 mmhv m3·m−3wtd mMonth DayIAPPC5 mmhv m3·m−3wtd m
05-18FQ1633.60.41-05-20FQ205.2--
05-25FQ208.6--05-30FQ120.00.67-
06-04FQ120.90.77-06-06FQ1614.40.75−0.03
06-11FQ167.20.73-06-13FQ201.2-−0.10
06-18FQ208.3--06-23FQ128.60.65−0.11
06-28FQ1210.7--06-30FQ1616.00.71−0.06
07-05FQ1612.7--07-07FQ2011.0-−0.05
07-12FQ209.6--07-17FQ1218.80.75−0.02
07-22FQ1212.2--07-24FQ1620.60.74−0.05
07-29FQ167.3--07-31FQ2014.2-−0.03
08-05FQ2057.8--08-17FQ1635.00.780.00
08-15FQ127.6--08-24FQ201.40.77−0.02
08-22FQ1631.6--09-03FQ1210.60.77−0.02
08-29FQ2047.1--09-10FQ163.20.79−0.02
09-08FQ129.9--09-17FQ203.8-−0.03
09-15FQ162.2--09-27FQ121.40.82−0.02
09-22FQ2017.8--10-04FQ169.20.78−0.01
10-02FQ1232.2--10-11FQ20---
PPC5: 5 days cumulated precipitation; hv: mean surface volumetric soil moisture; wtd: mean water table depth; IA: incidence angle; FQ12 (31.5°–32.9°); FQ16 (35.6°–37.0°); FQ20 (39.4°–40.7°);
*A data transfer error caused the loss of registered terrain information for year 2009.
Table 3. Statistics of soil moisture and water table depth ground measurements per polygon (years 2009 and 2010): volumetric soil moisture (hv) in m3·m−3; water table depth (wtd) in m (the surface soil level being zero).
Peatland TypeA
B
PFSFPFSF
Polygon code1125
Station code2 and 3156
Meanhv0.500.440.640.58
wtd−0.04−0.03−0.06−0.10
Rangehv[0.15 to 0.97][0.12 to 1.00][0.15 to 0.98][0.09 to 1.00]
wtd[−0.53 to 0.02][−0.69 to 0.01][−0.44 to 0.05][−0.33 to −0.02]
Standard Deviationhv0.260.200.310.27
wtd0.050.040.070.04
hv: mean surface volumetric soil moisture; wtd: mean water table depth; PF: permanently flooded; SF: seasonally flooded.
Table 4. Regression adjustments for HH, HV, VV and HH/HV, respectively (r2 for soil moisture). Points used in the regression analysis: 13 for peatland A and 12 for peatland B.
I (r2)
II (r2)
III (r2)
HHHVVVHV/HHHHHVVVHV/HHHHHVVVHV/HH
FQ12–FQ16
APF1PFWET
0.270.470.370.310.280.320.290.150.460.280.350.00
ASF1
0.230.090.130.06
BPF2SF
0.340.210.370.080.430.200.240.05
BSF5
0.360.450.260.11

FQ16–FQ20
APF1PFWET
0.410.780.560.80.000.050.020.200.510.640.460.64
ASF1
0.460.400.320.21
BPF2SF
0.260.500.310.640.430.570.290.46
BSF5
0.060.520.020.23
PF: permanently flooded; SF: Seasonally flooded; WET: wetlands altogether; IA: incidence angle; FQ12 (31.5°–32.9°); FQ16 (35.6°–37.0°); FQ20 (39.4°–40.7°).
Table 5. Regression adjustments for Δ-Index cross polarization ratio (HV/HH) and surface soil moisture (IA1 = FQ12–FQ16 and IA2 = FQ16–FQ20).
Ir2IIr2IIIr2
APF1IA1 0.34PFIA1 0.27WETIA1 0.22
IA2 0.92
ASF1IA1 0.14IA2 0.80
IA2 0.60
BPF2IA1 0.08SFIA1 0.00IA2 0.82
IA2 0.79
BSF5IA1 0.02IA2 0.64
IA2 0.61
PF: permanently flooded; SF: seasonally flooded; WET: wetlands altogether; IA1: FQ12–FQ16; IA2: FQ16–FQ20; IA: incidence angle; FQ12 (31.5°–32.9°); FQ16 (35.6°–37.0°); FQ20 (39.4°–40.7°).
Table 6. Backscattering coefficient (σ° in db) for HH and HV polarization, as well as the cross-polarization ratio (HV/HH), for different sites at peatland A. IA: FQ16 (36°) and FQ20 (39°).
DateFDR Probe SiteMain Pool Site

σ°HHσ°HVHV/HHσ°HHσ°HVHV/HH
With snow18 May 2009−12−24−12−16−31−15
humid snowmoist snow surface signal absorption by the snow

25 May 2009−18−26−8−20−30−10
more humid snowsmooth and moist snow signal absorption by the snow

Without snow11 June 2009−15−24−9−25−30−5
humid soil-vegetation complexcalm water (mirror reflection)

5 July 2009−12−21−9−19−26−7
humid soil-vegetation complexwaved water surface

29 July 2009−8−19−11−21−24−3
less humid soil-vegetation complexopen water (mirror reflection)
Table 7. Eco-hydrological hierarchical classification of boreal wetlands (adapted from [34]; lawn = grass).
GroupClassesSub-ClassesPeatland
Watershallow waterpool objects, low water depth, possible presence of vegetationPermanently flooded
Peatlawn and waterpools edge objects, mix of lawn and water, water table at surface
Flark objects, water table at surface
low lawnlawn objects dominated by sphagnum with possible presence of herbaceous, water table near surface
upper lawnlawn objects dominated by herbaceous and possible presence of sphagnum and bryophytes, deep water tableSeasonally Flooded
hummock and forest edgehummock objects dominated by sphagnum, bryophytes and ericaceous shrubs, deep water table
forest edge objects dominated by shrubs and conifers, deep water table

