Article

Evaluation of ALOS PALSAR Imagery for Burned Area Mapping in Greece Using Object-Based Classification

by
Anastasia Polychronaki
1,*,
Ioannis Z. Gitas
1,
Sander Veraverbeke
2 and
Annekatrien Debien
3
1
Laboratory of Forest Management and Remote Sensing, Aristotle University of Thessaloniki, P.O. Box 248, GR-54124 Thessaloniki, Greece
2
Jet Propulsion Laboratory, California Institute of Technology, 4800 Oak Grove Drive, Pasadena, CA 91109, USA
3
KSAT, Prestvannvegen 38, N-9291 Tromsø, Norway
*
Author to whom correspondence should be addressed.
Remote Sens. 2013, 5(11), 5680-5701; https://doi.org/10.3390/rs5115680
Submission received: 30 September 2013 / Revised: 24 October 2013 / Accepted: 24 October 2013 / Published: 4 November 2013

Abstract

:
In this work, the potential of Advanced Land Observing Satellite (ALOS) Phased Array type L-band Synthetic Aperture Radar (PALSAR) imagery to map burned areas was evaluated in two study areas in Greece. For this purpose, we developed an object-based classification scheme to map the fire-disturbed areas using the PALSAR imagery acquired before and shortly after fire events. The advantage of employing an object-based approach was not only the use of the temporal variation of the backscatter coefficient, but also the incorporation in the classification of topological features, such as neighbor objects, and class related features, such as objects classified as burned. The classification scheme resulted in mapping the burned areas with satisfactory results: 0.71 and 0.82 probabilities of detection for the two study areas. Our investigation revealed that the pre-fire vegetation conditions and fire severity should be taken in consideration when mapping burned areas using PALSAR in Mediterranean regions. Overall, findings suggest that the developed scheme could be applied for rapid burned area assessment, especially to areas where cloud cover and fire smoke inhibit accurate mapping of burned areas when optical data are used.

1. Introduction

It is argued that wildfires have ceased to be a natural ecological factor and have become an anthropogenic factor of regular and intense occurrence [1]. The increased intensity during burning in tropical regions, temperate, and boreal forests and the increasing trend in the occurrence of fire events in boreal regions as a result of climate change emphasize the importance of improving our understanding of global biomass burning [2], and underlines the need for the development of a reliable procedure to accurately and rapidly map burned areas.
Satellite remote sensing is a valuable tool for fire detection, mapping, and managing fire-prone areas [2]. In particular, optical satellite data have been extensively used and proved to be useful for mapping of burned areas [37]. However, accurate mapping could be inhibited in areas with frequent cloud coverage, such as tropical and boreal forests [8]. In contrast, Synthetic Aperture Radar (SAR) imagery has the ability to penetrate clouds and fire smoke [9] providing invaluable information on burned areas. SAR has not only been used for various ecological applications, such as vegetation mapping and biomass estimation [10], but has also been used for burned area mapping, given that the backscatter signal is sensitive to vegetation structure and biomass: removal of leaves and branches from trees due to fire alters the scattering mechanisms causing temporal variations of the backscatter coefficient.
The effect of fires on the backscatter coefficient has been exploited in several fire-related studies. For example, Bourgeau-Chavez et al. [11] and Bourgeau-Chavez et al. [12] identified fire scars in boreal forests by exploiting the enhanced C-band backscatter from burned areas. Siegert and Hoffman [13] employed principal component analysis and multi-temporal European Remote Sensing Satellite (ERS) SAR images to map forest fires, while Gimeno et al. [14] achieved the identification of burned areas in a Mediterranean region using an ERS-2 time series with neural network classification. Moreover, research on forest fires in boreal forests has shown that the backscatter intensity from burned scars is stronger than that from unburned areas due to changes in moisture content [11,12,1517]. Siegert and Ruecker [18] and Huang and Siegert [19] made similar observations in a tropical rain forest environment, but found that fires caused a decrease in backscatter under dry weather conditions whereas under wet conditions burned areas could not be discriminated from unburned areas.
In this work, we employed object-based image analysis (OBIA) to map fire-affected areas using SAR images. Several studies demonstrated that OBIA results in accurate land-cover mapping [20,21], as well as burned area mapping [22] when SAR imagery was employed. As, the basic processing units of OBIA are image objects and not single pixels, the disturbing effects of speckle and other noise of SAR are diminished because only the average pixel values of each object are considered by the classifier [23,24]. One more motivation for using OBIA is the advantage of the object-based approach to incorporate in the classification an increased uncorrelated feature space using object’s statistics (e.g., mean values and standard deviations) and topological features (e.g., neighbor objects) [25].
Therefore, the aim of this work was to investigate the potential of OBIA to map burned areas in two study areas in Greece using multi-temporal ALOS PALSAR data. We chose to employ PALSAR data, because even though the use of PALSAR has been demonstrated in a wide array of global environmental application areas [23,2629] thus far, has had rather limited applications in the mapping of burned areas [30,31].
Our evaluation on PALSAR imagery revealed that the pre-fire vegetation conditions and fire severity did not allow the object-based mapping of burned areas with very high accuracy.

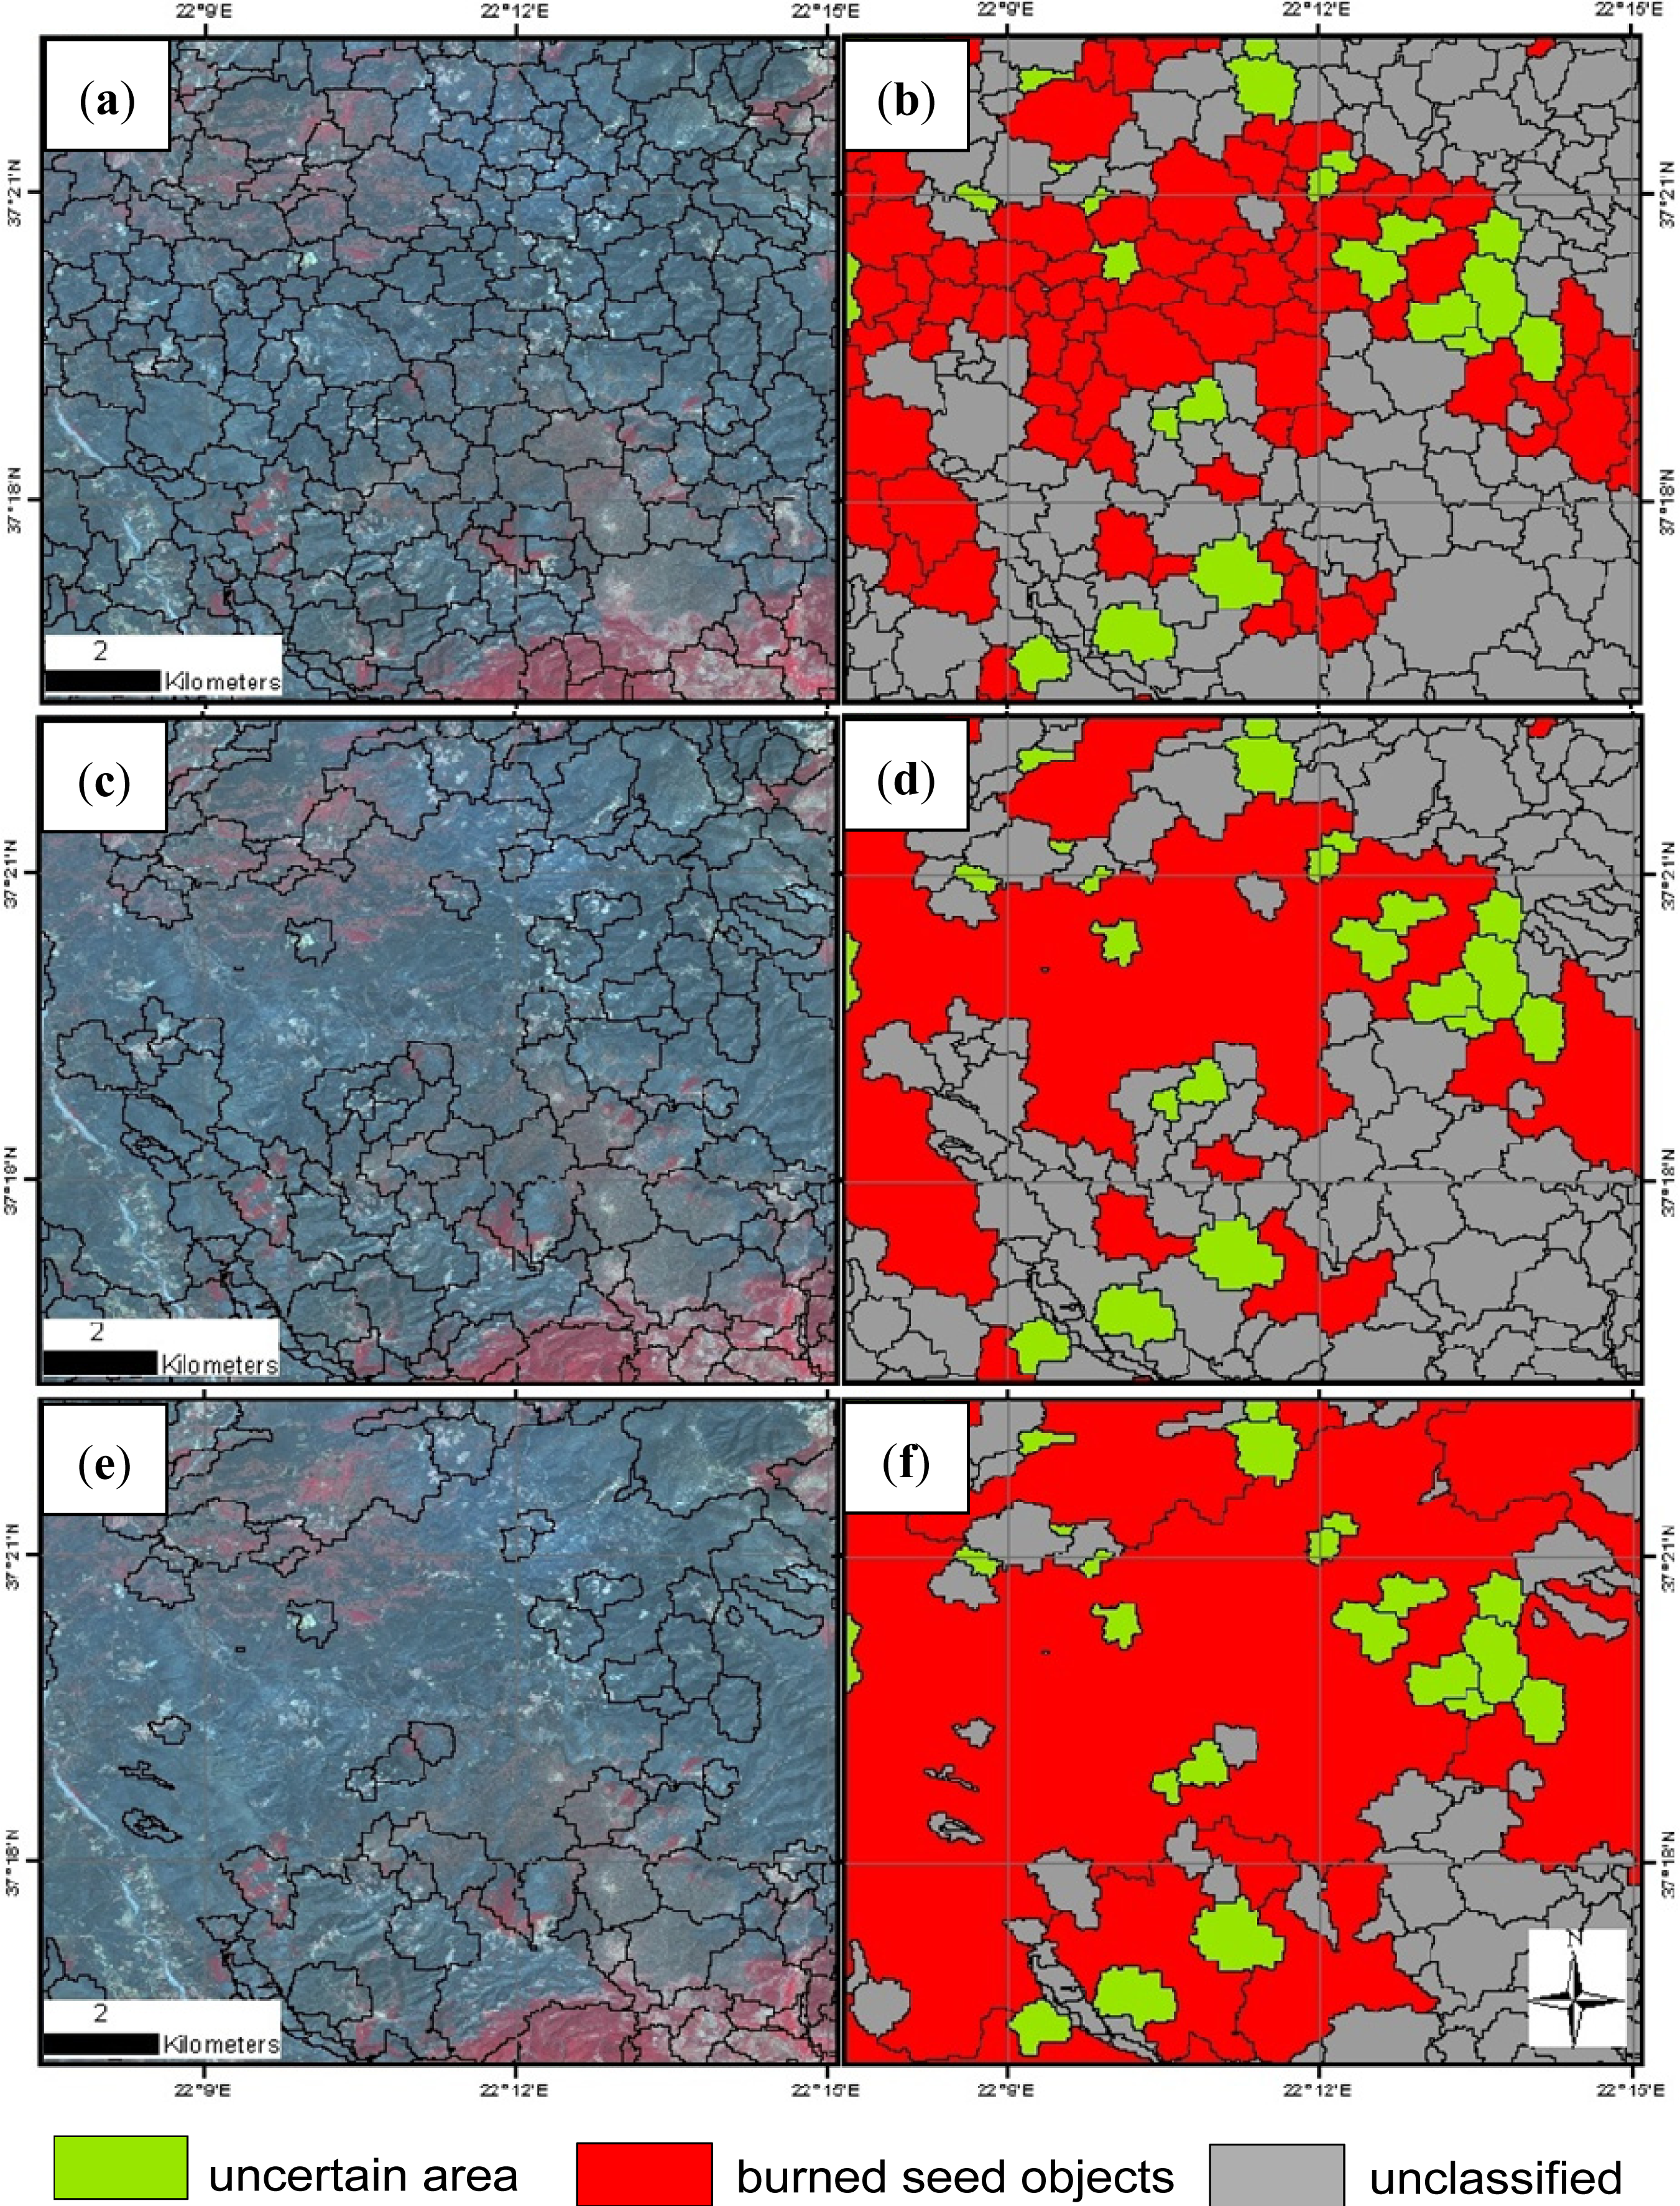
2. Study Area and Dataset Description

We investigated fires that occurred during the summers of 2007 and 2008 in the Greek regions of the Peloponnese peninsula and Rhodes Island, respectively (Figure 1b). During the summer of 2007, Greece faced the worst natural disaster recorded in recent decades in terms of human losses, the number of fire outbreaks, and the extent of the estimated burned area [32], mainly affecting large areas of Western and Southern Peloponnese. In this work, we investigate the fire-affected area located near the town of Megalopoli in the Peloponnese (Figure 1b). The area is characterized by a complex topography elevation ranging from 60 to 1,300 m above sea level on slopes up to 43° with heterogeneous pre-fire vegetation conditions: grasslands with sclerophyllous shrubs and agricultural areas dominated the area, whereas the forested areas consisted mainly of black pines (Pinus nigra) and oak trees (Quercus sp). The second study area is Rhodes Island, where a large wildfire occurred in late July of 2008. The island is located in the southeast part of the Aegean Sea (Figure 1b) and is characterized by a moderate topography elevation ranging from sea level to 550 m on slopes below 30°. The fire-affected areas were characterized by homogeneous pre-fire vegetation conditions: the dominant land-cover type found in Rhodes was brutia pine (Pinus brutia) forest whereas grassland with sclerophyllous shrubs and phrygana (i.e., dwarf shrubs), as well as agricultural areas (olive trees and vineyards) were also present (Figure 1c).
For this work different types of earth observation (EO) data were acquired (Table 1). More specifically, for the study area of the Peloponnese, two ALOS PALSAR fine-beam dual-polarization (FBD) (Horizontal-to-Horizontal (HH) and Horizontal-to-Vertical (HV) polarizations) images acquired at 39° with a pixel spacing of 9.4 m in slant range and 3.1 m in azimuth, were delivered in single-look complex (SLC) format: one image acquired before the fire event (8 August 2007) and one after (23 September 2007). Similarly, for Rhodes Island two PALSAR FBD SLC images were acquired: one before (24 May 2008) and one after the fire event (9 October 2008).
Satellites Pour l’Observation de la Terre (SPOT)-4 High-Resolution Visible and Infrared (HRVIR) images at 20 m spatial resolution ((Green: 0.50–0.59 μm), Red (0.61–0.68 μm), NIR (0.78–0.89 μm), SWIR (1.58–1.75 μm)) acquired before and after the fire events were also available for the two study areas. The SPOT images were used to produce land-cover maps and to calculate a fire severity index. To assess the burned area classification accuracy we obtained very high-resolution (VHR) images acquired after the fire events. The VHR comprised one SPOT-5 High Resolution Geometric (HRG) image at 10 m spatial resolution and two IKONOS pan-sharpened multi-spectral images at 1-m spatial resolution (Blue (0.445–0.516 μm), Green (0.506–0.595 μm), Red (0.632–0.698 μm), NIR (0.757–0.853 μm)), for the Peloponnese and for Rhodes fires, respectively (Table 1). The IKONOS images were ordered on demand and purchased by World Wide Fund (WWF)-Hellas together with the prefecture of Dodecanese, Greece. In addition, Shuttle Radar Topography Mission (SRTM) Digital Elevation Models (DEMs) (90 m spatial resolution) were acquired for both study areas (data were downloaded from [33]).
Given the sensitivity of the backscatter to soil moisture [17,34,35] we collected meteorological data from nearby stations for both study areas (data provided by the Hellenic National Meteorological Service). More specifically, the station in the Peloponnese was located at the airport of Kalamata, approximately 30 km away from the burned area under investigation: 22 mm of precipitation were recorded one day before the acquisition of the second PALSAR image (acquired on 23 September 2007). The meteorological station in Rhodes Island was located in the Rhodes airport, about 35 km away from the center of the burned area. In this case no precipitation was recorded shortly before as well as on the dates of the image acquisitions.

3. Methodology

3.1. Dataset Pre-Processing

Pre-processing initially included the image-to-image geometric correction of the SPOT-4 HRVIR images to the VHR reference images (i.e., the SPOT-5 and IKONOS for the Peloponnese and Rhodes Island, respectively) using bilinear interpolation. This step was necessary because the images were acquired at different angles. The total root mean square errors associated with the Ground Control Points (GCPs) used to geometrically correct the images did not exceed 0.5 pixels. Subsequently, the SPOT-4 images were atmospherically corrected: to convert the raw digital numbers (DN) to surface reflectance values the Cosine of Solar Zenith Angle Correction (COST) method, [36], was used.
Furthermore, the SPOT-4 images acquired before the fire events were visually interpreted and manually digitized for generating land cover maps for the two study areas. The interpretation was aided by available forest maps in analogue format, VHR images available in Google Earth and thematic maps of agricultural areas (1:5,000 scale). In addition, due to the absence of official fire perimeters, reference perimeters were generated from photointerpretation and digitization of the available VHR images.
The SAR pre-processing procedure was performed in three steps using the SARscape software (ENVI SARscape 4.3, Exelis Visual Information Solutions). These steps included: multilooking, geocoding, radiometric calibration and normalization. The images were multi-looked (1 range and 8 azimuth) and geocoded to 25 m pixel size. Geocoding was carried out following the Range-Doppler approach using the SRTM DEMs in geographic map projection (latitude/longitude) and World Geodetic System (WGS)-84 datum [37]. The radiometric calibration was carried out by following the radar equation law [37], and the radiometric normalization was performed using the semi-empirical correction available from SARscape. The backscatter dependency is estimated through linear regression of the cosine of the local incidence angle and the backscattering coefficient in logarithmic form (SARscape Help). The images were extracted in gamma naught (γ°) format and were multiplied by one hundred to facilitate the subsequent object-based image analysis. In addition, a mask was generated indicating the layover and shadow areas, which were excluded from further processing. Specifically, 196 hectares were excluded in the Peloponnese. We did not use any filtering for the SAR images, not only because multi-looking had already reduced the speckle noise [38], but also because we use in our analysis objects (and not single pixels) which enable further reduction of the speckle [23,24].
Finally, all resulted thematic maps were reprojected into the EGSA projection system (Greek grid) for further analysis. In summary, the following information was available for both study areas following the pre-processing of the EO data: PALSAR images in gamma naught (γ°) format, pre-fire land-cover maps, and reference fire perimeters.

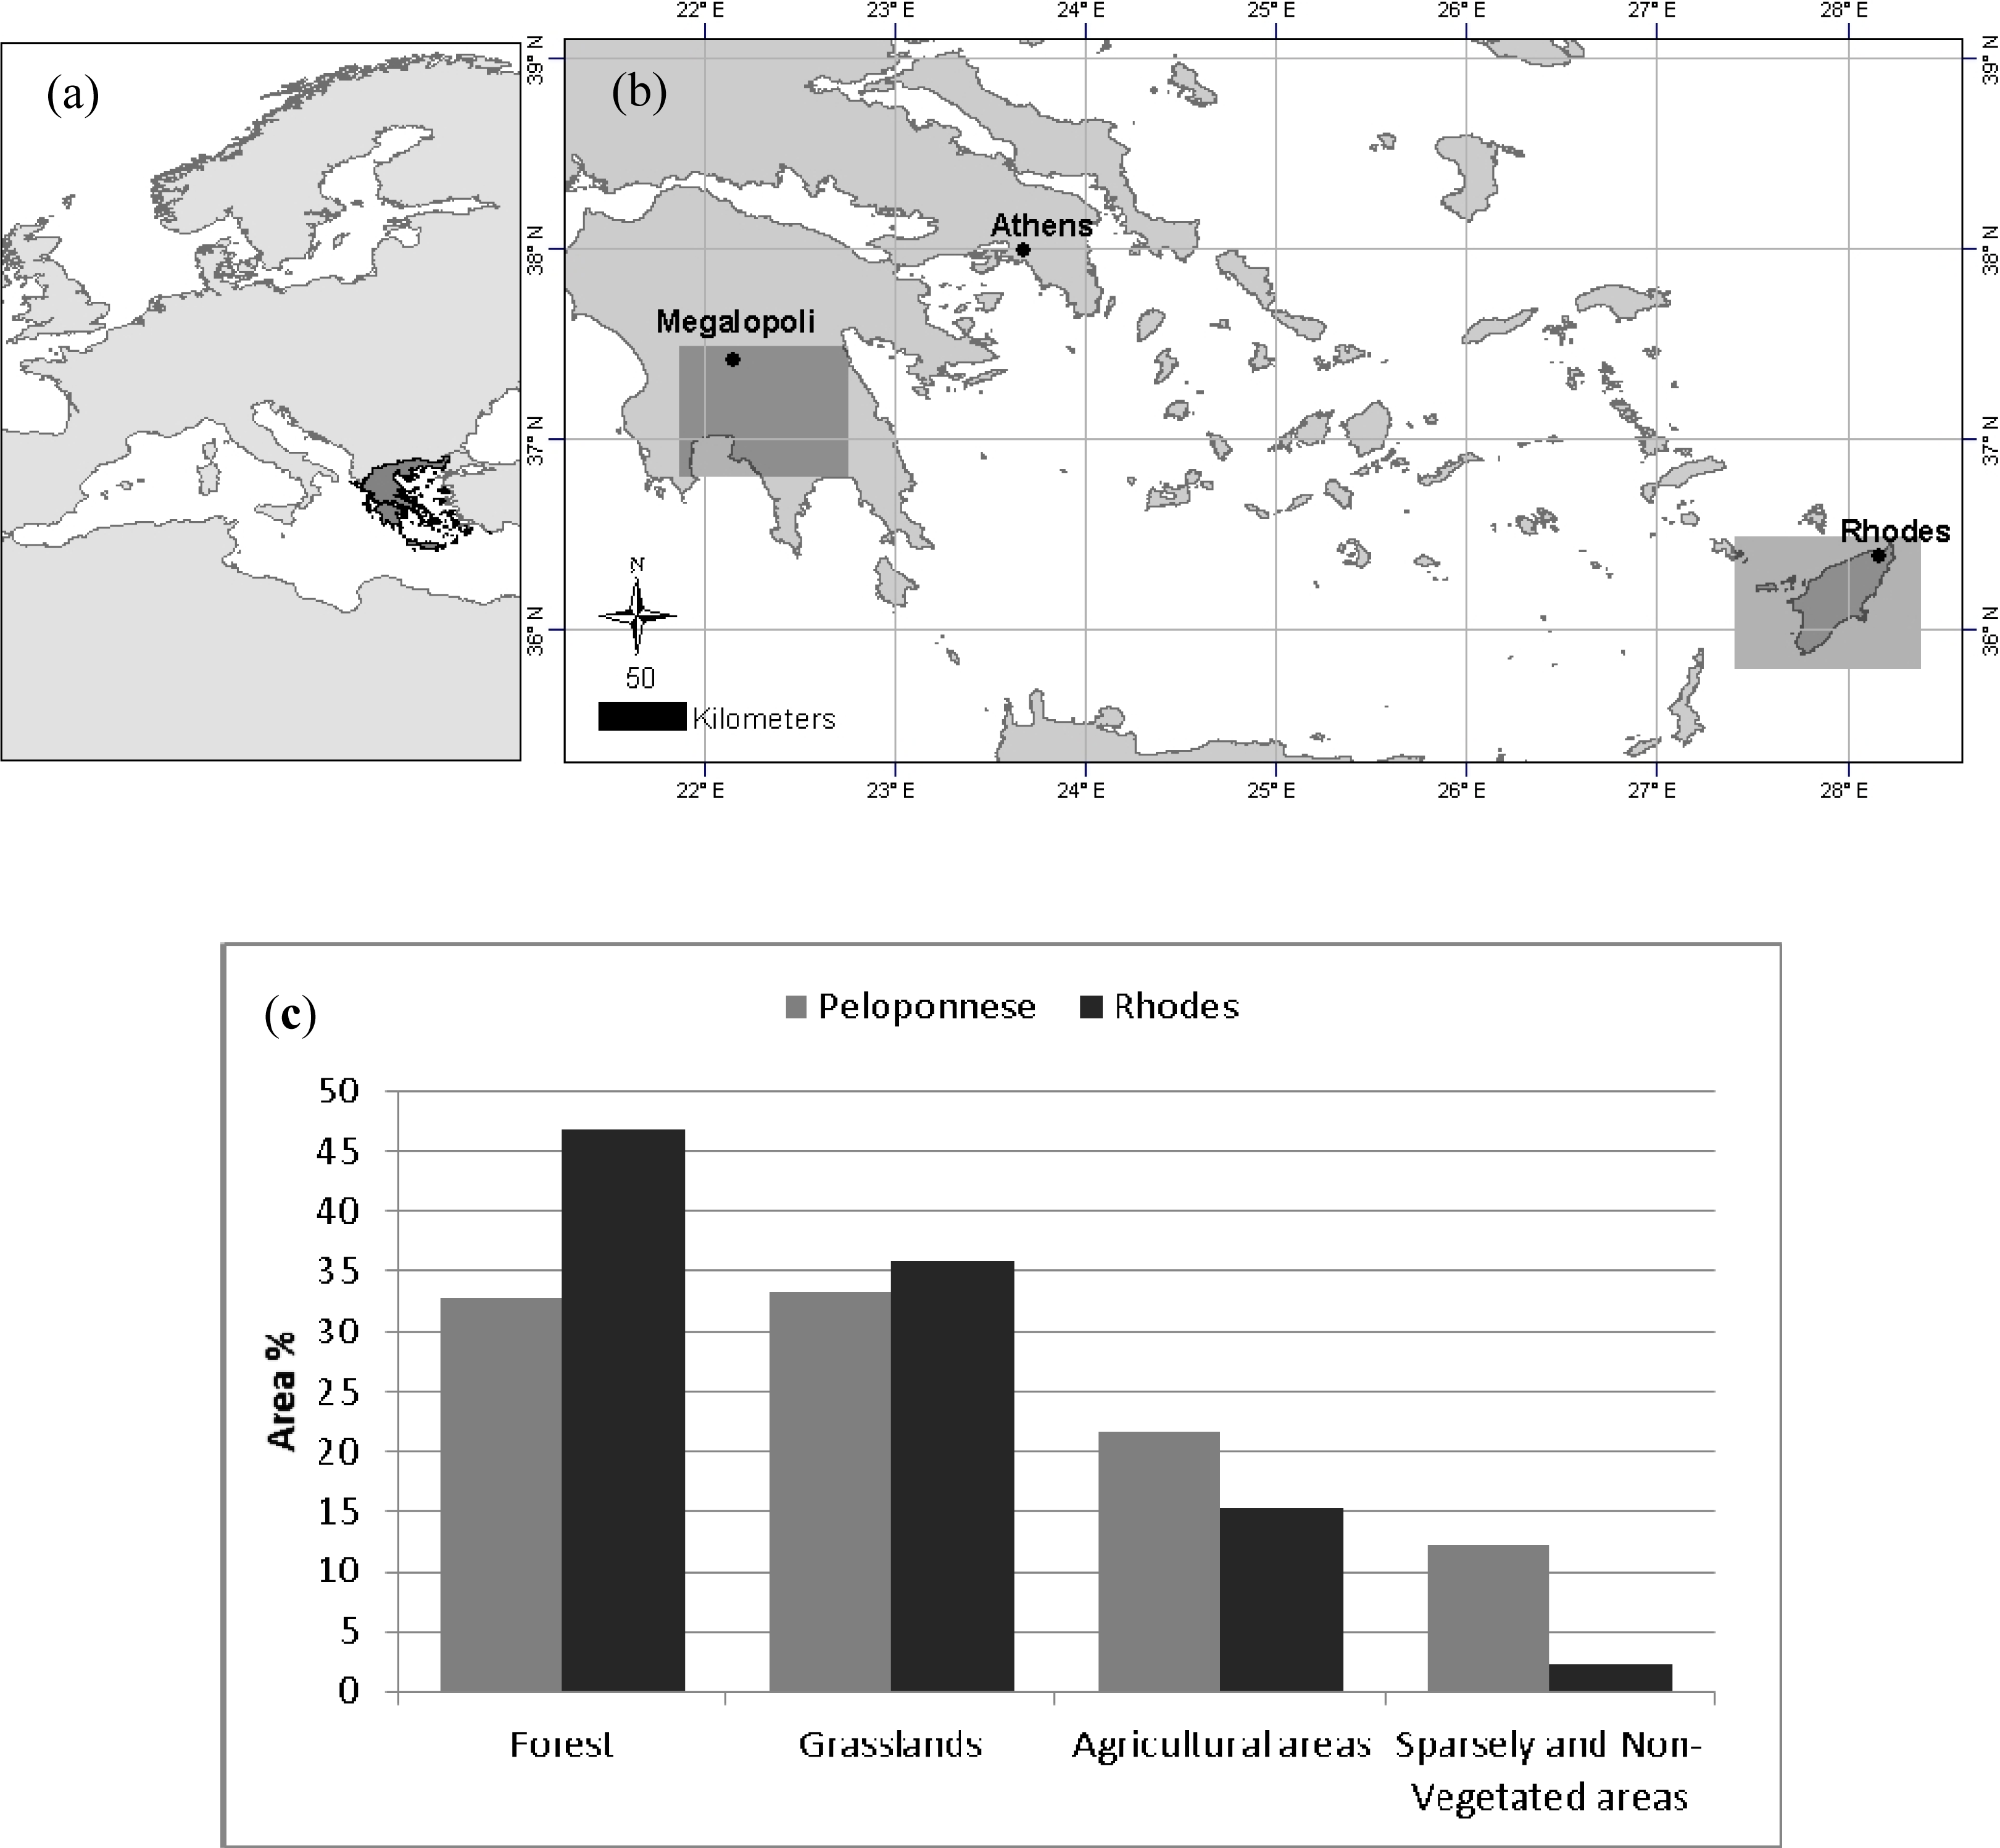
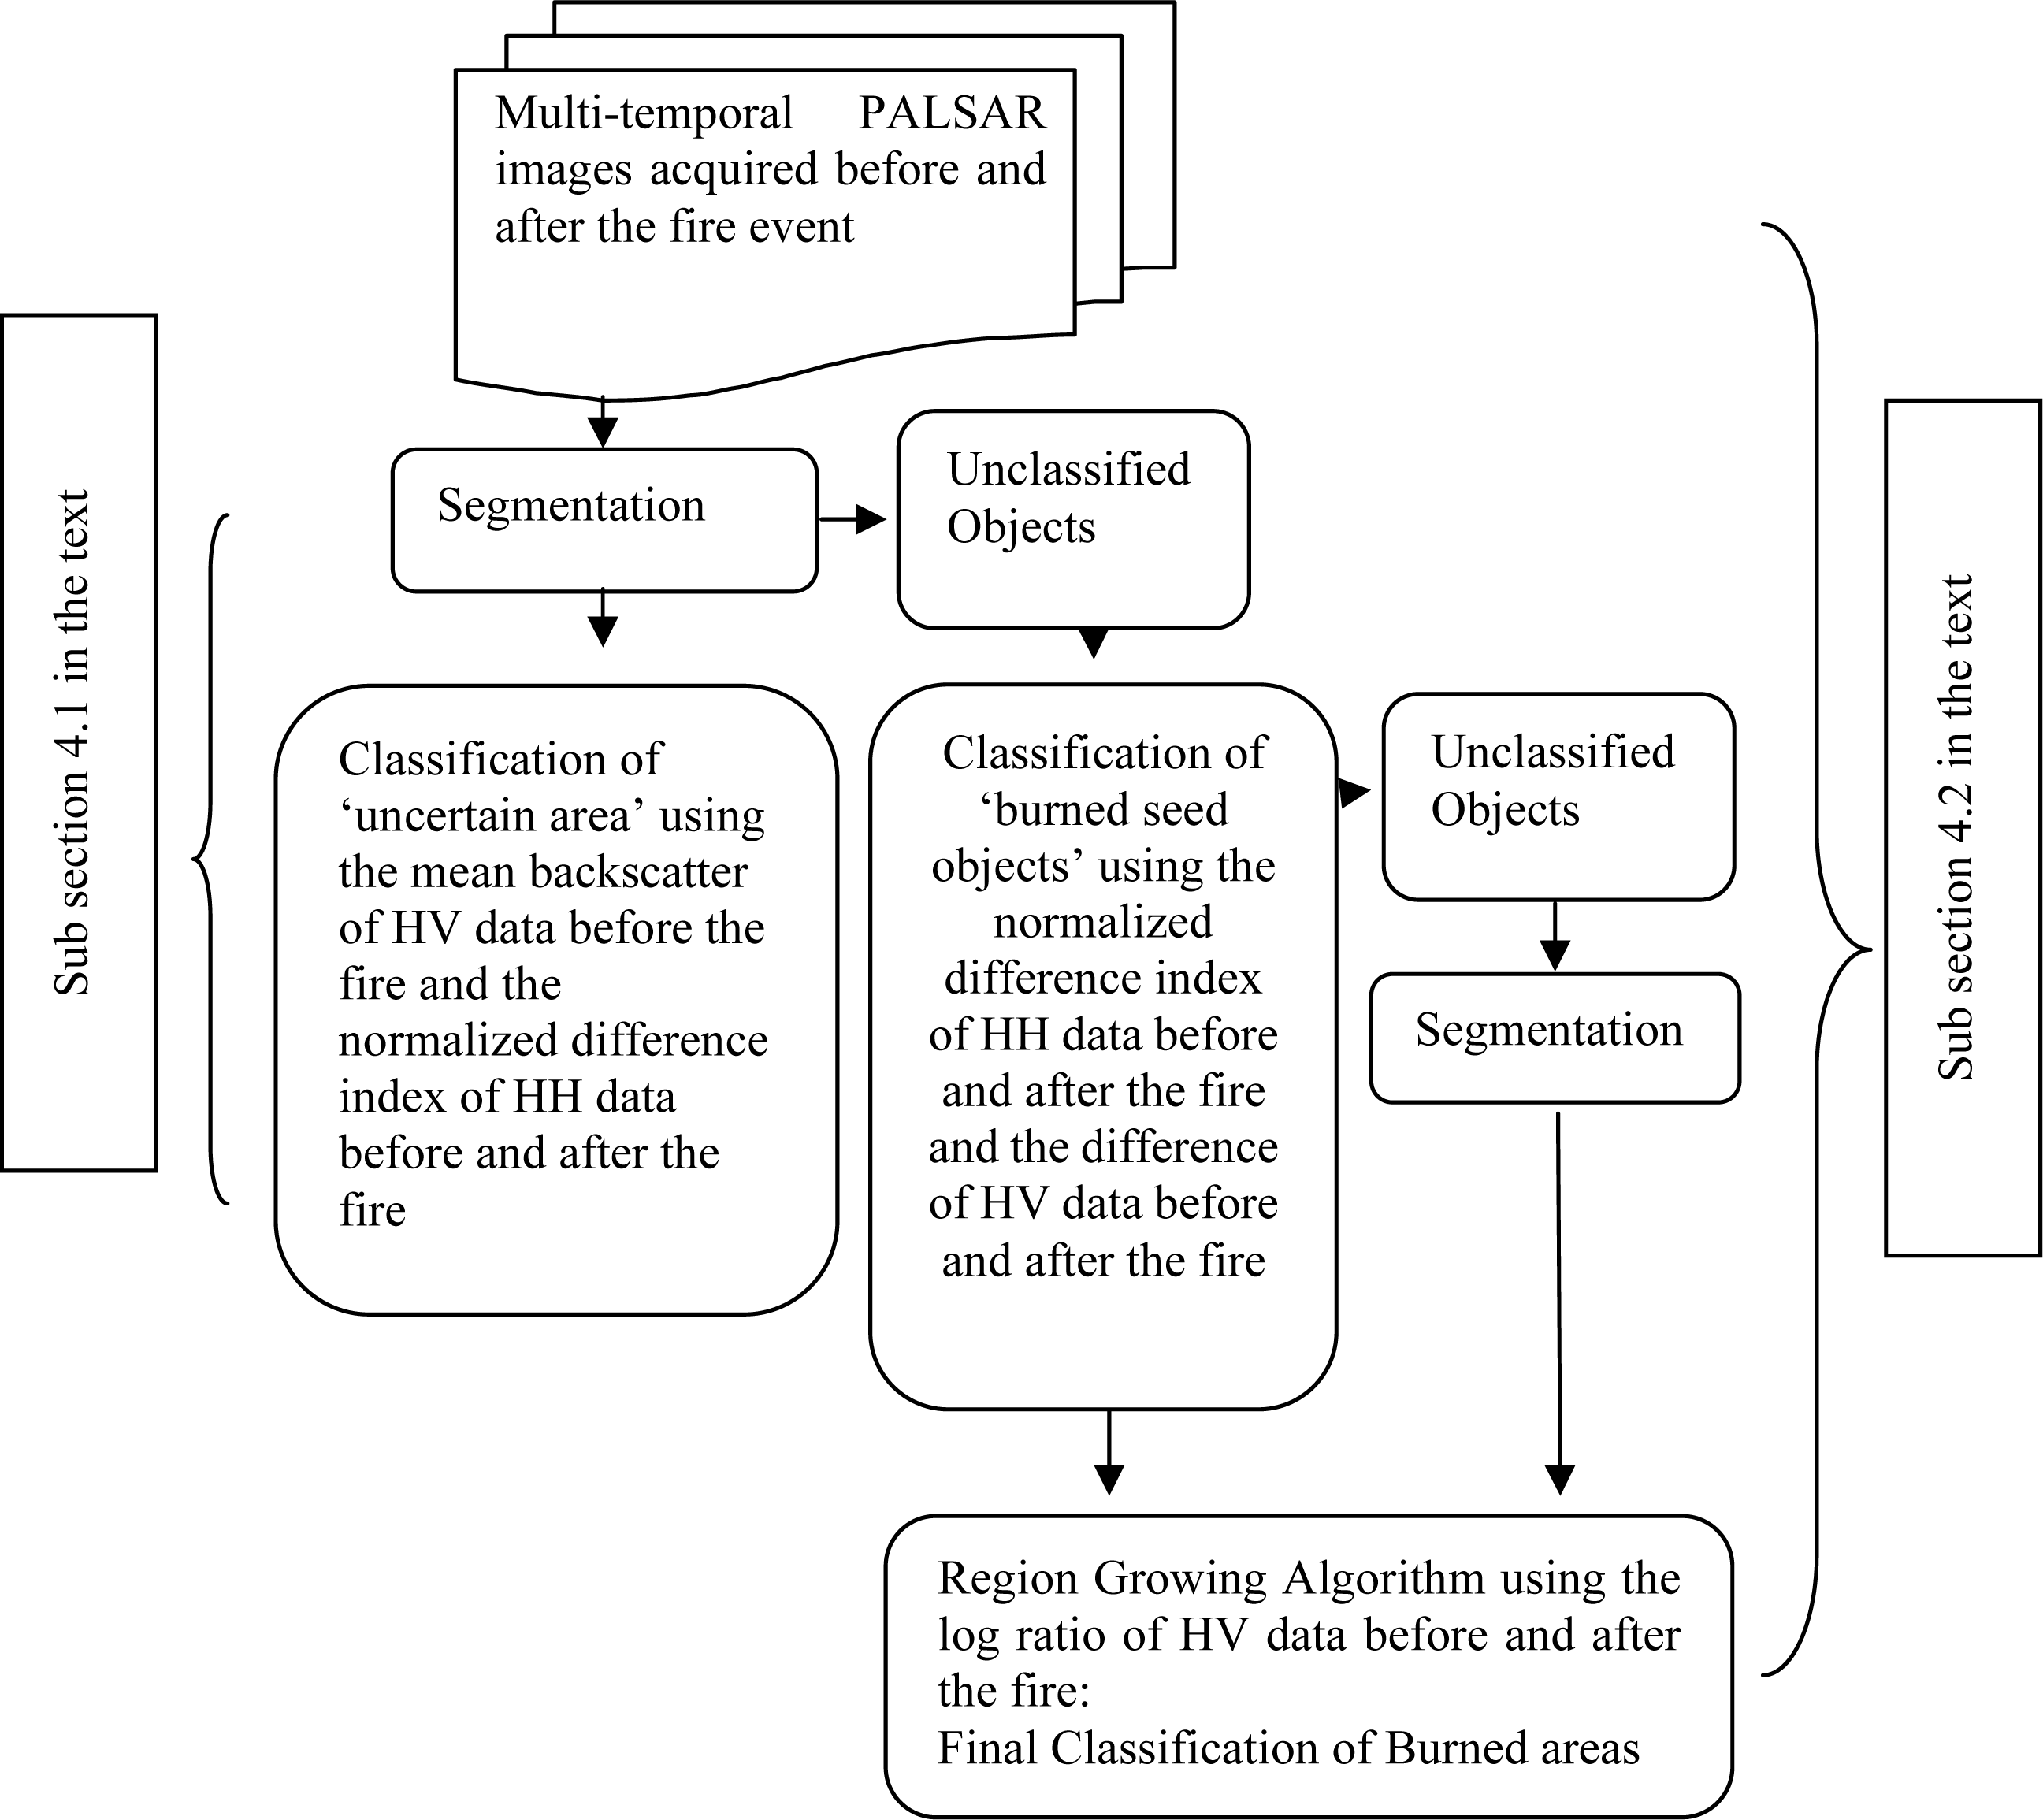
3.2. Burned Area Mapping Using Object-Based Image Analysis (OBIA)

We used eCognition Developer 8 (Trimble Geospatial Imaging) software to develop the classification scheme for burned area mapping. eCognition’s multi-resolution segmentation is a bottom up region-merging technique starting with one-pixel objects. In subsequent steps, smaller image objects are merged into bigger ones. The size of the objects is determined by the scale parameter and the heterogeneity criterion. The scale is an abstract term, which determines the upper limit for a permitted change of heterogeneity throughout the segmentation process (the smaller the value the smaller the object’s size). Heterogeneity considers as primary object features color (radiometry) and shape [25]. Color and shape are complementary and add up to one. However, the shape criterion cannot have value greater than 0.9, because otherwise the resulting objects will not be related to their radiometry. The shape criterion is also defined by the complementary criteria smoothness and compactness (values range from 0 to 1).
The temporal variation of the backscatter coefficient is important information to map burned areas [13,14]. In particular, we aimed to exploit this information from the PALSAR images acquired before and after the fire event within the OBIA environment to identify fire-affected areas by means of change detection. Change detection in SAR involves mainly the subtraction or division of two SAR images, followed by thresholding [39]. Here, we tested several approaches that are used in SAR for change detection with pixel-based classifications. These approaches were modified for our object-based approach and included the normalized difference index of objects (NDI) [40], which is defined as follows:
NDI = ( ( DATE 1 DATE 2 ) ) / ( ( DATE 1 + DATE2 ) )
where, DATE1 and DATE2 correspond to the SAR image objects acquired before and after the fire event, respectively.
In addition, three more approaches were employed, namely the object’s difference in decibels (dB) (Od), the object’s ratio and the object’s log ratio (Olr) [41,42], which are defined as follows:
O d = DATE 1 ( dB ) DATE2 ( dB )
O lr = DATE 1 / DATE2
O lr = log ( DATE 1 / DATE 2 )

3.3. Accuracy Assessment

We assessed the ability of the developed object-based classification scheme to accurately map burned areas by estimating the agreement between the burned area maps resulting from the scheme and the reference maps, for the two study areas. All maps were converted to raster images of 25 m pixel size and an image-to-image comparison was performed using all pixels. Accuracy measurements were determined in terms of the probability of detection (Pd) and probability of false alarm (Pf) [43]:
P d = M ff / ( M ff + M nf )
P f = M fn / ( M ff + M nn )
where Mff is the number of correctly classified fire pixels, Mnn is the number of correctly classified non-fire pixels, Mnf is the number of pixels assigned as non-fire by the classification while assigned as fire in the reference map and Mfn is the number of pixels assigned as fire by the classification, while assigned as non-fire in the reference map.
Furthermore, we analyzed our classification result in terms of a fire severity index since studies showed that the backscatter coefficient of burned areas varies as a function of fire severity [44]. For this purpose, the available SPOT-4 images for both study areas were used. The differenced Normalized Burn Ratio (dNBR) is accepted as the standard spectral index [45,46], nevertheless, dNBR incorporates a band in the wavelength between 2.08–2.35 μm, which is not present in the SPOT-4 images used for this work. However, Veraverbeke et al. [46] evaluated the relationship between field data from 160 Geo Composite Burn Index (GeoCBI) plots and several pre- and post-fire differenced vegetation indices for the fires occurred in the Peloponnese in the summer of 2007. These authors found that the differenced Normalized Difference Moisture Index (dNDMI) approach gave a reasonable correlation with GeoCBI field data (R2 = 0.51) and, therefore, the dNDMI was used in this work to define the degrees of severity for the selected sites. The dNDMI incorporates the near-infrared (NIR) (0.78–0.89 μm) and short-wave infrared (SWIR) bands (1.58–1.75 μm) of SPOT-4 images and is defined as:
dNDMI = NDMI prefire NDMI postfire
where , NDMI = ( NIR SWIR ) / ( NIR + SWIR )
The value range of dNDMI was −2 to 2 and values closer to 2 represent increased fire severity while the continuous dNDMI was reclassified into dNDMI classes, each being 0.1 units wide.

4. Results and Discussion

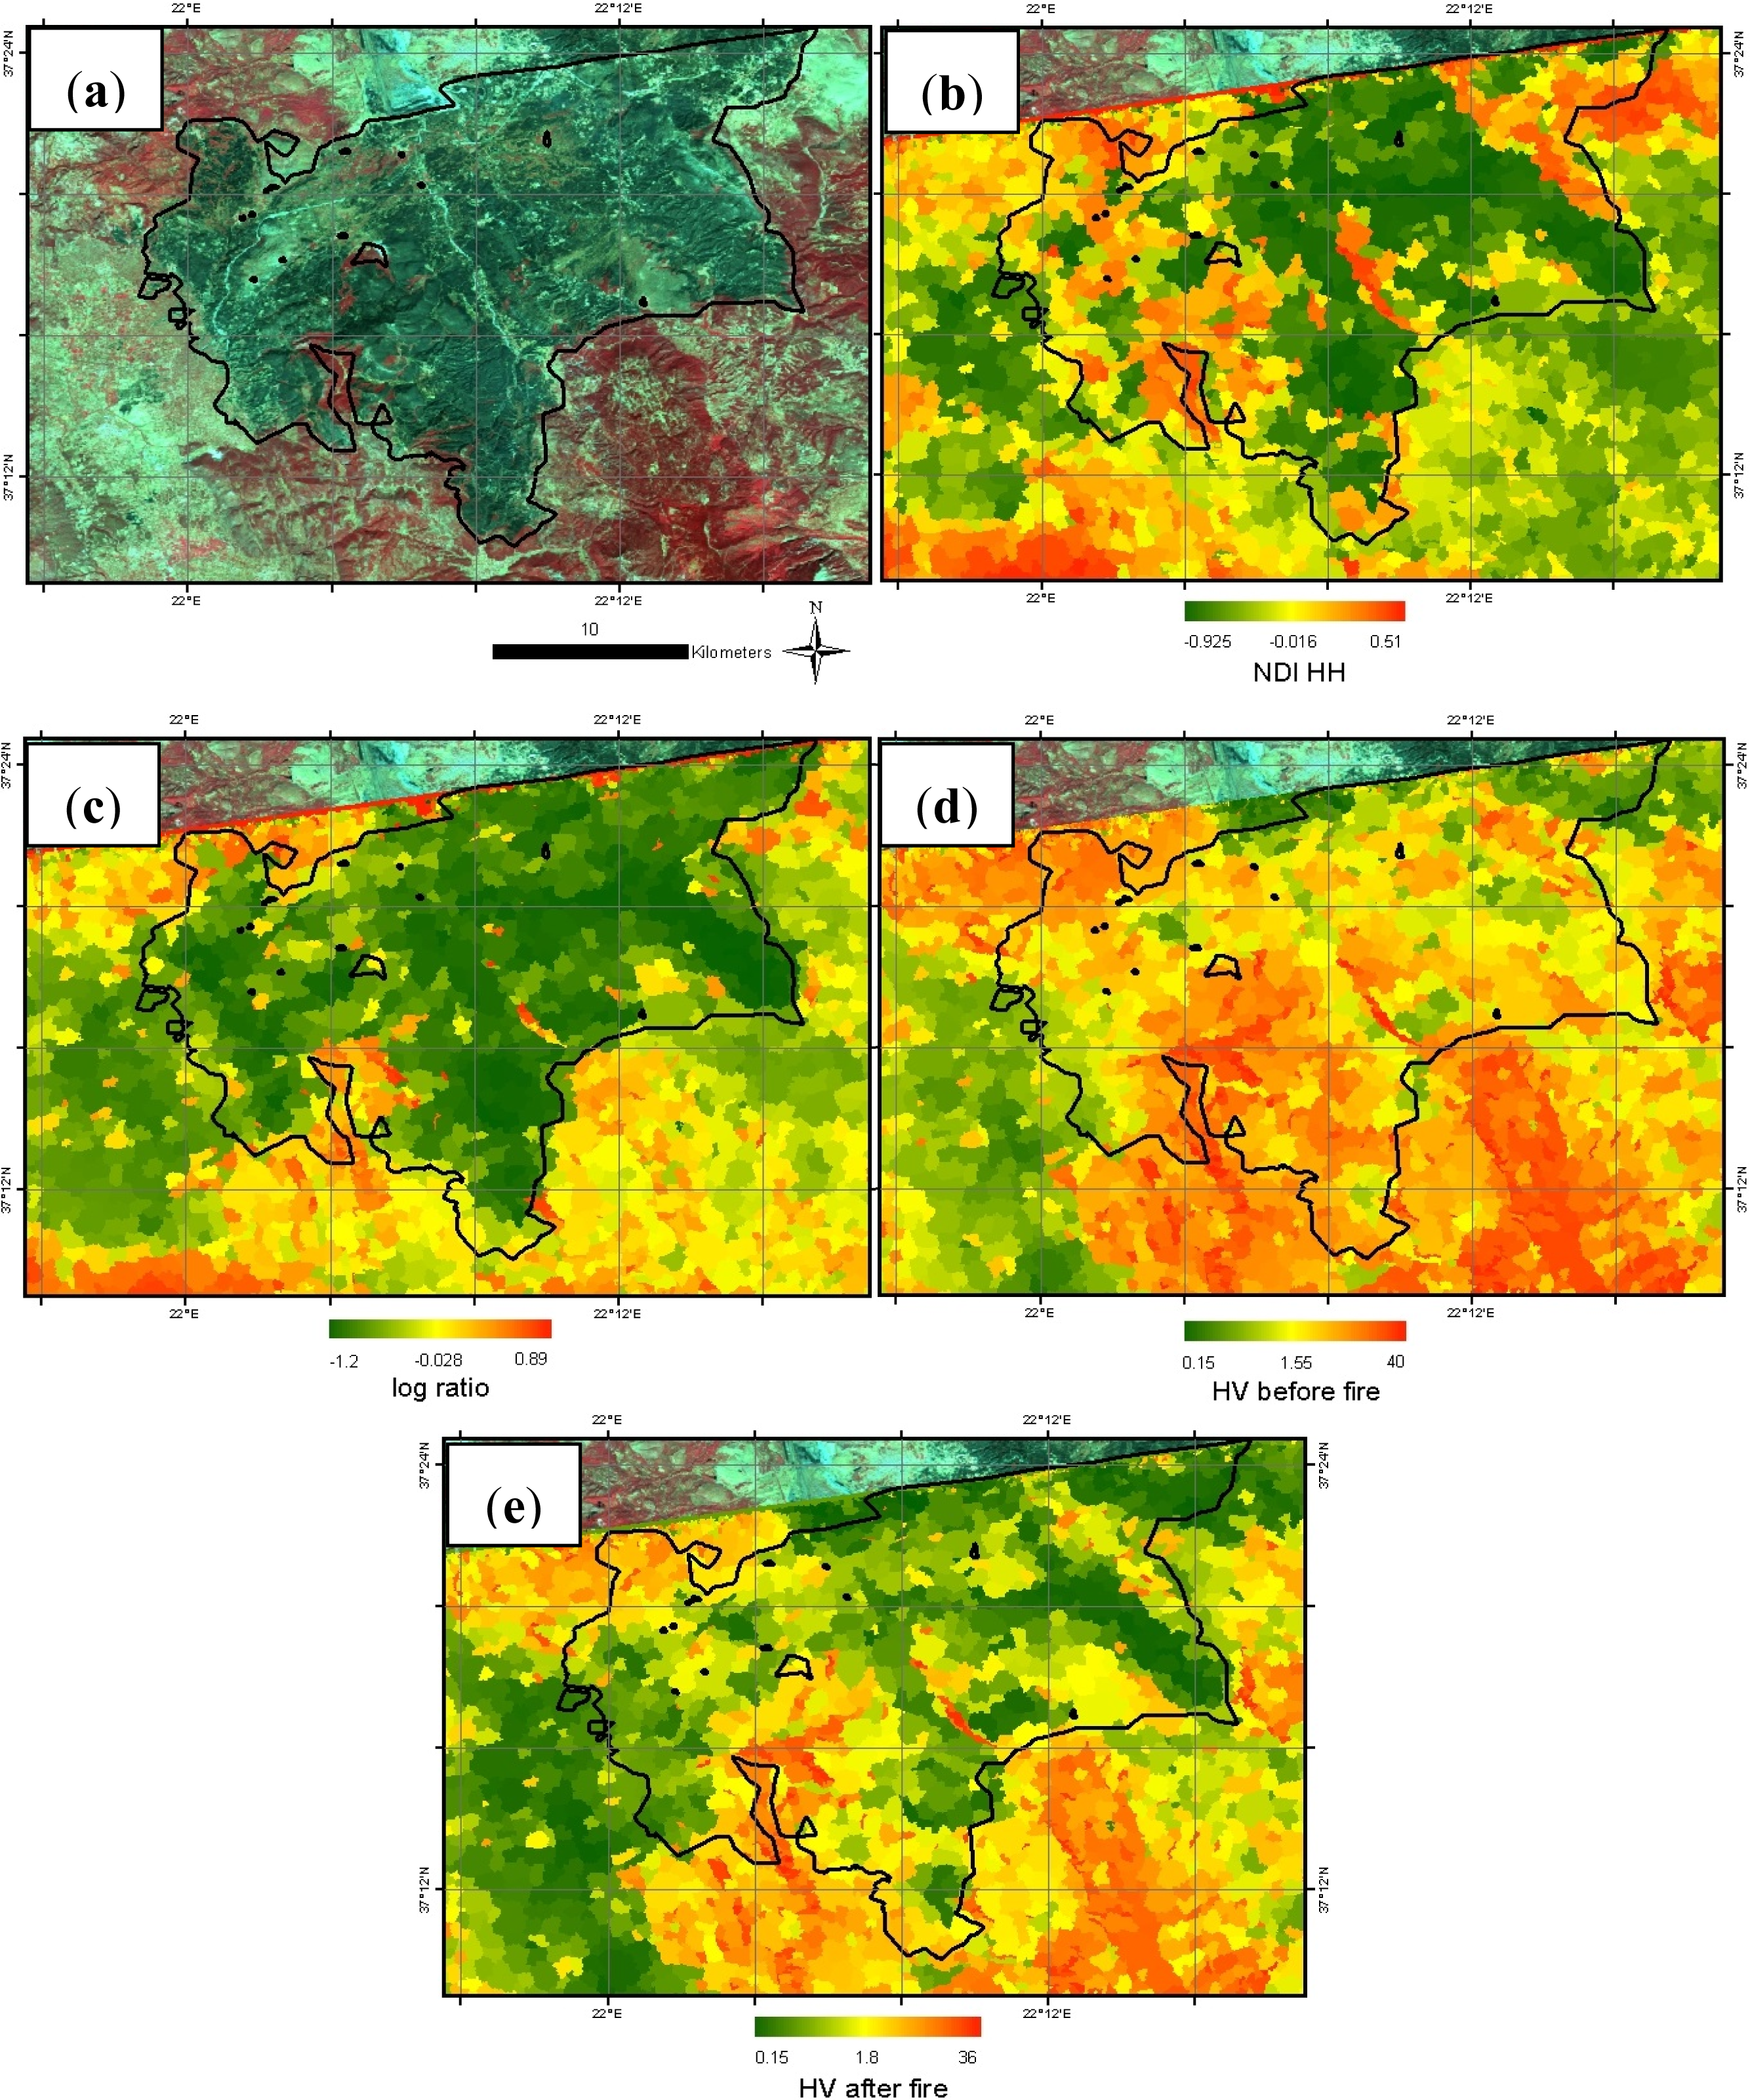
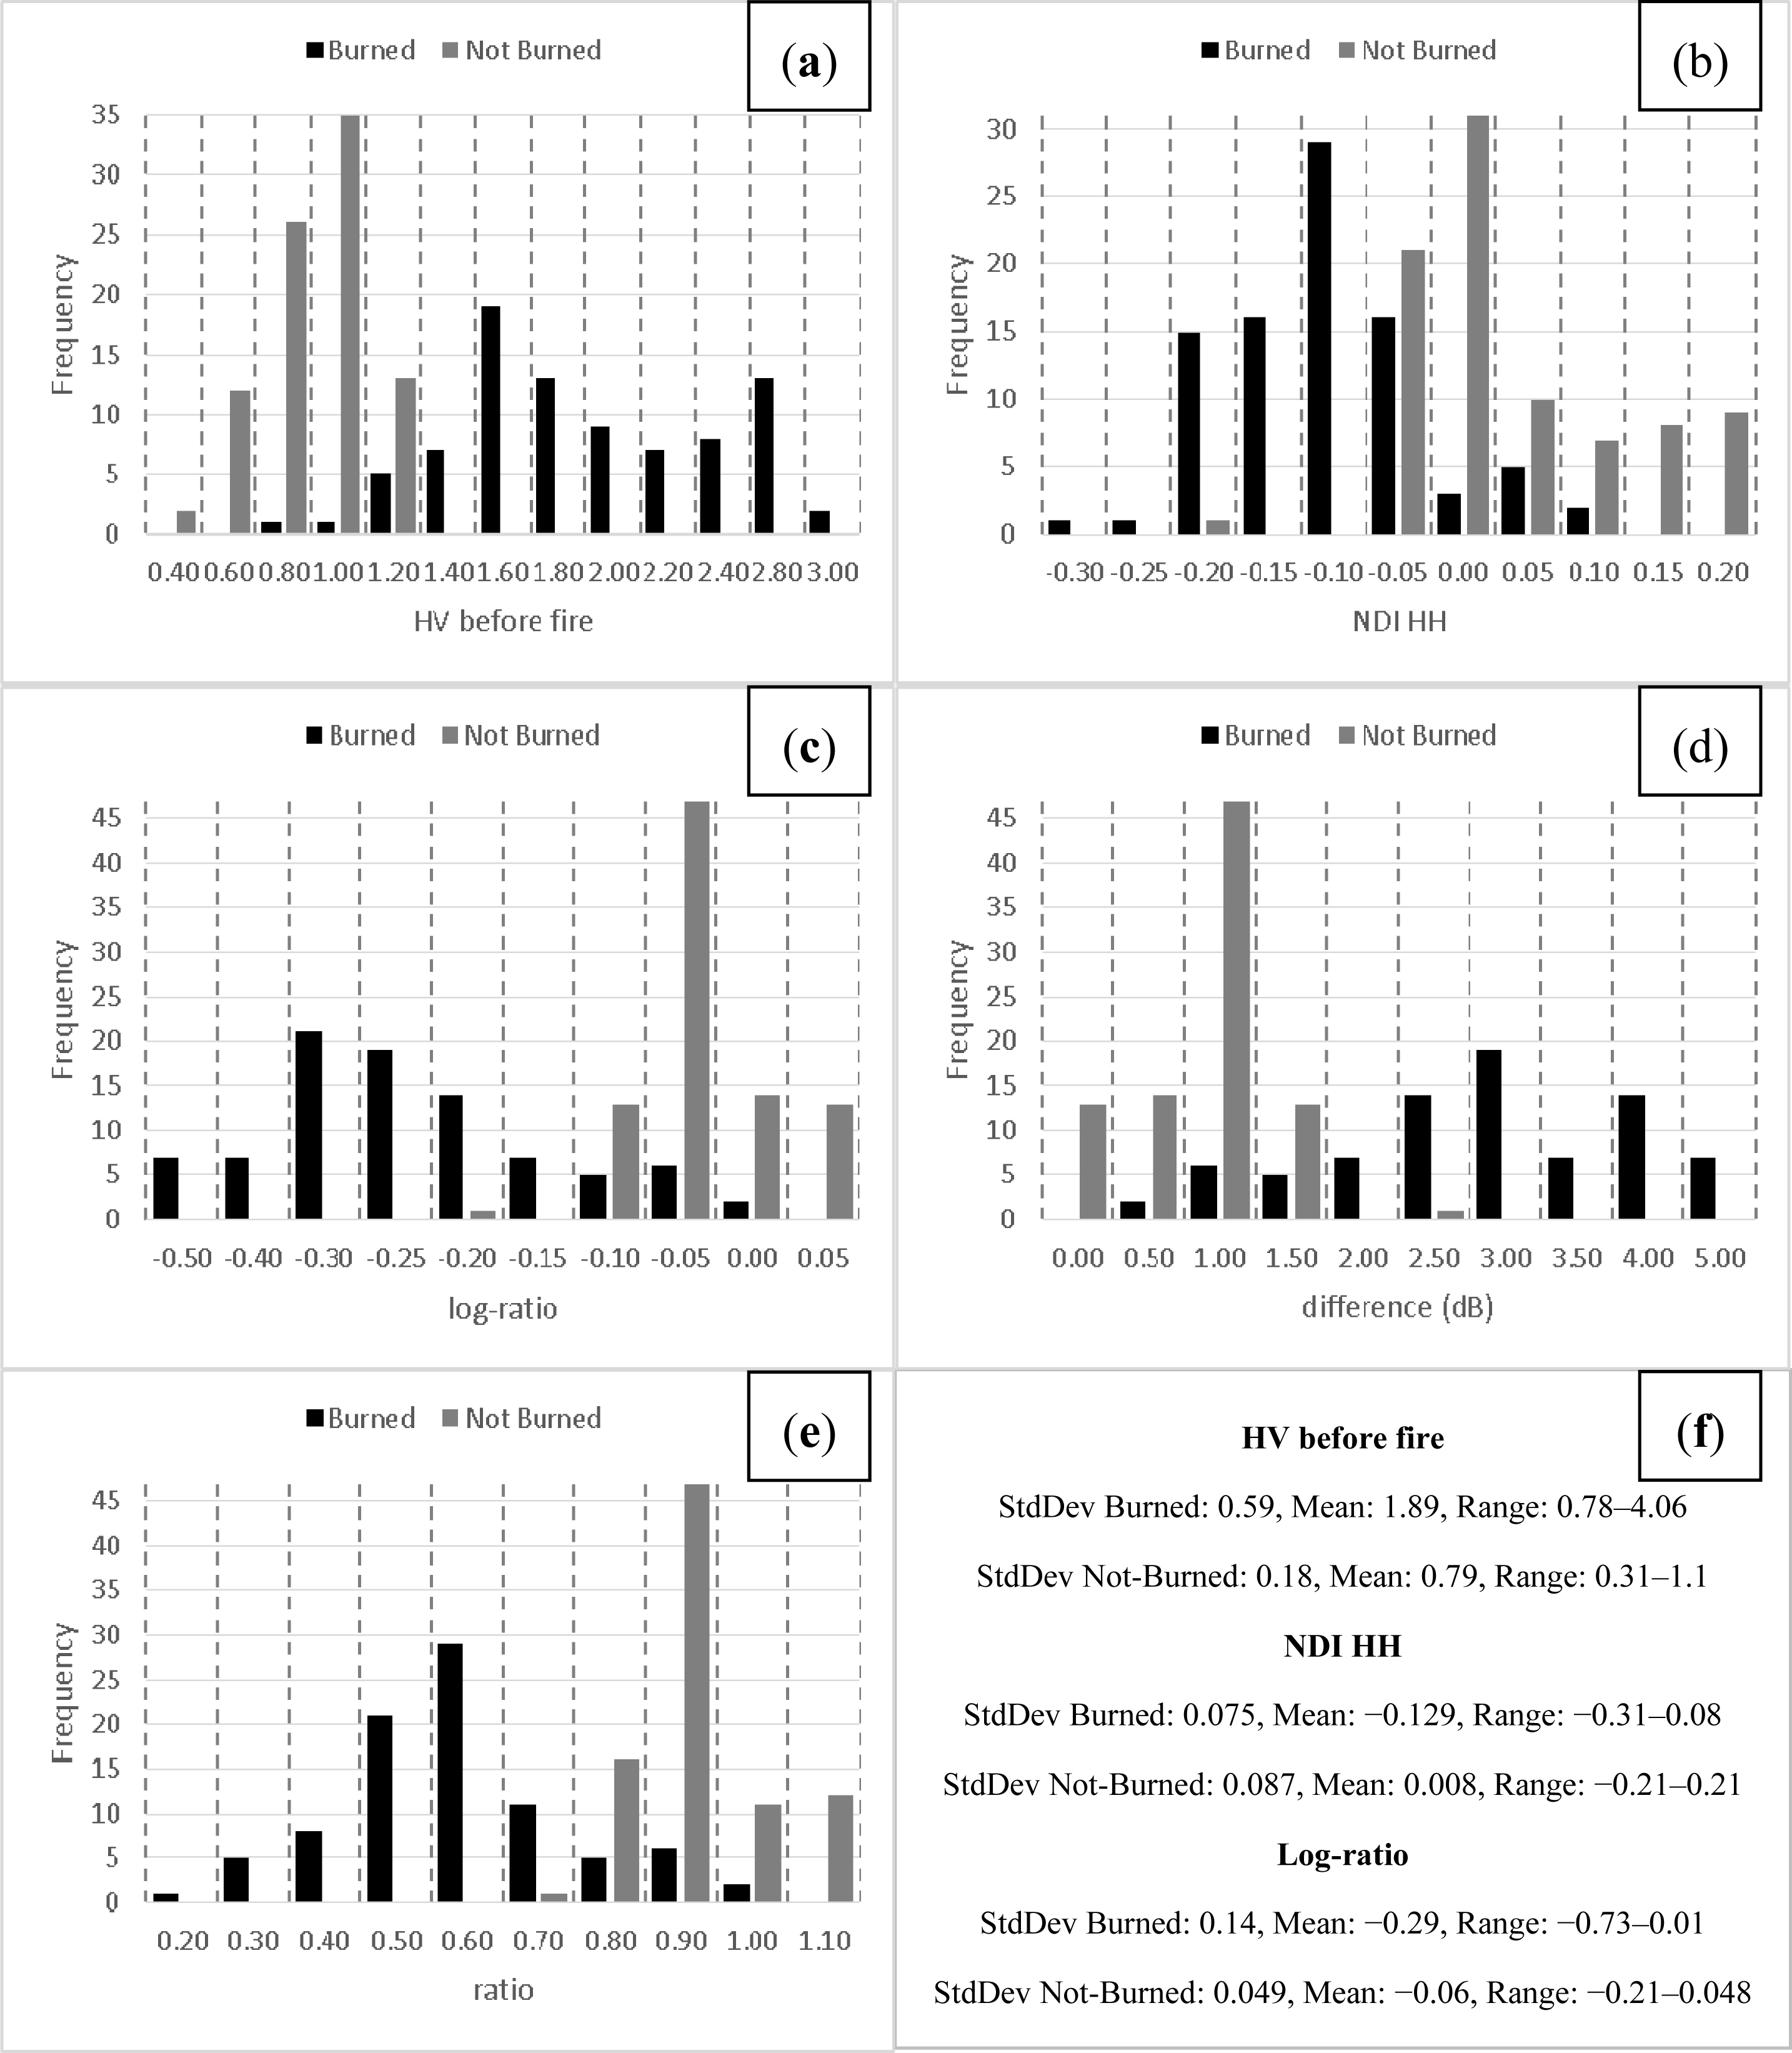
4.1. Discrimination between Unburned and Burned Areas

The first step in OBIA consists of segmenting the images. The initial segmentation relies on low-level information, e.g., pixel values [25] and does not automatically lead to meaningful objects in the real world [47]. Therefore, the best segmentation result is the one that provides optimal information for further processing such as classification and segmentation of burned areas [6]. For the initial segmentation, we carefully carried out a trial-and-error procedure to choose the appropriate parameters to successfully encapsulate the burned areas. At each step of the procedure the segmentation results were visually evaluated using the reference optical images of the burned areas. The final parameters were set as follows: all PALSAR data were used, scale was set to 15, color criterion was set to maximum (i.e., 0.9) and the compactness criterion of shape was set to 0.9 (Figure 2). The segmentation was performed on the entire images and resulted in 8,005 and 7,601 objects for the Peloponnese and Rhodes study areas respectively. The area of the objects for the Peloponnese ranged from 0.625 to 345.25 hectares while for Rhodes from 2.8125 to 267.375 hectares.
Next, we carried out the classification of the generated objects. During the development of the scheme we found that some unburned low vegetation areas (i.e., grasslands and agricultural areas) and burned areas exhibited similar temporal variations in the backscatter, which caused misclassifications between the two classes. Santoro et al. [26] also observed that temporal signatures of the PALSAR’s backscatter for agricultural fields and clear-cut areas were similar. To overcome the misclassifications we investigated the performance of the features introduced in Section 3.2 as well as other features such as the mean values, standard deviation of objects and shape features. Different feature values were visualized and histograms were analyzed using 176 sample objects, which were collected from the problematic areas [47] (Figures 3 and 4).
From our analyses we found that the feature “Mean backscatter of HV data before the fire”, which is defined as the mean backscatter of all pixels of the pre-fire HV data forming an object, allowed a good discrimination between unburned low vegetation areas and burned areas. The use of HV backscatter at this step can be explained by the sensitivity of the L-band HV polarized backscatter to variations in aboveground biomass [17]. The feature was therefore introduced to the description of class “uncertain area” which included unburned low vegetation areas and the threshold assigned was: “Mean of HV data before the fire” ≤ 1.1. Even though the use of the aforementioned feature allowed an almost clear discrimination of the two confusion classes in both study areas, further investigation on the use of HV data before the fire event will be needed in other Mediterranean regions and different ecosystems since the feature is correlated to vegetation biomass.
However, some confusion still remained between burned and unburned agricultural areas using only the feature “Mean backscatter of HV data before the fire”. This confusion was observed only in the case of the Peloponnese and not in the case of Rhodes. We therefore included in the class description of “uncertain area” the NDI from Equation (1), which enabled an improved discrimination of the aforementioned classes. NDI was defined as follows:
NDI = ( ( HH 1 HH 2 ) ) / ( ( HH 1 + HH 2 ) )
where HH1 and HH2 are the backscatter coefficient of the HH data of each image object before and after the fire event respectively. The threshold assigned for this feature was: NDI ≤ −0.03. Despite the optimal classification of the class “uncertain area” using the “Mean backscatter of HV data before the fire” and the NDI, the confusion could not be completely overcome and some burned low vegetation areas were classified as “uncertain area” (Figure 2).

4.2. Classification of Burned Areas

Following the classification of “uncertain area”, we introduced the new class “burned seed objects” to the scheme. The goal of the “burned seed objects” class was to identify seed burned objects which would act as initial objects for applying a region-growing algorithm. Such a concept was successfully employed in other studies for mapping burned areas using optical data [48,49]. We performed analyses on feature values from sample objects in order to find the appropriate features and thresholds for identifying the seed burned objects. We concluded that the combination of the NDI from Equation (9) with the object’s difference from Equation (2) features gave the most accurate results. The object’s difference was defined as follows:
O d = HV ( dB ) 1 HV ( dB ) 2
where HV1 and HV2, are the backscatter coefficient in decibels (dB) of the HV data of each image object before and after the fire event, respectively. The thresholds assigned for the two features were: NDI ≤ −0.08 and Od from Equation (10) ≥ 1.2. Only unclassified objects were used in this classification process. This means that objects classified as “uncertain area” were excluded in this process (Figure 5).
Next, all objects classified as “burned seed objects” were merged and all objects classified as “uncertain area” were also merged. Prior to the implementation of the region-growing algorithm a second segmentation process was performed on unclassified objects (Figures 2 and 5), which enabled an optimal delineation of the remaining burned areas. The parameters set for the second segmentation were: only the HV data before and after the fire were used, scale was set to 15, the color criterion was set to maximum (i.e., 0.9) and the compactness criterion of the shape was set to 0.5.
The last step in developing the scheme involved the final classification of the burned areas by improving the classification of the “burned seed objects” class using the region-growing algorithm. Under certain conditions, the algorithm extended image objects classified as “burned seed objects” with neighboring unclassified image objects. The algorithm worked in sweeps, which means that at each execution of the algorithm, it merged all direct neighboring image objects according to the conditions applied [50]. Here, the log-ratio feature from Equation (4) was used as the condition for merging and was defined as:
O lr = log ( HV 1 / HV 2 )
where HV1 and HV2 are the backscatter coefficient of the HV data of each image object before and after the fire event, respectively. The feature’s threshold was set to: Olr ≤ −0.077. Furthermore, we compared the performance of the log-ratio feature with the ratio feature, which was defined from Equation (3) as follows:
O r = HV 1 / HV 2
The feature’s threshold was set to: Or ≤ 0.082. Results of the accuracy assessment revealed higher probabilities of detection (Pd) when the feature log-ratio was used for both study areas: 0.68 using the feature ratio and 0.71 using the feature log-ratio in the case of the Peloponnese, while in the case of Rhodes Island 0.78 when the feature ratio was employed and 0.82 using the log-ratio. Probabilities of false alarm (Pf) were lower when the feature ratio was used for both study areas: 0.040 using the feature ratio and 0.048 using the feature log-ratio in the Peloponnese while in Rhodes Island 0.076 when the feature ratio was utilized and 0.083 using the log-ratio. As the probabilities of false alarm were very low using either feature we decided to incorporate the log-ratio feature in the final version of the classification scheme given the resulted higher probabilities of detection.

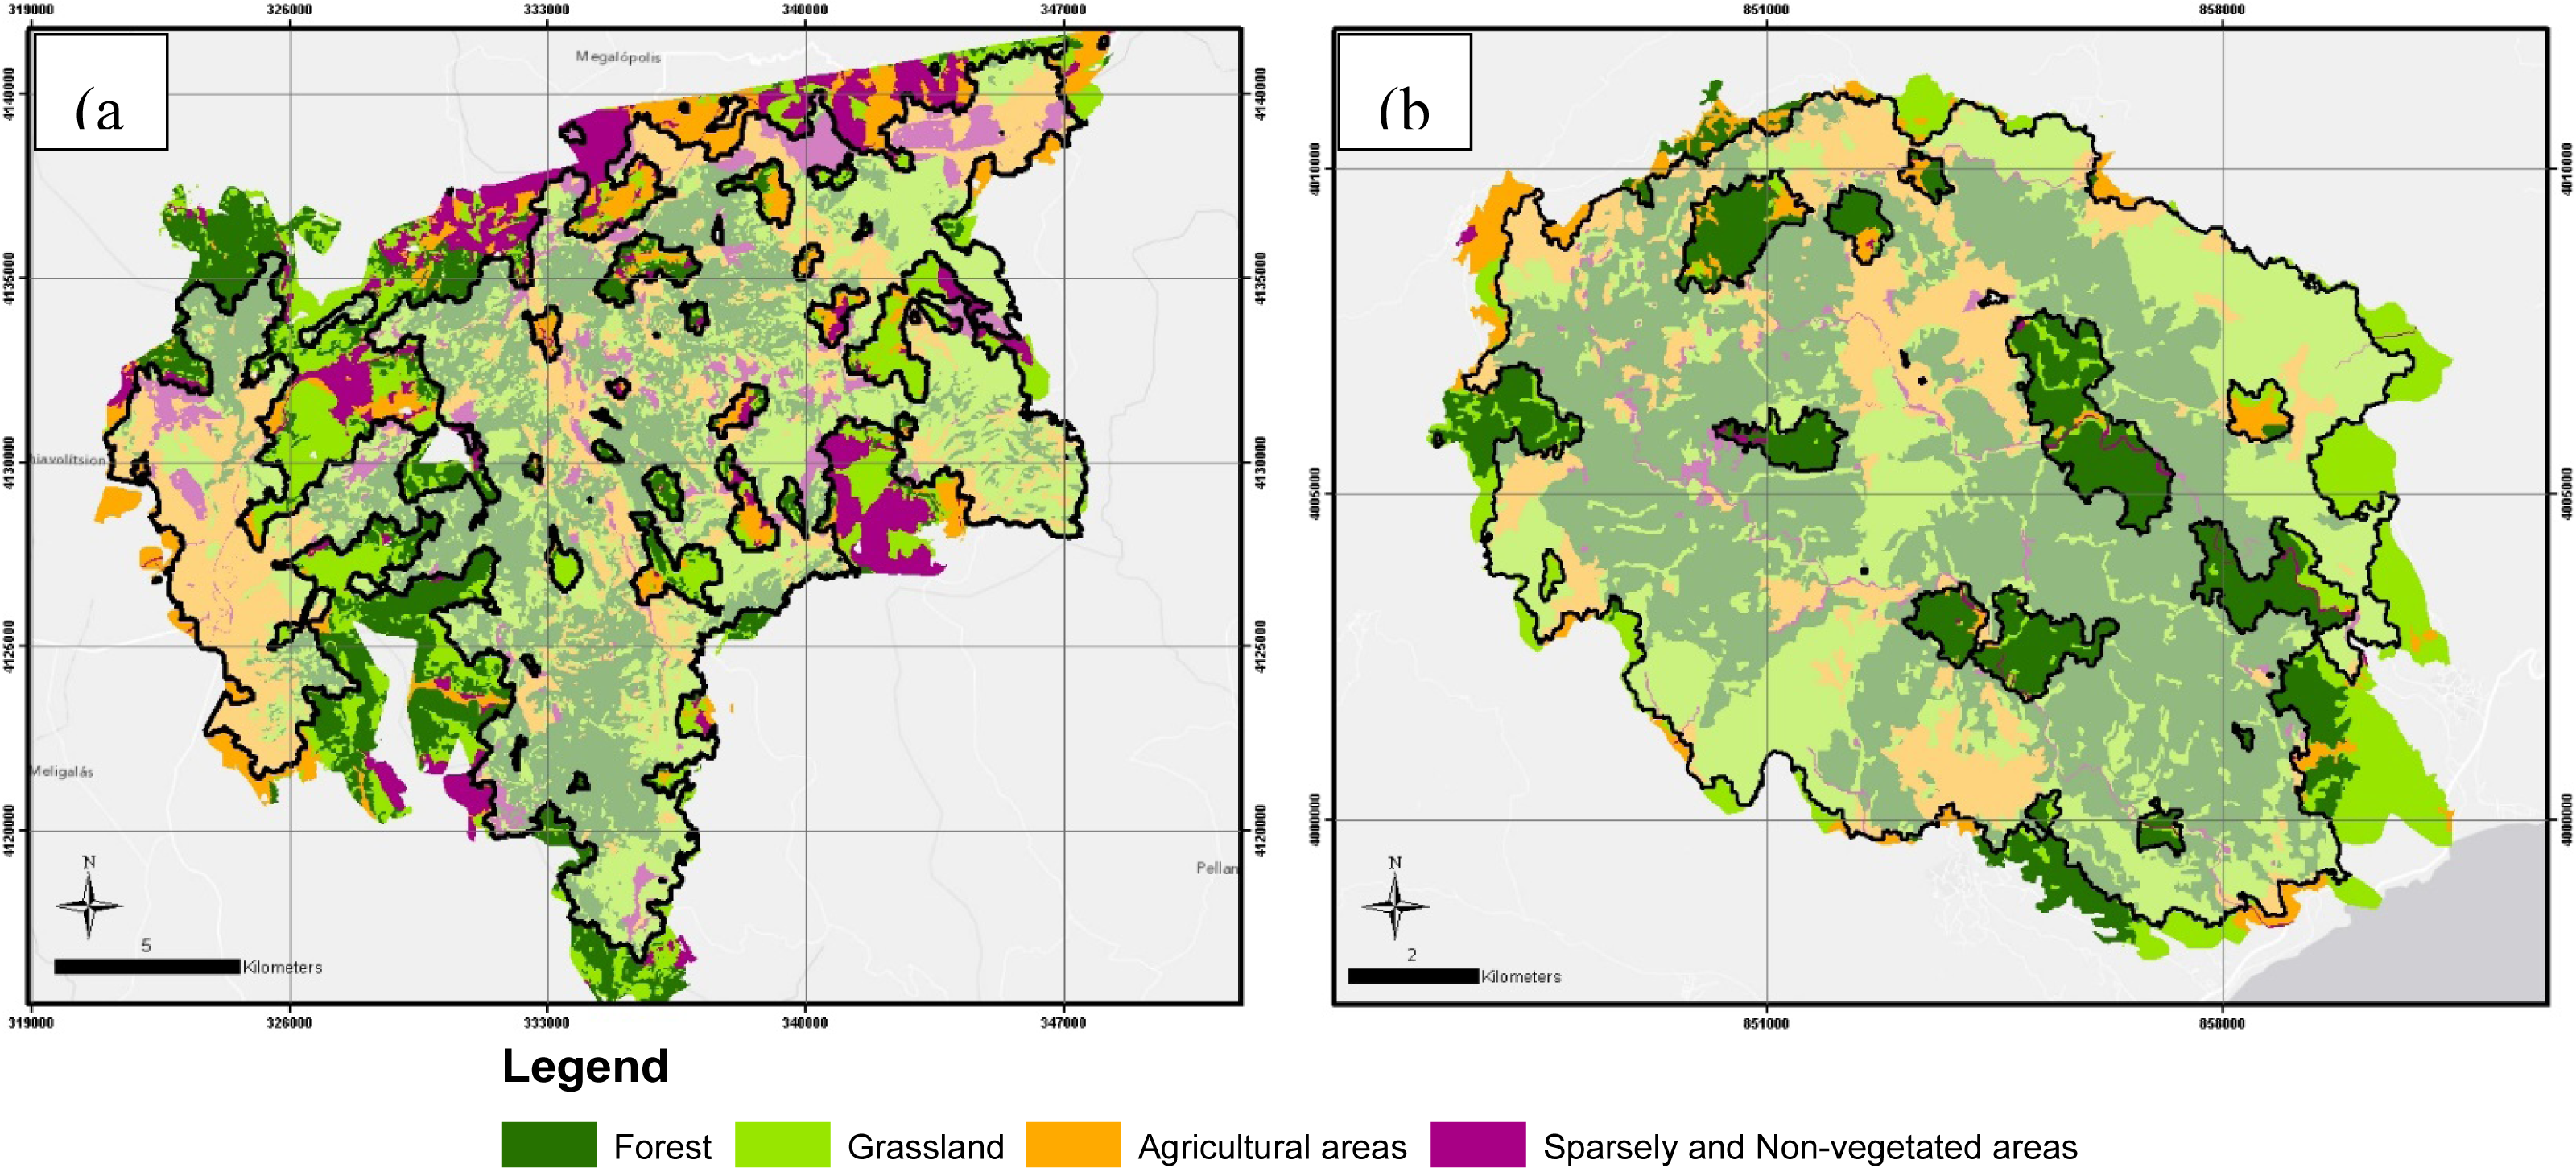
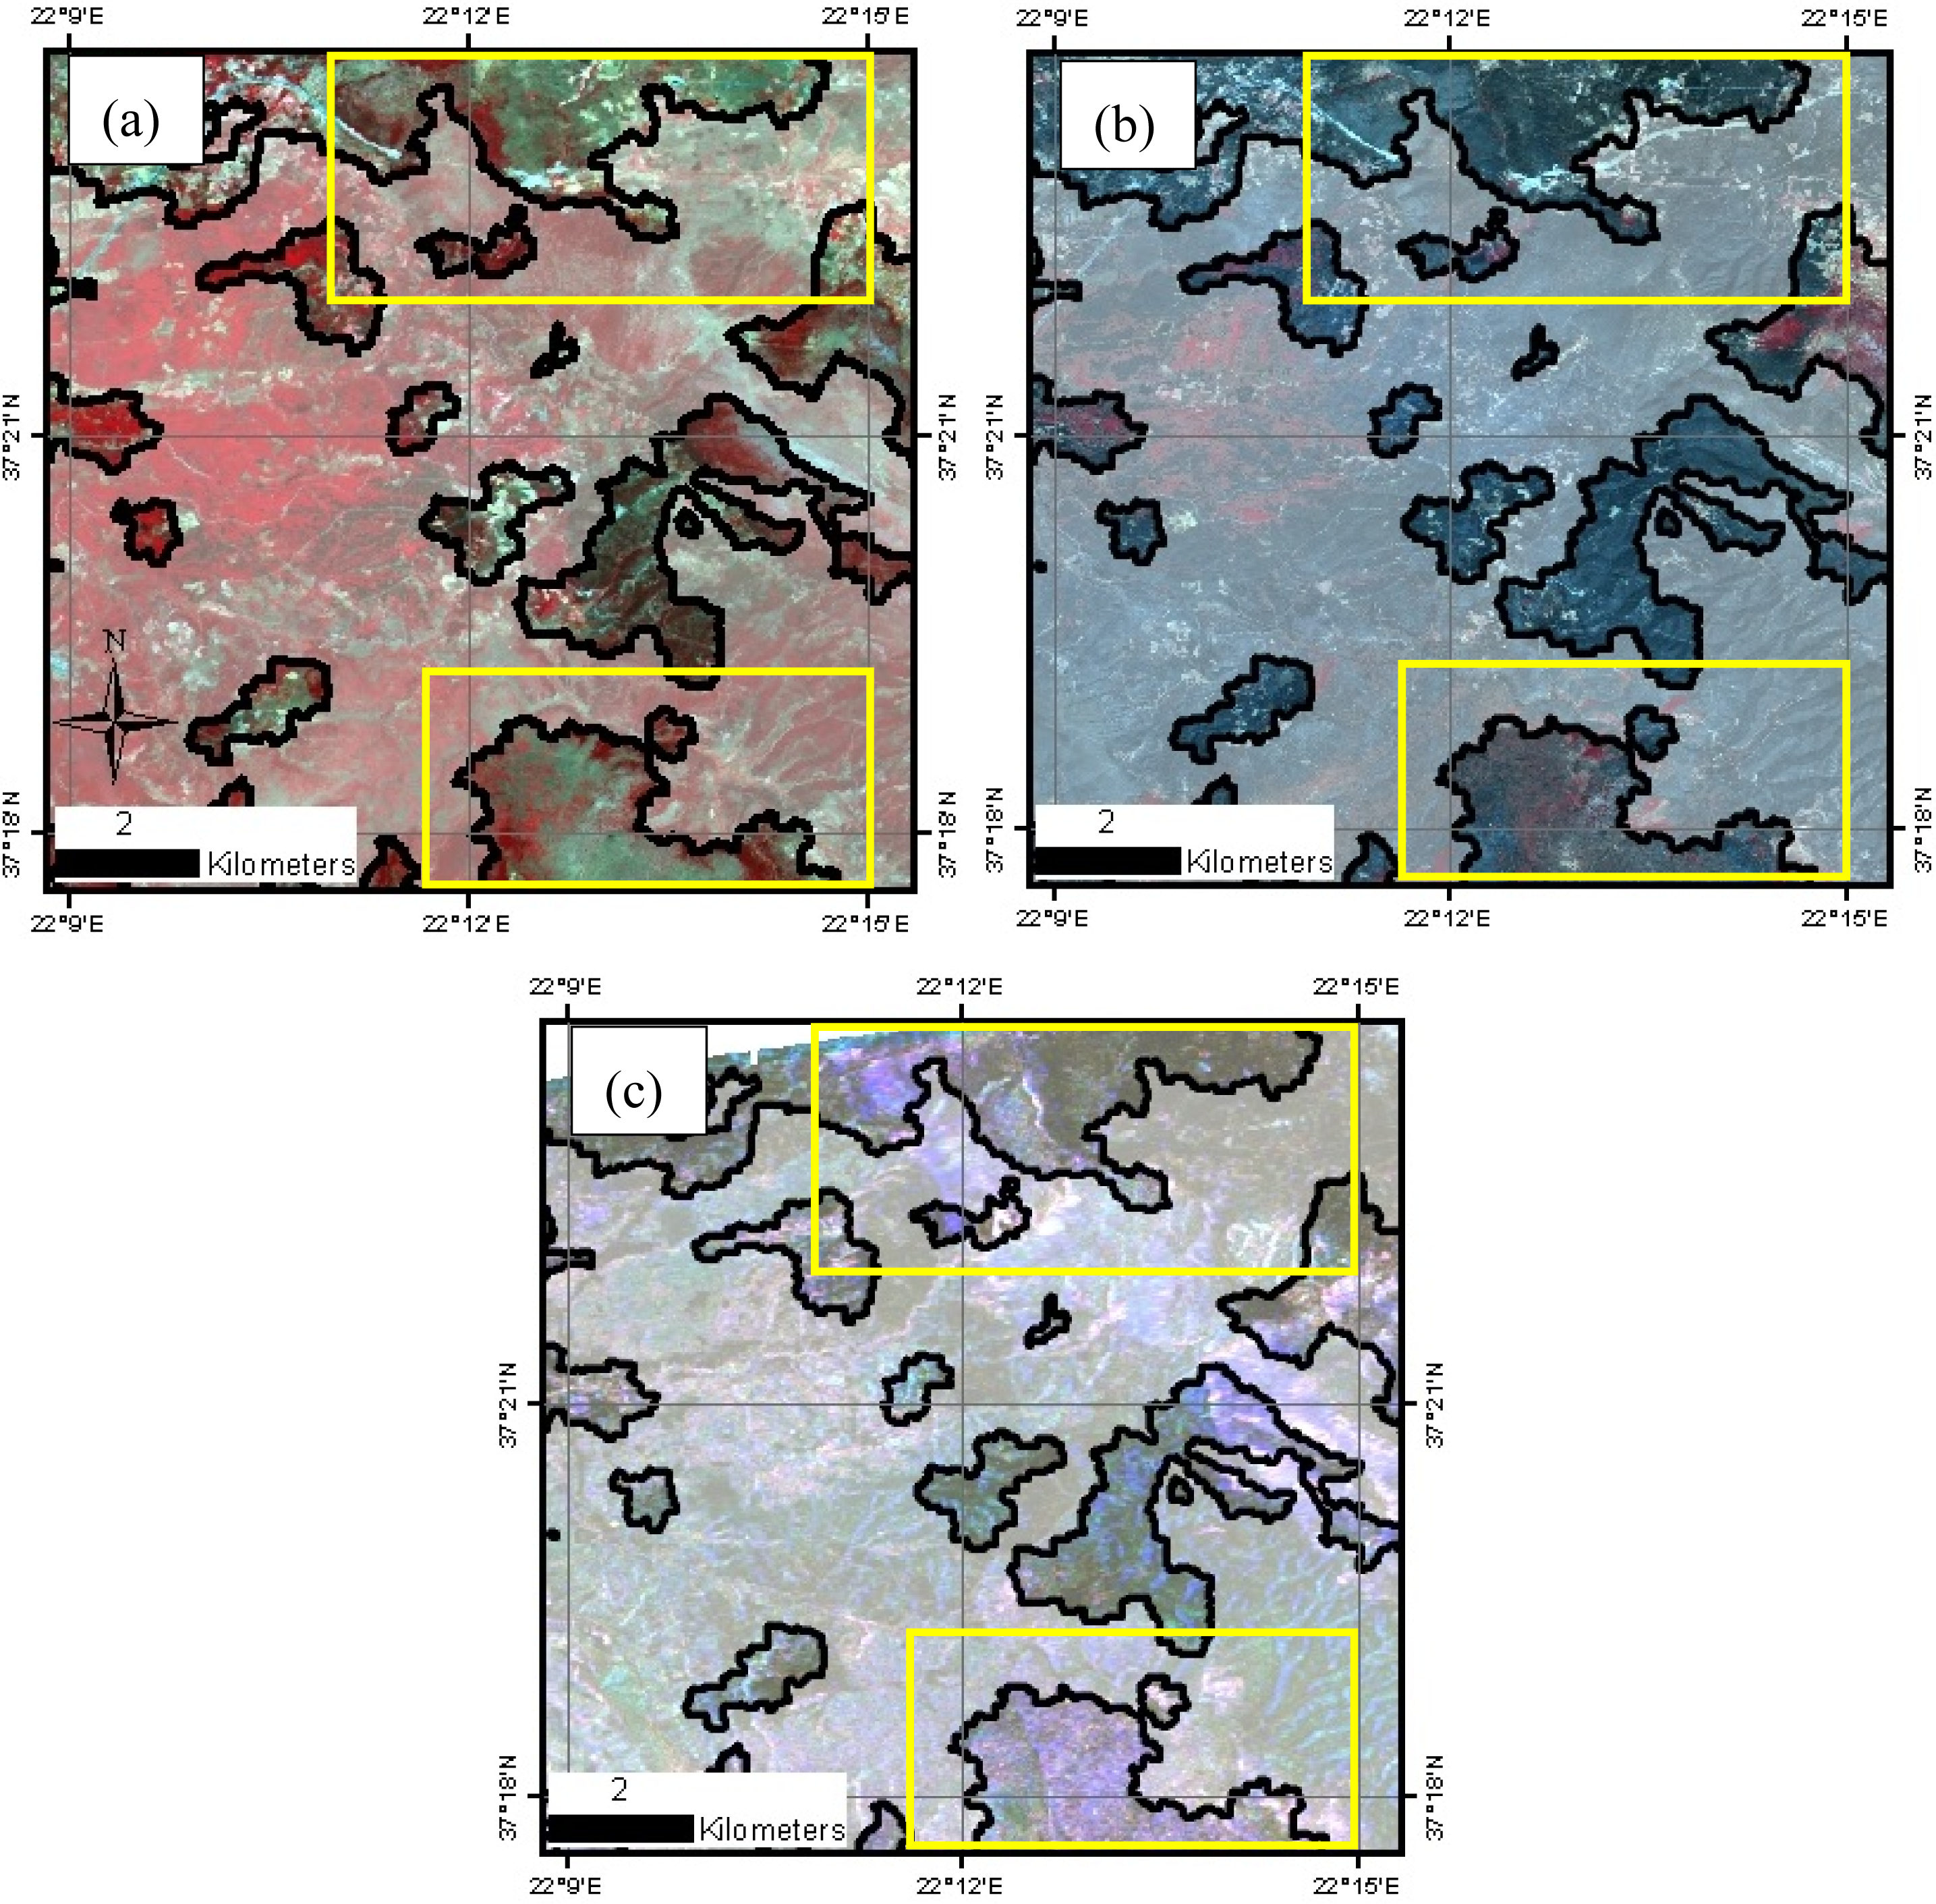
4.3. Classification Results

Results of the object-based classification accuracy of the burned areas, revealed higher probability of detection (Pd) for Rhodes Island (0.82) compared with the Pd for the Peloponnese (0.71), as well as low probabilities of false alarm (Pf) for both study areas (Table 2).
The low Pd observed for the Peloponnese could be attributed to the more heterogeneous landscape of the Peloponnese area compared with the landscape of Rhodes Island. In particular, the main cause of omitting burned areas in the classification of the Peloponnese fire is likely due to the greater area covered by low vegetation such as grasslands, agricultural areas, and sparsely and non-vegetated areas: approximately 67% of the total area compared to 53% in the case of Rhodes (Figure 1). The contribution of soil to the backscatter is increased in low vegetation areas [51], which likely resulted in misclassifications of the burned areas. Several studies have also shown that the L-band is less sensitive to low biomass vegetation, compared with high biomass vegetation [28,29,51]. However, it seems that not only the higher percentage of area covered by low vegetation classes caused the lower accuracy in the Peloponnese, but also the spatial distribution of these land-cover classes (i.e., grasslands, agricultural and sparsely and non-vegetated areas). The landscape of the Peloponnese resembled a mosaic of the different land-cover classes whereas the distribution of the different classes in Rhodes Island was more homogeneous (Figure 6). Owing to the heterogeneous distribution of land-cover classes in the Peloponnese, the extension of image objects classified as “burned seed objects” using the region-growing algorithm was not feasible, in particular with neighboring sparsely and non-vegetated areas (Figure 7). This is probably because the sparsely and non-vegetated areas were undetected since these areas exhibited no apparent change of the scattering mechanisms before and after the fire events. In the case of Rhodes Island, the algorithm performed better since only 2% (most of which were roads), compared to 12% in the case of the Peloponnese, of the total area was covered by sparsely and non-vegetated areas. Therefore, we could suggest that the algorithm performs better when the spatial distribution of the pre-fire land-cover classes is compact. Similar conclusions were drawn in other studies where a region-growing algorithm has been applied [47,48].
Overall, the higher percentage of area covered by grasslands, agricultural and sparsely and non-vegetated areas as well as the heterogeneous landscape of the Peloponnese seem to have contributed to the low classification accuracies of the aforementioned classes (Table 3). The accuracy assessment of the class sparsely and non-vegetated areas in the Peloponnese also confirmed the problematic classification of this class given its low probability of detection (0.51).
Furthermore, we investigated the burned areas not mapped by the classification scheme in terms of fire severity and we found that approximately 65% of the low vegetation areas in the Peloponnese had low dNDMI values (less than 0.5). This could be a factor of omitting burned areas [44]: the existence of partially burned vegetation could cause very low temporal variability of the backscatter coefficient which in turn could not be detected as change by the classification scheme (Figure 8a). The same conclusion could not be drawn for forested areas as approximately 70% of the omitted areas showed values higher than 0.5 degrees of dNDMI. In this case, the influence of local incidence angle might have caused the misclassifications since studies have shown that the backscatter coefficient of burned areas varies as a function of the incidence angle [19,52]. It was observed that 40% of the omitted burned forest was located in areas with local incidence angles ≤25° and ≥50°. Even though the percentage of omitted areas is rather low, future investigation could include the use of beta naught (b°), since it gives an estimate of what radar actually measures [53] or the terrain-flattened γ° proposed by Small [53].
As already mentioned, the higher Pd observed for Rhodes Island, compared with the Pd of the Peloponnese, is attributed to the different pre-fire vegetation conditions of the two study areas. The Island had rather homogeneous high biomass pre-fire vegetation conditions (Figure 1c), which minimized the contribution of soil to the backscatter resulting in a more accurate classification. In the case of Rhodes, we found that the main cause of omitting burned pine forest was probably owing to fire severity since approximately 75% of the undetected burned forest had dNDMI values less than 0.4 (Figure 8b). A closer look at the available VHR IKONOS images revealed that the omitted burned forests were highly heterogeneous in terms of a mixture of burned and unburned pine trees (Figure 8c).
Even though a comparison between SAR and optical data is out of the scope of this investigation, we should mention that fire-affected areas were detected visually when using the VHR optical images for the generation of the reference fire perimeters, regardless of the pre-fire land-cover type (Figure 7). Our findings therefore suggest that a synergy of optical and SAR imagery could provide an avenue for further research on burned area mapping. Specifically, very useful information could be extracted from optical data on the exact location of burned areas as well as from SAR data on areas of specific land-cover types that have been severely affected.
Finally, the soil moisture parameter cannot be neglected as a cause of observed misclassifications: active microwave backscatter was found to be sensitive to variations in soil moisture in fire-related studies [14,18,35,54]. In particular for L-band, Ulaby et al. [55] showed that backscatter of bare-soil fields was strongly correlated to soil moisture, whereas Kasischke et al. [17] demonstrated that monitoring regrowth of low-biomass forests, requires to account for the soil moisture influence on L-band microwave backscatter. However, for this investigation, apart from the precipitation records, no additional information on soil moisture was available in order to make any conclusive statements.

5. Conclusions

In this work we investigated the potential of multi-temporal ALOS PALSAR imagery for burned area mapping in typical Mediterranean areas in Greece using OBIA. More specifically, we developed an object-based classification scheme using PALSAR images acquired before and after fire events in two study areas. We employed in the scheme a region-growing algorithm, which mapped burned areas with satisfying results: 0.71 and 0.82 probabilities of detection for the Peloponnese and Rhodes Island study areas, respectively. The advantage of employing OBIA was the use in the classification of the temporal variations of the backscatter coefficient information in combination with additional information, such as topological features (e.g., neighbor objects) and class related features (e.g., classified as burned objects). This advantage enabled to overcome observed confusion between burned and other unburned areas.
We found that two parameters could be the source of omitting burned areas by the classification scheme: the pre-fire land-cover types and fire severity. The low Pd observed for the Peloponnese was possibly because PALSAR backscatter is not so sensitive to low vegetation burned areas, such as agricultural and grasslands, which dominated the study area. Furthermore, sparsely and non-vegetated areas exhibited a very low classification accuracy owing to the unchanged scattering mechanisms in these areas before and after the fire. In contrast, a high Pd was observed for Rhodes Island as the area was dominated by a homogeneous pine forest before the fire. Our results also suggest that the region-growing algorithm performs better when the pre-fire land-cover consisted of relatively large and homogeneous patches compared with a highly heterogeneous and patchy landscape. The investigation on the influence of fire severity to the classification accuracy showed that most fire-affected areas with low values of dNDMI were undetected. These results imply that the proposed classification scheme could be more appropriate in the case of homogeneous high biomass areas, which have been severely burned.
Overall, our findings indicate that the developed object-based scheme using PALSAR images could be valuable when rapid burned area assessment is needed since radar images have the capability to penetrate clouds and smoke and therefore can be used as an alternative to optical data. Future work includes testing the performance of the developed classification procedure in other regions of the Mediterranean area and in different ecosystems. In addition, future investigation could include the development of a similar classification procedure, to the one presented in this work, to be used with other SAR frequencies such as the forthcoming Sentinel-1 C-band imaging radar mission.

Acknowledgments

We thank ESA for providing access to the ALOS PALSAR and SPOT data (cat-1 project IDs 7204 and 7882). We appreciate Niko Theofanous and Spyro Papakonstantinou from the Forest Service of Rhodes for providing valuable information about the burned areas. We are grateful to the anonymous reviewers for their constructive comments, which helped to improve the manuscript. Part of this work was carried out at the Jet Propulsion Laboratory, California Institute of Technology, under a contract with the National Aeronautics and Space Administration. The JPL author’s copyright for this publication is held by the California Institute of Technology.

Conflicts of Interest

The authors declare no conflict of interest.

References

  1. Pérez-Cabello, F.; Echeverría, M.T.; Ibarra, P.; de la Riva, J. Effects of Fire on Vegetation, Soil and Hydrogeomorphological Behavior in Mediterranean Ecosystems. In Earth Observation of Wildland Fires in Mediterranean Ecosystems; Chuvieco, E., Ed.; Springer-Verlang: Berlin/Heidelberg, Germany, 2009; p. 112. [Google Scholar]
  2. Chuvieco, E. Satellite Observation of Biomass Burning: Implications in Global Change Research. In Earth Observation of Global Change: The Role of Satellite Remote Sensing in Monitoring the Global Environment; Chuvieco, E., Ed.; Springer-Verlang: Berlin/Heidelberg, Germany, 2008; p. 111. [Google Scholar]
  3. Koutsias, N.; Karteris, M.; Chuvieco, E. The use of intensity-hue-saturation transformation of Landsat-5 thematic mapper data for burned land mapping. Photogramm. Eng. Remote Sens 2000, 66, 829–839. [Google Scholar]
  4. Justice, C.O.; Giglio, L.; Korontzi, S.; Owens, J.; Alleaume, S.; Morisette, J.T.; Roy, D.P.; Petitecolin, F.; Descloitres, J.; Kaufman, Y. Global fire products from MODIS. Remote Sens. Environ 2002, 83, 245–263. [Google Scholar]
  5. Roy, D.P.; Lewis, P.E.; Justice, C.O. Burned area mapping using multi-temporal moderate spatial resolution data—A bi-directional reflectance model-based expectation approach. Remote Sens. Environ 2002, 83, 263–286. [Google Scholar]
  6. Mitri, G.H.; Gitas, I.Z. A semi-automated object-oriented model for burned area mapping in the Mediterranean region using Landsat-TM imagery. Int. J. Wildland Fire 2004, 12, 1–10. [Google Scholar]
  7. Chuvieco, E.; Ventura, G.; Martín, M.P. AVHRR multitemporal compositing techniques for burned land mapping. In. J. Remote Sens 2005, 26, 1013–1018. [Google Scholar]
  8. Ju, J.; Roy, D.P. The availability of cloud-free Landsat ETM+ data over the conterminous United States and globally. Remote Sens. Environ 2008, 112, 1196–1211. [Google Scholar]
  9. Hoekman, D.H.; Vissers, M.A.M.; Wielaard, N. PALSAR wide-area mapping of Borneo: Methodology and map validation. IEEE J. Sel. Top. Appl. Earth Obs. Remote Sens 2010, 3, 605–617. [Google Scholar]
  10. Kasischke, E.S.; Melack, J.M.; Dobson, M.C. The use of imaging radars for ecological applications—A review. Remote Sens. Environ 1997, 59, 141–156. [Google Scholar]
  11. Bourgeau-Chavez, L.L.; Harrell, P.A.; Kasischke, E.S.; French, N.H.F. The detection and mapping of Alaskan wildfires using a spaceborne imaging radar system. Int. J. Remote Sens 1997, 18, 355–373. [Google Scholar]
  12. Bourgeau-Chavez, L.L.; Kasischke, E.S.; Brunzell, S.; Mudd, J.P.; Tukman, M. Mapping fire scars in global boreal forests using imaging radar data. Int. J. Remote Sens 2002, 23, 4211–4234. [Google Scholar]
  13. Siegert, F.; Hoffmann, A.A. The 1998 forest fires in East Kalimantan (Indonesia): A quantitative evaluation using high resolution, multitemporal ERS-2 SAR images and NOAA-AVHRR hotspot data. Remote Sens. Environ 2000, 72, 64–77. [Google Scholar]
  14. Gimeno, M.; San-Miguel-Ayanz, J.; Schmuck, G. Identification of burnt areas in Mediterranean forest environments from ERS-2 SAR time series. Int. J. Remote Sens 2004, 25, 4873–4888. [Google Scholar]
  15. French, N.H.F.; Kasischke, E.S.; Bourgeau-Chavez, L.L.; Harrel, P.A. Sensitivity of ERS-1 SAR to variations in soil water in fire disturbed boreal forest ecosystems. Int. J. Remote Sens 1996, 17, 3037–3053. [Google Scholar]
  16. Huang, S.; Siegert, F. Backscatter change on fire scars in Siberian boreal forests in ENVISAT ASAR wide-swath images. IEEE Geosci. Remote Sens. Lett 2006, 3, 154–158. [Google Scholar]
  17. Kasischke, E.S.; Tanase, M.A.; Bourgeau-Chavez, L.L.; Borr, M. Soil moisture limitations on monitoring boreal forest regrowth using spaceborne L-band SAR data. Remote Sens. Environ 2011, 115, 227–232. [Google Scholar]
  18. Siegert, F.; Ruecker, G. Use of multitemporal ERS-2 SAR images for identification of burned scars in south-east Asian tropical rainforest. Int. J. Remote Sens 2000, 21, 831–837. [Google Scholar]
  19. Huang, S.; Siegert, F. ENVISAT multisensor data for fire monitoring and impact assessment. Int. J. Remote Sens 2004, 25, 4411–4416. [Google Scholar]
  20. Ban, Y.; Hu, H.; Rangel, I.M. Fusion of Quickbird MS and RADARSAT SAR data for urban land-cover mapping: Object-based and knowledge-based approach. Int. J. Remote Sens 2010, 31, 1391–1410. [Google Scholar]
  21. Peters, J.; van Coillie, F.; Westra, T.; de Wulf, R. Synergy of very high resolution optical and radar data for object-based olive grove mapping. Int. J. Geogr. Inf. Sci 2011, 25, 971–989. [Google Scholar]
  22. Bernhard, E.M.; Stein, E.; Twele, A.; Gähler, M. Synergistic Use of Optical and Radar Data for Rapid Mapping of Forest Fires in the European Mediterranean. Proceedings of ISPRS Workshop 2011, Hannover, Germany, 14–17 July 2011.
  23. Thiel, C.J.; Thiel, C.; Schmullius, C.C. Operational large-area forest monitoring in Siberia using ALOS PALSAR summer intensities and winter coherence. IEEE Trans. Geosci. Remote Sens 2009, 47, 3993–4000. [Google Scholar]
  24. Qi, Z.; Gar-On Yeh, A.; Li, X.; Lin, Z. A novel algorithm for land use and land cover classification using RADARSAT-2 polarimetric SAR data. Remote Sens. Environ 2012, 118, 21–39. [Google Scholar]
  25. Benz, U.C.; Hofmann, P.; Willhauck, G.; Lingenfelder, I.; Heynen, M. Multi-resolution, object-oriented fuzzy analysis of remote sensing data for GIS-ready information. ISPRS J. Photogramm. Remote Sens 2004, 58, 239–258. [Google Scholar]
  26. Santoro, M.; Fransson, J.E.S.; Eriksson, L.E.B.; Ulander, L.M.H. Clear-cut detection in Swedish boreal forest using multi-temporal ALOS PALSAR backscatter data. IEEE J. Sel. Top. Appl. Earth Obs. Remote Sens 2010, 3, 618–631. [Google Scholar]
  27. Mitchard, E.T.A.; Saatchi, S.S.; Woodhouse, I.H.; Nangendo, G.; Ribeiro, N.S.; Williams, M.; Ryan, C.M.; Lewis, S.L.; Feldpausch, T.R.; Meir, P. Using satellite radar backscatter to predict above-ground woody biomass: A consistent relationship across four different African landscapes. Geophys. Res. Lett 2009, 36, 1–6. [Google Scholar]
  28. Lucas, R.; Armston, J.; Fairfax, R.; Fensham, R.; Accad, A.; Carreiras, J.; Kelley, J.; Bunting, P.; Clewley, D.; Bray, S.; et al. An evaluation of the ALOS PALSAR L-band backscatter-above ground biomass relationship Queensland, Australia: Impacts of surface moisture condition and vegetation structure. IEEE J. Sel. Top. Appl. Earth Obs. Remote Sens 2010, 3, 576–593. [Google Scholar]
  29. Englhart, S.; Keuck, V.; Siegert, F. Aboveground biomass retrieval in tropical forests—The potential of combined X- and L-band SAR data use. Remote Sens. Environ 2011, 115, 1260–1271. [Google Scholar]
  30. Zuo, Y.; Ge, L.; Zhang, K. Evaluation of ALOS PALSAR applicability to generate bushfire scar maps. Proceedings of the 31st Asian Conference on Remote Sensing, Hanoi, Vietnam, 1–5 November 2010.
  31. Mari, N.; Laneve, G.; Cadau, E.; Porcasi, X. Fire damage assessment in Sardinia: The use of ALOS/PALSAR data for post fire effects management. Eur. J. Remote Sens 2012, 45, 233–241. [Google Scholar]
  32. Gitas, I.Z.; Polychronaki, A.; Katagis, T.; Mallinis, G. Contribution of remote sensing to disaster management activities: A case study of the large fires in the Peloponnese, Greece. Int. J. Remote Sens 2008, 29, 1847–1853. [Google Scholar]
  33. CIAT-CSI SRTM Website. Available online: http://srtm.csi.cgiar.org/SELECTION/inputCoord.asp (accessed on 7 August 2013).
  34. Harrell, P.A.; Bourgeau-Chavez, L.L.; Kasischke, E.S.; French, N.H.F.; Christensen, N.L.J. Sensitivity of ERS-1 and JERS-1 radar data to biomass and stand structure in Alaskan boreal forest. Remote Sens. Environ 1995, 54, 247–260. [Google Scholar]
  35. Bourgeau-Chavez, L.L.; Kasischke, E.S.; Riordan, K.; Brunzell, S.; Nolan, M.; Hyer, E.; Slawski, J.; Medvecz, M.; Walters, T.; Ames, S. Remote monitoring of spatial and temporal surface soil moisture in fire disturbed boreal forest ecosystems with ERS SAR imagery. Int. J. Remote Sens 2007, 28, 2133–2162. [Google Scholar]
  36. Chavez, P.S., Jr. Image-based atmospheric corrections-revisited and improved. Photogramm. Eng. Remote Sens 1996, 6, 1025–1036. [Google Scholar]
  37. Sarmap Website. Available online: http://www.sarmap.ch/pdf/SAR-Guidebook.pdf (accessed on 25 September 2013).
  38. Alaska Satellite Facility. Available online: http://media.asf.alaska.edu/asfmainsite/documents/sci-sar-userguide.pdf (accessed on 25 September 2013).
  39. Dekker, R.J. Speckle filtering in satellite SAR change detection imagery. Int. J. Remote Sens 1998, 19, 1133–1146. [Google Scholar]
  40. Almeida-Filho, R.; Shimabukuro, Y.E. Detecting areas disturbed by gold mining activities through JERS-1 SAR images, Roraima State, Brazilian Amazon. Int. J. Remote Sens 2000, 21, 3357–3362. [Google Scholar]
  41. Bazi, Y.; Bruzzone, L.; Melgani, F. An unsupervised approach based on the generalized Gaussian model to automatic change detection in multitemporal SAR images. IEEE Trans. Geosci. Remote Sen 2005, 43, 874–887. [Google Scholar]
  42. Bovolo, F.; Bruzzone, L. A split-based approach to unsupervised change detection in large-size multitemporal images: Application to tsunami-damage assessment. IEEE Trans. Geosci. Remote Sen 2007, 45, 1658–1670. [Google Scholar]
  43. Giglio, L.; Csiszar, I.; Restás, Á; Morisette, J.T.; Schroeder, W.; Morton, D.; Justice, C.O. Active fire detection and characterization with the advanced spaceborne thermal emission and reflection radiometer (ASTER). Remote Sens. Environ 2008, 112, 3055–3063. [Google Scholar]
  44. Rykhus, R.; Lu, Z. Monitoring a boreal wildfire using multi-temporal Radarsat-1 intensity and coherence images. Geomat. Nat. Hazards Risk 2011, 2, 15–32. [Google Scholar]
  45. Key, C.; Benson, N. Landscape Assessment: Ground Measure of Severity; the Composite Burn Index, and Remote Sensing of Severity, the Normalized Burn Index. In FIREMON: Fire Effects Monitoring and Inventory System; General Technical Report RMRS-GTR-164-CD LA;. Lutes, D., Kean, R., Caratti, J., Key, C., Benson, N., Sutherland, N., Gangi, L., Eds.; USDA Forest Service, Rocky Mountain Research Station: Fort Collins, CO, USA, 2005; pp. 1–51. [Google Scholar]
  46. Veraverbeke, S.; Verstraeten, W.W.; Lhermitte, S.; Goossens, R. Evaluating Landsat Thematic Mapper spectral indices for estimating burn severity of the 2007 Peloponnese wildfires in Greece. Int. J. Wildland Fire 2010, 19, 558–569. [Google Scholar] [Green Version]
  47. Walker, J.S.; Blaschke, T. Object-based land-cover classification for the Phoenix metropolitan area: Optimization vs. transportability. Int. J. Remote Sens 2008, 29, 2021–2040. [Google Scholar]
  48. Bastarrika, A.; Chuvieco, E.; Martín, M.P. Mapping burned areas from Landsat TM/ETM+ data with a two-phase algorithm: Balancing omission and commission errors. Remote Sens. Environ 2011, 115, 1003–1012. [Google Scholar]
  49. Polychronaki, A.; Gitas, I.Z. Burned area mapping in Greece using SPOT-4 HRVIR images and object-based image analysis. Remote Sens 2012, 4, 424–438. [Google Scholar]
  50. eCognition Developer 8.7 Reference Book; Trimble Documentation; Trimble Germany GmbH: München, Germany, 2011.
  51. McNairn, H.; Shang, J.; Jiao, X.; Champagne, C. The contribution of ALOS PALSAR multipolarization and polarimetric data to crop classification. IEEE Trans. Geosci. Remote Sens 2009, 47, 3981–3992. [Google Scholar]
  52. French, N.H.F.; Bourgeau-Chavez, L.L.; Wang, Y.; Kasischke, E.S. Initial observations of Radarsat imagery at fire-disturbed sites in interior Alaska. Remote Sens. Environ 1999, 68, 89–94. [Google Scholar]
  53. Small, D. Flattening gamma: Radiometric terrain correction for SAR imagery. IEEE Trans. Geosci. Remote Sens 2011, 49, 3081–3093. [Google Scholar]
  54. Kasischke, E.S.; Bourgeau-Chavez, L.L.; Johnstone, J.F. Assessing spatial and temporal variations in surface soil moisture in fire-disturbed black spruce forests in Interior Alaska using spaceborne synthetic aperture radar imagery-Implications for post-fire tree recruitment. Remote Sens. Environ 2007, 108, 42–58. [Google Scholar]
  55. Ulaby, F.T.; Batlivala, P.P.; Dobson, M.C. Microwave backscatter dependence on surface-roughness, soil-moisture, and soil texture: Part-1 Bare soil. IEEE Trans. Geosci. Remote Sens 1978, 16, 286–295. [Google Scholar]
Figure 1. (a) Greece highlighted (darker grey) in the map of Europe. (b) Location of the two study areas: The darker boxes indicate the extent of the Advanced Land Observing Satellite (ALOS) Phased Array type L-band Synthetic Aperture Radar (PALSAR) images. (c) Pre-fire land-cover conditions of the two study areas.
Remotesensing 05 05680f1
Figure 2. Segmentation of the Advanced Land Observing Satellite (ALOS) Phased Array type L-band Synthetic Aperture Radar (PALSAR) images. (a) Objects (in black perimeter) overlaid on the Satellites Pour l’Observation de la Terre (SPOT) image acquired after the fire event (R: Near-infrared (0.78–0.89 μm), G: Red (0.61–0.68 μm), B: Green (0.50–0.59 μm)) generated during the initial segmentation and (b) the objects’ classification. (c) Objects (in black perimeter) generated during the second segmentation overlaid on the SPOT image and (d) the objects’ classification. (e) Final objects (in black perimeter) generated after the implementation of the region-growing algorithm overlaid on the SPOT image and (f) the objects’ classification.
Remotesensing 05 05680f2
Figure 3. Visualizations of different object features for mapping burned areas (a) The burned area in the Peloponnese as depicted by Satellites Pour l’Observation de la Terre (SPOT) imagery (R: Near-infrared (0.78–0.89 μm), G: Red (0.61–0.68 μm), B: Green (0.50–0.59 μm)). The black perimeter is the reference fire perimeter, which is generalized for viewing purposes. Healthy vegetation is depicted in red, burned areas in black, and non-vegetated areas in white. (b) Visualization of the normalized difference index of objects (NDI) using the HH (H: Horizontal) polarization data of the Advanced Land Observing Satellite (ALOS) Phased Array type L-band Synthetic Aperture Radar (PALSAR) images acquired before and after the fire (c) Visualization of the log-ratio feature using the HV (V: Vertical) polarization data of the PALSAR images acquired before and after the fire, (d) Visualization of the HV data of the PALSAR image acquired before the fire, (e) Visualization of the HV data of the PALSAR image acquired after the fire.
Remotesensing 05 05680f3
Figure 4. Histograms of different object features, which were investigated to overcome the confusion between burned and unburned objects during the classification. Histogram of (a) the HV (H: Horizontal, V: Vertical) data of Advanced Land Observing Satellite (ALOS) Phased Array type L-band Synthetic Aperture Radar (PALSAR) image acquired before the fire; (b) the normalized difference index of objects (NDI) using the HH polarization data of the PALSAR images acquired before and after the fire; (c) the log-ratio feature using the HV polarization data of PALSAR images acquired before and after the fire; (d) before and after the fire event difference of object mean values in decibels; (e) the ratio feature using the HV polarization data of the PALSAR images acquired before and after the fire; and (f) standard deviations (StdDev.), mean and range values of the different features.
Remotesensing 05 05680f4
Figure 5. Flowchart of the basic steps followed for the development of the object-based classification scheme for burned area mapping using Advanced Land Observing Satellite (ALOS) Phased Array type L-band Synthetic Aperture Radar (PALSAR) images (H: Horizontal and V: Vertical polarization).
Remotesensing 05 05680f5
Figure 6. Black perimeters with the transparent white color show the burned area mapped by the object-based classification scheme and the multi-temporal Advanced Land Observing Satellite (ALOS) Phased Array type L-band Synthetic Aperture Radar (PALSAR) imagery in the Peloponnese (a) and in Rhodes Island (b). The perimeters are overlaid on the land-cover maps of the burned areas, which are generalized for viewing purposes.
Remotesensing 05 05680f6
Figure 7. (a,b) A subset of the burned area in the Peloponnese as depicted by Satellites Pour l’Observation de la Terre (SPOT) imagery (R: Near-infrared (0.78–0.89 μm), G: Red (0.61–0.68 μm), B: Green (0.50–0.59 μm)) before (a) and after (b) the fire event. The black perimeter with the transparent white color shows the area mapped as burned by the object-based classification scheme with the use of the multi-temporal Advanced Land Observing Satellite (ALOS) Phased Array type L-band Synthetic Aperture Radar (PALSAR) imagery. Healthy vegetation is depicted in red, burned areas in black, low vegetation areas in pink, and non-vegetated areas in white. It can be observed that the burned areas in the yellow boxes are not mapped by classification scheme using PALSAR images, which is attributed to pre-fire low vegetation and to non-vegetated areas. (c) The same burned area as depicted by the multi-temporal ALOS PALSAR imagery (R: HV after, G: HV before and B: HH before the fire event, H: Horizontal, V: Vertical).
Remotesensing 05 05680f7
Figure 8. Statistics related to the differenced Normalized Difference Moisture Index (dNDMI) values of the areas omitted by the classification for the study areas of the Peloponnese (a) and Rhodes Island (b). (c) Subset of the IKONOS VHR image (R: Near-infrared (0.757–0.853 μm), G: Red (0.632–0.698 μm), B: Green (0.506–0.595 μm)), depicting the high heterogeneity, in terms of a mixture of burned and unburned trees, of the burned areas omitted by the classification scheme for the study area of Rhodes Island. Red areas represent healthy vegetation whereas burned areas are represented by black and grey colors.
Remotesensing 05 05680f8
Table 1. List of the available Earth Observation (EO) data for the Peloponnese and Rhodes Island study areas.
Study AreaEO DataBands (wavelength)Pixel Size (m)Acquisition DateDate of Fire Event
PeloponneseALOS PALSAR FBD SLC 1HH 5, HV 6 polarizations252007-08-082007-08-30
ALOS PALSAR FBD SLCHH, HV polarizations252007-09-23
SPOT-4 HRVIR 2Green (0.50–0.59 μm), Red (0.61–0.68 μm), NIR 7 (0.78–0.89 μm), SWIR8 (1.58–1.75 μm)202007-07-19
SPOT-4 HRVIRGreen, Red, NIR, SWIR202007-09-09
SPOT-5 HRG 3Green, Red, NIR, SWIR102007-09-02
SRTM DEM 490
RhodesALOS PALSAR FBD SLCHH, HV polarizations252008-05-242008-07-28
ALOS PALSAR FBD SLCHH, HV polarizations252008-10-09
SPOT-4 HRVIR 1Green, Red, NIR, SWIR202008-07-17
SPOT-4 HRVIR 1Green, Red, NIR, SWIR202009-05-15
Two IKONOSBlue (0.445–0.516 μm), Green (0.506–0.595 μm), Red (0.632–0.698 μm), NIR (0.757–0.853 μm)12008-07-31
SRTM DEM90
1Advanced Land Observing Satellite (ALOS) Phased Array type L-band Synthetic Aperture Radar (PALSAR) fine-beam dual-polarization (FBD) single-look complex (SLC);
2Satellites Pour l’Observation de la Terre (SPOT) High-Resolution Visible and Infrared (HRVIR);
3SPOT High Resolution Geometric (HRG);
4Shuttle Radar Topography Mission (SRTM) Digital Elevation Model (DEM);
5Horizontal to Horizontal polarization;
6Horizontal to Vertical polarization;
7near-infrared;
8short-wave infrared.
Table 2. Accuracy assessment results of the object-based burned area mapping using Advanced Land Observing Satellite (ALOS) Phased Array type L-band Synthetic Aperture Radar (PALSAR) images. The probabilities of detection (Pd) and the probabilities of false alarm (Pf) are provided for the Peloponnese and Rhodes Island.
Study AreaProbabilities of DetectionProbabilities of False Alarm
Peloponnese0.710.048
Rhodes Island0.820.083
Table 3. Probabilities of detection (Pd) and probabilities of false alarm (Pf) for the two study areas for each land-cover.
AccuraciesPeloponneseRhodes
Probabilities of detectionForest0.770.83
Grassland0.720.81
Agricultural areas0.750.84
Sparsely and Non-vegetated areas0.510.81

Probabilities of false alarmForest0.010.02
Grassland0.010.02
Agricultural areas0.010.02
Sparsely and Non-vegetated areas0.0040.002

