Communication

Videographic Analysis of Eriophorum Vaginatum Spatial Coverage in an Ombotrophic Bog

Department of Geography, McGill University, 805 Sherbrooke West, Montreal, QC H3A 2K6, Canada
*
Author to whom correspondence should be addressed.
Remote Sens. 2013, 5(12), 6501-6512; https://doi.org/10.3390/rs5126501
Submission received: 16 October 2013 / Revised: 22 November 2013 / Accepted: 28 November 2013 / Published: 2 December 2013
(This article belongs to the Special Issue Remote Sensing of Peatlands I)

Abstract

:
The use of Remotely Piloted Aircraft Systems (RPAS) as well as newer automated unmanned aerial vehicles is becoming a standard method in remote sensing studies requiring high spatial resolution (<1 m) and very precise temporal data to capture phenological events. In this study we use a low cost rotorcraft to map Eriophorum vaginatum at Mer Bleue, an ombrotrophic bog located east of Ottawa, ON, Canada. We focus on E. vaginatum because this sedge plays an important role in methane (CH4) gas exchange in peatlands. Using the remote controlled rotorcraft we were able to record, process, and mosaic 11.1 hectares of 4.5 cm spatial resolution imagery extracted from individual frames of video recordings (post georegistration RMSE 4.90 ± 4.95 cm). Our results, based on a supervised classification (96% accuracy) of the red, green, blue image planes, indicate a total tussock cover of 2,417 m2. Because the basal area of the plant is more relevant for calculating its contribution to the CH4 flux, the tussock area was related to the basal area from field data (R2 = 0.88, p < 0.0001). Our final results indicate a total basal area of 1,786 ± 62.8 m2. Based on temporal measurements of CH4 flux from the peatland as a whole that vary over the growing season, we estimate the E. vaginatum contribution to range from 3.0% to 17.3% of that total. Overall, our low cost approach was an effective non-destructive way to derive E. vaginatum coverage and estimate CH4 exchange over the growing season.

1. Introduction

The development and application of both Remotely Piloted Aircraft Systems (RPAS) (e.g., rotorcraft, quadrocopters) and unmanned aerial vehicles (UAVs) for vegetation mapping has several advantages over conventional imaging from high altitude fixed wing aircraft or satellite platforms, particularly for areas where high spatial resolution images (i.e., sub-meter pixels) are required [1]. Peatland classification and characterization is an example of an application for which these small deployable imaging platforms are ideal [2]. Remote sensing techniques in general have shown potential for peatland monitoring, but most previous studies have focused on the use of relatively coarse spatial resolution imagery that often resulted in limited discrimination of cover types or biophysical characteristics [3]. Alternative techniques such as data fusion between high spatial resolution imagery and LiDAR [3], classification of pan-sharpened multispectral imagery [4], analysis of airborne hyperspectral imagery [5] and object based classification of aerial photography [6] have reduced the thematic uncertainty in peatland classifications. Nevertheless, for the detection of short durational phenomena such as the flowering events of some peatland species, rapid deployment and high temporal resolution data may be required. Small user deployable platforms (helicopters, quadracopters, UAVs) with simple imaging instrumentation such as photographic cameras or video recorders allow for flexibility and repeatability in data collection when reliance on conventional aerial imaging or satellite imagery may not be feasible.
25% of the world’s soil carbon is stored in Northern peatlands—some of these have been accumulating carbon for up to 10,000 years [7,8]. Peatlands are important sources of gas exchange between the surface and the atmosphere, and generally represent carbon sinks for CO2. However, peatlands can also act as sources of carbon through the flux of methane. Radiocarbon analyses of 14C for CH4 flux from peatlands differ widely with some studies reporting release of entirely modern carbon (fixed post 1950s) to others reporting large proportions of 14C fixed centuries to millennia ago [7]. The net carbon exchange for peatlands includes the net ecosystem production (NEP), the flux of methane (loss or gain of C), and the loss or gain of dissolved organic carbon through water inputs or runoff [8]. The methane flux component has been estimated at 5–20 g·cm−2·yr−1 [9]. The total yearly emission of CH4-C from northern peatlands worldwide has been estimated to be 10–25 Tg·yr−1 [8]. With northern peatlands expected to undergo the effects of climate change (e.g., warmer temperatures) their carbon balance is expected to change accordingly.
Controls on the flux of CH4 from peatlands such as the water table position, peat temperature, microbial CH4 production and consumption, and plant-mediated transport are fairly well understood [10]. One of the main controls in ombotrophic (rain fed) bogs is water table position with increased CH4 emission with dropping water table levels [11]. Eriophorum vaginatum (cotton-grass) along with other sedge species commonly found in bogs are hardy plants well adapted to growing in mineral poor peatlands with a broad range of pH. E. vaginatum also grows in contaminated soils as a hyper-accumulator of metals [12,13]. E. vaginatum is an important vascular plant species in the daily control of CH4 emission where its aerenchyma serves as a conduit for CH4 resulting in larger emissions of CH4 from its tussocks than from bare peat surfaces [13,14]. Aerenchymateous tissues are an adaptation that allow for gas exchange to provide oxygen to tissues that may be submerged below the water table [12].
Accurate estimates of peatland gas exchange are fundamentally important for understanding the magnitude of emissions from peatlands and to model and predict the response under different climate change scenarios [15,16]. Accurate estimates of the aerial extent of vegetation such as E. vaginatum would improve the estimates of a peatland’s carbon balance. The total areal coverage however, is fairly difficult to determine from ground observations without damaging fragile bog vegetation. Furthermore, its small tussock area makes it very difficult to estimate its coverage from satellite imagery [2] and its phenology provides only a short window of opportunity to be detected by imaging techniques (2–3 weeks flowering period). In this case, aerial guided or UAV platforms are an ideal remote sensing tool to detect E. vaginatum [1719]. In addition, these small platforms are generally flown at low altitude allowing for data collection in a broad range of atmospheric conditions. For example, they can be flown when there are high altitude clouds that would obscure the ground in satellite imagery. The objective of our study was to determine the areal coverage of E. vaginatum from remote controlled rotorcraft videography and estimate its contribution to the total bog flux of CH4. Several studies have focused on overall classifications of bogs [2,46,20,21]. Here we focus only on the detection and classification of E. vaginatum. This focus is explained by this plant’s effect on the daily flux of CH4.

2. Data and Methodology
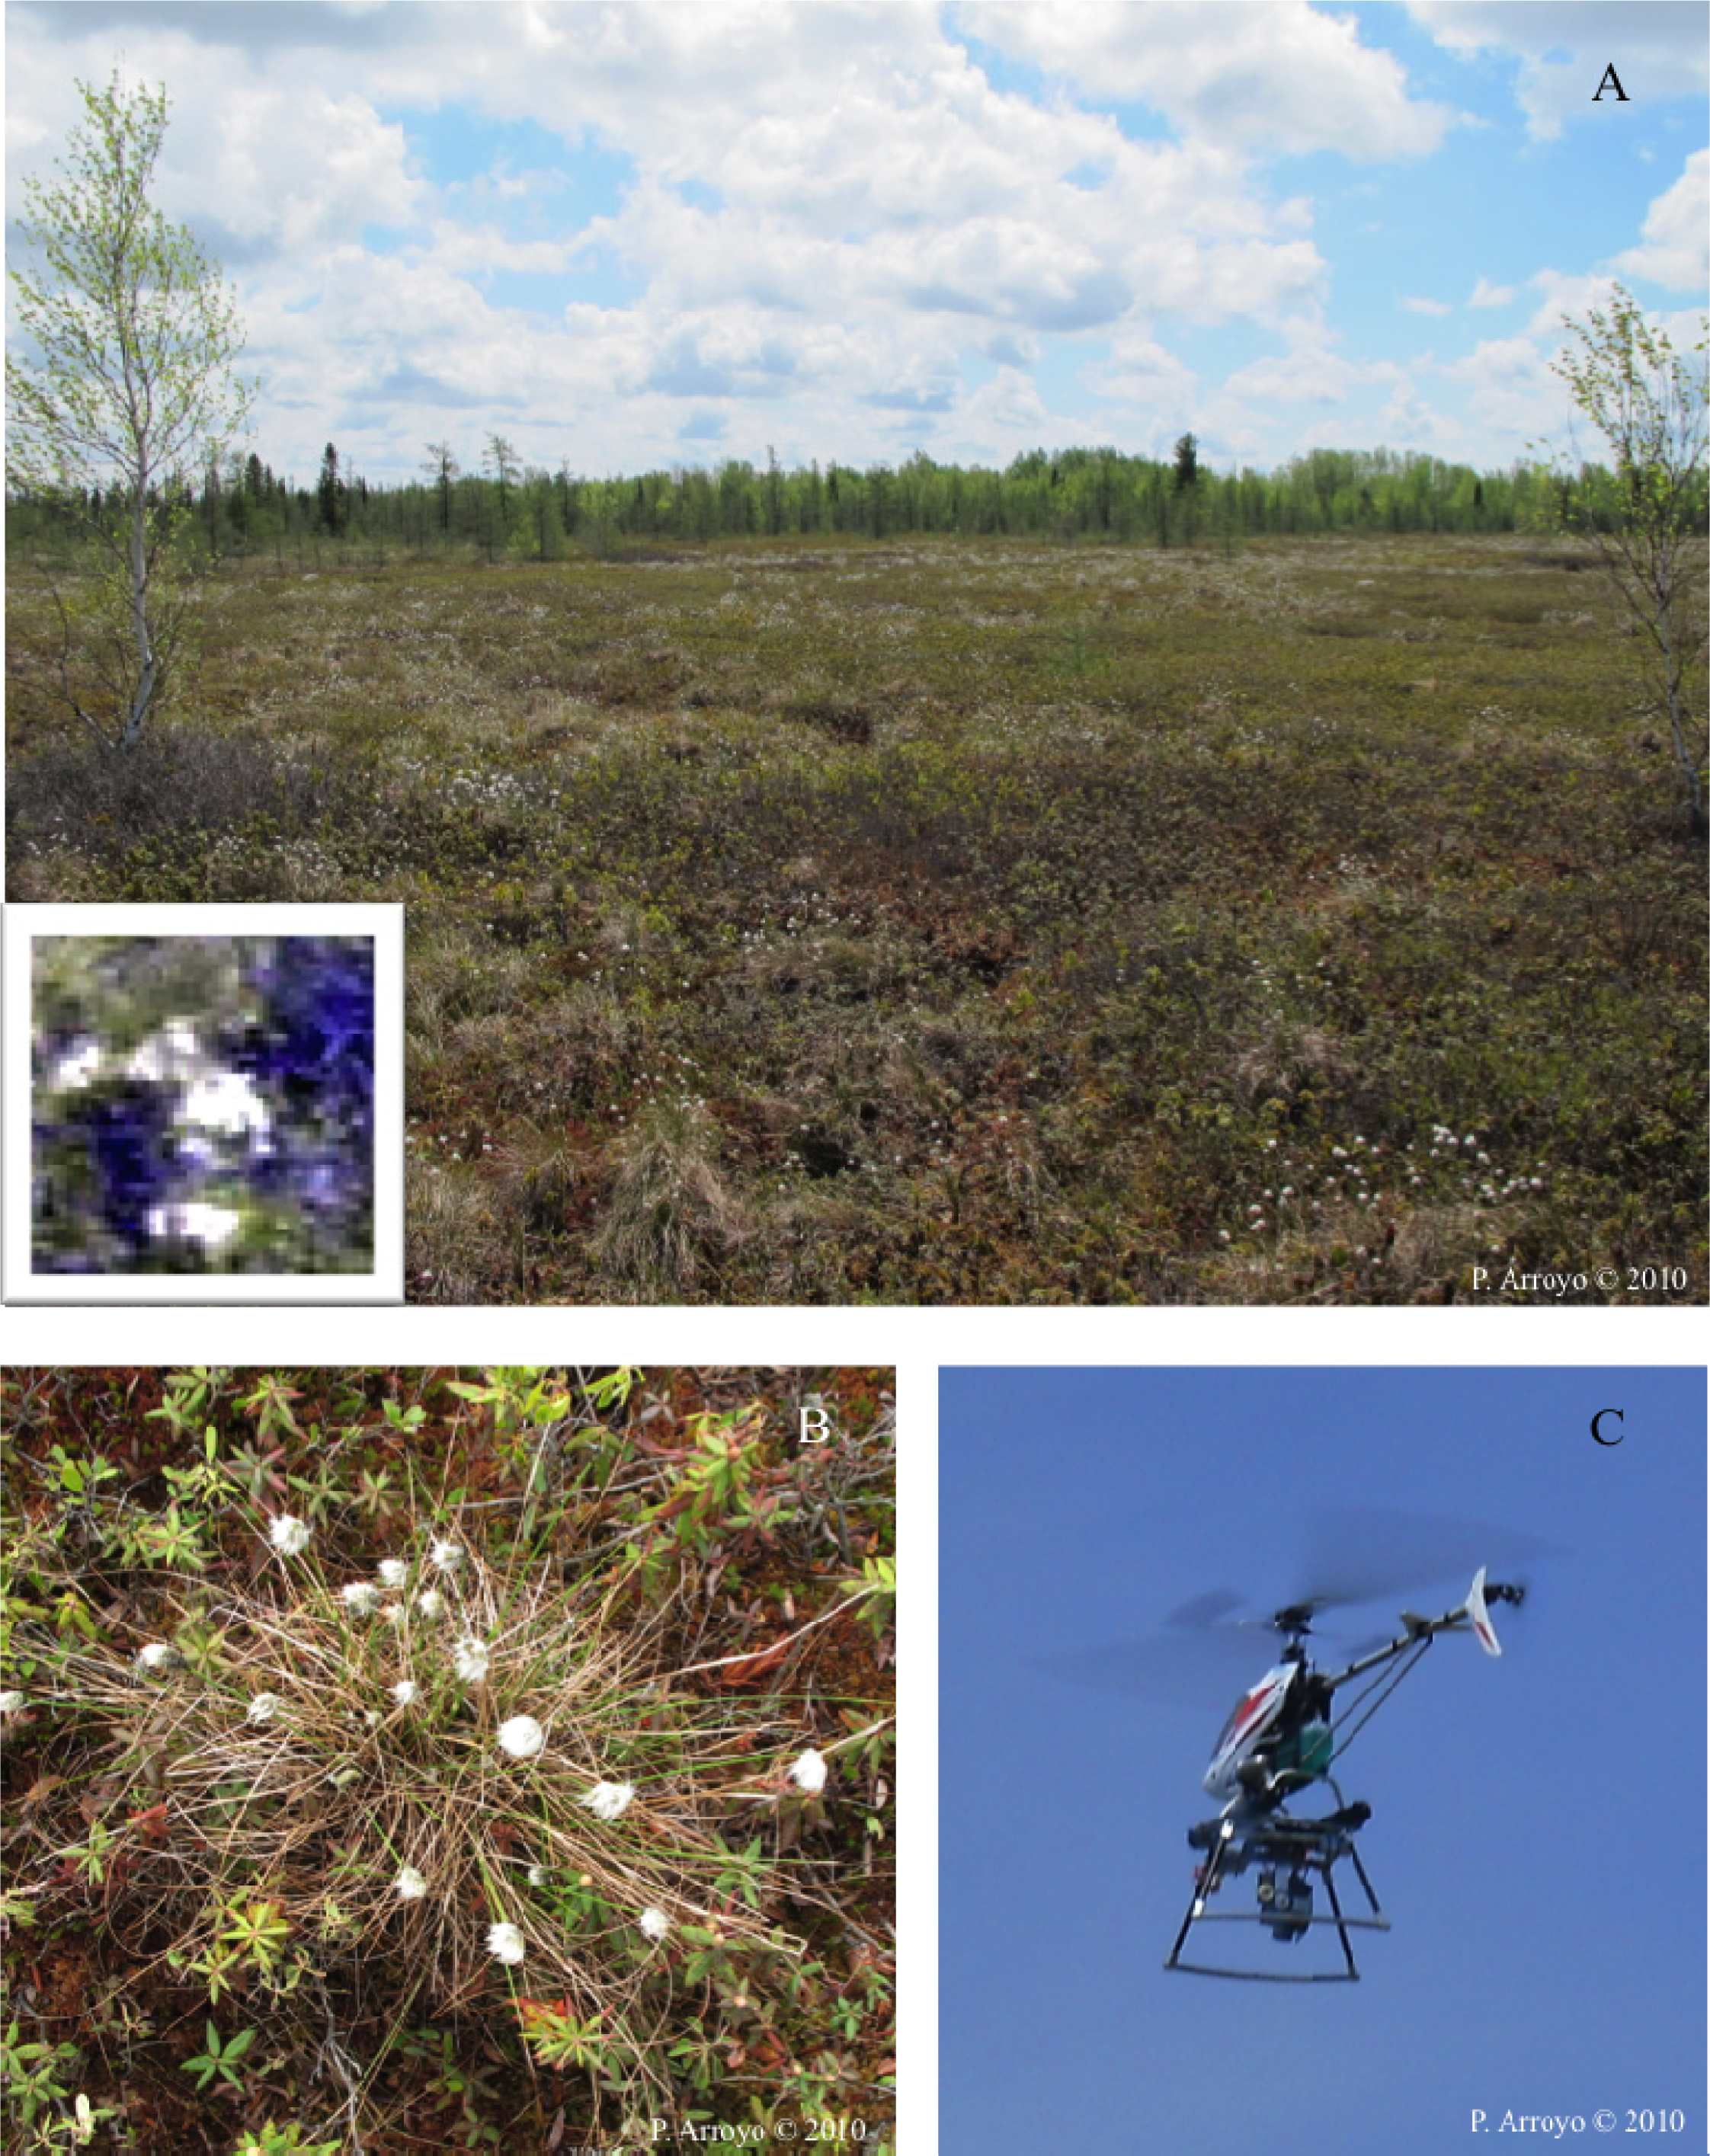
2.1. Study Area

The Mer Bleue peatland is a large (approx. 28 km2) ombrotrophic bog, located east of Ottawa, ON, Canada (45.4°N, 75.5°W), which formed over the past 8,400 years [8]. Ombotrophic bogs receive their entire water input from rainfall. The mean annual temperature is 6.0 ± 0.8 °C with an annual precipitation of 943 mm (of which 235 mm are snow in the winter months) [14]. The growing season is approximately 200 days between the months of May and November. The depth of the peat ranges from 0.3 m in the margins to 5–6 m near the centre [8]. The microtopography (i.e., structural microtopes) is made up of hummocks, hollows, and lawns. The base layer vegetation consists of mosses, mainly Sphagnum capillifolium, Polytrichum strictum, S. magellanicum and S. angustifolium. Vascular vegetation is composed of evergreen (Chamaedaphne calyculata, Ledum groenlandicum, Kalmia angustifolia) and deciduous (Vaccinium myrtilloides) shrubs, sedges (E. vaginatum), and a few trees (Picea mariana, Larix laricina, Betula populifolia) (Figure 1). This study focused on the northwestern section of the bog.

2.2. Data Collection and Preparation

Video files were recorded with a Canon PowerShot G11 camera (35 mm film equivalent focal length) mounted on a radio controlled camera mount affixed to a Hirobo SDX Radio Control rotorcraft (helicopter) (1.2 m long with a main rotor diameter of 1.3 m) operated by an experienced pilot in July 2010 (Figure 1). The fuel tank of the rotorcraft had been modified to include a secondary tank, increasing the time it could remain airborne with maximum payload to 15–20 min minutes per flight. Additionally, the stock exhaust pipe had been extended by 3 inches with rubber tubing to minimize the contamination of the video by the engine exhaust. The video settings were set to 640 × 480 pixels at 30 frames per second (FPS) in M4V file format. Three planes (red, green and blue) were recorded and retained as ‘bands’ in the classification. We chose the RC rotorcraft option, because at the time of data collection, small, automated UAVs such as those described in [2,18,22] were prohibitively expensive to conduct this type of survey. The cost of flying over our study areas was under $1,500—including the equipment.
The rotorcraft took off from preexisting wooden boardwalks that had been installed in the bog to facilitate researcher access and minimize impact on the vegetation. No automatic correction for the altitude was done because there was no inertial system onboard. The raw video footage was cut into short video clips (with Quicktime 7.6) that contained segments of interest with minimal rotorcraft roll and pitch. Segments representing takeoff and landing were also removed. The files were saved as 640 × 480 pixels at 30 FPS in .MOV format. The .MOV clips were imported into Adobe Photoshop CS3 and each frame was saved as a separate Photoshop layer. Each frame/image was reviewed and manually selected for clarity, focus, and lack of shadows/exhaust from the rotorcraft and saved as a TIFF file. The tiffs were subsequently mosaicked and each of the thirty-two final mosaics (consisting of 20–320 tiffs) were saved in TIFF format with LZW compression. Multiple mosaics were created because the data collection consisted of several flights over different areas of the bog. In addition, within a single flight there were minor changes in altitude as well as segments of unusable data (e.g., pitch or roll of the rotorcraft, exhaust in the frame, etc.). Combined, the mosaics covered a total of 11 hectares (0.11 km2). The file sizes of the mosaics ranged from 5.1 to 123.6 MB.

2.3. Classification

Each mosaic was georeferenced in ArcMap 10.0 using the Bing Aerial imagery as the basemap. There were a sufficient number of recognizable features in the mosaics such as boardwalks, gas exchange chambers and trees that all thirty-two mosaics were georeferenced. Because the frames selected for each of the mosaics were visually consistent in altitude, 1st or 2nd order polynomials with a nearest neighbour resampling were suitable for the georeferencing process. An average of 12 control points were used, with up to a maximum of 36 points per mosaic. Each mosaic was then classified in ENVI 4.8 to extract E. vaginatum tussock cover using a supervised parallelepiped classification with a maximum of three standard deviations from the mean with separate training “regions of interest” (ROI) for each mosaic. All three planes from the tiffs (red, green and blue) were used as “bands” in the classification. This species has an identifiable white crown (tussock) during flowering (Figure 1A,B) that is fairly distinct from other species in the bog during the time of image acquisition we selected for this study. The ROIs used for classifier training consisted of 40–45 pixels each. A post-classification sieving was performed with group minimum threshold ranges of 2 to 10 pixels; 24 of the 32 mosaics had a sieve size of five pixels or less. Twenty points were randomly distributed across each mosaic for a total of 620 points to determine the classification accuracy. Based on expert knowledge gathered during the field measurements these points were manually classified via an on-screen interpretation of the mosaics in ENVI 4.8.

2.4. Field Data Collection

To determine the relationship between the tussock area and the basal area of E. vaginatum, we established three 25 m2 plots in areas close to the boardwalks. To minimize long-term disturbance to the bog, investigators wore snowshoes within the plots. Only plants that fell fully within the boundaries of the plots were counted and measured. The field measurements were carried out within one week of the aerial video acquisition. Ground control points were collected with a Garmin 60CSX GPS at each corner of the boardwalk paths in order to verify the registration of the mosaics. The length and width of the boardwalk wooden planks were measured in the field in order to determine the scale of the mosaics for georegistration.

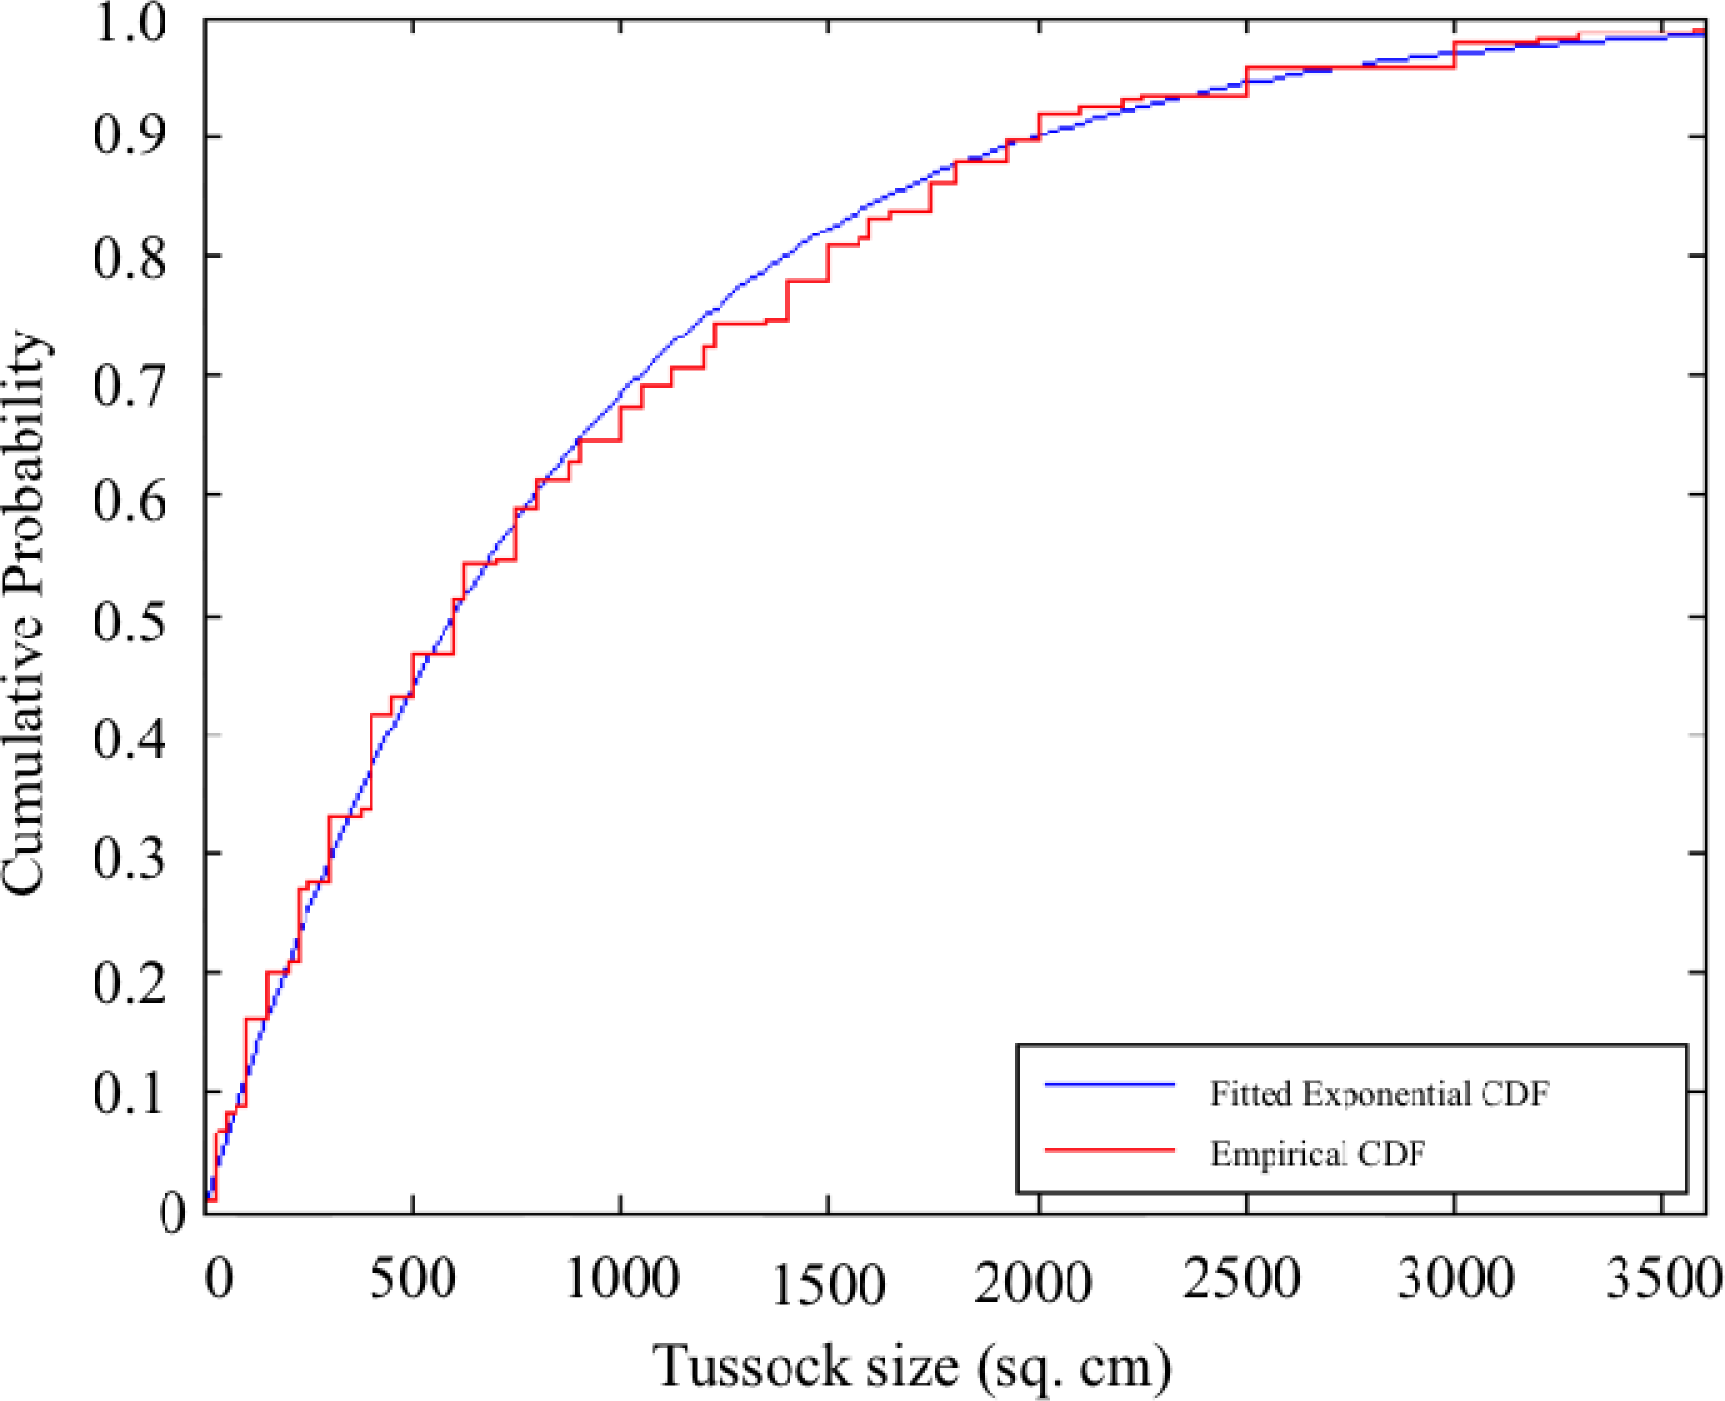
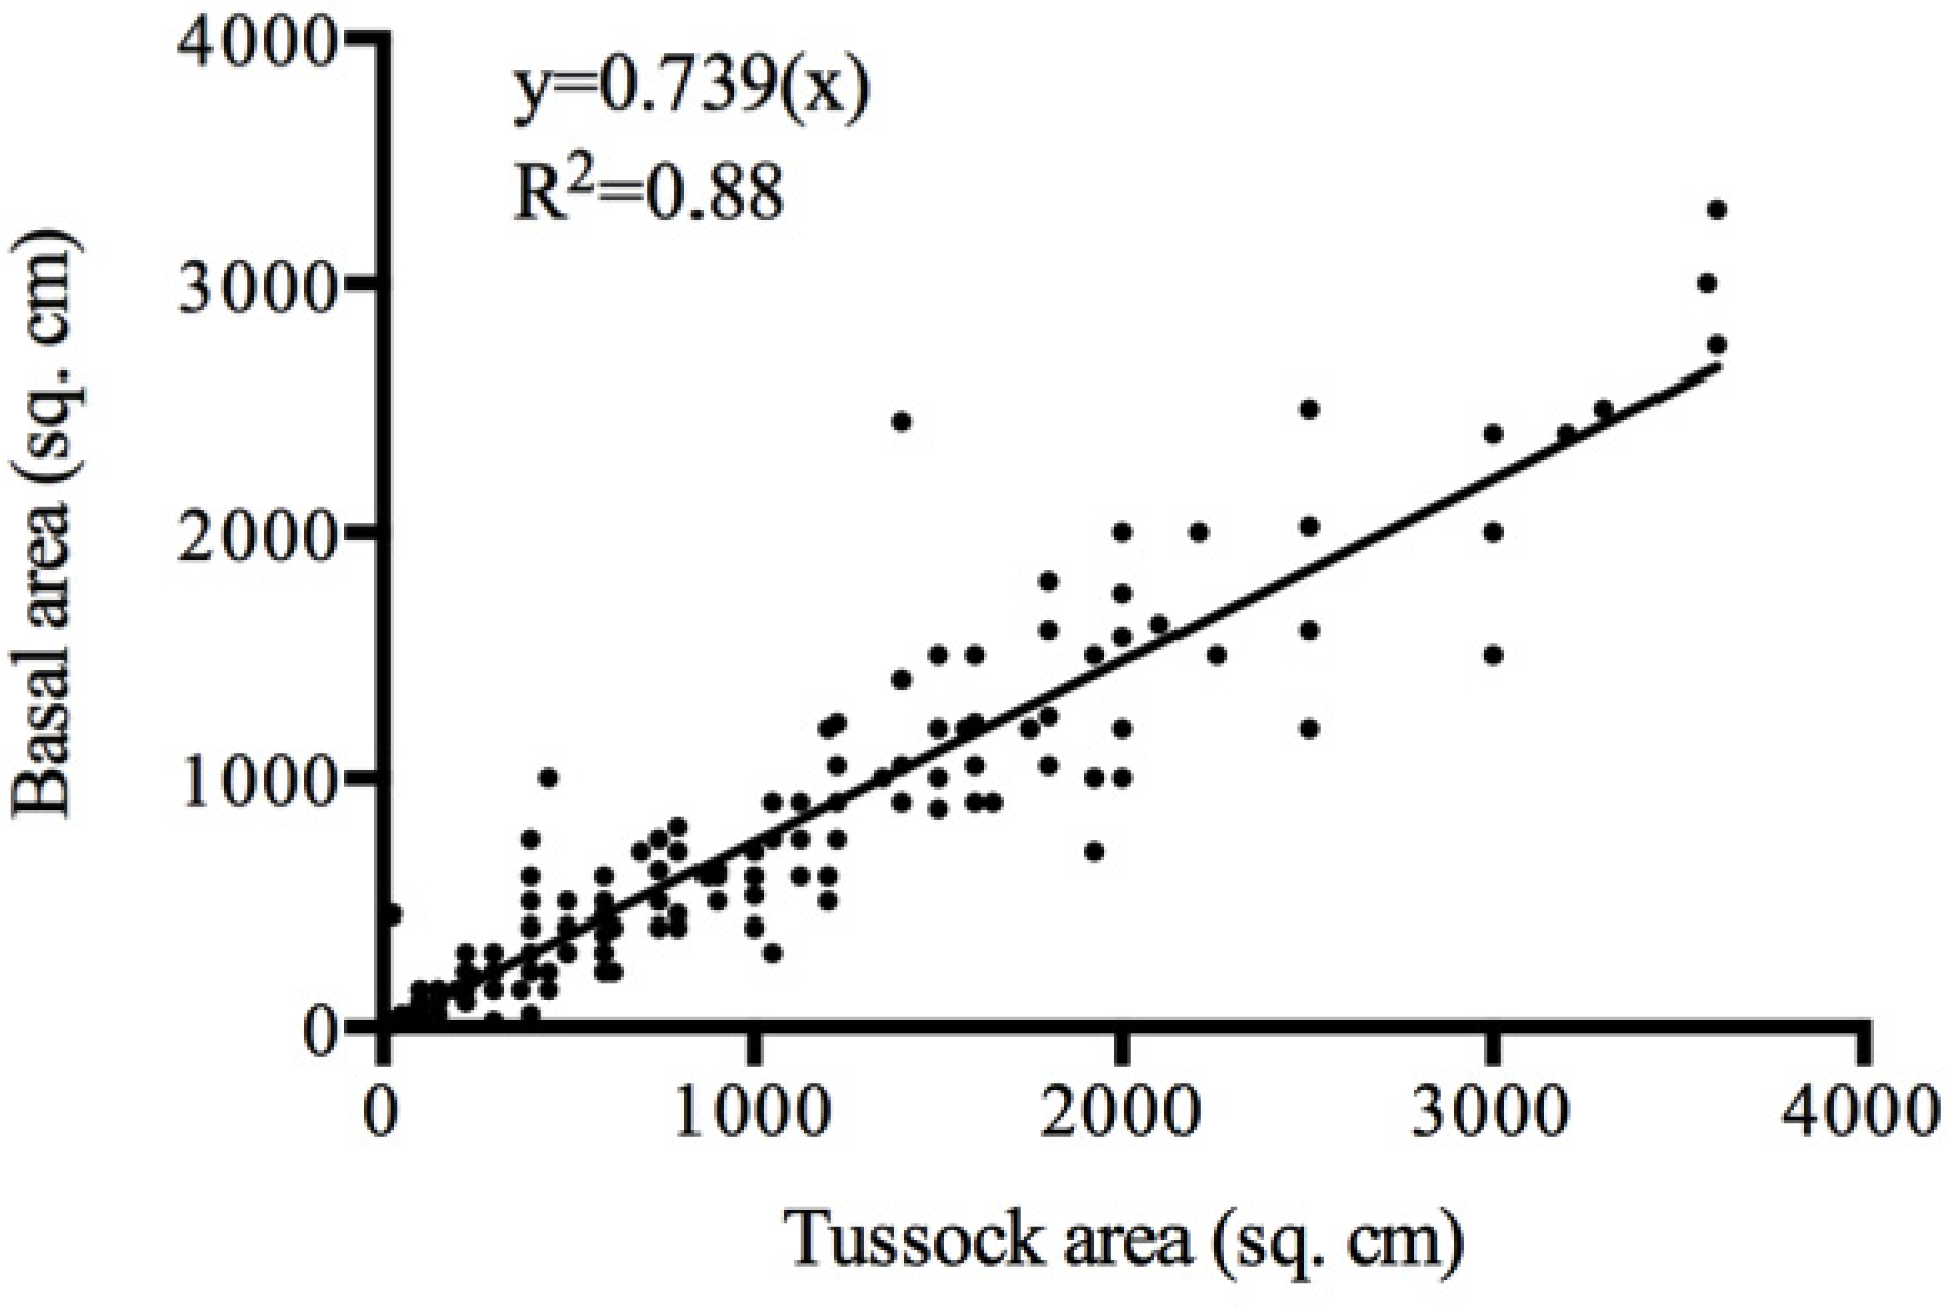
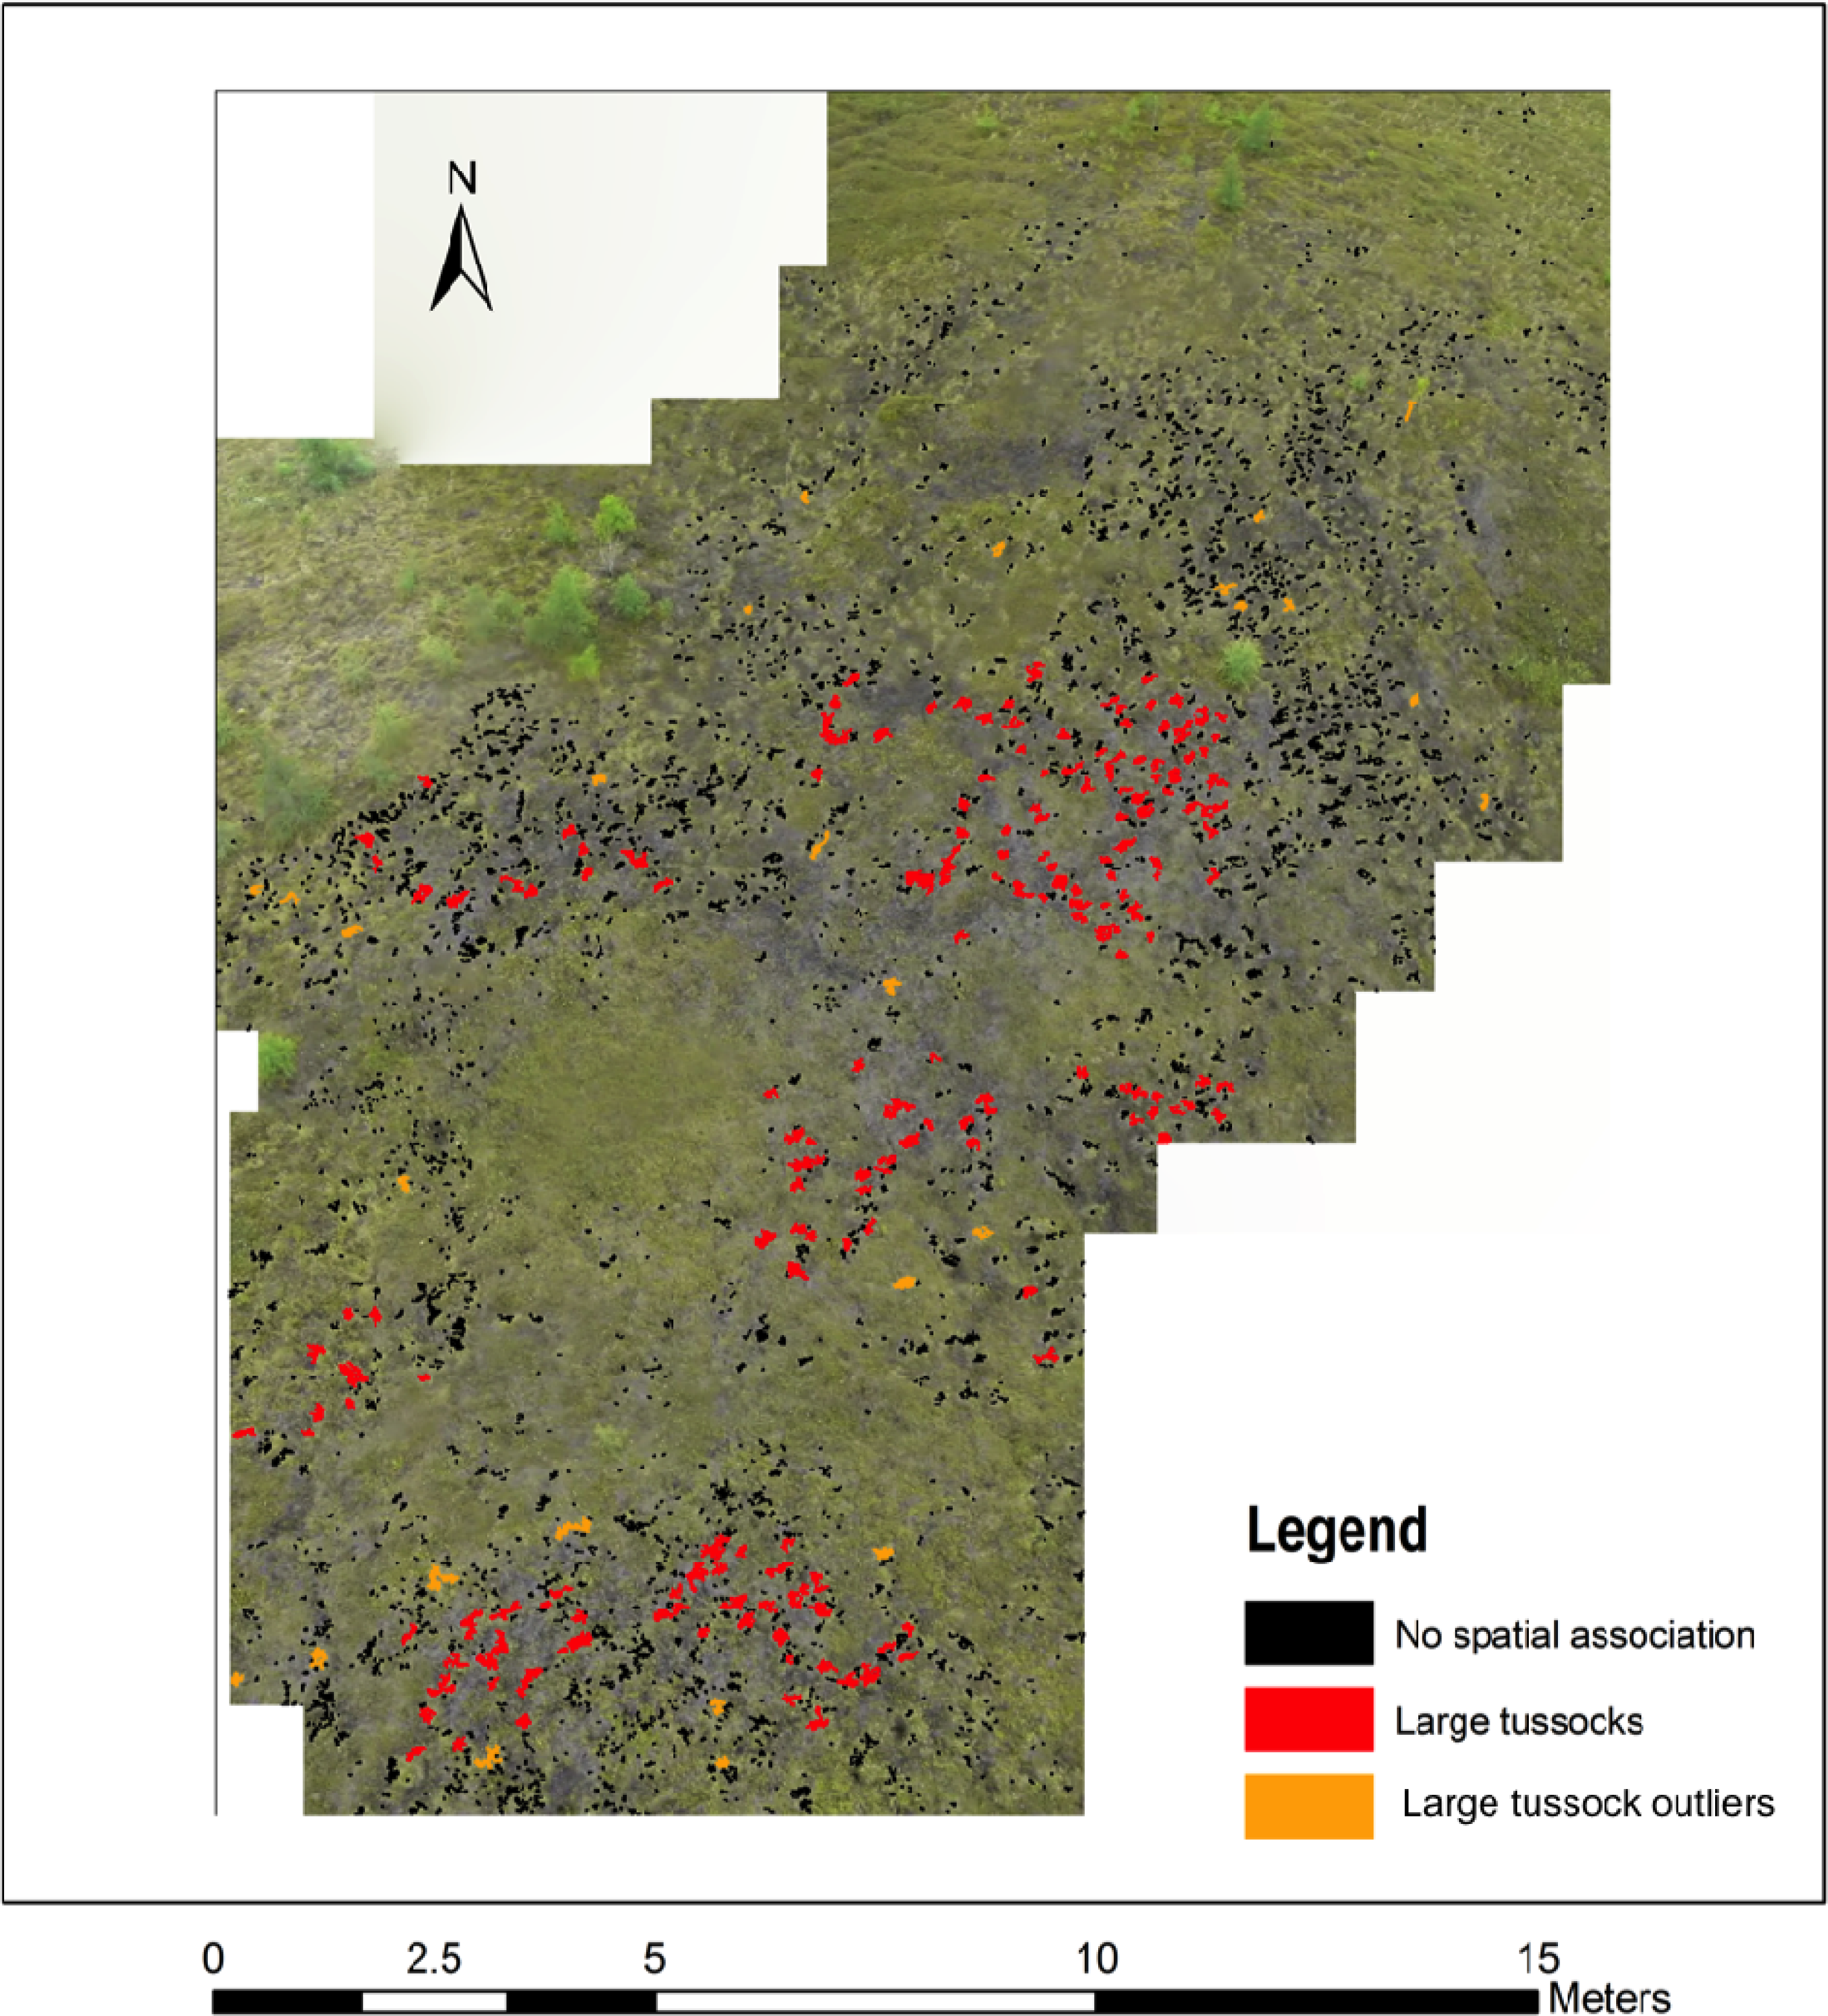
2.5. Statistical Analysis

To model the size distribution of the E. vaginatum crowns, several continuous distributions were fit to the field measured tussock areas; the best-fit model was selected based on minimizing the AICc criterion. This distribution was used to determine the proportion of crown sizes in various size categories. A multi-distance spatial cluster analysis (Ripley’s K) [23] as well as a Cluster and Outlier analysis (Anselin Local Moran’s I) [24] were computed in ArcGIS 10.1 on the classified mosaics in order to determine the spatial pattern of the E. vaginatum tussocks. Inverse-distance-weighting interpolation in ArcGIS 10.1 [25] was used to estimate the near surface concentration of CH4 across the mosaics using temporal flux data recorded by [14].

3. Results and Discussion

The final pixel size of the mosaics ranged from 4.1 to 5.3 cm with an average of 4.5 cm and an average RMSE of the georegistration of 4.90 ± 4.95 cm. The pixel sizes differed between the mosaics because of changes in altitude of the rotorcraft between flights. At the time of image acquisition L. groenlandicum was also in flower, but rather than being a large tussock with flowers it has small single white flowers. For every mosaic, the single pixels classified as E. vaginatum surrounded by background pixels, which likely represented L. groenlandicum, were removed through the post-classification sieving process. Based on the best-fit parametric probability density distribution (i.e., Exponential distribution, AICc = 3,325.4), plants with tussocks 5 cm2 or smaller are estimated to account for only 0.58% of the total E. vaginatum population (Figure 2). Therefore, the proportion of E. vaginatum erroneously removed through the sieving process is presumed to be minimal.
The overall classification accuracy of the mosaics ranged from 90% to 100% with an average of 96%. The primary source for error in the classification came from background (non E. vaginatum) pixels being classified as E. vaginatum (2.2% of the validation points) indicating a small overestimation of the total area. The area of E. vaginatum tussock cover extracted from the mosaics ranged from 0.8 to 6.0% (average 1.5%) of the total area of all mosaics of 2,417 m2. Because the basal area of the plant is more relevant for determining its contribution as a conduit for CH4 production, the tussock area was related to the basal area measured in the field. The tussock areas measured in the field varied from 1 cm2 to 3,600 cm2 per plant, while the field measured basal areas ranged from 4 cm2 to 3,300 cm2 per plant. A significant linear relationship was found between tussock and basal areas (R2 = 0.88, p < 0.0001) (Figure 3). This linear relationship was used to convert the image derived tussock area to total basal area from the mosaics (1,786 ± 62.8 m2). The error term takes into account the uncertainty from the classification error and the uncertainty from the regression through standard additive error terms.
Spatial analysis of the tussock centres (Ripley’s K) revealed that at all scales the tussocks are spatially clustered. When the spatial association between tussocks was examined (Anselin Local Moran’s I), minimal patterns of clustering based on size were found: 2.78% are “large” tussocks clustered, 1.15% are large tussock outliers surrounded by small tussocks, 0.4% are clusters of “small” crowns (Figure 4). Using a mean value of 233 mg·m−2·d−1 as the growing season average [14], Figure 5 illustrates an example of a spatially interpolated surface of CH4 flux. As expected, larger fluxes of CH4 can be seen around the largest tussocks. However, the seasonal pattern of CH4 emission is equally important to consider. From the temporal values of E. vaginatum CH4 flux from 15 May to 19 November 2007, the animation in Figure S1 illustrates spatio-temporal variability of CH4 from the tussocks for the same area. The emission of CH4 from E. vaginatum remains fairly substantial into the end of the growing season (Figure S1).
Over a 200 day growing season from May to mid-November, a flux of 233 mg·m−2·d−1 results in 46.6 g/m2, or a total of 83.2 kg from the total tussock basal area we extracted from the mosaics. This estimate falls within the ranges calculated by [9,14]. Allowing for 1.5% coverage of E. vaginatum of the total bog area, results in a 19,320 kg CH4-C contribution to the whole bog flux. Based on Moore et al.’s 2011 [14] 23.1–4.0 g·CH4·m−2 estimate of the flux from the peatland as a whole, we estimate the E. vaginatum contribution to range from 3.0% to 17.3% of that total.

4. Conclusions and Recommendations

We have shown a cost effective, non-destructive method to determine the total aerial extent of E. vaginatum tussocks in a fragile peatland environment. The relatively simple classification method of extracting only the single class of E. vaginatum from a varied background resulted in high classification accuracy. With the high spatial resolution, it would also be possible to extract other classes that may be of interest such as the trees, areas of exposed mosses (i.e., minimal vascular plant cover), among others. New models of UAVs reduce the reliance on an experienced pilot because they not only do not require a pilot to keep them airborne, but their sophisticated navigational software allows the user to enter waypoints, flight speed, and altitude for an automated flight [2,18,22]. These new UAVs would also improve the image quality because through the automated flight systems the altitude and speed are kept constant, minimizing the distortion in the final data. Furthermore, with the advent of small and light sensors, data could also be collected as hyperspectral flight lines rather than the three planes (red, green, blue), increasing the range of biophysical characteristics that could be extracted from the data.

Acknowledgments

The authors thank Jordan Trevick for flying the rotorcraft and Oliver Schmitt, Mark Lalonde, Janine Reitsma, Frank Ferber, Neha Gupta and Mari Mesri for their help with the field data collection, image preprocessing and georeferencing. This study was supported by the Natural Sciences and Engineering Research Council Canada (NSERC) and the Fonds Quebecois de la Recherche sur la Nature et les Tecnologies (FQRNT). The authors also thank the three anonymous reviewers whose comments helped improve the manuscript.

Conflicts of Interest

The authors declare no conflict of interest.

References

  1. Berni, J.A.J.; Zarco-Tejada, P.J.; Suarez, L.; Fereres, E. Thermal and narrowband multispectral remote sensing for vegetation monitoring from an unmanned aerial vehicle. IEEE Trans. Geosci. Remote Sens 2009, 47, 722–738. [Google Scholar]
  2. Knoth, C.; Klein, B.; Prinz, T.; Kleinebecker, T. Unmanned aerial vehicles as innovative remote sensing platforms for high-resolution infrared imagery to support restoration monitoring in cut-over bogs. Appl. Veg. Sci 2013, 16, 509–517. [Google Scholar]
  3. Anderson, K.; Bennie, J.J.; Milton, E.J.; Hughes, P.D.M.; Lindsay, R.; Meade, R. Combining LiDAR and IKONOS data for eco-hydrological classification of an ombrotrophic peatland. J. Environ. Qual 2010, 39, 260–273. [Google Scholar]
  4. Dribault, Y.; Chokmani, K.; Bernier, M. Monitoring seasonal hydrological dynamics of Minerotrophic peatlands using multi-date GeoEye-1 high resolution imagery and object-based classification. Remote Sens 2012, 4, 1887–1912. [Google Scholar]
  5. Middleton, M.; Narhi, P.; Arkimaa, H.; Hyvonen, E.; Kuosmanen, V.; Treitz, P.; Sutinen, R. Ordination and hyperspectral remote sensing approach to classify peatland biotopes along soil moisture and fertility gradients. Remote Sens. Environ 2012, 124, 596–609. [Google Scholar]
  6. Weissert, L.F.; Disney, M. Carbon storage in peatlands: A case study on the Isle of Man. Geoderma 2013, 204, 111–119. [Google Scholar]
  7. Garnett, M.H.; Hardie, S.M.L.; Murray, C. Radiocarbon analysis of methane emitted from the surface of a raised peat bog. Soil Biol. Biochem 2012, 50, 158–163. [Google Scholar]
  8. Roulet, N.T.; Lafleur, P.M.; Richard, P.J.H.; Moore, T.R.; Humphreys, E.R.; Bubier, J. Contemporary carbon balance and late Holocene carbon accumulation in a northern peatland. Glob. Chang. Biol 2007, 13, 397–411. [Google Scholar]
  9. Gorham, E. Northern peatlands: Role in the carbon budget and probable responses to global warming. Ecol. Appl 1991, 1, 182–195. [Google Scholar]
  10. Wahlen, M.; Tanaka, N.; Henry, R.; Deck, B.; Zeglen, J.; Vogel, J.S.; Southon, J.; Shemesh, A.; Fairbanks, R.; Broecker, W. Carbon-14 in methane sources and in atmospheric methane: The contribution from fossil carbon. Science 1989, 245, 286–290. [Google Scholar]
  11. Moore, T.; Dalva, M. The influence of temperature and water table position on methane and carbone dioxide emissions from laboratory columns and peatland soils. J. Soil Sci 1993, 44, 651–654. [Google Scholar]
  12. Bogart, S.J.; Spiers, G.; Cholewa, E. X-ray mu CT imaging technique reveals corm microstructures of an arctic-boreal cotton-sedge, Eriophorum vaginatum. J. Struct. Biol 2010, 171, 361–371. [Google Scholar]
  13. Marinier, M.; Glatzel, S.; Moore, T.R. The role of cotton-grass (Eriophorum vaginatum) in the exchange of CO2 and CH4 at two restored peatlands, eastern Canada. Ecoscience 2004, 11, 141–149. [Google Scholar]
  14. Moore, T.R.; De Young, A.; Bubier, J.L.; Humphreys, E.R.; Lafleur, P.M.; Roulet, N.T. A multi-year record of methane flux at the Mer Bleue Bog, Southern Canada. Ecosystems 2011, 14, 646–657. [Google Scholar]
  15. Frolking, S.; Roulet, N.T.; Moore, T.R.; Lafleur, P.M.; Bubier, J.L.; Crill, P.M. Modeling seasonal to annual carbon balance of Mer Bleue Bog, Ontario, Canada. Glob. Biogeochem. Cycles 2002, 16, 4:1–4:21. [Google Scholar]
  16. Lai, D.Y.F.; Roulet, N.T.; Humphreys, E.R.; Moore, T.R.; Dalva, M. The effect of atmospheric turbulence and chamber deployment period on autochamber CO2 and CH4 flux measurements in an ombrotrophic peatland. Biogeosciences 2012, 9, 3305–3322. [Google Scholar]
  17. Rango, A.; Laliberte, A.; Steele, C.; Herrick, J.E.; Bestelmeyer, B.; Schmugge, T.; Roanhorse, A.; Jenkins, V. Using unmanned aerial vehicles for rangelands: Current applications and future potentials. Environ. Pract 2006, 8, 159–168. [Google Scholar]
  18. Duan, S.B.; Li, Z.L.; Tang, B.H.; Wu, H.; Ma, L.L.; Zhao, E.Y.; Li, C.R. Land surface reflectance retrieval from hyperspectral data collected by an unmanned aerial vehicle over the Baotou test site. Plos One 2013, 8, e66972. [Google Scholar]
  19. Forbrich, I.; Kutzbach, L.; Wille, C.; Becker, T.; Wu, J.B.; Wilmking, M. Cross-evaluation of measurements of peatland methane emissions on microform and ecosystem scales using high-resolution landcover classification and source weight modelling. Agric. For. Meteorol 2011, 151, 864–874. [Google Scholar]
  20. Bubier, J.; Moore, T.; Savage, K.; Crill, P. A comparison of methane flux in a boreal landscape between a dry and a wet year. Glob. Biogeochem. Cy. 2005. [Google Scholar] [CrossRef]
  21. Thomas, V.; Treitz, P.; Jelinski, D.; Miller, J.; Lafleur, P.; McCaughey, J.H. Image classification of a northern peatland complex using spectral and plant community data. Remote Sens. Environ 2003, 84, 83–99. [Google Scholar]
  22. Uto, K.; Seki, H.; Saito, G.; Kosugi, Y. Characterization of rice paddies by a UAV-mounted miniature hyperspectral sensor system. IEEE J. Sel. Top. Appl. Earth Obs. Remote Sens 2013, 6, 851–860. [Google Scholar]
  23. Jensen, J.R; Jensen, R.R. Introductory Geographic Information Systems; Pearson: New York USA, 2013. [Google Scholar]
  24. Ripley, B.D. Spatial Statistics; John-Wiley & Sons: New York, USA, 2004. [Google Scholar]
  25. Lloyd, C.D. Spatial Data Analysis: An Introduction for GIS Users; Oxford University Press: Oxford, UK, 2010. [Google Scholar]
Figure 1. (A) Ground photograph looking SE over the Mer Bleue bog with E. vaginatum tussocks, (B) the photo of tussocks. The inset in A shows an example of a clump of tussocks as recorded by the camera (4.6 cm pixel size). The rotorcraft (1.2 m long) (C) with the camera mount and camera collecting the video files.
Remotesensing 05 06501f1
Figure 2. Cumulative probability plot of the bestfit distribution (Exponential) of E. vaginatum tussock crown area (cm2) estimated from the tussocks measured in the field.
Remotesensing 05 06501f2
Figure 3. Relationship of E. vaginatum tussock area to basal area estimated in the field.
Remotesensing 05 06501f3
Figure 4. Example of a mosaic with the classified E. vaginatum tussocks overlain. Pixels in grey do not have any spatial association by tussock size. Pixels in red are clusters of “large” tussocks while yellow are outliers of large tussocks surrounded by small tussocks.
Remotesensing 05 06501f4
Figure 5. Example of a methane flux map interpolated from the estimated basal area of the E. vaginatum tussocks. A growing season average flux of 233 mg·m−2·d−1 [14] for the year 2007 is illustrated.
Remotesensing 05 06501f5

