1. Introduction
Within Yellowstone National Park (
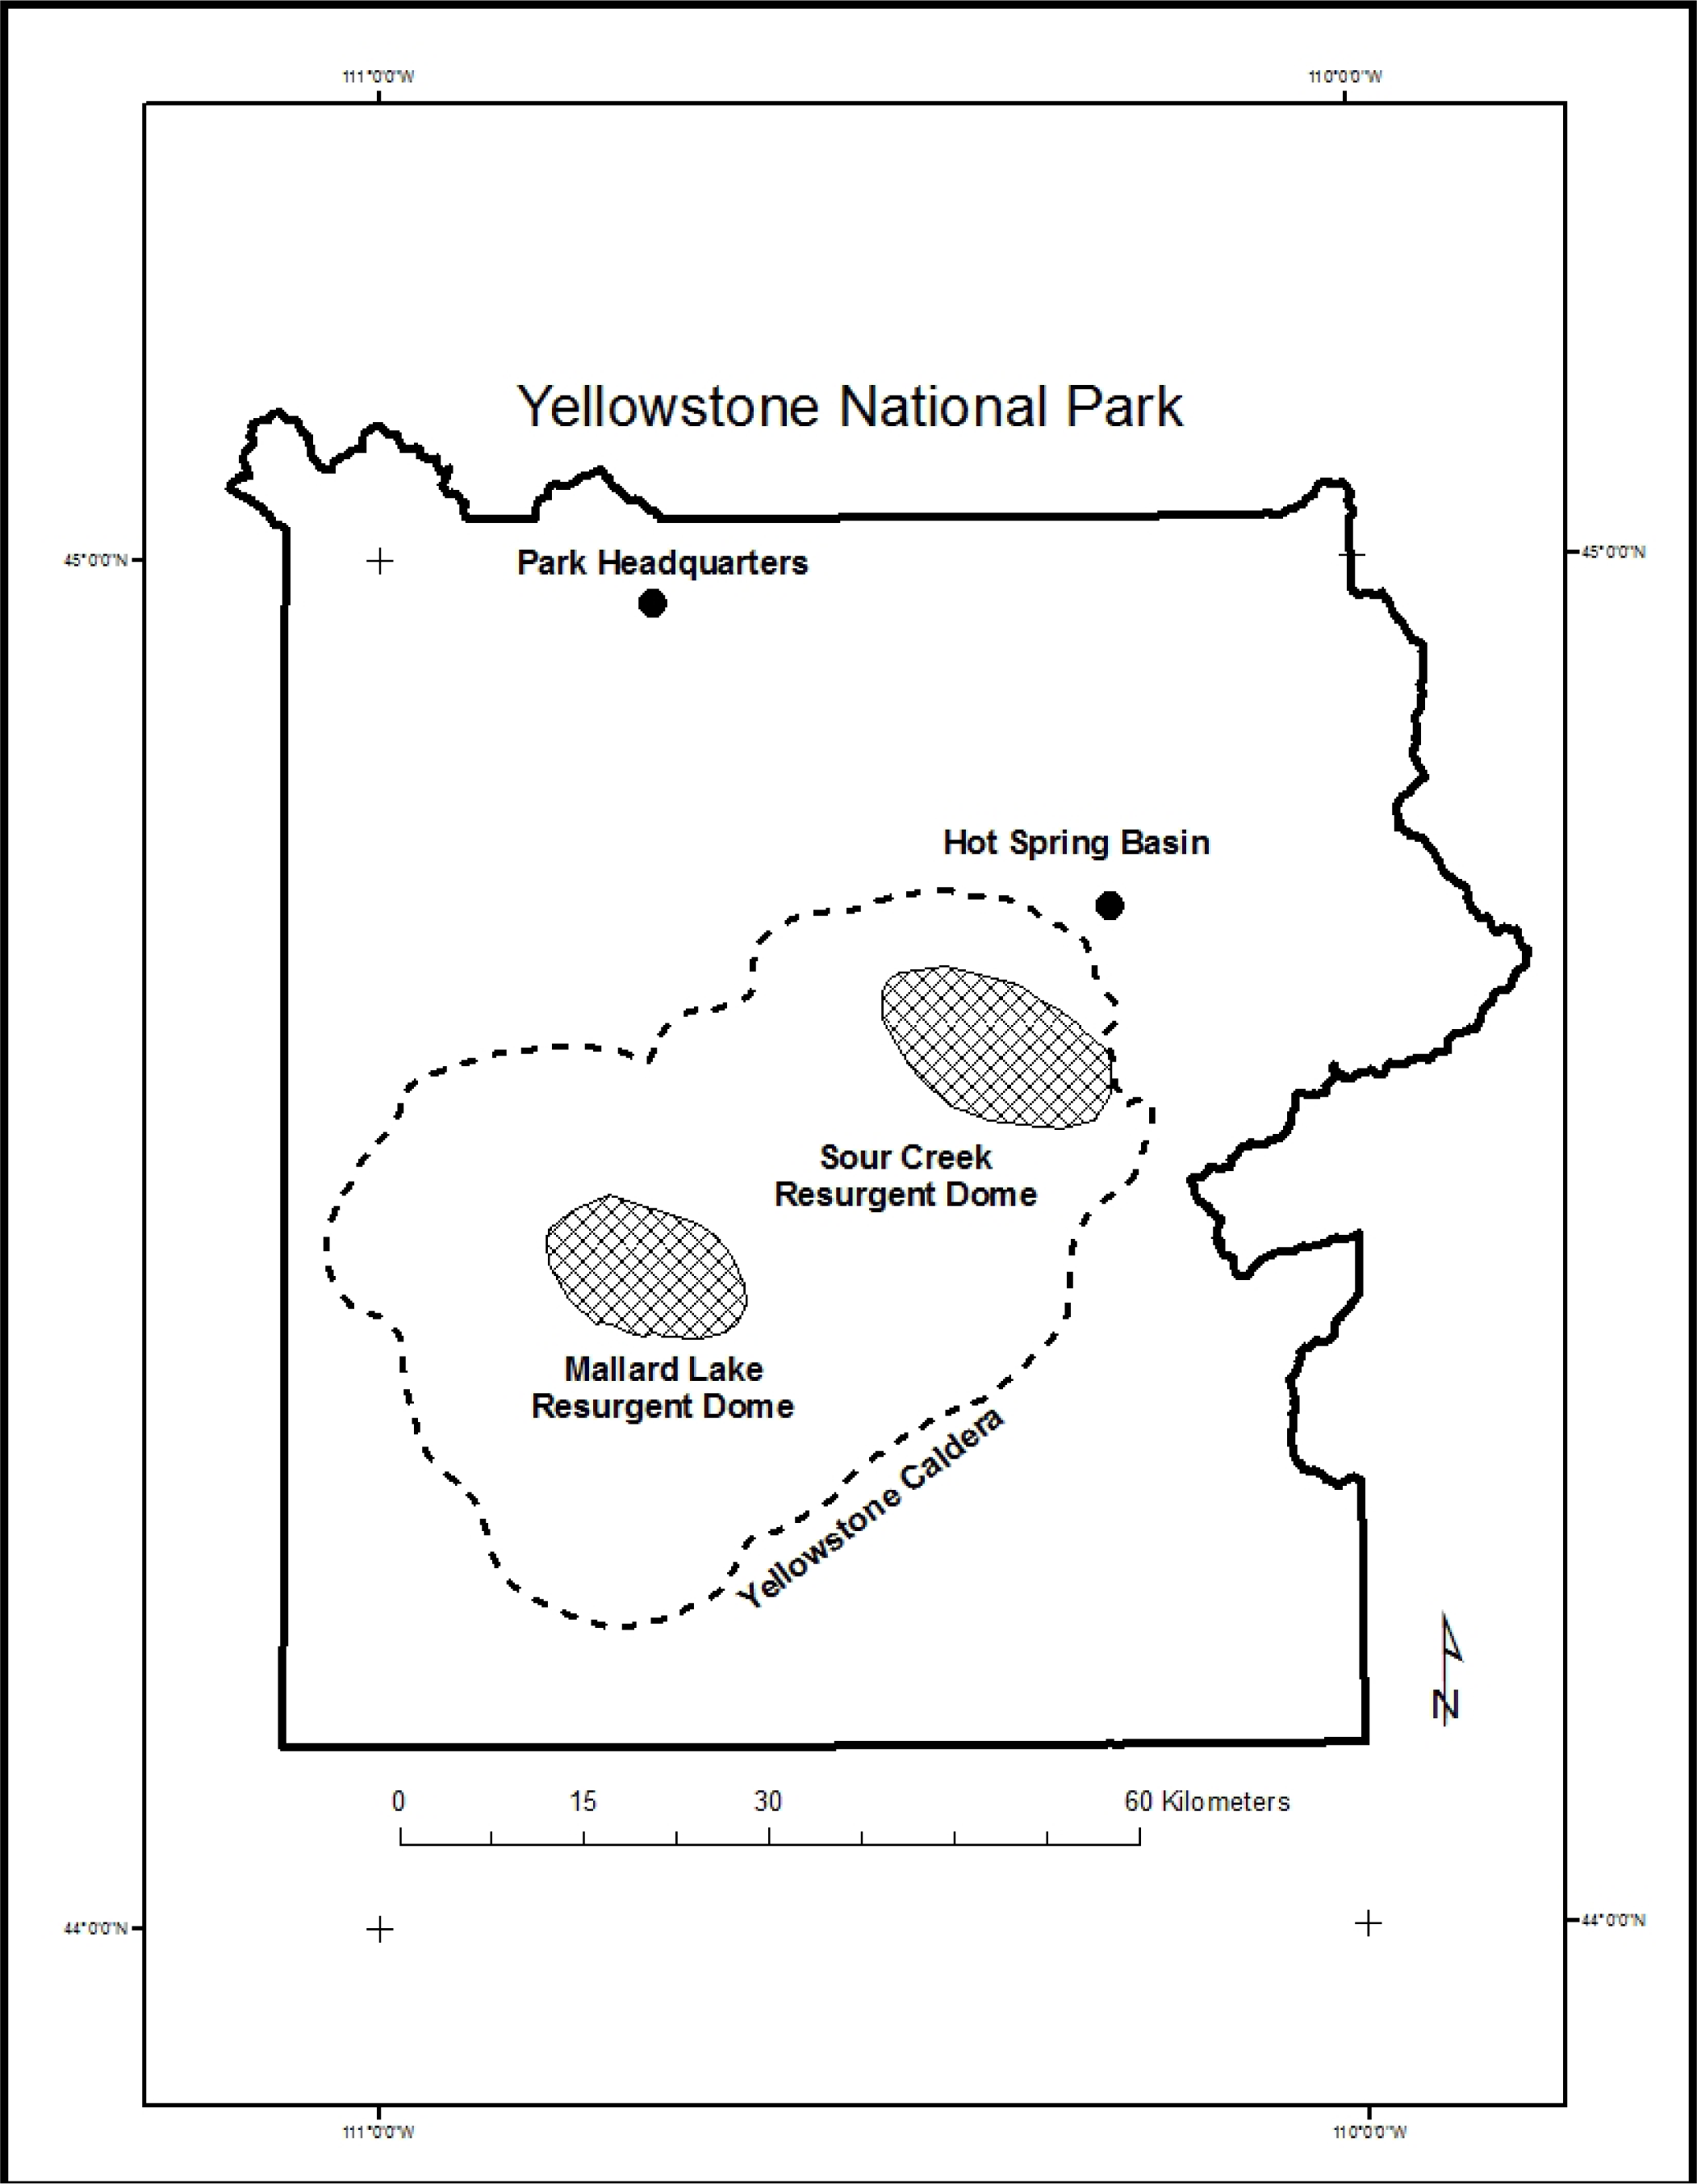
Figure 1), the Hot Spring Basin hydrothermal system is remote and suitable for monitoring with airborne thermal infrared imaging techniques. This hydrothermal system overlies the shallowest depth to partially molten magma within Yellowstone National Park and changes in this hydrothermal system could indicate changes in the entire magmatic system. As natural fractures in this hydrothermal system experience large amounts of variable strain associated with uplift and subsidence, changes in ground deformation also may affect fluid flow pathways. Thus, monitoring this system’s temporal and spatial variability can document how hydrothermal fluids move through this silicic, fracture-controlled terrain.
The remoteness of the Hot Spring Basin hydrothermal system presents challenges for documenting temporal and seasonal changes within the system. On the ground, deployment and retrieval of field equipment, means summer access and a full-day’s travel to camp a few miles from the inhospitable hydrothermal basin. During winter, ground access to this high-elevation area requires substantially more time and logistical support. Thus, airborne thermal infrared imaging provides an effective means for high-spatial resolution monitoring of this hard-to-access hydrothermal system.
Yellowstone National Park has been a test bed for various sensors, platforms and imaging techniques for various geologic applications [
1–
12]. The focus of these efforts involved geologic mapping [
4,
7–
9,
11,
13,
14], hydrothermal mixing of waters [
1], mineral mapping [
3,
5] and estimating Yellowstone’s radiative heat for the entire park or specific areas [
2,
6,
10,
12,
15]. The thermal infrared sensors covered two thermal infrared regions: 3–5 microns (μm) and 8–12 microns (μm). This paper applies the lessons learned from previous thermal infrared investigations to the Hot Spring Basin hydrothermal system.
2. Geographic and Geologic Setting
Within central Yellowstone National Park, tributaries of the Yellowstone River drain a high elevation area (∼2,500 m) north and east of the Sour Creek resurgent dome (
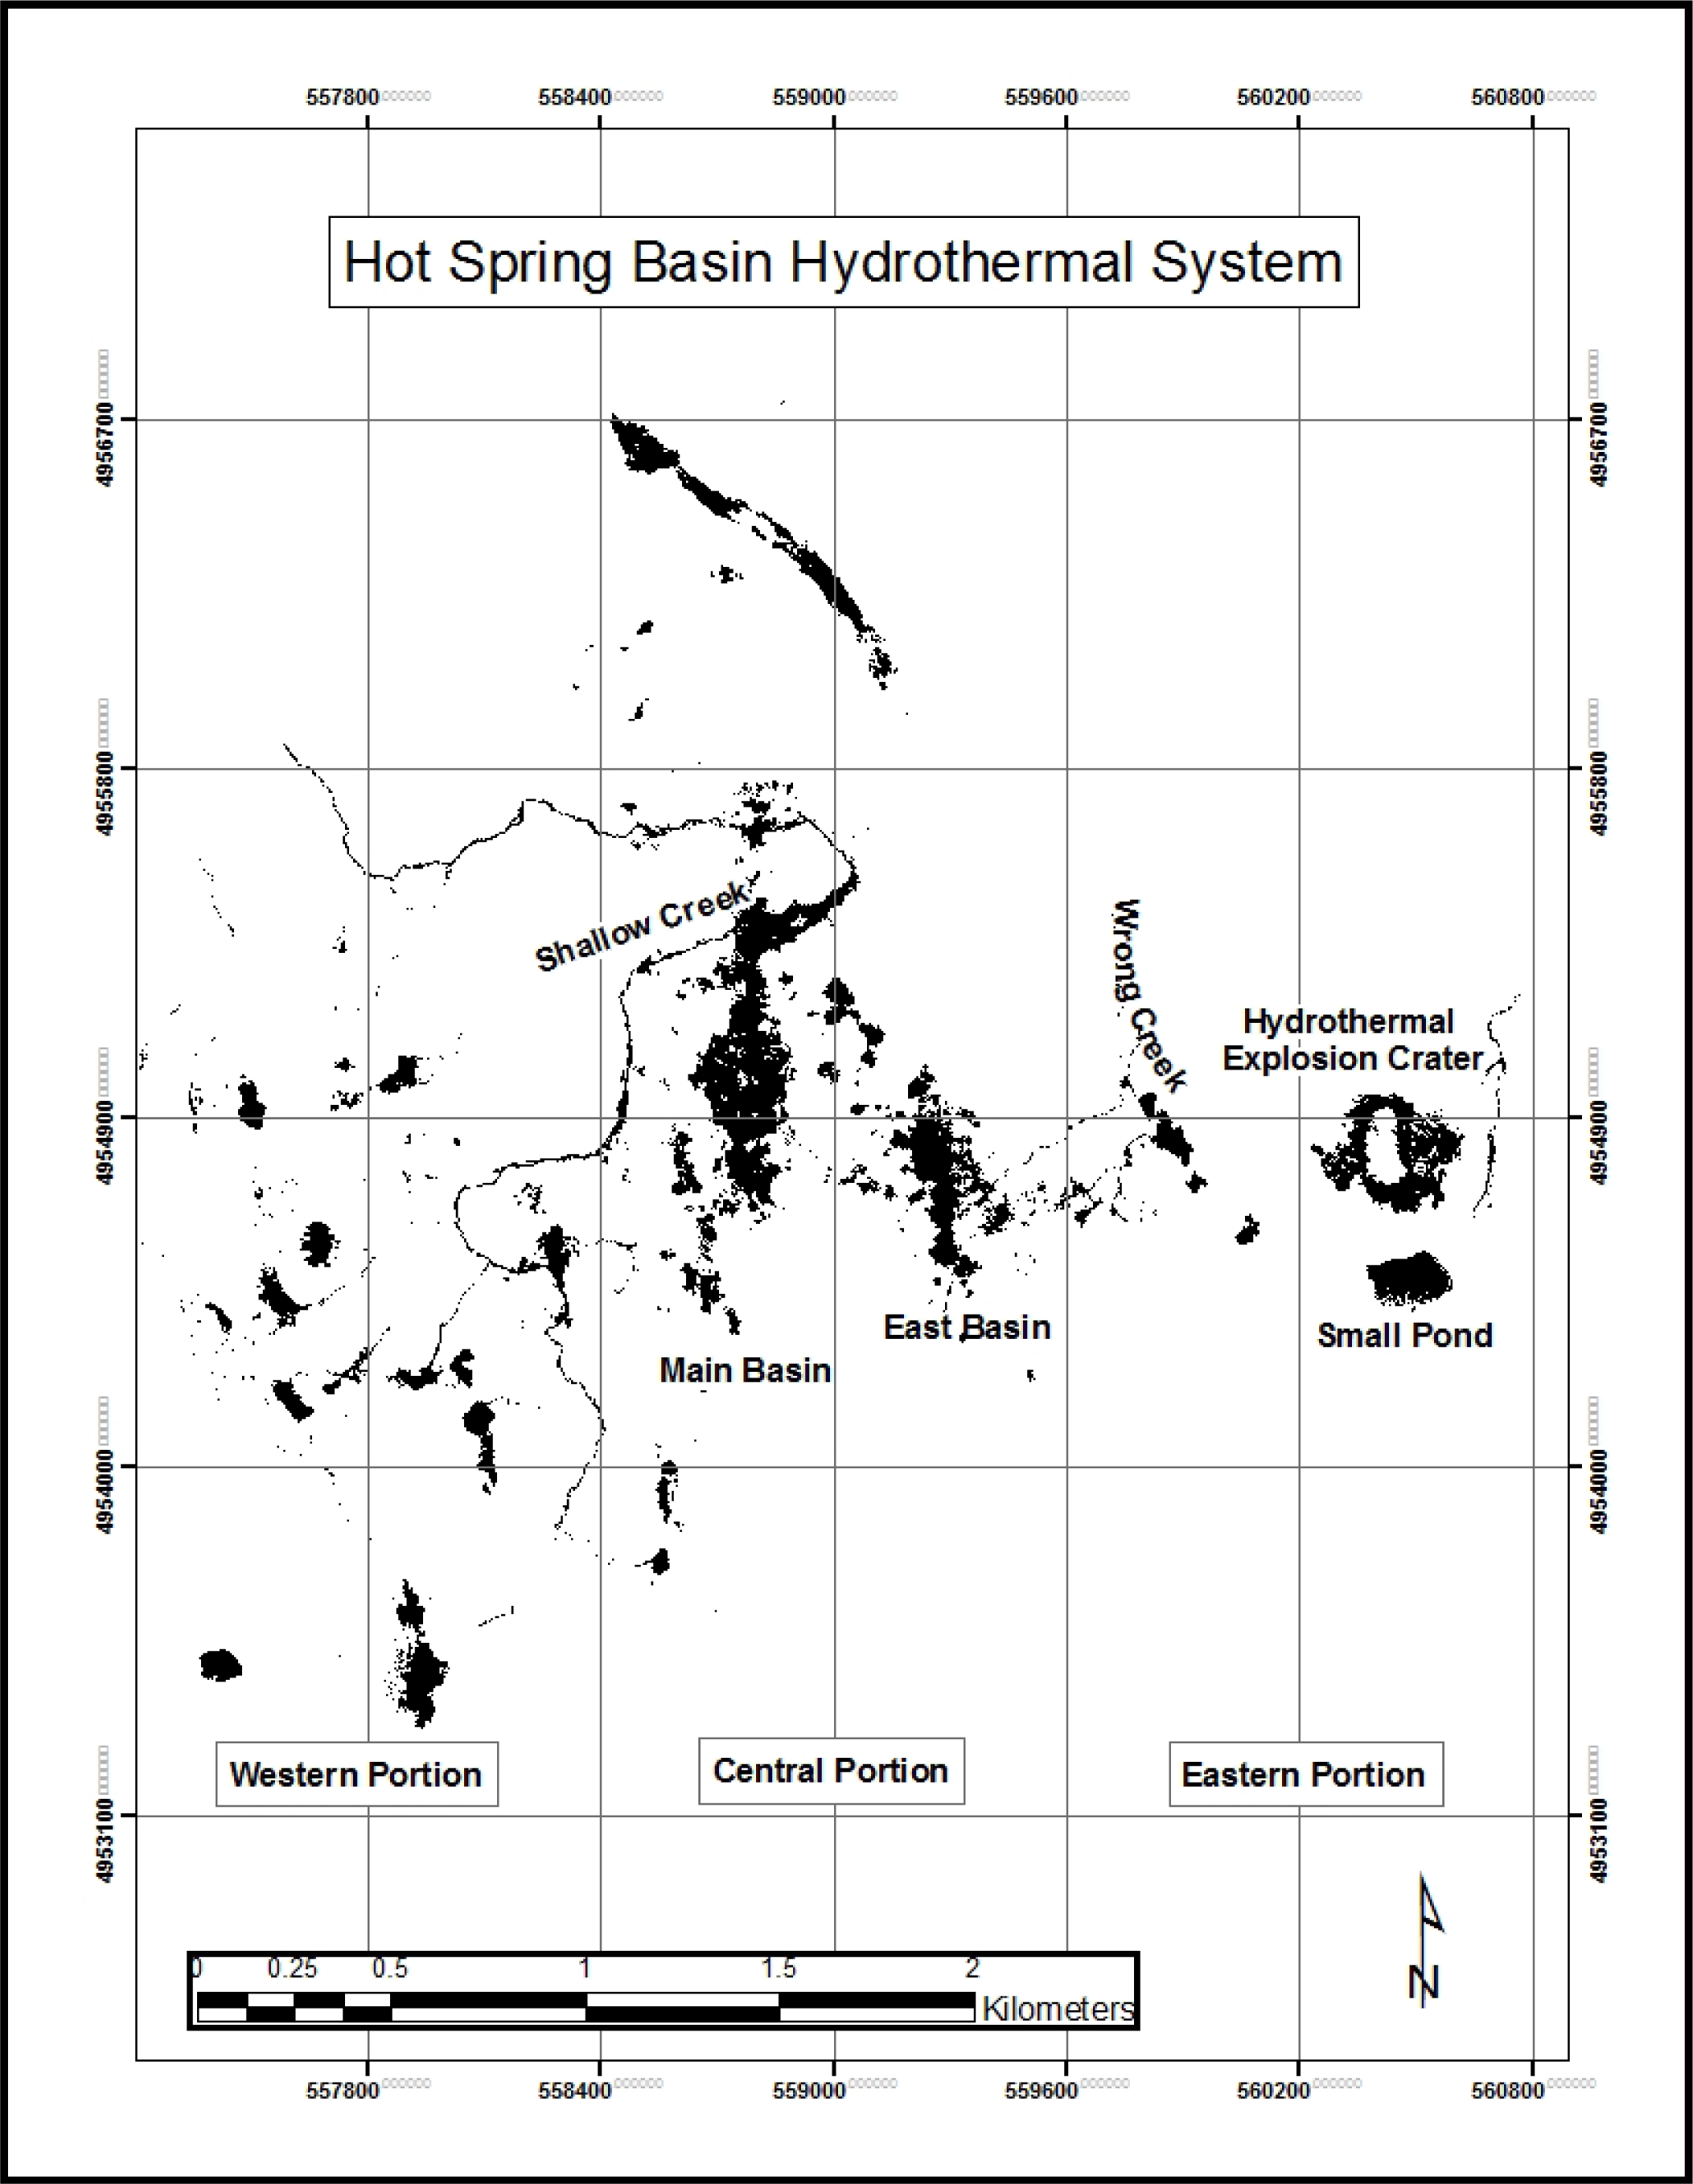
Figure 1). Broad Creek and its tributaries (Shallow Creek and Wrong Creek) flow around the faulted Sour Creek resurgent dome and through various hydrothermal systems, including Hot Spring Basin. For this paper, the Hot Spring Basin hydrothermal system is divided into three portions: the western portion, the eastern portion, and the central portion (
Figure 2). The western Hot Spring Basin hydrothermal system includes numerous small hydrothermal areas and uppermost Shallow Creek. The central Hot Spring Basin hydrothermal system includes two large north-south trending basins: a main basin with numerous fumaroles and Shallow Creek flowing through its northern section as well as a small basin with hydrothermal pools. A surface hydrologic divide occurs between the central Hot Spring Basin hydrothermal system and the eastern Hot Spring Basin hydrothermal system. The eastern Hot Spring Basin hydrothermal system includes a hydrothermal explosion crater, some hydrothermal pools, a small pond and the uppermost reaches of Wrong Creek.
A low-velocity, upper-mantle body or plume is the conduit for an ascending melt associated with the Yellowstone hotspot [
16]. The plume’s buoyancy produces a ∼400-km wide and ∼500 m topographic high centered on the Yellowstone Plateau. Specifically, DeNosaquo and others [
17] imaged a shallow, large density anomaly underneath the Hot Spring Basin hydrothermal system. Heat from this upper mantle source drives shallow convection and ultimately finds its way to the Earth’s surface at Hot Spring Basin.
At Hot Spring Basin, heat, water, and gases flow through an extensive network of fractured volcanic rocks and various Quaternary sediments outside the 640,000 year Yellowstone Caldera. Faulted and fractured, hydrothermally altered 640,000 Lava Creek Tuff (
Figure 3) crops out within Hot Spring Basin [
18–
21]. The best exposure of Lava Creek Tuff occurs within the hydrothermal explosion crater (Qhe in
Figure 3) in the eastern portion of the hydrothermal system. Faults and fractures (NNW to NW, N-S, NE and ∼E-W) traverse the Hot Spring Basin hydrothermal system and provide fracture permeability for gases [
13]. Werner and others [
22] quantified the magmatic, volatile emissions (CO
2, He, H
2, Ch
4, and H
2S) from this large acid-sulfate area and vapor-dominated hydrothermal system. They estimate a total, diffuse CO
2 emission of 410 ± 140 t·d
−1 from Hot Spring Basin.
At least three glaciations affected the high-elevation Yellowstone Plateau and the Hot Spring Basin area. Pierce and others [
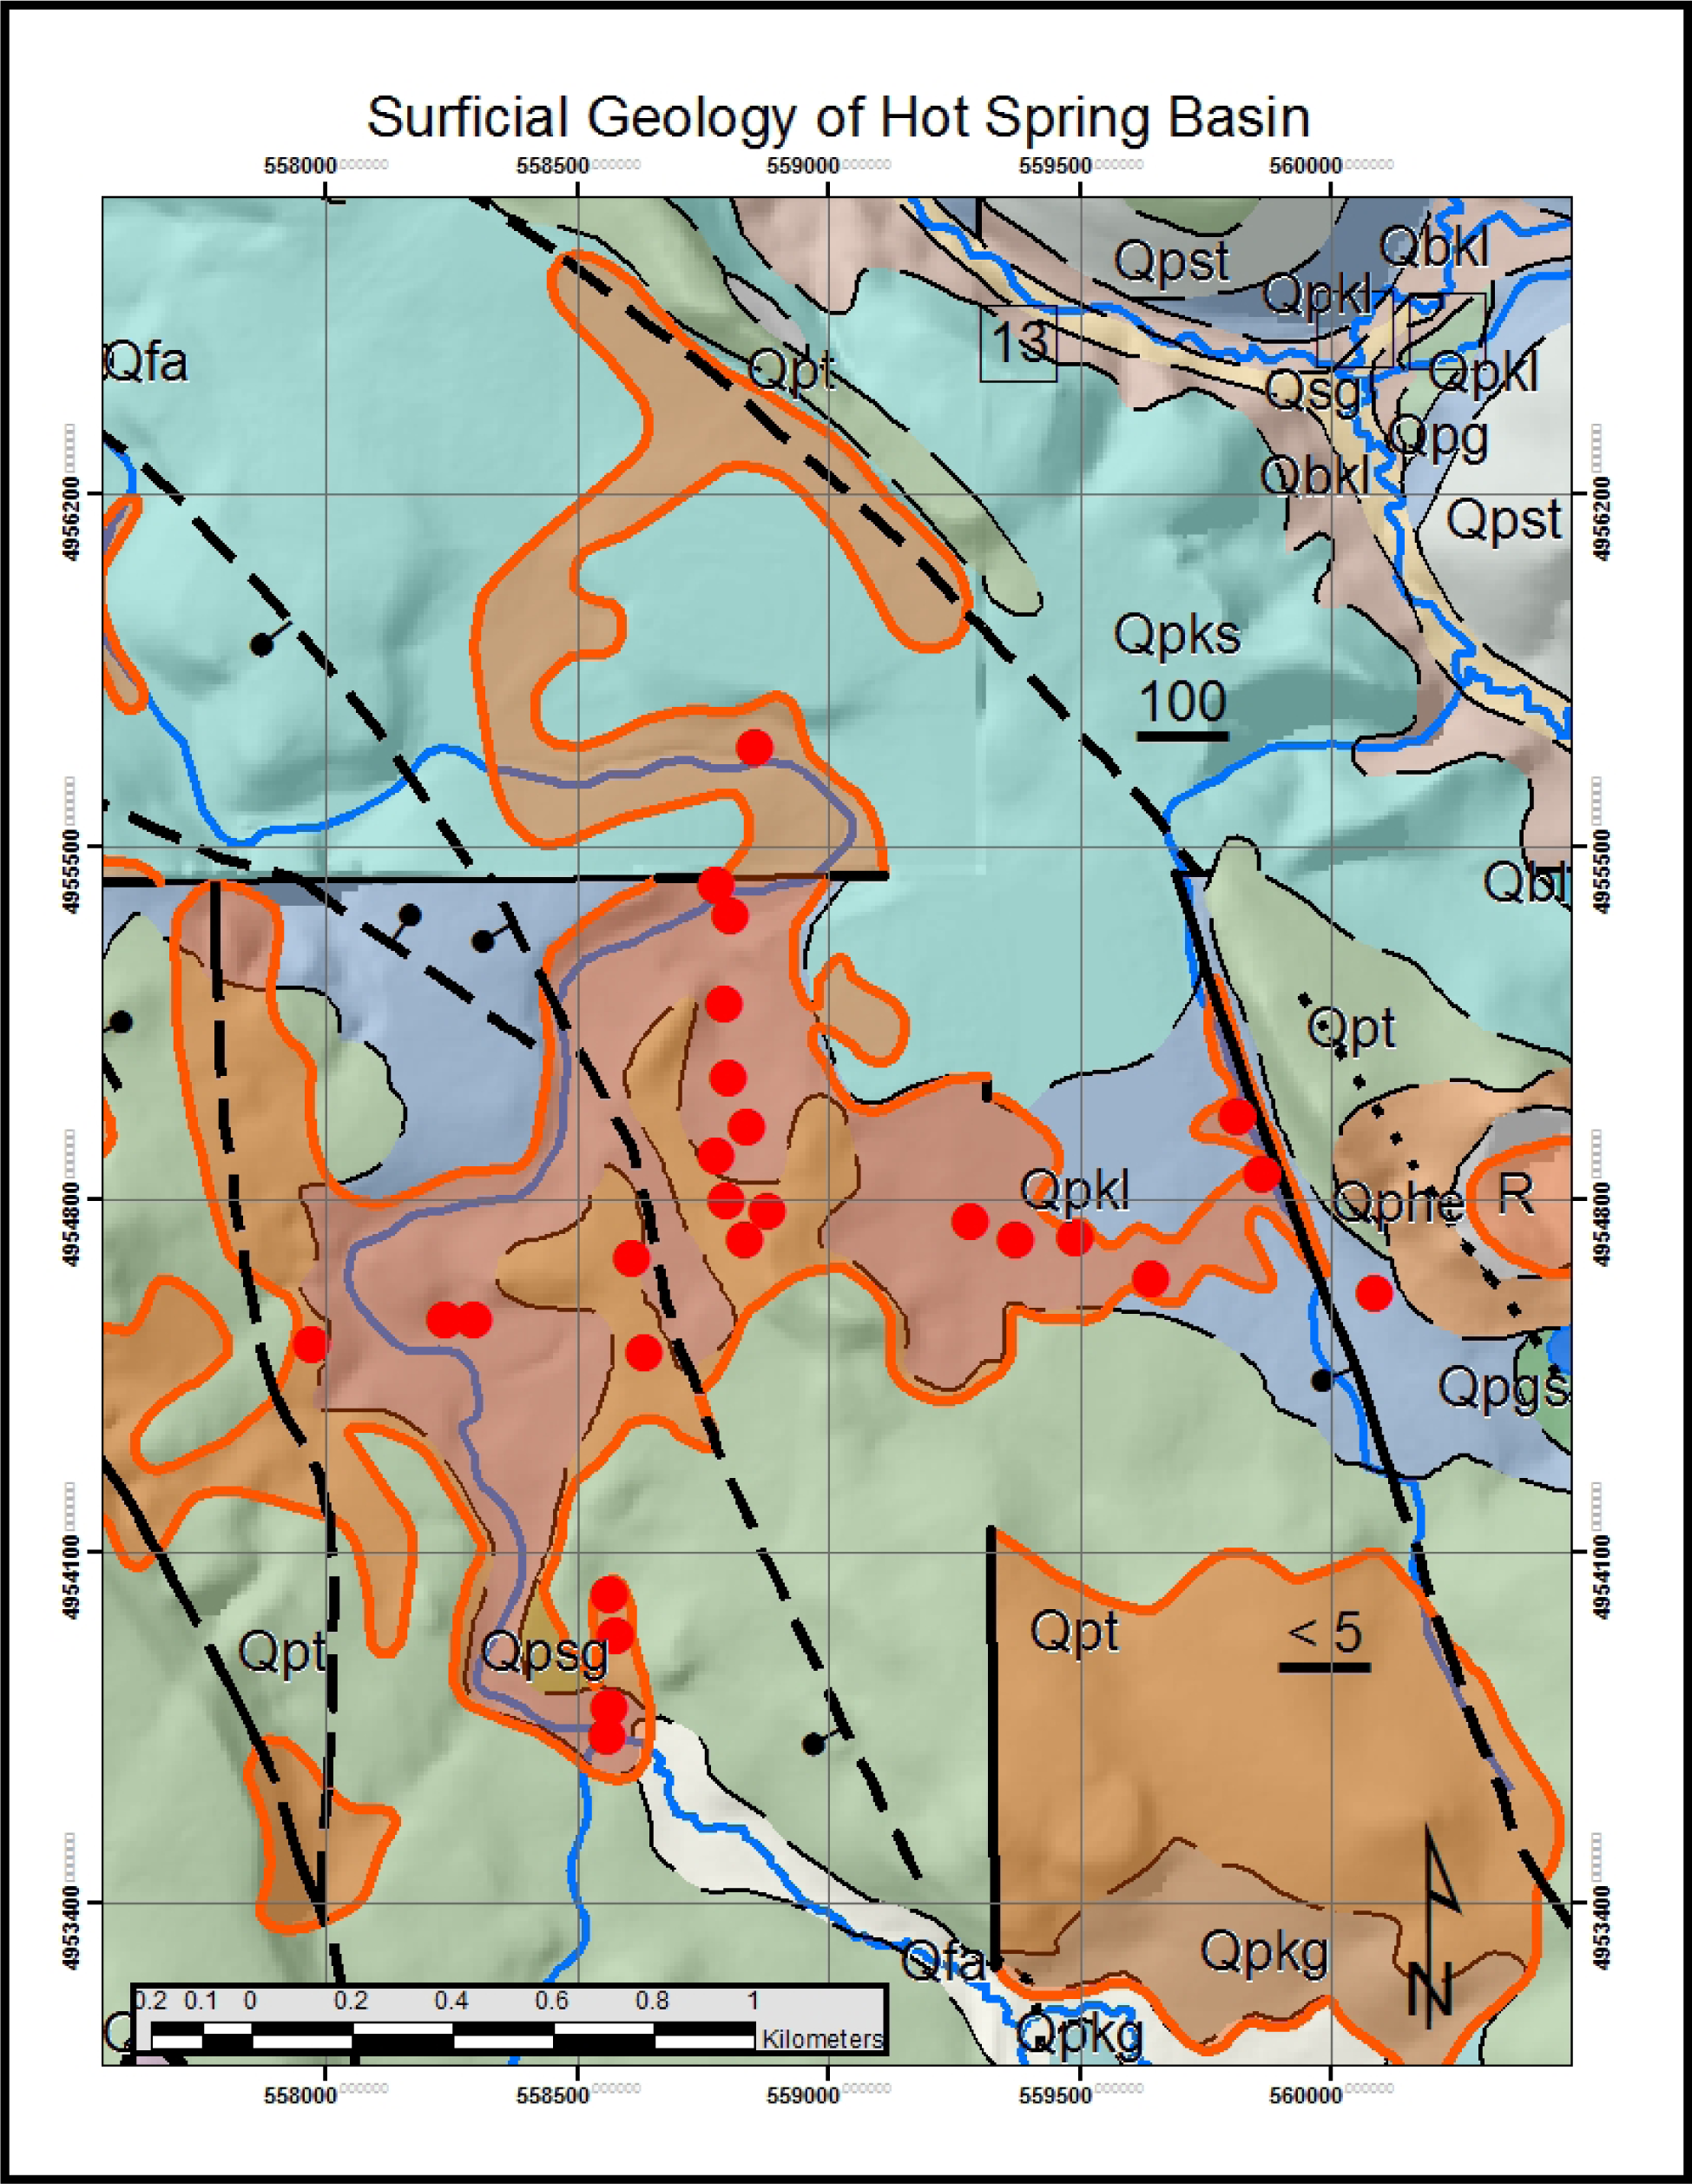
23] recognize the following glaciations of the Yellowstone Plateau since ∼150,000 years ago: (1) the Bull Lake glaciation associated with Marine Isotope Stage 6 (190–130 ka; MIS 6), (2) a MIS 4 glaciation (∼79–69 ka), and (3) the Pinedale glaciation (16–19 ka Yellowstone maximum; MIS 2). Within Hot Spring Basin, various glacial sediments (
Figure 4) cover the faulted and fractured bedrock [
24–
26]: late Pinedale ice-contact deposits (Qpkl, Qpks, Qpkg), late Pinedale till (Qpt, Qpst), older glacial deposits (Qbkl, Qbl, Qbr), late Pinedale hydrothermal explosion breccia (Qphe), and Holocene sediments (Qfa). Within Hot Spring Basin, compacted and undated brown muds could be early Pinedale (MIS 2) or the MIS 4 glaciation rather than the Bull Lake glaciation (MIS 6). During the downwasting of the Pinedale-age Yellowstone Ice Cap, ice-contact sediment covered older glacial deposits and melt waters flowed towards the Grand Canyon of the Yellowstone River. It is noteworthy that the active hydrothermal system altered the various glacial sediments.
3. Environmental Conditions
3.1. Weather
Weather at the time of airborne image acquisition (
Table 1) and prior to acquisition affects the quality of the night-time, thermal infrared imagery and could limit its usefulness. The mid-to-late September image acquisitions (2007–2011) should provide the best thermal infrared imagery for the entire hydrothermal system because of cool nights, decreasing solar input, and minimal ground cooling due to precipitation. The March 2012 image acquisition provided an estimate of seasonal variation between the Fall and Spring image acquisitions. Additionally, image acquisitions close to midnight should provide imagery with minimal hydrothermal fog over pools and individual hydrothermal features. Atmospheric data (air temperature, relative humidity, solar input, and dew point) from the Yellowstone National Park (YNP) meteorological station at Lake (YELL-WT;
http://ard-request.air-resource.com) provide an estimate of weather preceding the flights and at the time of image acquisition.
2007
Weather prior to the 2007 image acquisition over Hot Spring Basin was optimal. On 9 September 2007, a cool front passed through the area. Reduced maximum solar radiation (∼500 W/m2), precipitation and cool night-time temperatures cooled the ground and reduced smoke from forest fires. On 10 September 2007, as the clouds cleared there was radiative cooling of the ground associated with below zero Celsius air temperatures. The three days preceding the image acquisition (10–12 September 2007) provided substantial solar radiation (∼800 W/m2) and cool nights. At the time of image acquisition, the YNP Lake meteorological station recorded the following atmospheric conditions: relative humidity ranged from 47 to 54%; air temperature ranged from 9.9 to 8.4 °C; and the dew point ranged from 0.9 to 0.6 °C.
2008
The 2008 image acquisition over Hot Spring Basin occurred approximately at the same time as the previous year. Similar to the 2007 acquisition, a cool front passed through Yellowstone prior to the date of image acquisition on 12 September 2008. The YNP meteorological station at Lake recorded reduced solar radiation (564 W/m2) on 10 September 2008. On 11 and 12 September 2008, the maximum solar radiation varied between 859 W/m2 and approximately 800 W/m2 near noon. At the YNP Lake meteorological station, no precipitation occurred on either date. At the time of the flight, relative humidity was 43–44 % and the air temperature varied from 7.3 to 7.7 °C. During acquisition, dew point varied from 1.1 to 1.9 °C at the YNP Lake meteorological station.
2009
The 2009 image acquisition over Hot Spring Basin occurred a few days earlier in September than during 2007 or 2008 (
Table 1). At the time of acquisition, air temperature varied from 9.2 to 8.3 °C, relative humidity was approximately 65%, and dew point temperature was 1.6 °C. On the nights of 8 and 9 September 2009, the night-time temperatures were close to 0 °C. The YNP meteorological station recorded a trace of precipitation (0.5 mm) on 6 and 7 September. From 7 September through 9 September, solar radiation approximately was 800 W/m
2.
2010
The 2010 image acquisition over Hot Spring Basin occurred during late September rather than early September. Before the flight on 25 September 2010, some precipitation (2.2 mm) occurred on 14–15 September 2010, and a trace (0.1 mm) occurred on 22 September 2010. Immediately preceding the night-time image acquisition, the YNP meteorological station recorded a maximum solar radiation value of 796 W/m2 at noon. During image acquisition, the YNP Lake meteorological station recorded the following atmospheric conditions: from 23:00 hours on 25 September 2010 to midnight air temperature varied from 9.9 °C to 8.8 °C; a dew point temperature of 1.4 °C, and 49–54% relative humidity.
2011
Similar to previous years, the 2011 image acquisition over Hot Spring Basin occurred during early September. Sunny, clear days and no precipitation for the week preceding the flight characterize the weather before the 8 September 2011, nighttime image acquisition. On 7 September 2011, the YNP Lake meteorological station recorded a maximum value of 785 W/m2 solar radiation at 11:00 a.m. Similar high values of maximum solar radiation occurred prior to 7 September 2011. At the time of the flight, the YNP meteorological station recorded the following atmospheric conditions: relative humidity from 75–81% and air temperature from 6.9 to 7.2 °C.
2012
Cloudy days in early March 2012 (March 1–4) reduced solar radiation at the YNP Lake meteorological station. Prior to the Spring 2012 image acquisition, the maximum solar radiation varied from 109 W/m
2 on 3 March 2012, to 540 W/m
2 on 6 March 2012. Immediately preceding the night-time flight, the YNP Lake meteorological station recorded a maximum solar radiation value of 730 W/m
2 (solar noon) on 8 March 2012. The same meteorological station recorded precipitation events on 1–3 March 2012, and the early morning of 6 March 2012. Around flight time, the YNP Lake meteorological station recorded the following atmospheric conditions: 39% Relative humidity and an air temperature of −2.6 °C. A summary of the weather conditions for 2007–2012 (
Table 2) illustrates parameters for reasonable night-time thermal infrared image acquisitions.
3.2. Fires
During September, forest fires produce smoke and introduce particles into Yellowstone’s atmosphere. Usually, cool weather and snow finally allow Yellowstone National Park resource managers to declare that the fires are “out” in October. At the time of the 2007–2011 Fall image acquisitions, fires were burning within Yellowstone National Park (
Table 3) and did introduce particulates into the atmosphere. In contrast, there were no fires burning in the snow-covered Yellowstone National Park during the Spring 2012 image acquisition.
3.3. Methods
The Utah State University airborne imaging system acquires both daytime, visible imagery (green: 0.545–0.560 μm; red: 0.665–0.680 μm; and NIR: 0.795–0.809 μm) and night-time thermal infrared imagery (8–12 μm). A current, high-spatial resolution visible image (∼1 m) proved critical to monitoring these hydrothermal systems and ultimately documenting the natural variability of the hydrothermal system. A summary of the image acquisition and image processing follows.
3.3.1. Image Acquisition
A reliable, time-series of baseline imagery for Hot Spring Basin now exists. Between 2007 and 2009, USU airborne multispectral digital system used three Kodak Megaplus 4.2i Digital Cameras with the imaging sensor to generate a high-spatial resolution, daytime image with 2,000 × 2,000 pixels and covering a 2 × 2 km area [
27]. Since 2007, a FLIR SC640 or SC660 thermocam acquired nighttime, thermal infrared (TIR) images (640 × 480 pixels) over Hot Spring Basin [
6,
28]. The concurrently acquired daytime, visible imagery provides a base image and an emissivity correction for night-time temperatures. The following section highlights the emissivity correction and other image processing techniques.
3.3.2. Image Processing
Image processing of the acquired visible and nighttime thermal infrared images involves the following corrections: lens vignetting, lens radial distortion, georectification using an orthophotoimage, calibration to a reflectance standard, and generation of a mosaic [
6,
28]. Rectification of night-time airborne imagery required the generation of a reliable, visible mosaic. In 2012, recalibration of the 2007–2011 thermal infrared image acquisitions resulted in a new consistent data set for analyses. Correcting for atmosphere using nearby radiosonde data (Great Falls, Montana) in the MODTRAN radiative transfer model [
29] and surface emissivity by applying a Normalized Difference Vegetation Index (NDVI) technique Brunsell and Gilles [
30] generated a night-time thermal infrared mosaics of Hot Spring Basin that show the temporal variations of its hydrothermal system.
Accounting for standing water required additional processing. An ERDAS Imagine model assigned an emissivity of 0.985 to clear water surfaces present (mostly lakes and hot pools) in a classified 3-band image and extracted a water body mask layer. Finally, another ERDAS Imagine model used the emissivity layer and the at-aircraft temperature image corrected using the MODTRAN model to obtain the corrected at-surface temperature image. In general, these corrections for atmospheric effects and emissivity increased the values of the at-aircraft temperatures by several degrees.
3.3.3. Visualization of the Hydrothermal System
After image acquisition and processing, scientific visualizations of night-time, thermal infrared mosaics enabled an assessment of data quality and applicability for geologic analyses. Generation of scientific visualizations involved the use of image processing (ENVI and ERDAS) and geographic information systems software (ArcGIS) to produce easily interpreted maps of the hydrothermal system. Applying a density slice algorithm to the calibrated and corrected temperature mosaics, ENVI yielded temperature slices of the hydrothermal system for analysis and export to ArcGIS. Within ArcGIS, the temperature slices, visible imagery and topographic information produced scientific visualizations for presentations and this publication. Integration of geologic information, topographic information and night-time thermal infrared imagery ultimately yielded an improved understanding of the Hot Spring Basin hydrothermal system.
4. Results
Temporal and Seasonal Variations in the Hot Spring Basin Hydrothermal System
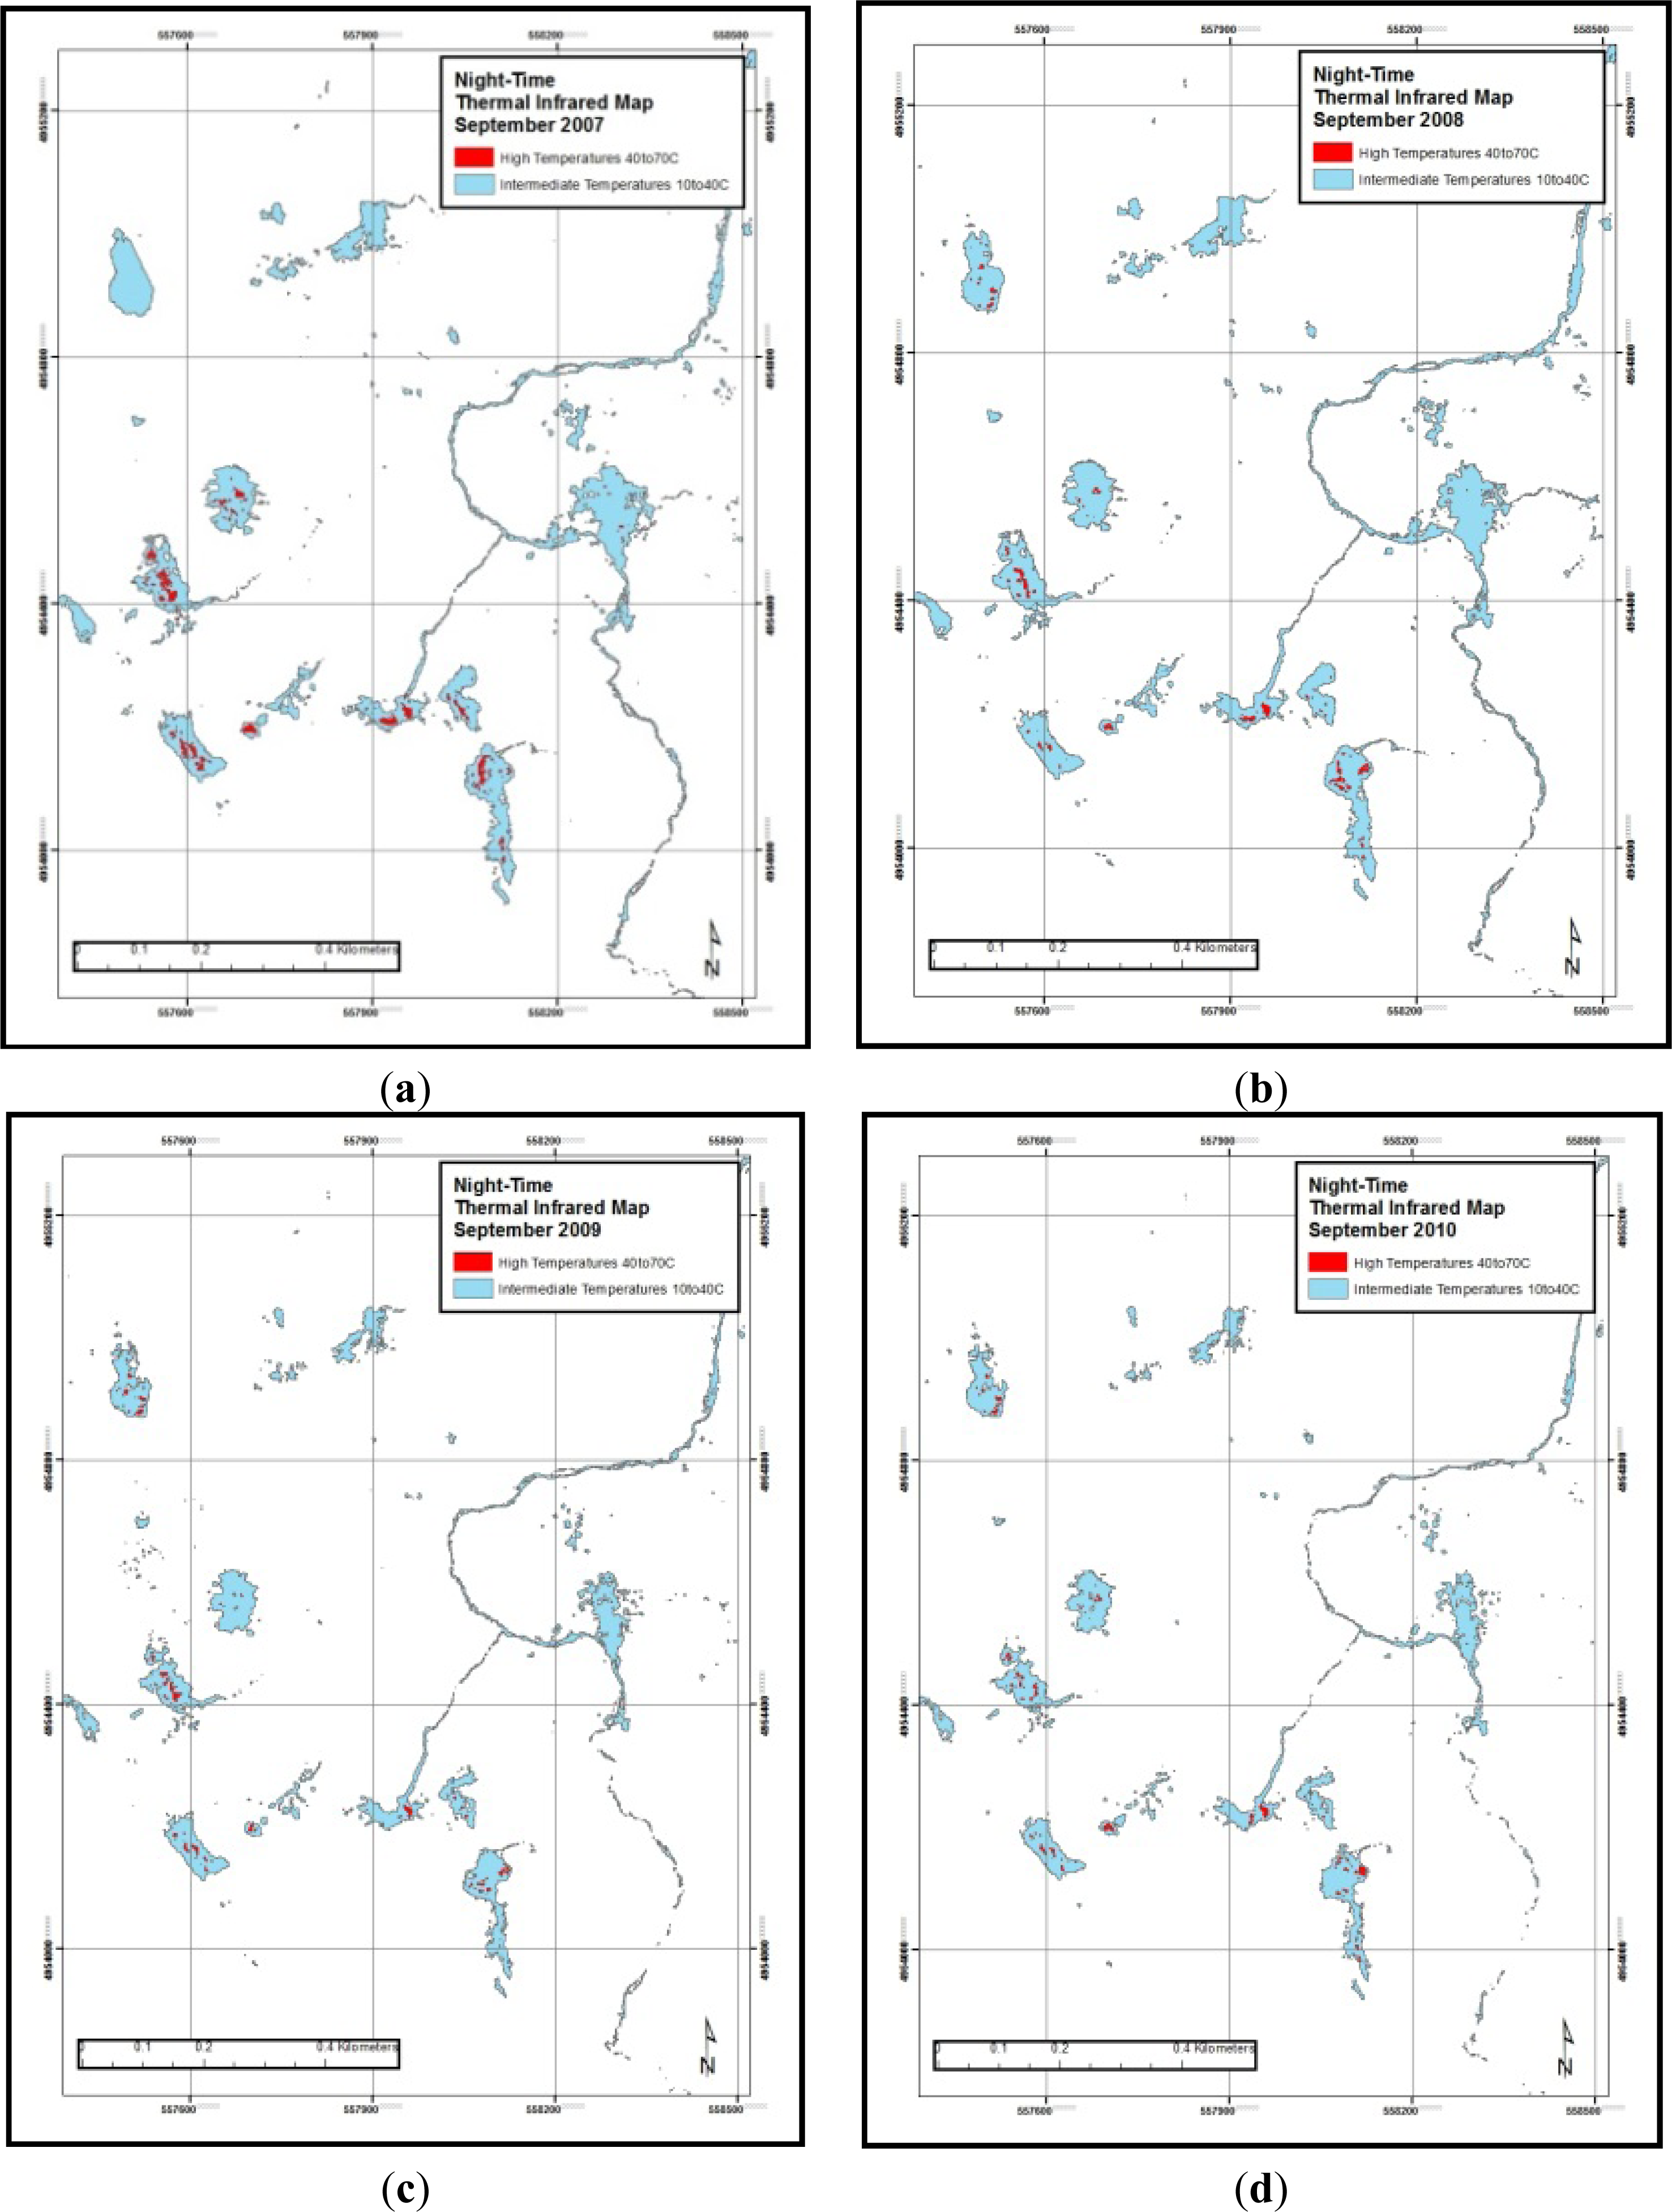
Analysis of the intermediate temperature and high temperature components of the central Hot Spring Basin hydrothermal system yields interesting variations between September 2007 and September 2011 (
Figures 5 and
8), as well as March 2012 (
Table 4,
Figure 9). Between 2007 and 2012, the approximate area of high temperatures (>40 °C) varies from 2,800 to 18,800 m
2. Over the same period of time, the approximate area of intermediate temperatures varies from 144,600 to 513,300 m
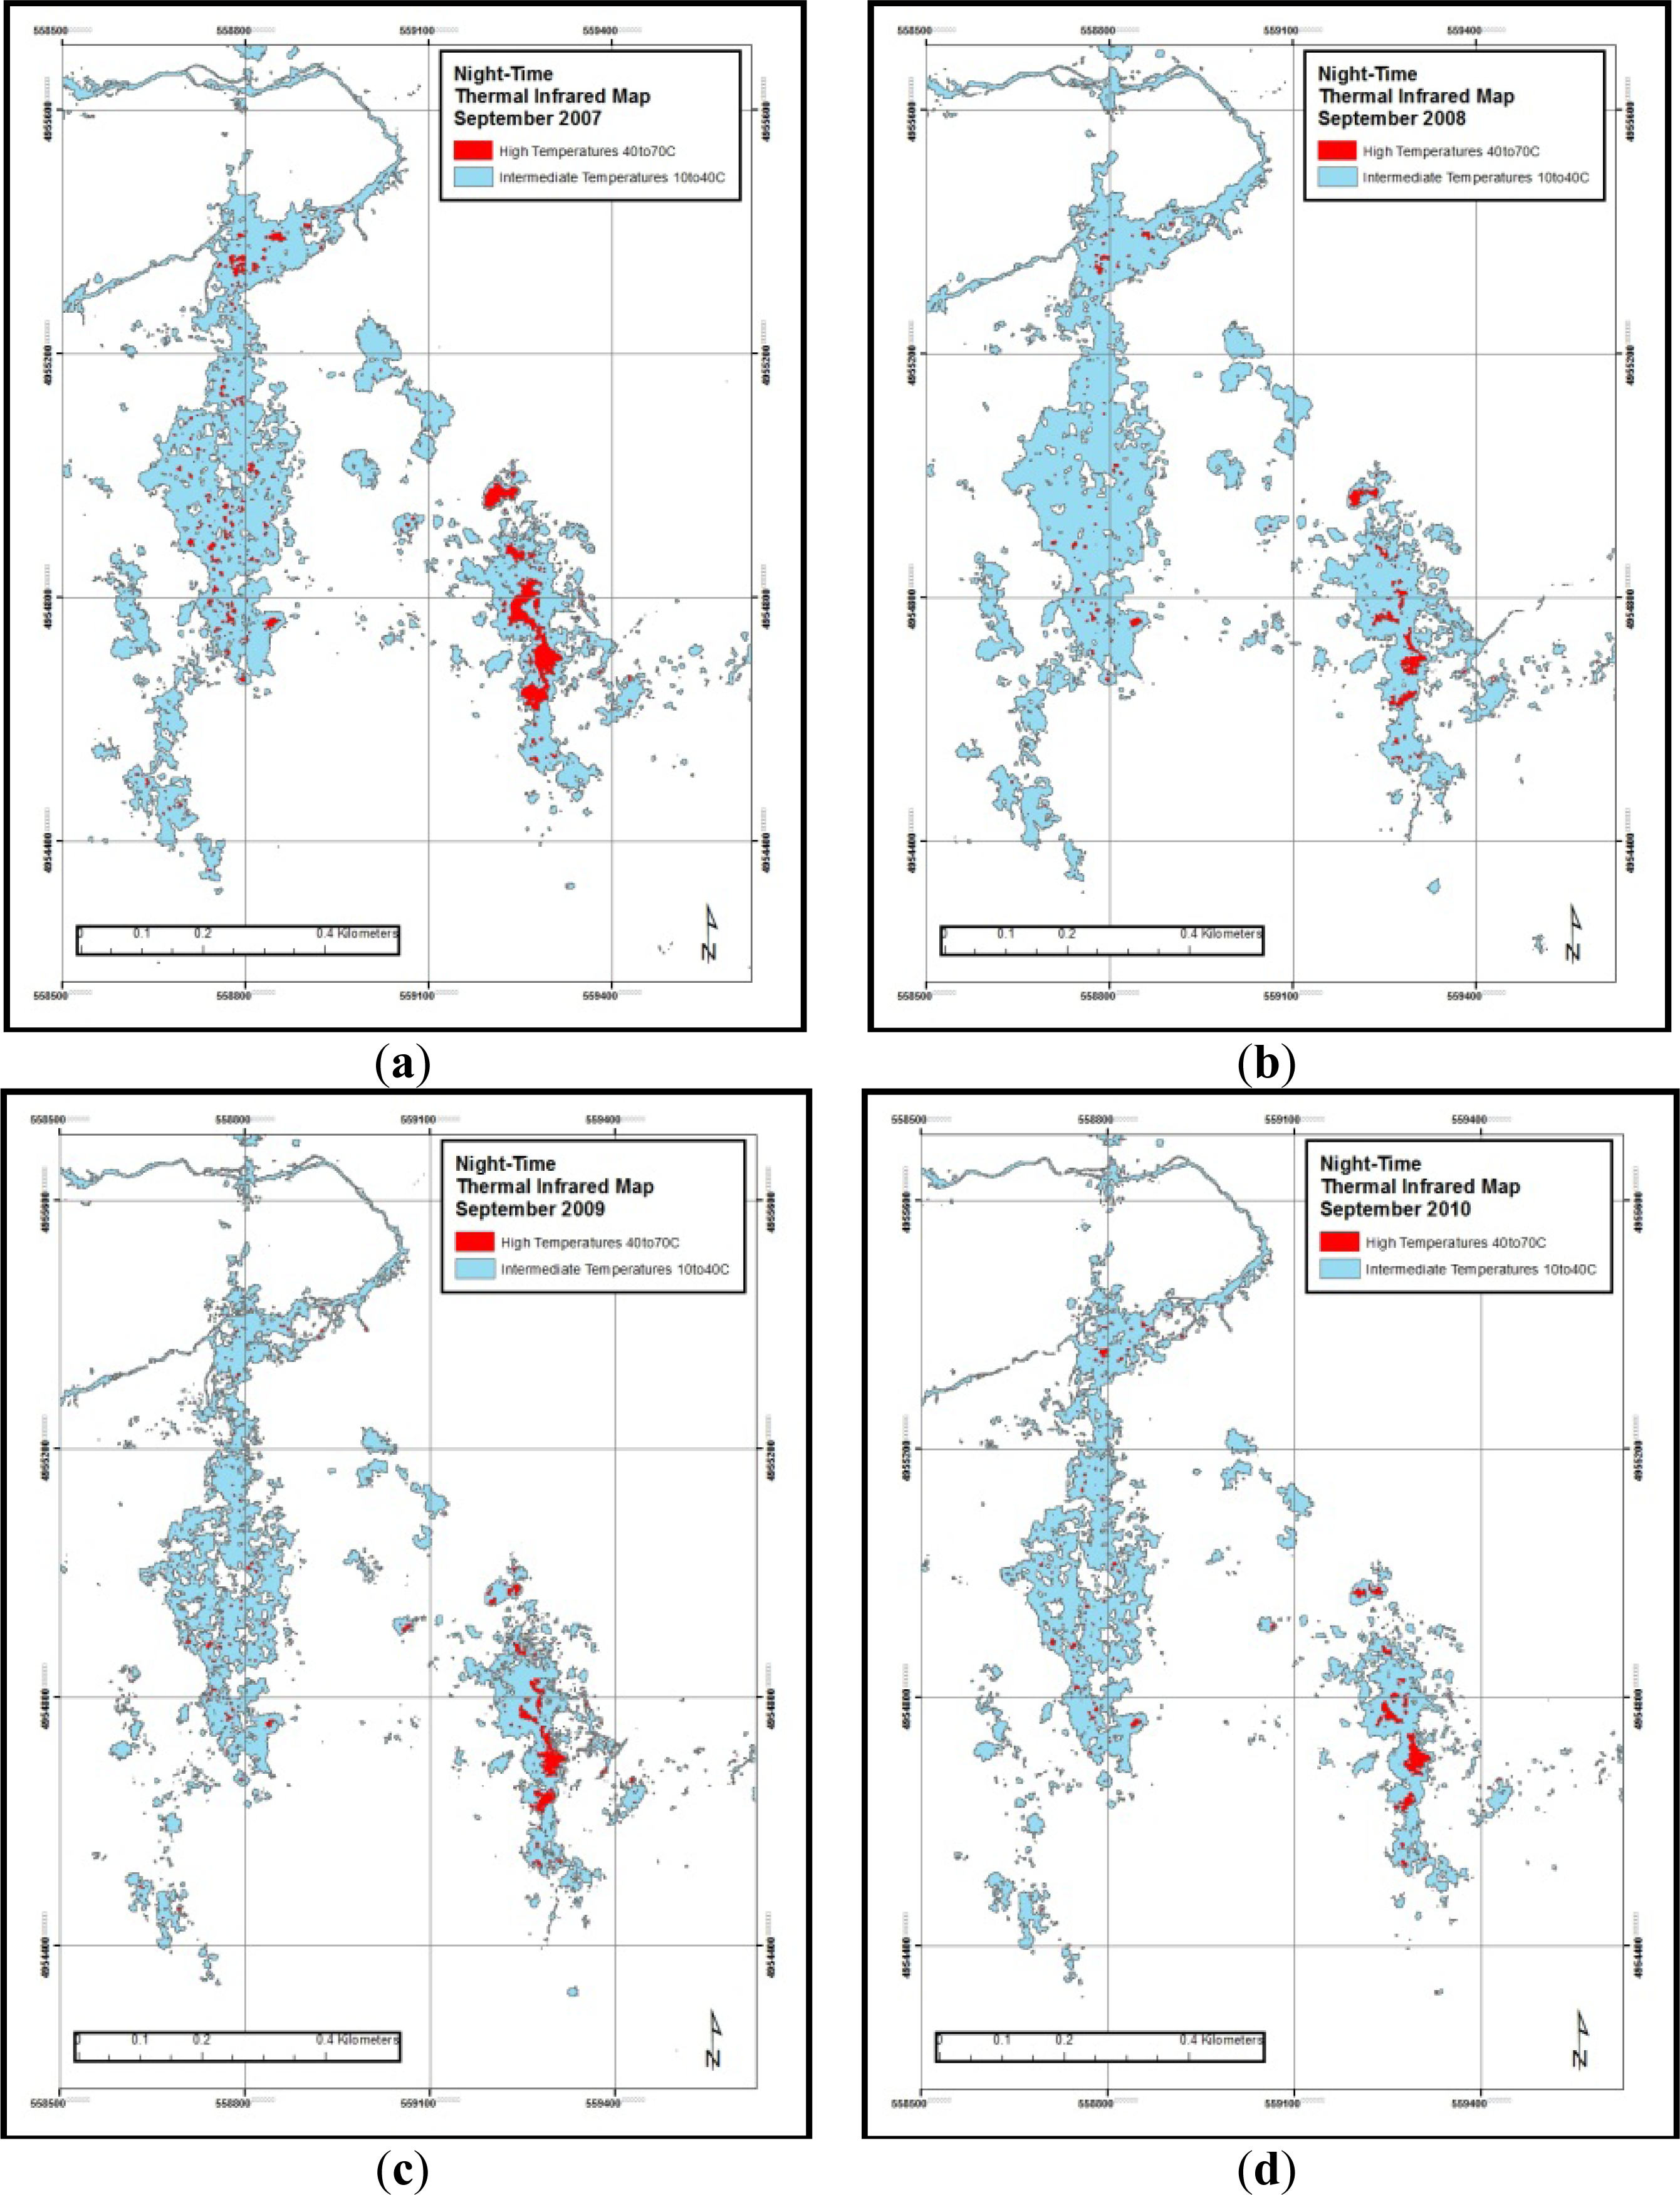
2. Not surprisingly, the smallest areas of intermediate temperatures (<40 °C) and high temperatures (>40 °C) occurred during March 2012. The Hot Spring Basin imagery with the largest areas of intermediate temperatures occurred during the Fall acquisitions of 2010 and 2011.
The central Hot Spring Basin hydrothermal system with its north-south trending hydrothermal basins (
Figure 5a–d) shows interesting changes between 2007 and 2010. In 2007, numerous areas (
Figure 5a) with temperatures greater than 40 °C are apparent. In contrast, subsequent maps of the hydrothermal system (
Figures 5b through
5d,
Figure 8) show less area with temperatures greater than 40 °C from 2008 through 2011 (
Table 4). Within the central Hot Spring Basin hydrothermal system, the east basin shows a similar decrease in areas with temperatures greater than 40 °C.
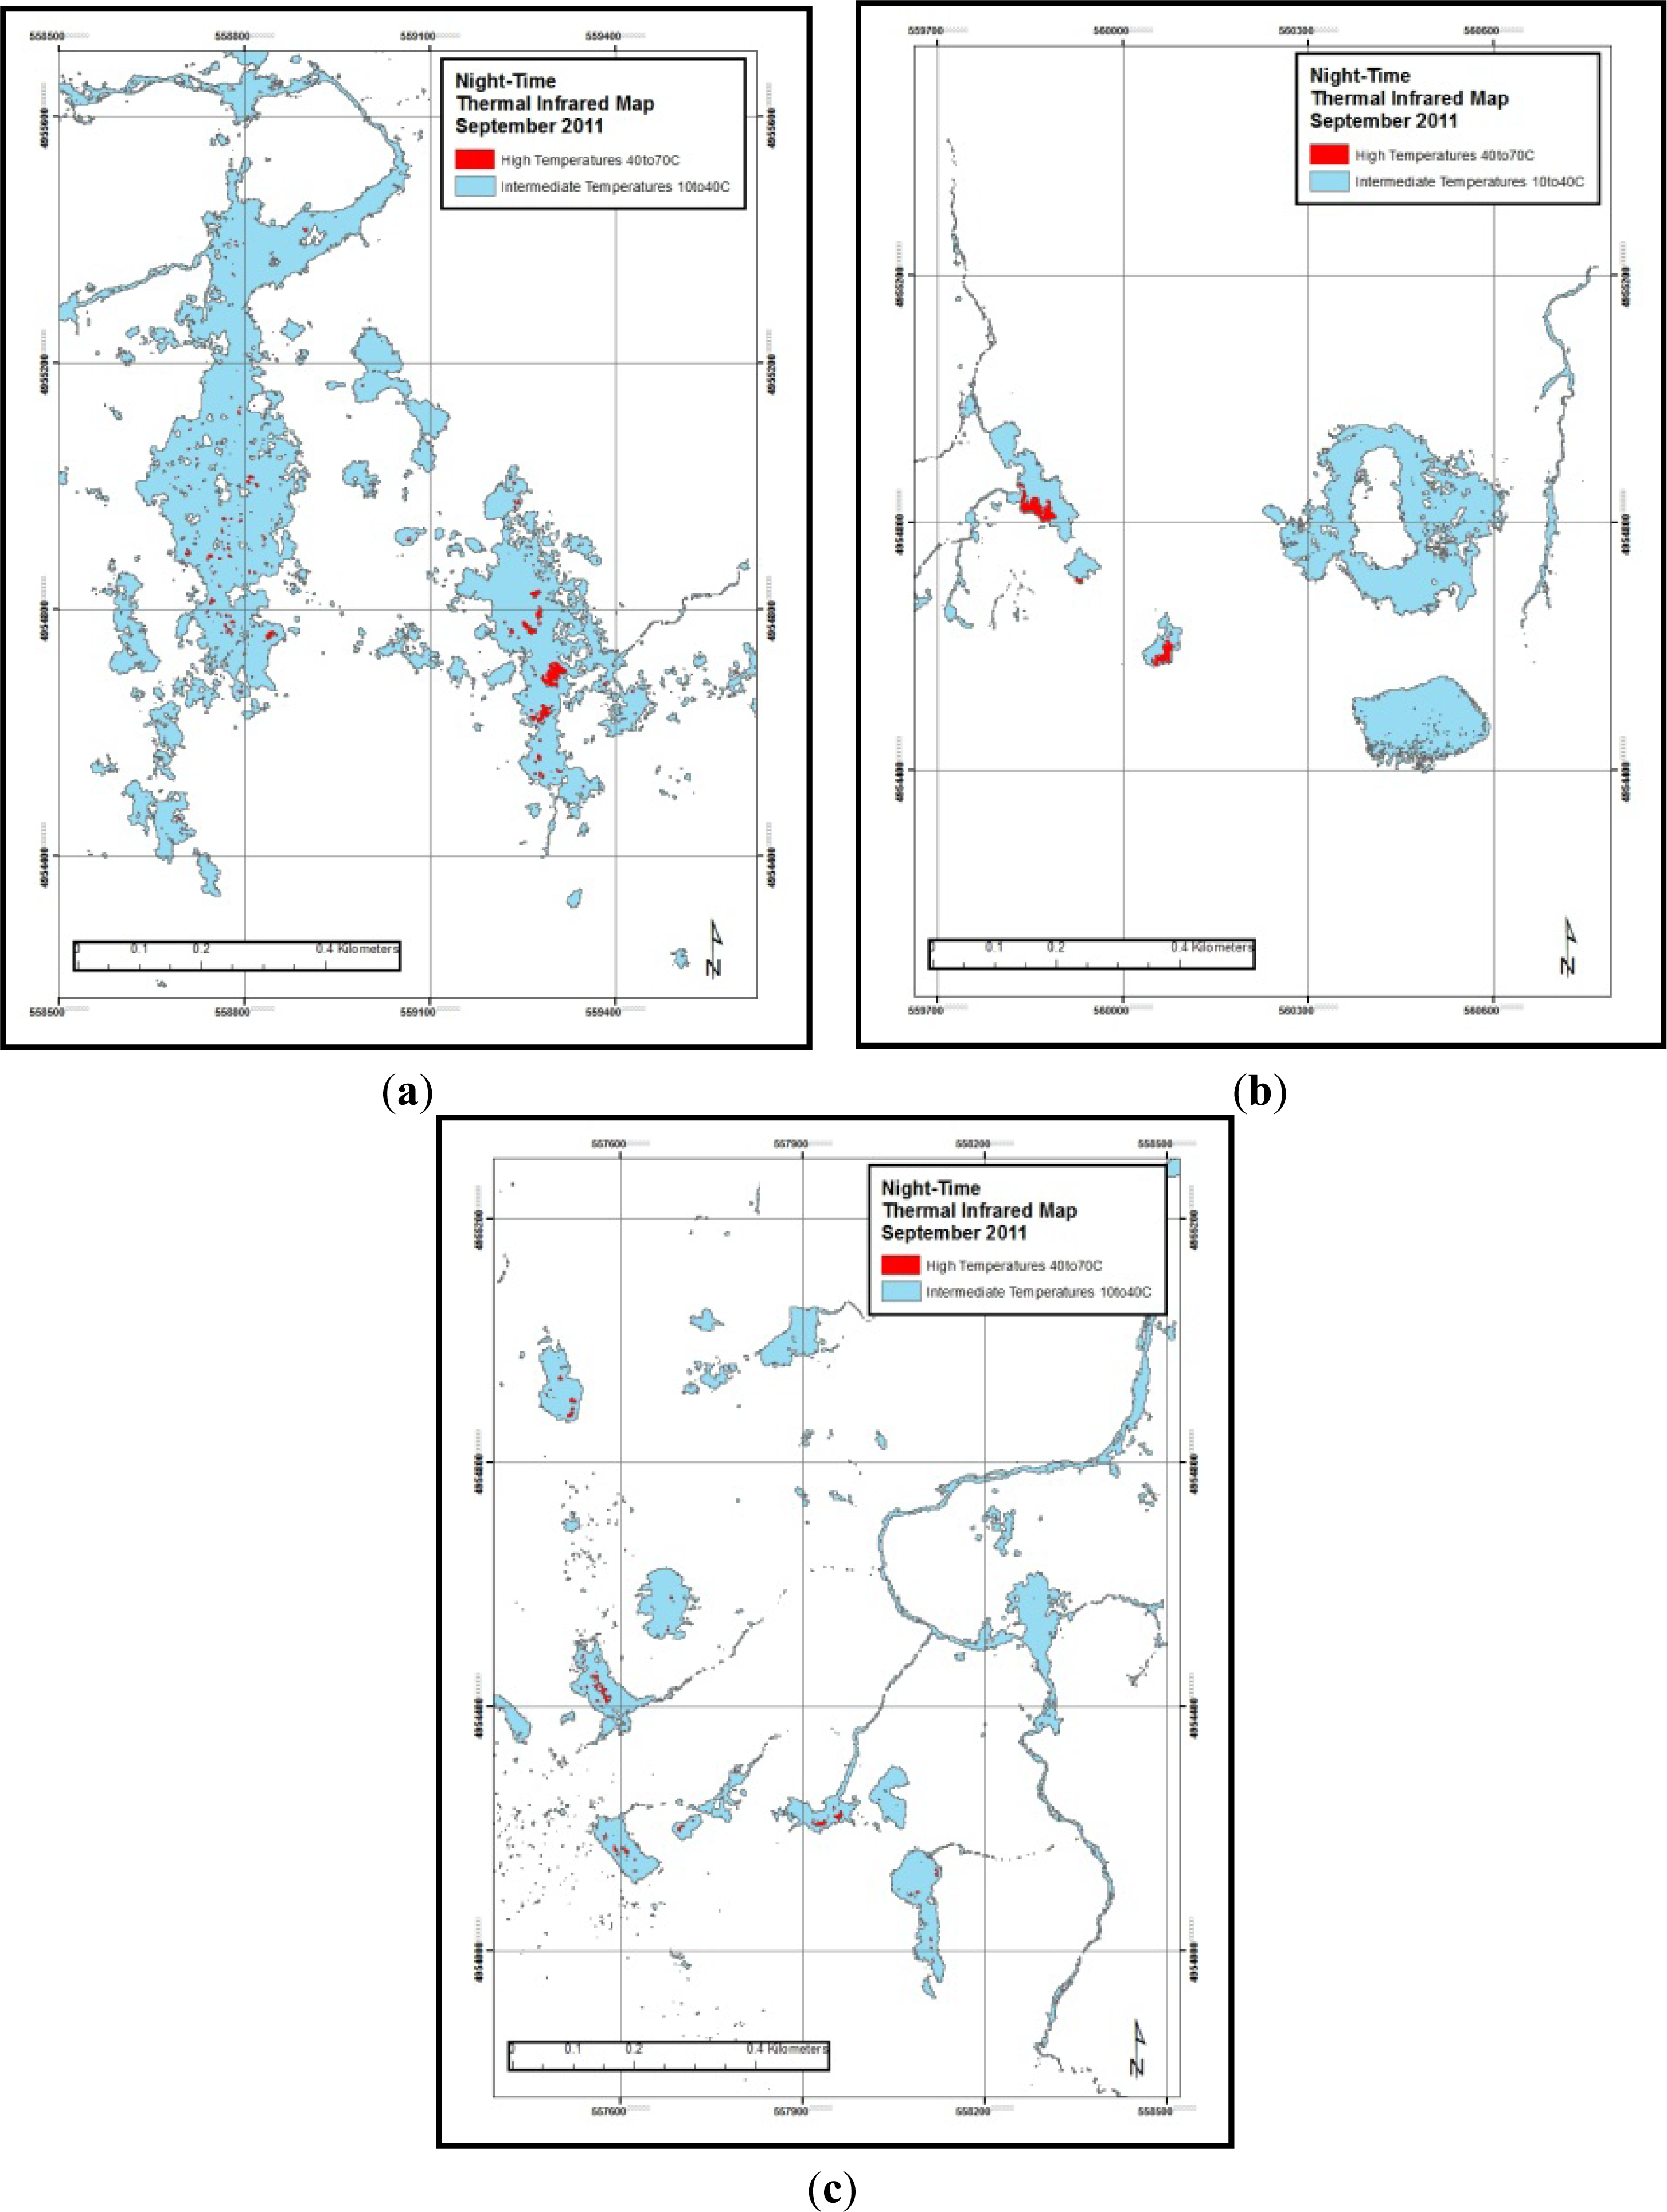
The eastern Hot Spring Basin hydrothermal system with its hydrothermal explosion crater (
Figure 6a–d) also shows interesting changes from September 2007 to September 2010. At the north-northwest trending hydrothermal pools, there is noticeable variation in the high temperature area between 2007 and 2011 (
Figures 6 and
8). At the hydrothermal explosion crater, the maximum area of intermediate temperature ground occurred in September 2011. Additionally, the small pond immediately south of the hydrothermal explosion crater shows its maximum area during September 2011.
The western Hot Spring Basin hydrothermal system with numerous small hydrothermal areas and Shallow Creek (
Figure 7a–d) shows similar temporal changes in the high and intermediate temperature components of the hydrothermal system. The high temperature component of the hydrothermal system has a maximum area during September 2007. Whereas, the 2011 map (
Figure 8) shows the maximum areas for the intermediate temperature component.
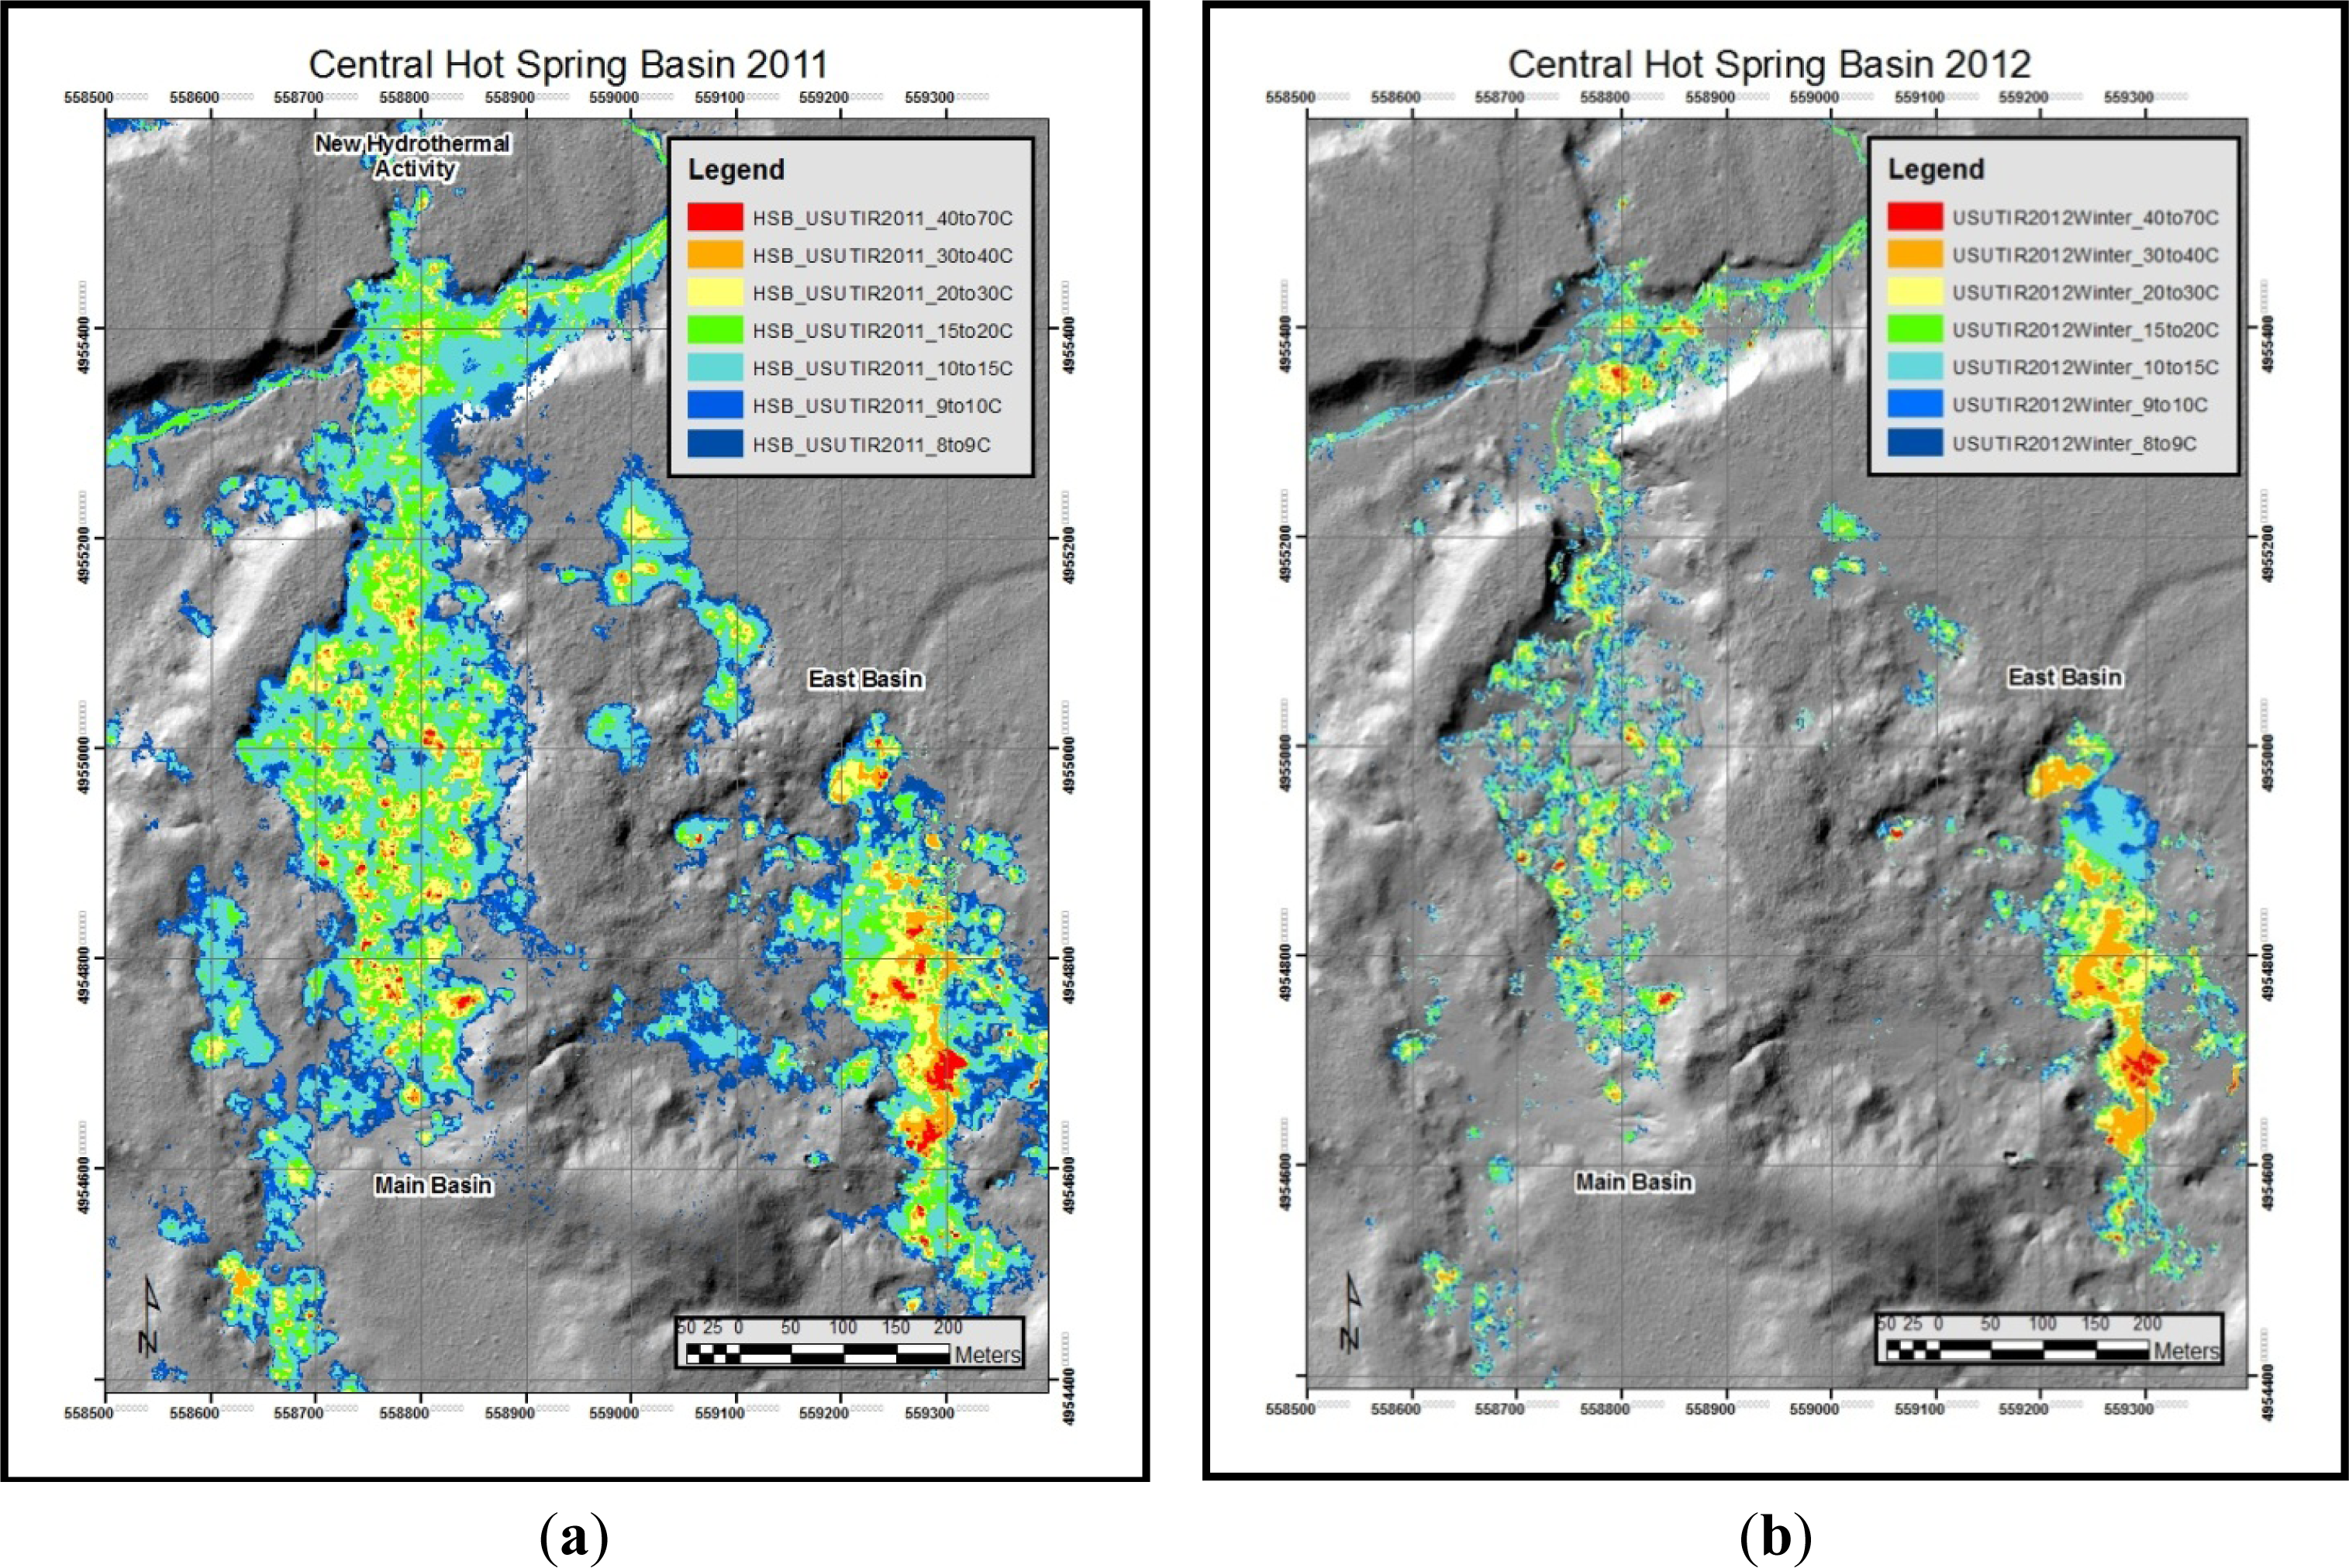
Comparison of the September 2011 and March 2012 temperature maps for the Hot Spring Basin hydrothermal system shows the effect of seasonal variation on the Hot Spring Basin hydrothermal system. For September 2011, the high (>40 °C), intermediate (between 40 °C and 10 °C) and low (<10 °C) temperature components of the Hot Spring Basin hydrothermal system clearly demonstrate a maximum spatial extent. In contrast, a minimal spatial extent of the high, intermediate and low temperature components of the Hot Spring Basin hydrothermal system is apparent on the March 2012 temperature map (Compare
Figure 9a,b). Thus, seasonal differences of the central Hot Spring Basin hydrothermal system are an important variable to consider when assessing the heat output from the basin.
5. Discussion
Antecedent solar heating, air temperature at the time of the image acquisition, relative humidity, dew point and other factors can account for the temporal variations in the eastern, central and western Hot Spring Basin hydrothermal system from 2007 to 2011 (
Figures 5 and
9). For the central Hot Spring Basin hydrothermal system, the variation in area of high temperatures can be explained by variations in water vapor/hydrothermal fog over hydrothermal features at the time of image acquisition. Thus, the type of hydrothermal features (fumaroles, mud pots, or hydrothermal pools) in the central, eastern and western Hot Springs Basin hydrothermal system may affect the temporal variation from 2007 to 2012 (
Figure 10a–f). Relative humidity, dew point and wind are factors influencing the amount of water vapor/hydrothermal fog. The amount of antecedent solar radiation could account for the maximum area of the small pond within eastern Hot Spring Basin hydrothermal system (
Figure 8c) in September 2011. The effect of solar-heated ground remaining in the processed imagery is another factor affecting the temporal variations in the low-temperature component (<10 °C) of the hydrothermal system.
It is also important to mention that the temporal variations (2007–2011) in the Hot Spring Basin hydrothermal system do reflect real changes in the hydrothermal system along faults and fractures (
Figure 11). Field work in Hot Spring Basin (2006–2008) documented natural fractures and dramatic changes in the ground (
Figure 12) within the central Hot Spring Basin hydrothermal system [
13]. Between 2007 and 2008, apparently solid ground became pockmarked with numerous hydrothermal vents and hydrothermal activity altered brown, compacted muds. In the night-time, thermal infrared imagery, this change in hydrothermal activity is noted as a north-trending extension of thermal ground (
Figures 5a–d and
9a).
The dramatic seasonal variation in temperature maps relates to the snowpack at Yellowstone’s high elevation and the type of hydrothermal activity (
Figure 9a,b). The main basin within the central Hot Spring Basin hydrothermal system contains many fumaroles and few pools. So, it is reasonable that there would be a significant difference in the main basin between September 2011 (
Figure 9a) and March 2012 (
Figure 9b) due to colder air temperatures and the cooling effect of melting snow. The east basin of the central Hot Spring Basin hydrothermal system mainly contains hydrothermal pools. Although there is a difference in area emitting thermal infrared radiation, the hydrothermal pools appear less affected by the snowpack or water vapor/hydrothermal fog. Not surprisingly, the winter snowpack mostly affects the lowest intermediate (10–15 °C) to low-temperature components (<10 °C) of the central, eastern and western Hot Spring Basin hydrothermal system.
During the airborne image acquisitions, (2007–2012), an episode of accelerated uplift (up to 7 cm/yr) of the Yellowstone caldera occurred from 2004 to 2009 [
31] and a decrease in the uplift rate occurred from 2010 through 2013. Additionally, there was an abnormally high snowpack during Fall 2010–Winter 2011. It is possible that the heavy winter 2011 snowpack affected hydrothermal systems such as Hot Spring Basin. These geologic and meteorological factors are important conditions to consider when examining the nighttime thermal infrared imagery from 2007 to 2012.
For Hot Spring Basin, the temporal and seasonal variation in temperature maps (
Figures 5 and
9) has implications for calculating heat output. The temperature maps are a visual proxy for heat output. The patterns of high, intermediate and low temperatures should be similar for estimated heat output because temperature is a key parameter for the heat calculations. Another key parameter for estimating the heat output for the Hot Spring Basin hydrothermal system is area. The variability in area emitting thermal infrared radiation generates questions about the best area to use for calculating heat output or detecting change over time.
Preliminary Heat Estimates
The following example illustrates the importance of area in heat output calculations. In the main basin of the central Hot Spring Basin hydrothermal system, the 10–70 °C area for 2011 provides a consistent region for calculating first-order heat estimates. The Stefan-Boltzmann equation can provide radiative heat output values for this region of the Hot Spring Basin hydrothermal system. Because each pixel is ∼one meter in area, the total radiative heat output for an area is the sum of the corrected and calibrated ground temperature for each pixel in the region of interest taken to the fourth power and multiplied by the Stefan Boltzman constant. Zero degrees Celsius (273.15 Kelvin) is an approximation for the air temperature at time of acquisition (2007–2012). This calculation yields radiative heat output values ranging from ∼56 MW to 62 MW for the main north-south trending basin (∼166,500 m2) of central Hot Spring Basin. For the entire Hot Spring Basin hydrothermal system (∼519,000 m2) within the 10–70 °C range, preliminary calculations yield a radiative heat output of approximately 191 MW.
A summary of previous heat flow estimates can place our first-order radiative heat flux estimates in perspective. Using various methods, authors have estimated heat flow (∼2 Wm
−2) for the Yellowstone Plateau [
32,
33]. Vaughan and others [
12] estimated a radiative heat flow based upon night-time satellite imagery. Using the ASTER TIR temperature data, Vaughan and others [
12] estimated a radiative heat output between 120–160 MW for the Hot Spring Basin Group using an estimated area of ∼1,532,589 m
2. Although comparing airborne and satellite imagery for mineral mapping in Yellowstone National Park, Kruse and others [
5] assessment of spatial resolution regarding detail and adequacy for mapping does apply to our study of temporal and seasonal variations in the Hot Spring Basin hydrothermal system. Night-time, airborne thermal infrared imagery with its high-spatial resolution (∼1 m) is an important component for defining the area over which heat output is calculated and change in this hydrothermal system can be measured.
6. Conclusions
We present results from an airborne thermal infrared technique documenting thermal variations in the central Hot Spring Basin hydrothermal system in September 2007, September 2008, September 2009, September 2010, September 2011, and March 2012. Within the 10–70 °C range, the approximate area of the high temperature (>40 °C) component within the hydrothermal system varies between 5,800 and 18,800 m2 during September image acquisitions. Whereas, the approximate area of intermediate temperature (<40 °C) component within the hydrothermal system varies between 384,000 to 513,300 m2 during September image acquisitions. For the main north-south trending basin (∼166,500 m2) within the 10–70 °C range, Stefan-Boltzman radiative heat calculations range from ∼59 MW to 62 MW for September 2007–2011. In contrast, the radiative heat output is the lowest value (∼56 MW) for March 2012 using the same area ∼166,500 m2 area. The smaller area of high (2,800 m2) and intermediate (144,600 m2) temperatures contributes to the lower estimate of heat output for the main north-south basin during March 2012. Thus, night-time, thermal infrared imagery acquired during September in 2007–2011 yields higher estimates of heat output than similar night-time imagery acquired during March 2012. It is reasonable that there is a significant difference in the main basin heat output between September 2007–2011 and March 2012 due to the cooling effect of melting snow.
Comparison of high-spatial resolution airborne thermal infrared imagery with coarse spatial resolution shows the value of high-spatial resolution imagery. For the entire Hot Spring Basin hydrothermal system (∼519,000 m
2) within the 10–70 °C range, the Stefan-Boltzman heat output value for September 2011 is ∼191 MW. This estimate is greater than radiative heat estimates (120–160 MW for 1,532,589 m
2) obtained using coarse-resolution, satellite imagery [
12], even though the area used for our calculations is three times smaller.
Water vapor or precipitation (rain or melting snow) are basic limitations of airborne high-spatial resolution, thermal infrared acquisitions. Unpredictable fall snow storms and a short optimal, weather-window may limit flight times for night-time image acquisition, may affect the quality of night-time thermal infrared images by increasing water vapor in the air, and thus decrease the radiative heat from hydrothermal areas sensed by the infrared sensors on the aircraft. Night-time thermal infrared image acquisition shortly after precipitation events may yield poor quality thermal infrared images and a low estimate of radiative heat output.
Work will continue on documenting both the spatial and temporal variation in radiative heat output for 2007–2012. Future work also will address the effect of the solar radiation on the atmospherically adjusted and emissivity corrected airborne images. Removing the remaining solar radiation component in the night-time, thermal infrared images will allow for a more precise estimate of radiative heat output from the low temperature component (<10 °C) of the Hot Spring Basin hydrothermal system. A more complete understanding of the subtle low-temperature component of the hydrothermal system is critical for additional geohydrologic analyses and a better understanding of changes in the entire Hot Spring Basin hydrothermal system. Future image acquisitions at different times during the year will help address these refinements in our repeatable thermal infrared monitoring technique.
Acknowledgments
Cooperative Ecological Study Unit agreements (Rocky Mountain CESU Task Agreements J1580090425 and J1580050608 from 2008–2009) between Yellowstone National Park Geology Program and the Remote Sensing Service Laboratory at Utah State University provided funding to study the Hot Spring Basin hydrothermal system and document natural changes. The authors thank Yellowstone National Park staff for the logistical support provided during the 2006–2008 field work at Hot Spring Basin. The senior author also wishes to acknowledge Dan Mahony’s field assistance during the 2007–2008 field seasons at Hot Spring Basin. Additionally, the authors appreciate reviewer’s comments and suggestions for improving the manuscript.
Conflicts of Interest
The authors declare no conflict of interest.
References
- Cardenas, B.M.; Neale, C.M.U.; Jaworowski, C.; Heasler, H. High-resolution mapping of hydrothermal water mixing: Yellowstone National Park. Int. J. Remote Sens 2011, 32, 2765–2777. [Google Scholar]
- Hardy, C.C. Characterizing Thermal Features from Multi-Spectral Remote Sensing Data Using Dynamic Calibration Procedures. Ph.D. Dissertation, University of Montana, Missoula, MT, USA. 2005. [Google Scholar]
- Hellman, M.J.; Ramsey, M.S. Analysis of hot springs and associated deposits in Yellowstone National Park using ASTER and AVIRIS remote sensing. J. Volcanol. Geotherm. Res 2004, 135, 195–219. [Google Scholar]
- Jaworowski, C.; Heasler, H.P.; Hardy, C.C.; Queen, L.P. Control of hydrothermal fluids by natural fractures at Norris Geyser basin. Yellowstone Sci 2006, 14, 13–23. [Google Scholar]
- Kruse, F.A.; Taranik, J.V.; Coolbaugh, M.; Michaels, J.; Littlefield, E.F.; Calvin, W.M.; Martini, B.A. Effect of reduced spatial resolution mineral mapping using imaging spectrometry—Examples using hyperspectral infrared imager (HyspIRI)—Simulated data. Remote Sens 2011, 3, 1584–1602. [Google Scholar]
- Neale, C.M.U.; Sivarajan, S.; Masih, A.; Jaworowski, C.; Heasler, H. Estimating heat flow of thermal features in Yellowstone National Park using airborne thermal infrared remote sensing. AGU Fall Meet. Abstr. 2011. 2011AGUFM.H51C1225N. [Google Scholar]
- Pierce, K.L. Evaluation of Infrared Imagery Applications to Studies of Surficial Geology, Yellowstone National Park; Technical Letter NASA-93; US Geological Survey: Denver, CO, USA, 1968. [Google Scholar]
- Prostka, H.J. Preliminary General Evaluation of Radar Imagery in Yellowstone Park, Wyoming; Technical Letter NASA-30; US Geological Survey: Denver, CO, USA, 1966. [Google Scholar]
- Ruppel, E.T. Preliminary General Evaluation of Radar Imagery, Southern Gallatin Range and Vicinity (Flights 89–1, 89–2, 89–3, 94–2); Technical Letter NASA-30; US Geological Survey: Denver, CO, USA, 1966. [Google Scholar]
- Savage, S.L.; Lawrence, R.L.; Custer, S.G.; Jewett, J.T.; Powell, S.L.; Shaw, J.A. Review of alternative methods for estimating terrestrial emittance and geothermal heat flux for Yellowstone National Park using landsat imagery. GISci. Remote Sens 2010, 47, 460–479. [Google Scholar]
- Smedes, H.W. Geological Evaluation of Infrared Imagery, Eastern Part of Yellowstone National Park, Wyoming and Montana; Technical Letter NASA-83; US Geological Survey: Denver, CO, USA, 1968. [Google Scholar]
- Vaughan, R.G.; Keszthelyi, L.P.; Lowenstern, J.B.; Jaworowski, C.; Heasler, H. Use of ASTER and MODIS thermal infrared data to quantify heat flow and hydrothermal change at Yellowstone National Park. J. Volcanol. Geotherm. Res. 2012, 233–234, 72–89. [Google Scholar]
- Jaworowski, C.; Heasler, H.; Neale, C.; Cardenas, B.; Sivarajan, S. Using Night-Time, Thermal Infrared Imagery to Remotely Monitor the Hydrothermal System at Hot Spring Basin, Yellowstone National Park. Proceedings of 61st Meeting of Geological Society of America, Rocky Mountain Section, Abstracts with Programs, Boulder, CO, USA, 11–13 May 2009; p. 47.
- Jaworowski, C.; Heasler, H.P.; Neale, C.M.U.; Sivarajan, S. Monitoring the dynamic geohydrology of the upper geyser basin, Yellowstone National Park—An integration of airborne thermal infrared and lidar imagery. IAHS 2012, 352, 54–58. [Google Scholar]
- Seielstad, C.; Queen, L. Thermal Remote Monitoring of Norris Geyser Basin and Associated Geothermal Resources, Yellowstone National Park; Final Report for National Park Service Cooperative Ecological Study Unit (CESU) Agreement H1200040001; National Park Service RMCESU: Missoula, MT, USA, 2009; pp. 1–33. [Google Scholar]
- Smith, R.B.; Jordan, M.; Steinberger, B.; Puskas, C.M.; Farrell, J.; Waite, G.P.; Husen, S.; Chang, W.L.; O’Connell, R. Geodynamics of the Yellowstone hotspot and mantle plume—Seismic and GPS imaging, kinematics, and mantle flow. J. Volcanol. Geotherm. Res 2009, 188, 26–56. [Google Scholar]
- De Nosaquo, K.R.; Smith, R.B.; Lowry, A.R. Density and lithospheric strength models of the Yellowstone-Snake River Plain volcanic system from gravity and heat flow data. J. Volcanol. Geotherm. Res 2009, 188, 108–127. [Google Scholar]
- Christiansen, R.L. The Quaternary and Pliocene Yellowstone Plateau volcanic field of Wyoming, Idaho, and Montana; US Geological Survey Professional Paper 729-G; US Geological Survey: Reston, VA, USA, 2001; pp. 1–120. [Google Scholar]
- Christiansen, R.L.; Blank, H., Jr. Geologic Map of the Canyon Village Quadrangle, Yellowstone National Park; US Geologic Survey Geologic Quadrangle Map GQ-1192; US Geological Survey: Reston, VA, USA, 1975. [Google Scholar]
- Prostka, H.J.; Blank, H.R., Jr.; Christiansen, R.L.; Ruppel, E.T. Geologic Map of the Tower Junction Quadrangle, Yellowstone National Park, Wyoming and Montana; US Geologic Survey Geologic Quadrangle Map GQ-1247; US Geological Survey: Reston, VA, USA, 1975. [Google Scholar]
- Prostka, H.J.; Ruppel, E.T.; Christiansen, R.L. Geologic Map of the Abiathar Peak Quadrangle, Yellowstone National Park, Wyoming and Montana; US Geologic Survey Geologic Quadrangle Map GQ-1244; US Geological Survey: Reston, VA, USA, 1975. [Google Scholar]
- Werner, C.; Hurwitz, S.; Bergfeld, D.; Evans, W.C.; Lowenstern, J.B.; Heasler, H.; Jaworowski, C.; Hunt, A. Volatile Emissions and Gas geochemistry of Hot Spring Basin, Yellowstone, USA. J. Volcanol 2008, 178, 751–762. [Google Scholar]
- Pierce, K.L.; Muhs, D.R.; Fosberg, M.A.; Mahan, S.A.; Rosenbaum, J.G.; Liccardi, J.M.; Pavich, M.J. A loess-paleosol record of climate and glacial history over the past two glacial-interglacial cycles (∼150 ka), southern Jackson Hole, Wyoming. Quat. Res 2011, 76, 119–141. [Google Scholar]
- Pierce, K.L. Surficial Geologic Map of the Abiathar Peak and parts of the adjacent Quadrangles, Yellowstone National Park, Wyoming and Montana; US Geologic Survey Miscellaneous Field Investigation Map I-646; US Geological Survey: Reston, VA, USA, 1974. [Google Scholar]
- Pierce, K.L. Surficial Geologic Map of the Tower Junction Quadrangle and Part of the Mount Wallace Quadrangle, Yellowstone National Park, Wyoming and Montana; US Geologic Survey Miscellaneous Field Investigation Map I-647; US Geological Survey: Reston, VA, USA, 1974. [Google Scholar]
- Richmond, G.L. Surficial Geologic Map of the Canyon Village Quadrangle, Yellowstone National Park, Wyoming; US Geologic Survey Miscellaneous Field Investigation Map I-652; US Geological Survey: Reston, VA, USA, 1977. [Google Scholar]
- Cai, B.; Neale, C.M.U. A Method for Constructing 3-Dimensional Models from Airborne Imagery. Proceedings of the 17th Biennial Workshop on Color Photography and Videography for Resource Assessment, Reno, NV, USA, 5–7 May 1999.
- Neale, C.M.U.; Sivarajan, S. Integrated Study of Systematic Monitoring and Mapping Thermal Springs and Features in Yellowstone National Park; Final Report for CESU Task Agreements J1580090425 and J1580050608; National Park Service RMCESU: Missoula, MT, USA, 2011; pp. 1–18. [Google Scholar]
- Berk, A.; Bernstein, L.S.; Robertson, D.C. MODTRAN: A Moderate Resolution Model for LOWTRAN 7; Report GL-TR-89–0122; Geophysics Laboratory: Bedford, MD, USA, 1989. [Google Scholar]
- Brunsell, N.A.; Gillies, R. Incorporating surface emissivity into a thermal atmospheric correction. Photogramm. Eng. Remote Sens 2002, 68, 1263–1269. [Google Scholar]
- Chang, W.L.; Smith, R.B.; Farrell, J.; Puskas, C.M. An extraordinary episode of Yellowstone caldera uplift, 2004–2010, from GPS and InSAR observations. Geophys. Res. Lett 2010, 37, L23302. [Google Scholar]
- Blackwell, D.D.; Richards, M. Geothermal Map of North America; Am. Assoc. Pet. Geol.: Tulsa, OK, USA, 2004; 1 sheet, scale 1:6,500,000. [Google Scholar]
- Fournier, R.O. Geochemistry and dynamics of the Yellowstone National Park hydrothermal system. Annu. Rev. Earth Planet. Sci 1989, 17, 13–53. [Google Scholar]
Figure 1.
Map showing location of the Hot Spring Basin (black dot) hydrothermal system within Yellowstone National Park. The map also highlights the 640,000 Yellowstone caldera (black dashed line) and two resurgent domes (Mallard Lake and Sour Creek; cross-hatched areas)
Figure 1.
Map showing location of the Hot Spring Basin (black dot) hydrothermal system within Yellowstone National Park. The map also highlights the 640,000 Yellowstone caldera (black dashed line) and two resurgent domes (Mallard Lake and Sour Creek; cross-hatched areas)
Figure 2.
Map showing the western, central, and eastern portions of the Hot Spring Basin hydrothermal system. Notice that Shallow Creek flows through the western and central portions of the hydrothermal system. The headwaters of Wrong Creek primarily occupy the eastern portion of the hydrothermal system. The black represents ground and water temperatures (10 to 70 °C) derived from the September 2011 night-time thermal infrared imagery.
Figure 3.
Bedrock geologic map showing the faulted and fractured Lava Creek Tuff (Qylb) and the area of hydrothermally altered ground (Qhi). The bedrock geologic map shows Lava Creek Tuff as both hydrothermally altered (red) and unaltered (blue). A hydrothermal explosion deposit (Qhe) surrounds the hydrothermal explosion crater. Normal faults (black solid lines with tab on down dropped block and black dashed lines) cut through the Hot Spring Basin hydrothermal system. The central Hot Spring Basin hydrothermal system occupies the faulted block with a north-south line of thermal features (red circles). Note that bedrock geologists [
18–
21] mapped the extent of the hydrothermal alteration differently than subsequent scientists.
Figure 4.
Surficial geologic map showing normal faults (black solid and dashed lines), various Quaternary sediments [
24–
26] and major creeks (Shallow Creek and Wrong Creek). Till (Qpt) and various late glacial sediments (Qpkg, Qpkl, Qpks, Qpst, Qpg, Qsg, Qbkl) occur throughout the Hot Spring Basin hydrothermal system. Compare
Figure 3 and
4 to see how bedrock geologists and surficial geologists map Hot Spring Basin differently (orange area with red dots).
Figures 5.
Maps showing high (red) and intermediate (blue) temperature components of the central Hot Spring Basin hydrothermal system with its north-south trending hydrothermal basins for September 2007 (a), 2008 (b), 2009 (c) and 2010 (d). Compare figures at northern end of main basin (west side of maps) using the UTM grid.
Figures 6.
Maps showing high (red) and intermediate (blue) temperature components of the eastern Hot Spring Basin hydrothermal system with its hydrothermal explosion crater, series of hydrothermal pools, and small pond for September 2007 (a), 2008 (b), 2009 (c) and 2010 (d). Compare figures using the UTM grid.
Figures 7.
Maps showing high (red) and intermediate (blue) temperature components of the western Hot Spring Basin hydrothermal system with its small hydrothermal areas and Shallow Creek for September 2007 (a), 2008 (b), 2009 (c) and 2010 (d).
Figures 7.
Maps showing high (red) and intermediate (blue) temperature components of the western Hot Spring Basin hydrothermal system with its small hydrothermal areas and Shallow Creek for September 2007 (a), 2008 (b), 2009 (c) and 2010 (d).
Figures 8.
Maps showing high (red,) and intermediate (blue) temperature components of the central (
a), eastern (
b) and western (
c) Hot Spring Basin hydrothermal system for September 2011. Use this figure and its UTM grid with its eastings (E) and northings (N) as a reference for photographs shown in
Figure 10.
Figures 9.
Maps showing high (red), intermediate (orange, yellow, green and turquoise) and low temperature (dark blue) components of the central Hot Spring Basin hydrothermal system draped over 2008 NSF EarthScope LIDAR image for September 2011 (a) and March 2012 (b). The ∼71 m north-trending zone of thermal activity at the north end of the main basin is due to hydrothermal activity along a north-trending fracture/fault at the following UTM coordinates: ∼558800 E and 4955500 N.
Figure 10.
Photographs of the central Hot Spring Basin hydrothermal system showing the main north-south-trending basin and the east basin (between 4,954,600 to 4,954,900N and 559,200 to 559,400E) with pools (
a,
b), view to the north; the eastern basin with the fault-bounded pool (between 559,700 and 560,000E and ∼4,954,800N) and the hydrothermal explosion crater between 560,300 to 560,600E and centered at 4,954,800N (
c,
d); and the western HSB hydrothermal system with Shallow Creek (between 4,954,300E and 4,954,600 N) and small pools (
e,
f). Refer to
Figure 8a–c for the UTM reference grid.
Figure 11.
Map showing 2011 intermediate-to -high components (tan color) of the central and portion of the eastern Hot Spring Basin hydrothermal system, mapped faults (solid black lines) and interpreted faults/fractures (black dashed lines) draped over bare-earth digital elevation model (DEM). During 2008, the National Science Foundation EarthScope project acquired LIDAR image (refer to
www.opentopography.org) for this area and other selected areas within Yellowstone National Park.
Figures 12.
Photographs showing fractured (a) and hydrothermally altered ground (b) at the junction of Shallow Creek and the main basin of the central Hot Spring Basin hydrothermal system (∼558,800E and 4,955,500N). The frequency-azimuth plot (c) shows the predominant NNW trending fractures in the Lava Creek Tuff. Approximately east-west trending fractures occur within the compacted muds (a,c).
Table 1.
Time of Image Acquisitions for the Hot Spring Basin Hydrothermal System.
Table 1.
Time of Image Acquisitions for the Hot Spring Basin Hydrothermal System.
| Year | Date | Stert Time | End Time |
|---|
| 2007 | 13 September | 12:06 a.m. | 12:19 a.m. |
| 2008 | 12 September | 11:52 p.m. | 12:13 a.m. |
| 2009 | 10 September | 1:17 a.m. | 1:37 a.m. |
| 2010 | 25 September | 11:45 p.m. | 12:04 a.m. |
| 2011 | 8 September | 1:22 a.m. | 1:42 a.m. |
| 2012 | 9 March | 10:22 p.m. | 10:32 p.m. |
Table 2.
Weather conditions near the time of the TIR acquisition.
Table 2.
Weather conditions near the time of the TIR acquisition.
| Acquisition Date | Maximum Solar Radiation (W/m2) | Precipitation (mm) | Air Temperature (°C) | Relative Humidity (%) | Dew Point (°C) |
|---|
| 2007/9/13 | ∼800 | None | 9.9 to 8.4 | 47 to 54 | 0.9 to 0.6 |
| 2008/9/12 | ∼564 to 859 | None | 7.3 to 7.7 | 43 to 44 | 1.1 to 1.9 |
| 2009/9/10 | ∼800 | Trace | 9.2 to 8.3 | ∼65 | 1.6 |
| 2010/9/25 | 796 | 0.1 to 2.2 | 9.9 to 8.8 | 49 to 54 | 1.4 |
| 2011/9/8 | 785 | None | 6.9 to7.2 | 75 to 81 | None |
| 2012/3/9 | 730 | NA | −2.6 | 39 | None |
Table 3.
Yellowstone National Park Fires.
Table 3.
Yellowstone National Park Fires.
| Year | Yellowstone NP Fires | Date Out |
|---|
| 2007 | Beaverdam, Cave, Columbine, Huckleberry, Lookout, Norris Prescription Burn, Owl, Promontory Complex, Raven, | 5–7 October 2007 |
| 2008 | Le Hardy, Outlet | 10 October 2008 |
| 2009 | Arnica, Butte | 26 October 2009 |
| 2010 | Antelope, Arthur, Beach | 28 October 2010 |
| 2011 | Headwaters, Huckleberry, Ouzel, Pitchstone, Point, Ribbon | 6 October 2011 for most fires; 17 September for Ribbon |
| 2012 | NONE | NA |
Table 4.
Summary of high and intermediate components of the hydrothermal system.
Table 4.
Summary of high and intermediate components of the hydrothermal system.
| Year | High Temperature Area (∼m2) | Intermediate Temperature Area (∼m2) | Comments |
|---|
| 2007 | 18,800 | 414,000 | Min Temp: −3 °C
Max Temp: 67 °C |
| 2008 | 8,000 | 414,000 | Min Temp: −4 °C
Max Temp: 68 °C |
| 2009 | 8,400 | 284,000 | Min Temp: −8 °C
Max Temp: 70 °C |
| 2010 | 8,700 | 513,300 | Min Temp: −8 °C
Max Temp: 67 °C |
| 2011 | 5,800 | 513,300 | Min Temp: −3 °C
Max temp: 66 °C |
| 2012 | 2,800 | 144,600 | Min Temp: −15 °C
Max temp: 63 °C |
© 2013 by the authors; licensee MDPI, Basel, Switzerland This article is an open access article distributed under the terms and conditions of the Creative Commons Attribution license ( http://creativecommons.org/licenses/by/3.0/).


