Stem Water Potential Monitoring in Pear Orchards through WorldView-2 Multispectral Imagery

Abstract
:1. Introduction
2. Materials and Methods
2.1. Study Area and Experimental Setup
2.2. Data
2.2.1. In Situ Water Status
2.2.2. Leaf Level Reflectance
2.2.3. Canopy Level Reflectance
2.2.4. Satellite Level Reflectance
2.3. Analysis
3. Results
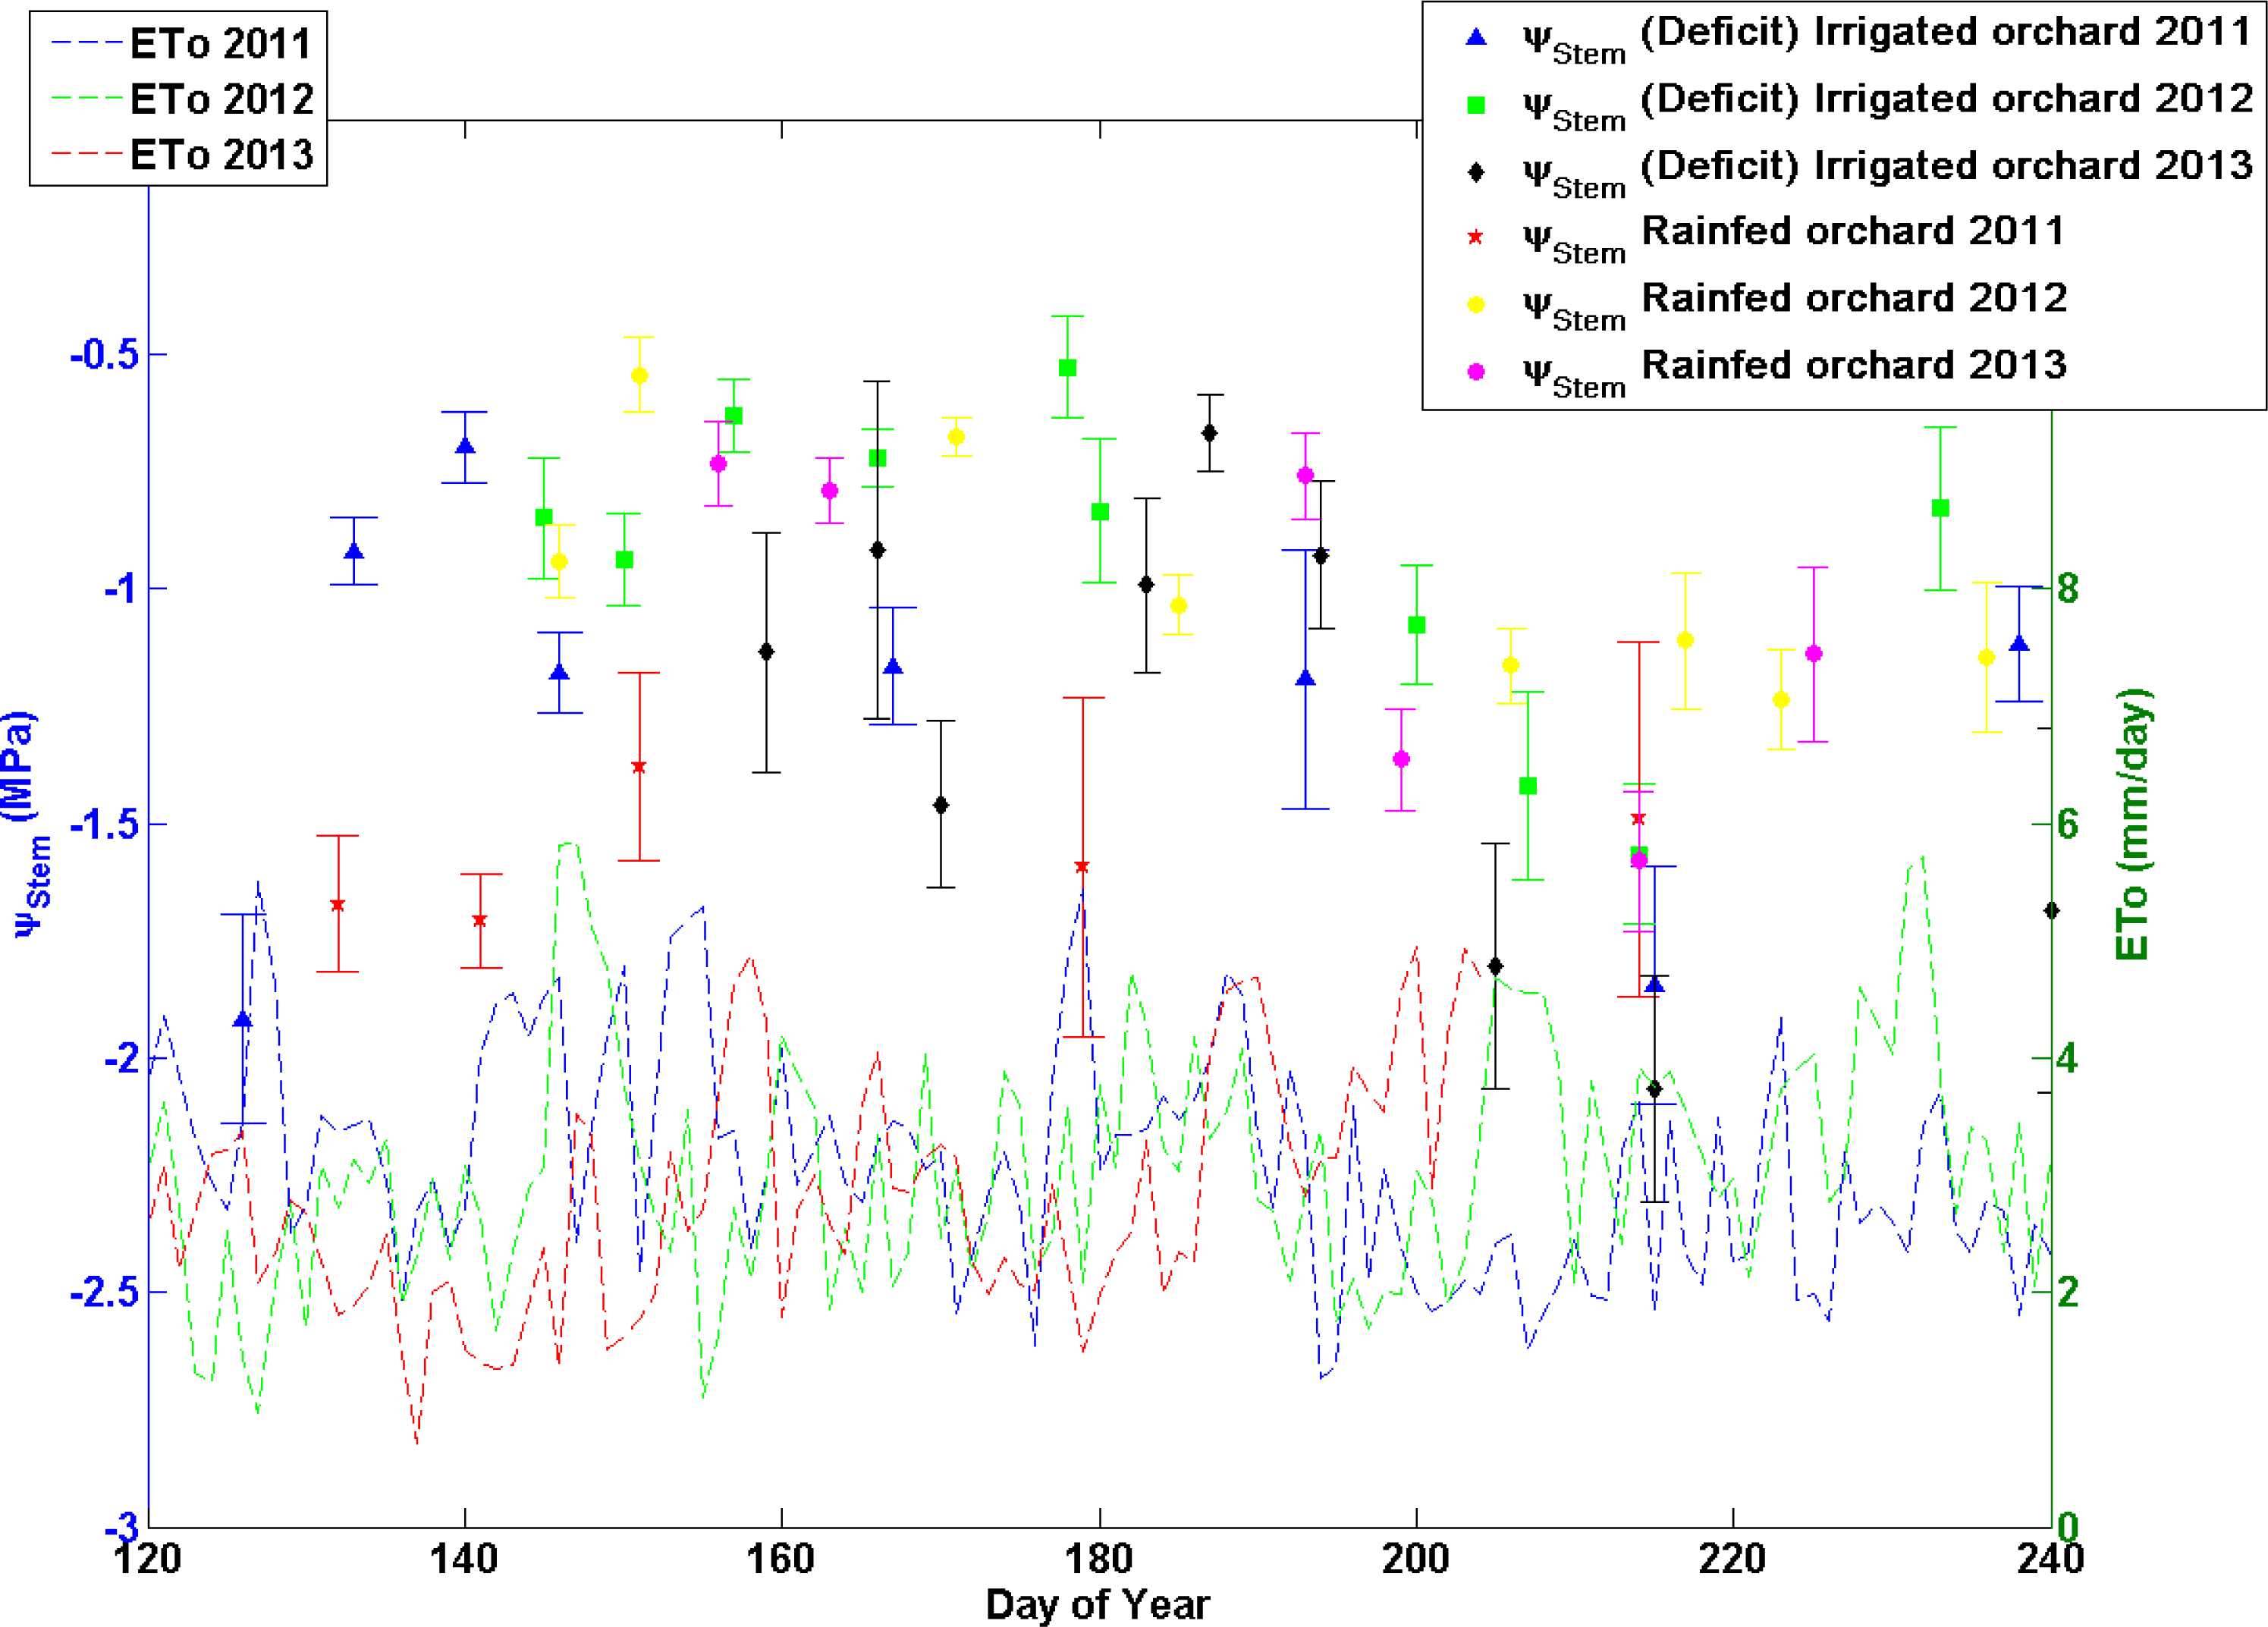
3.1. Water Status
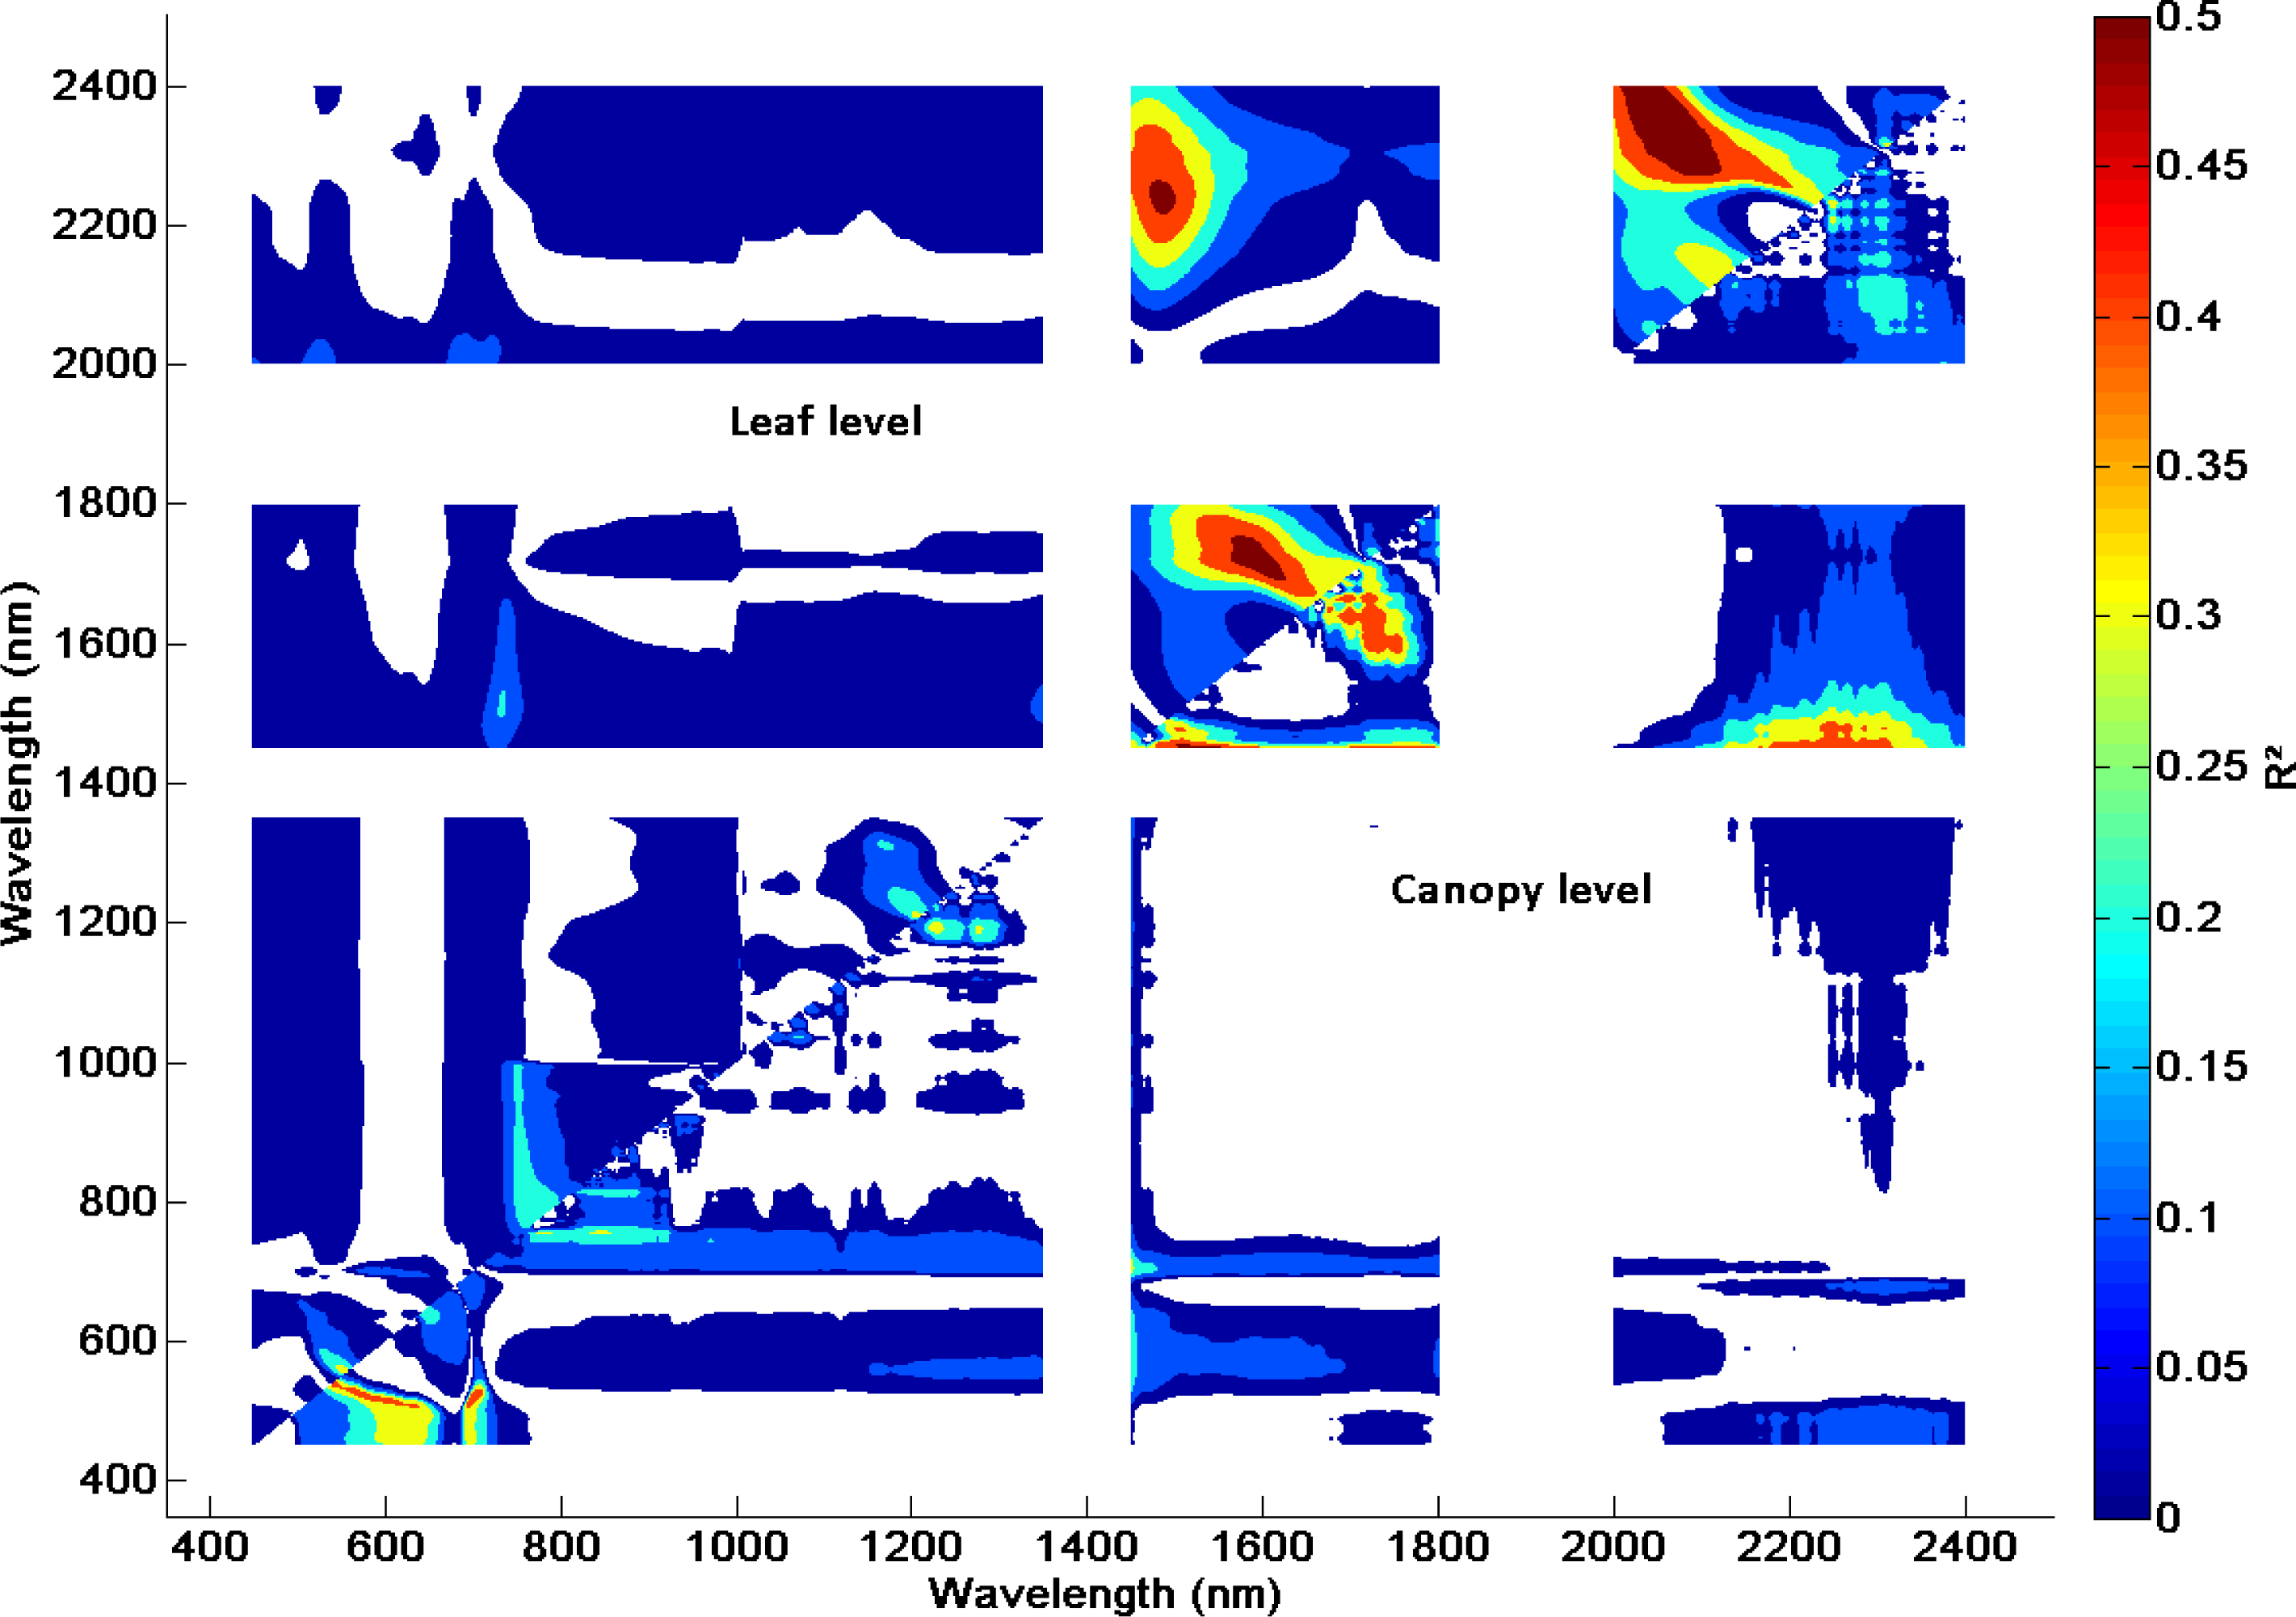
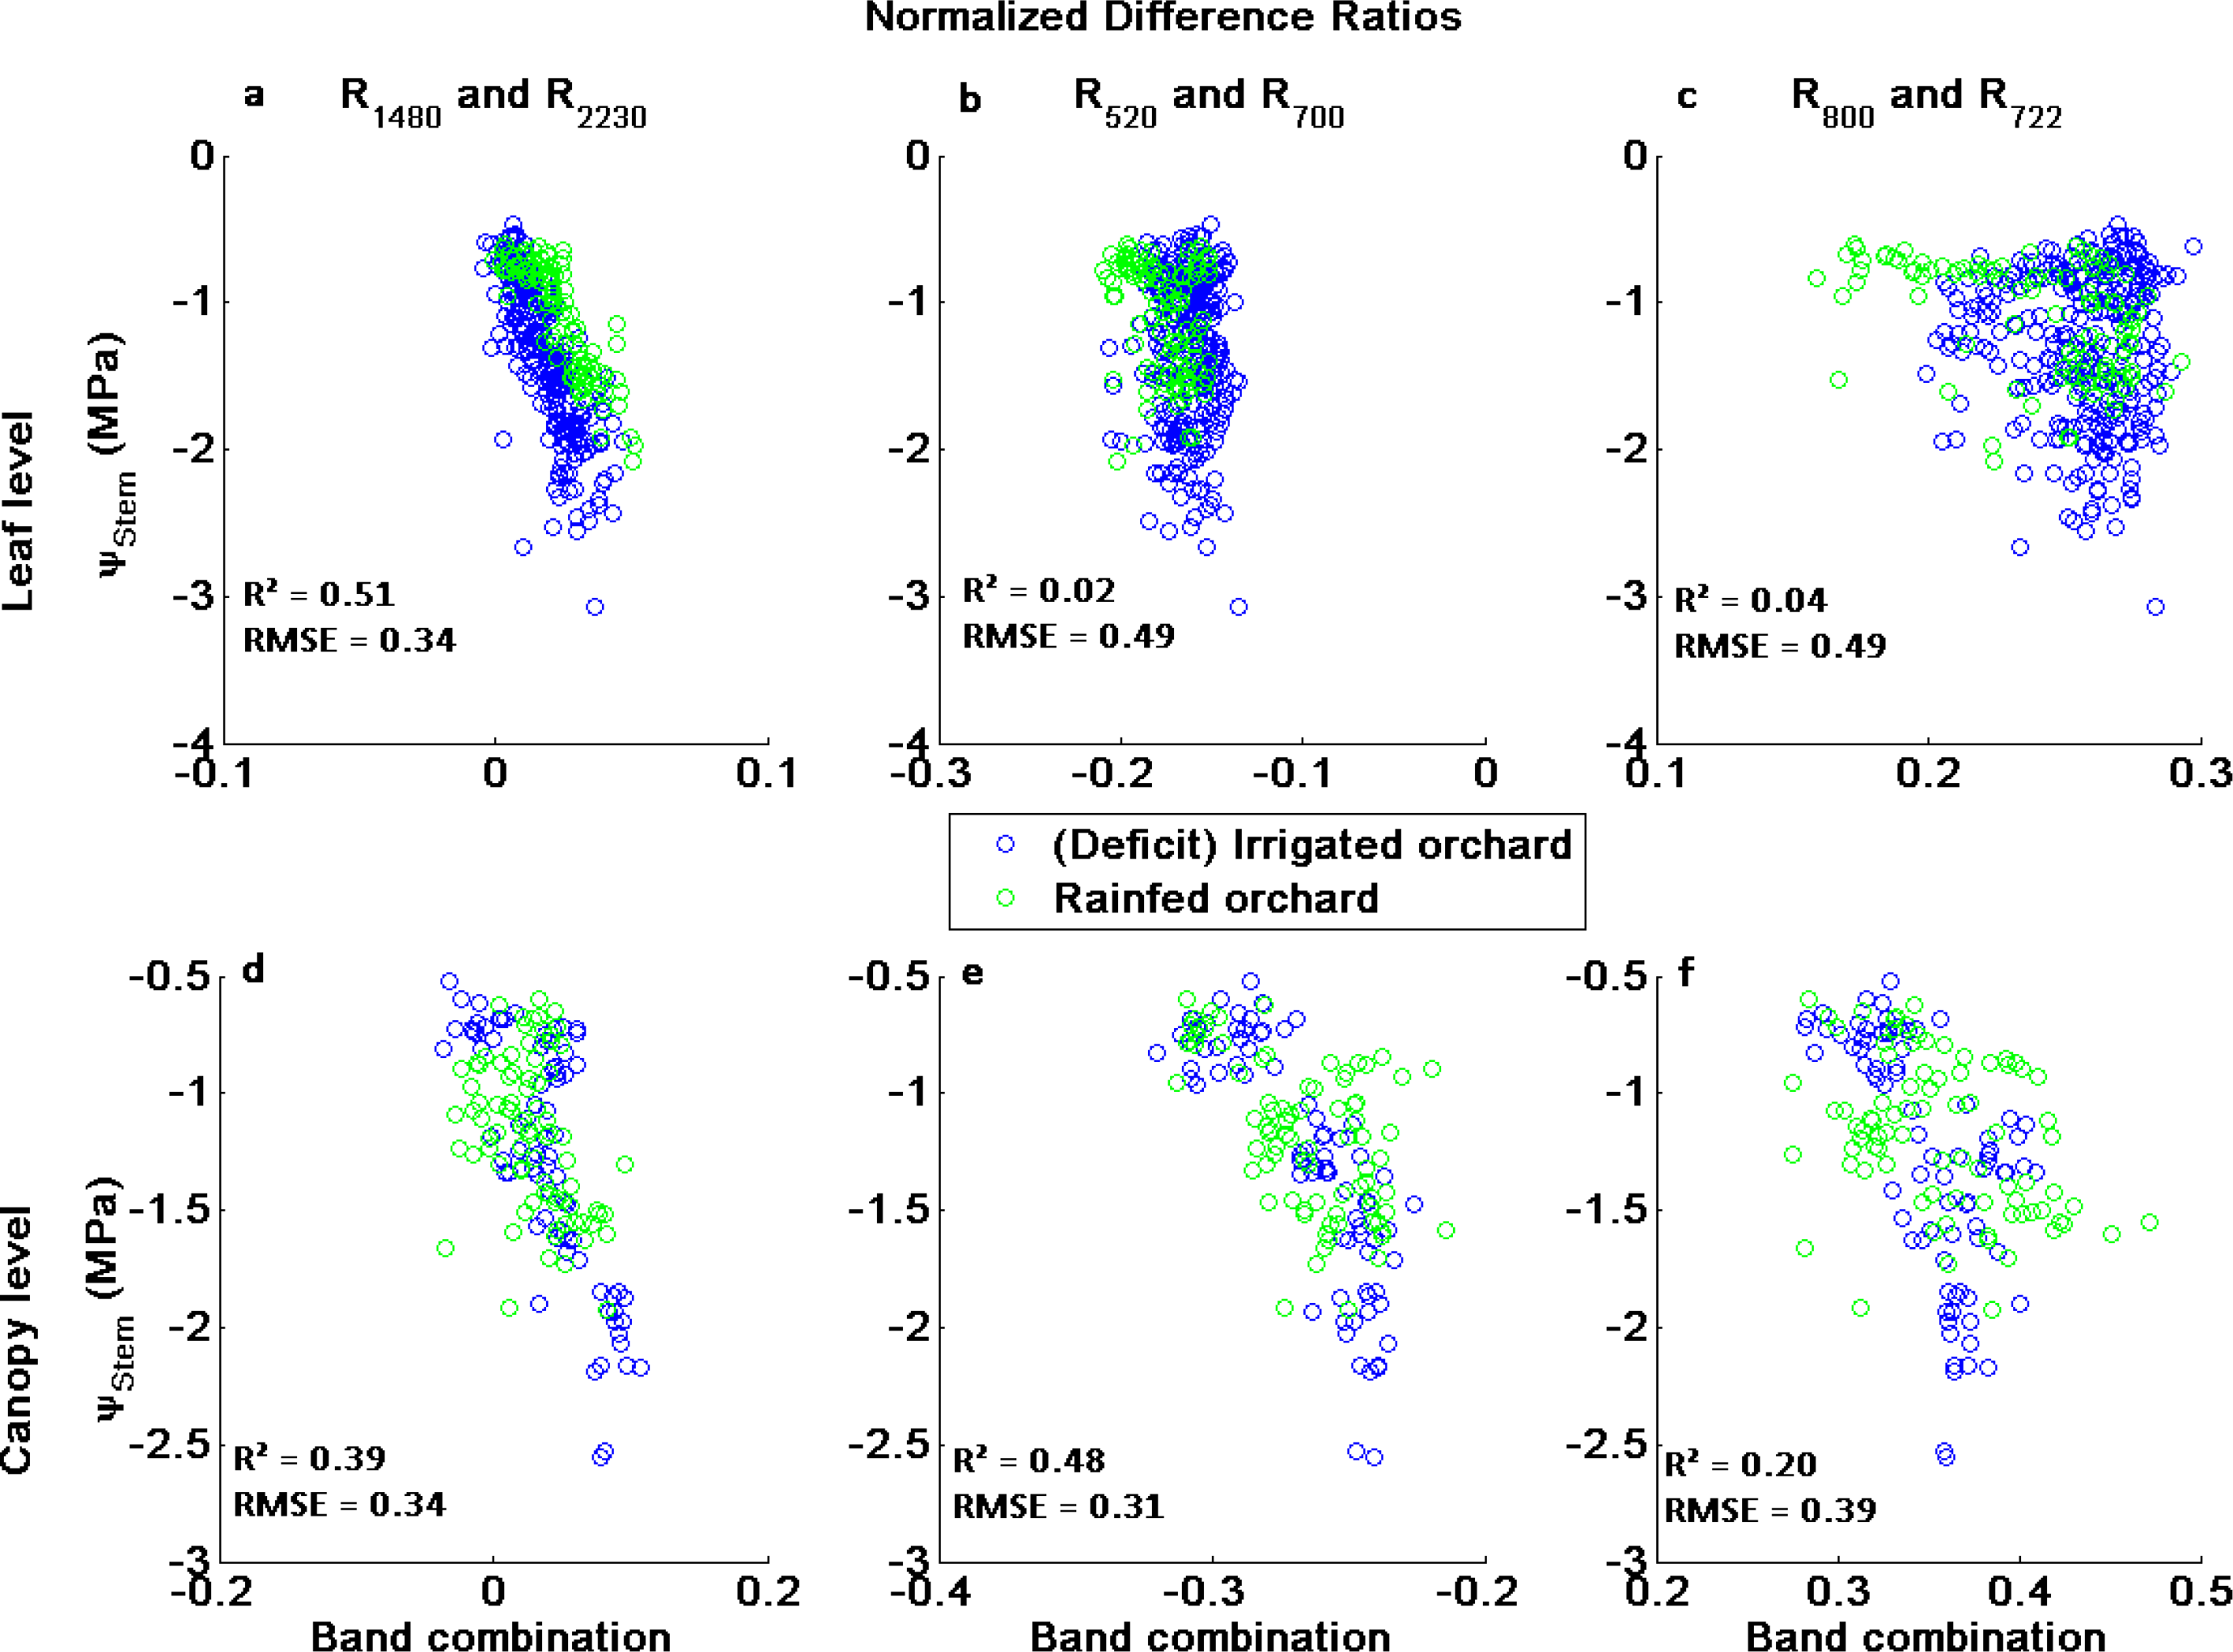
3.2. Leaf and Canopy Reflectance
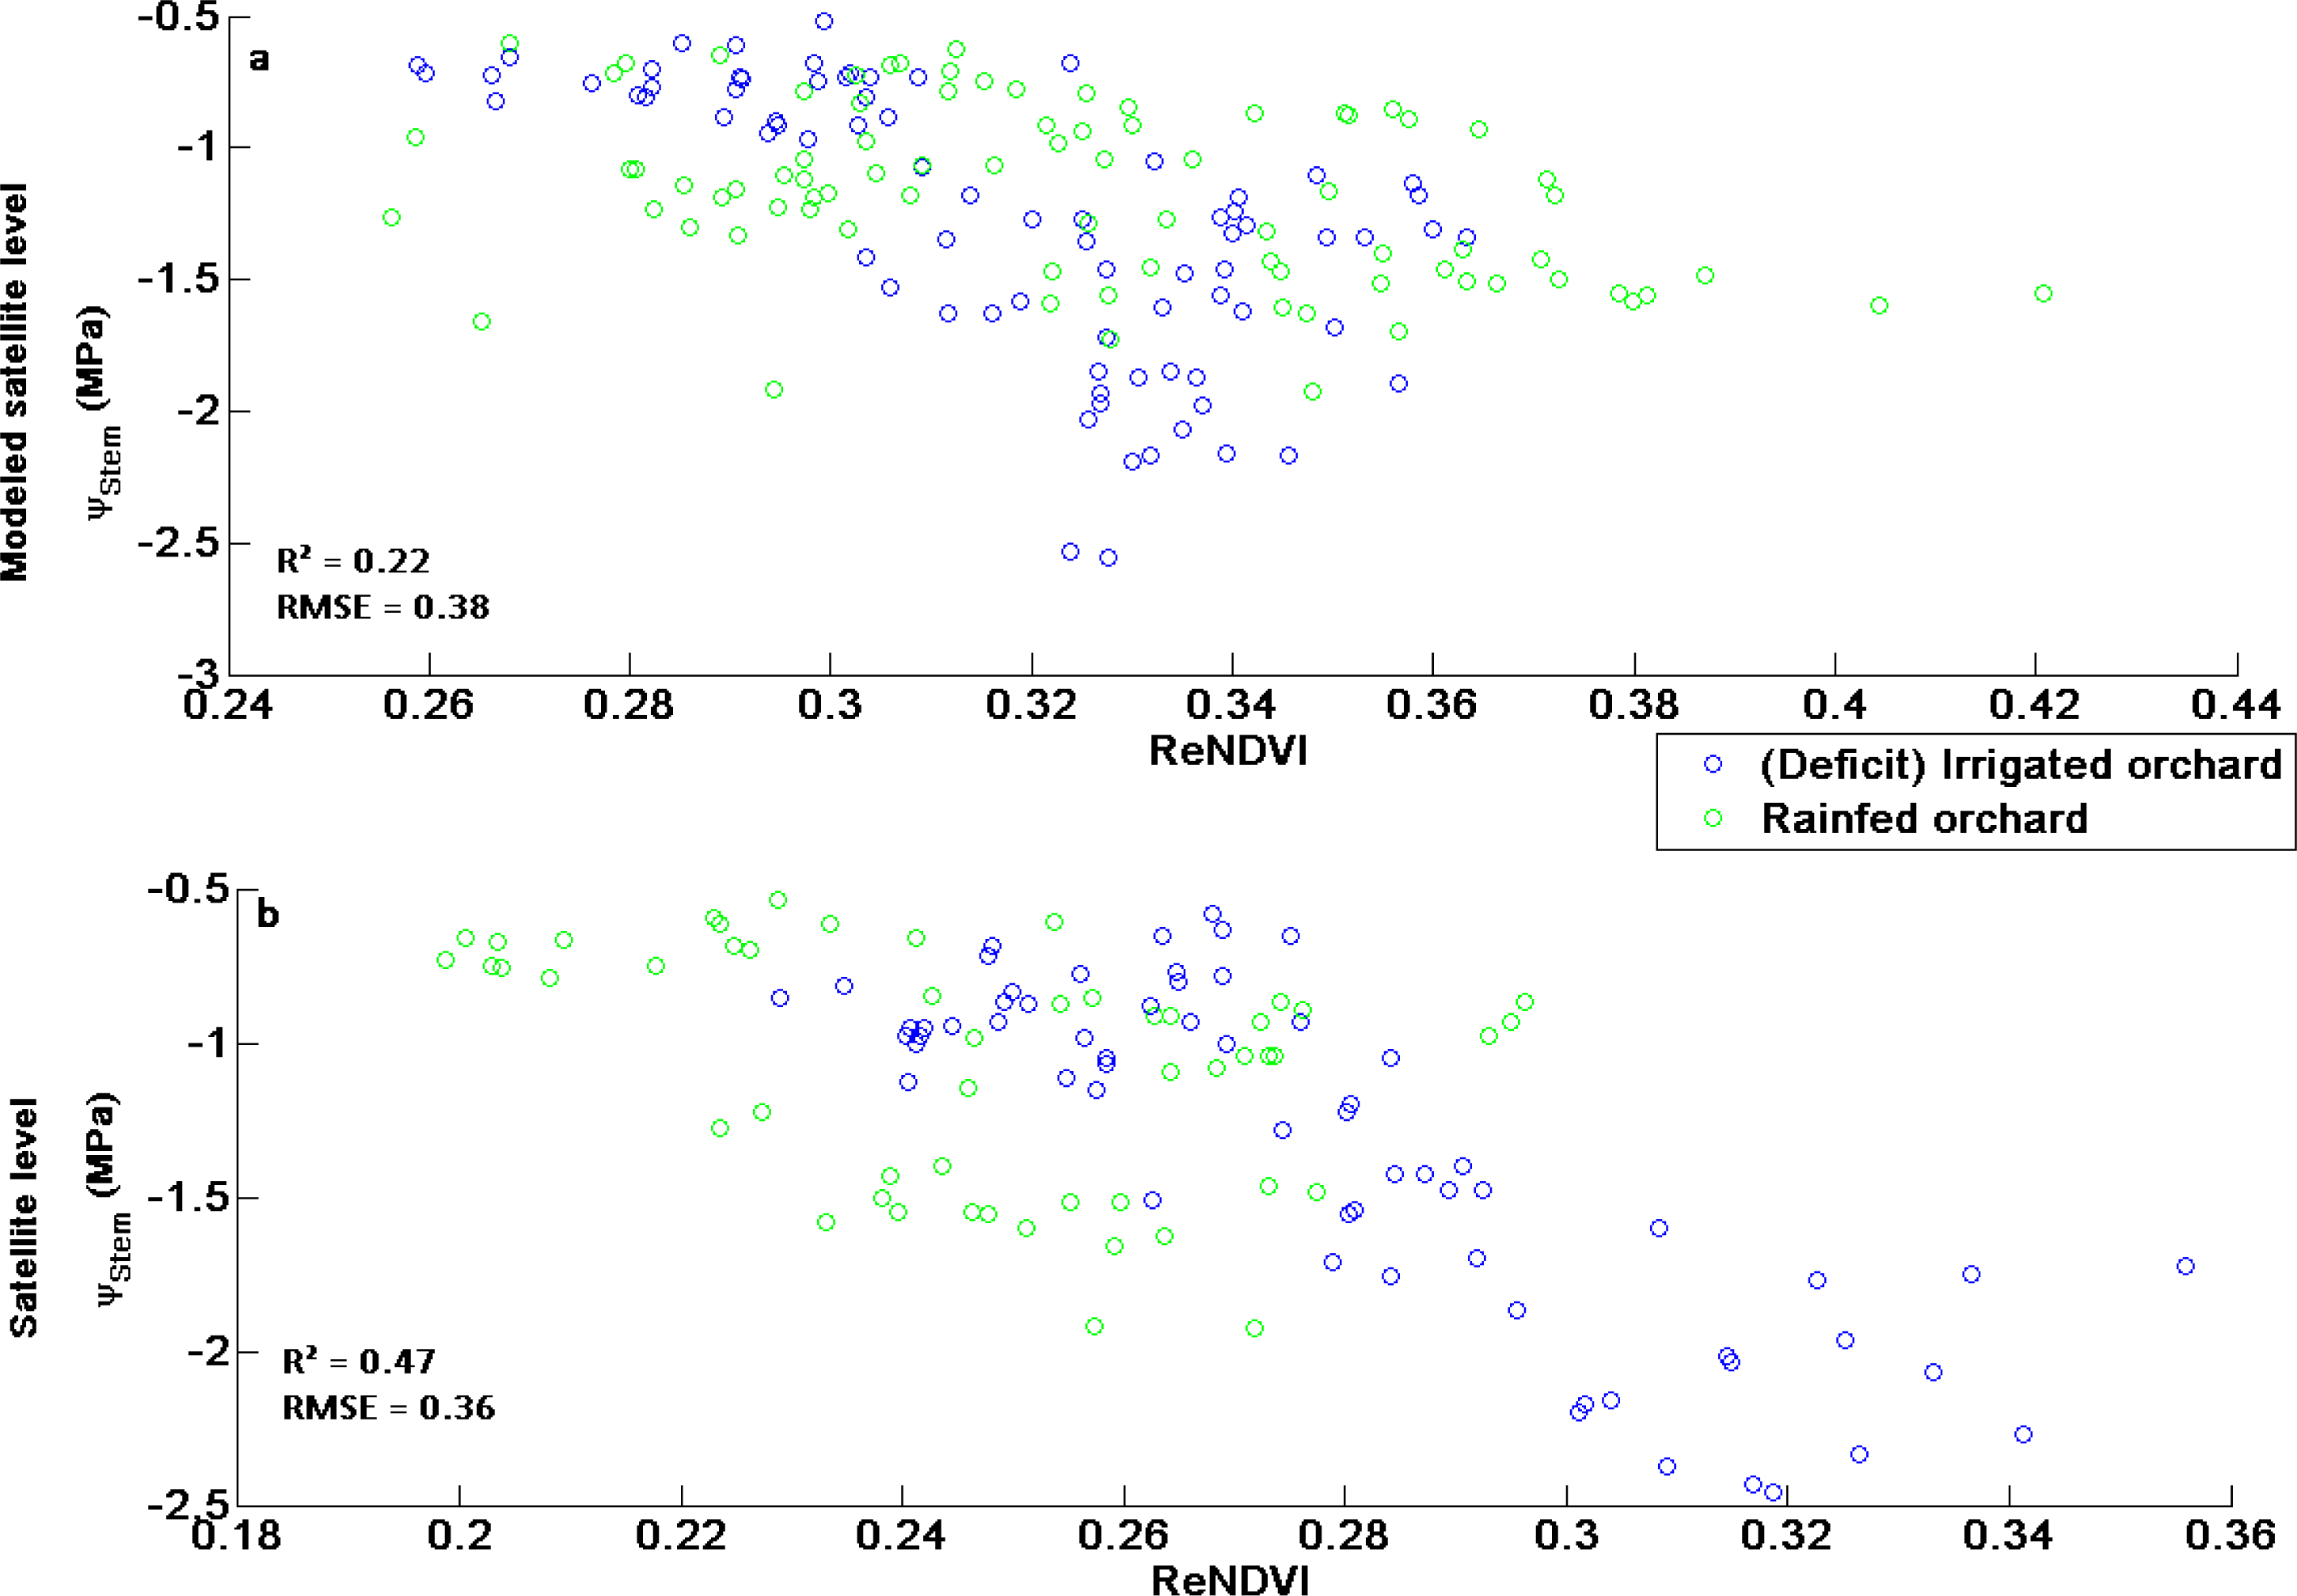
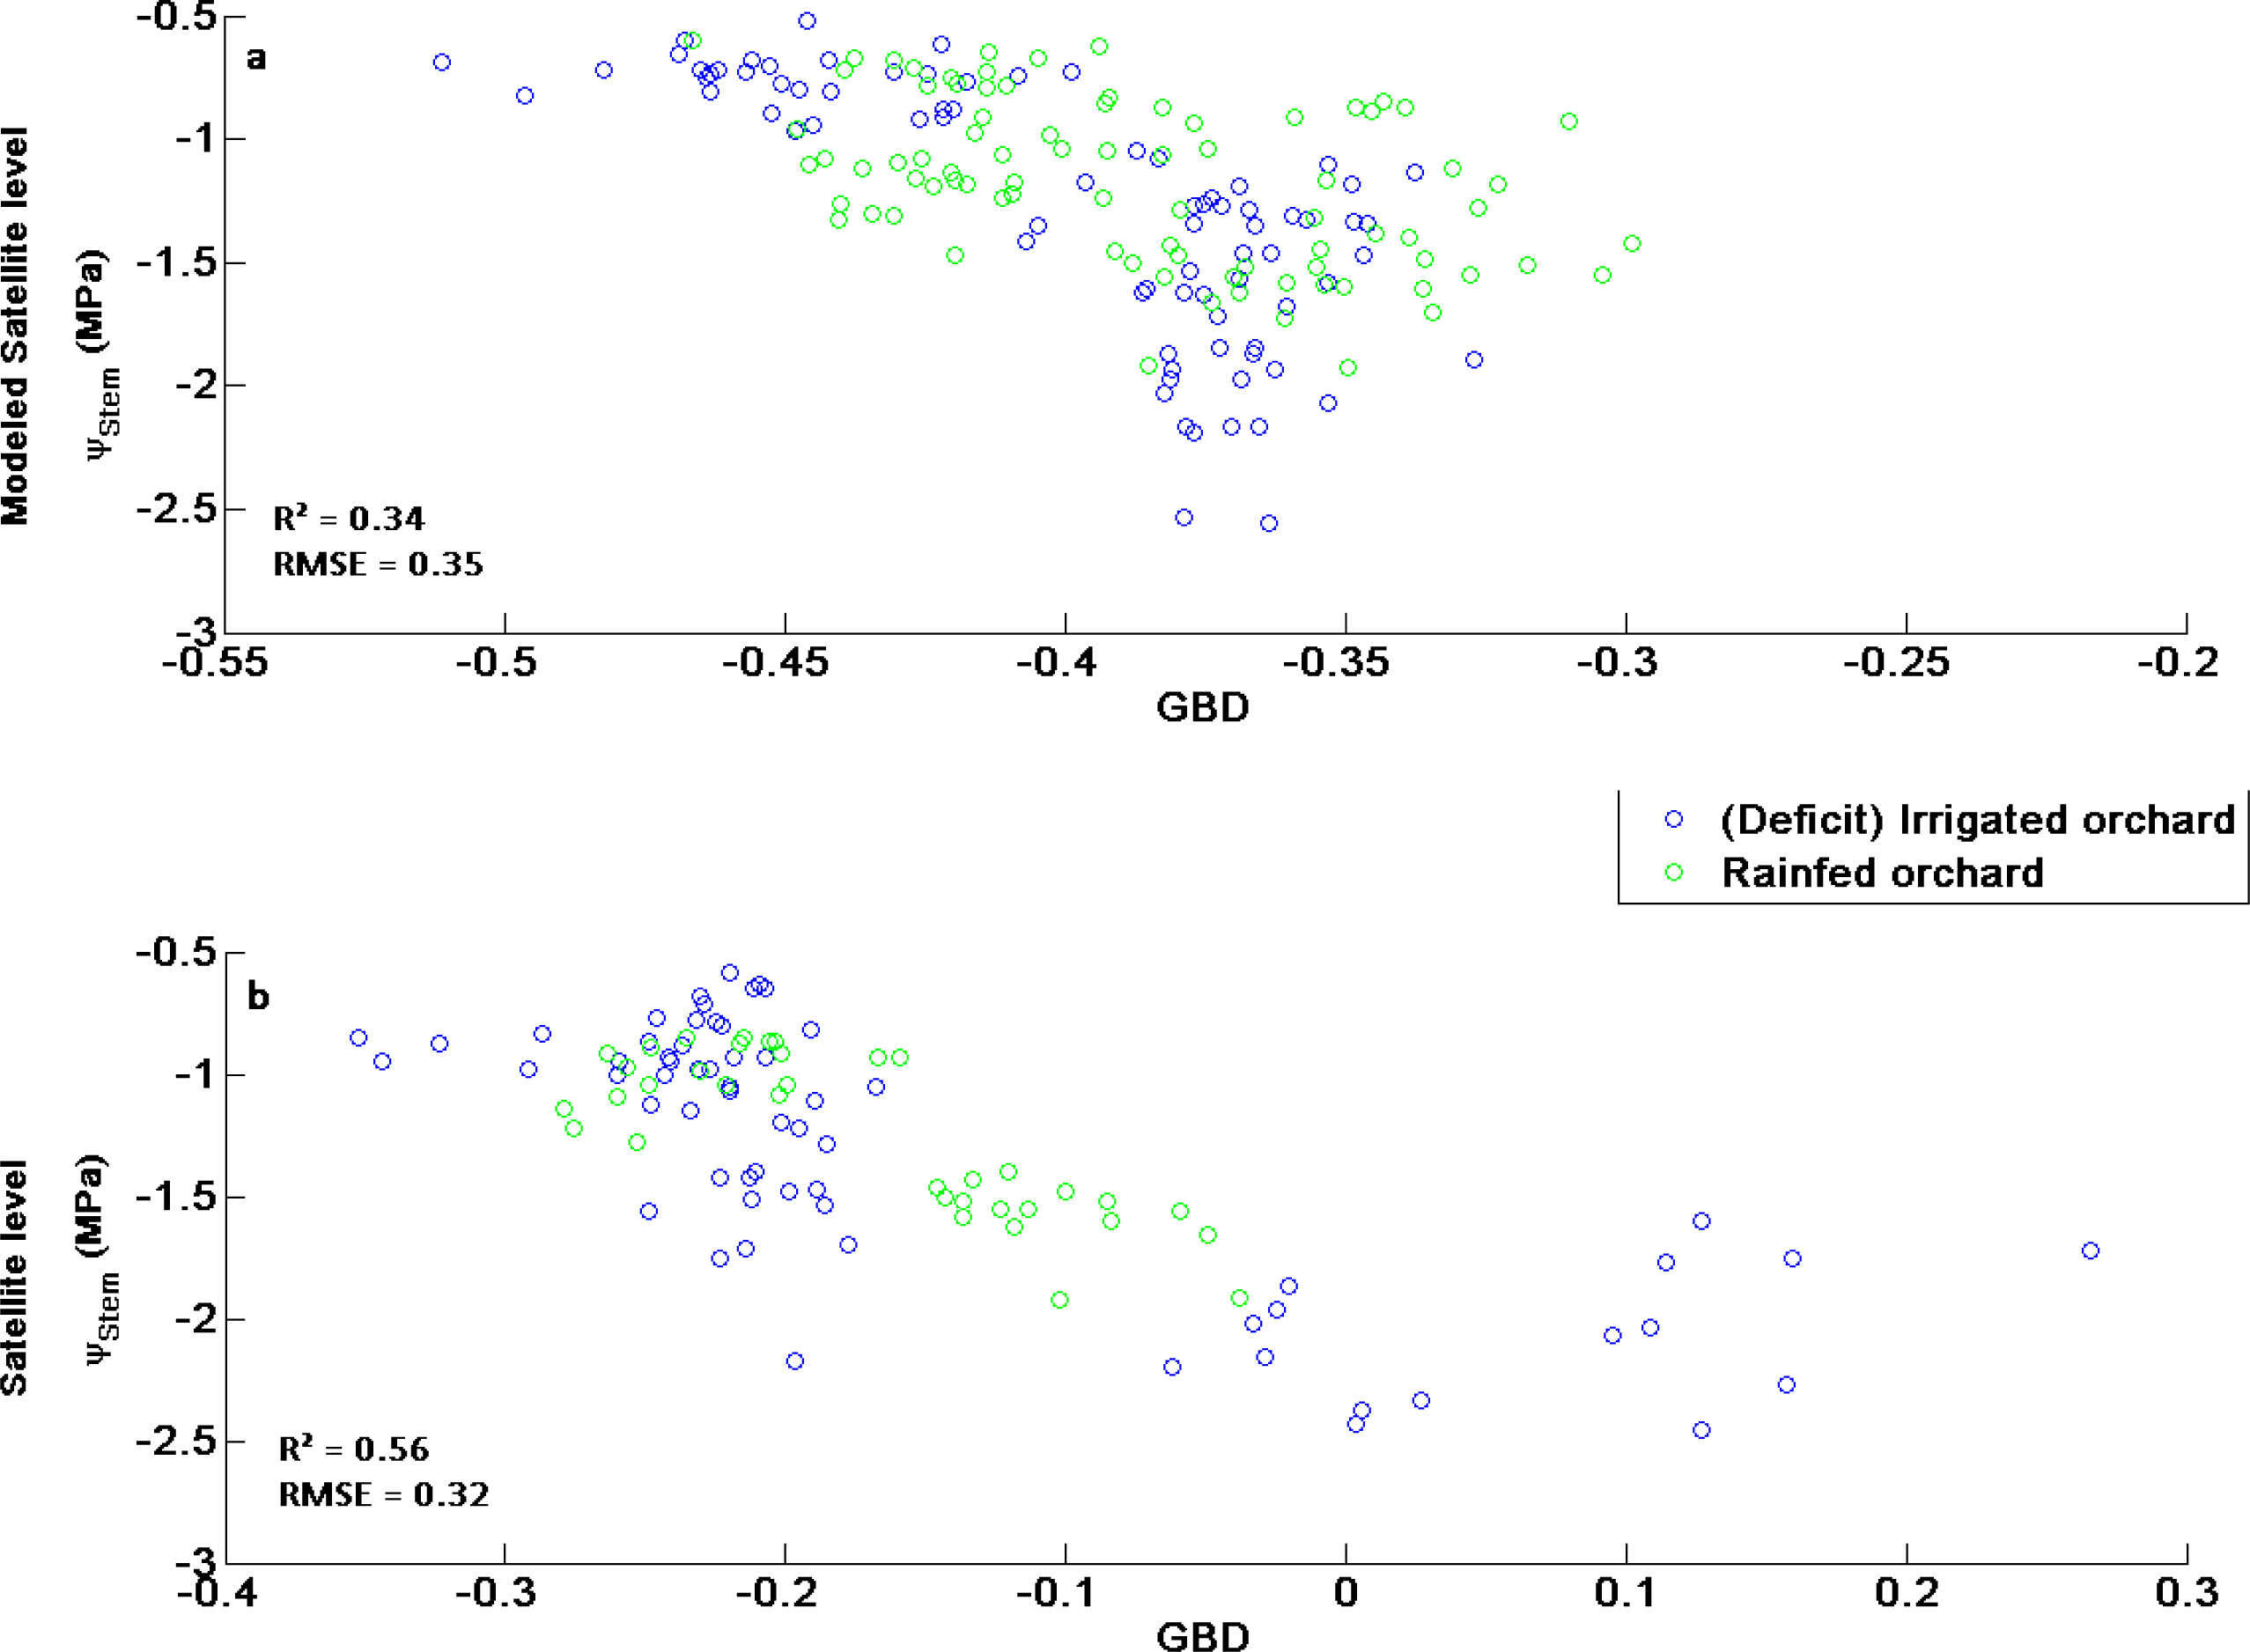
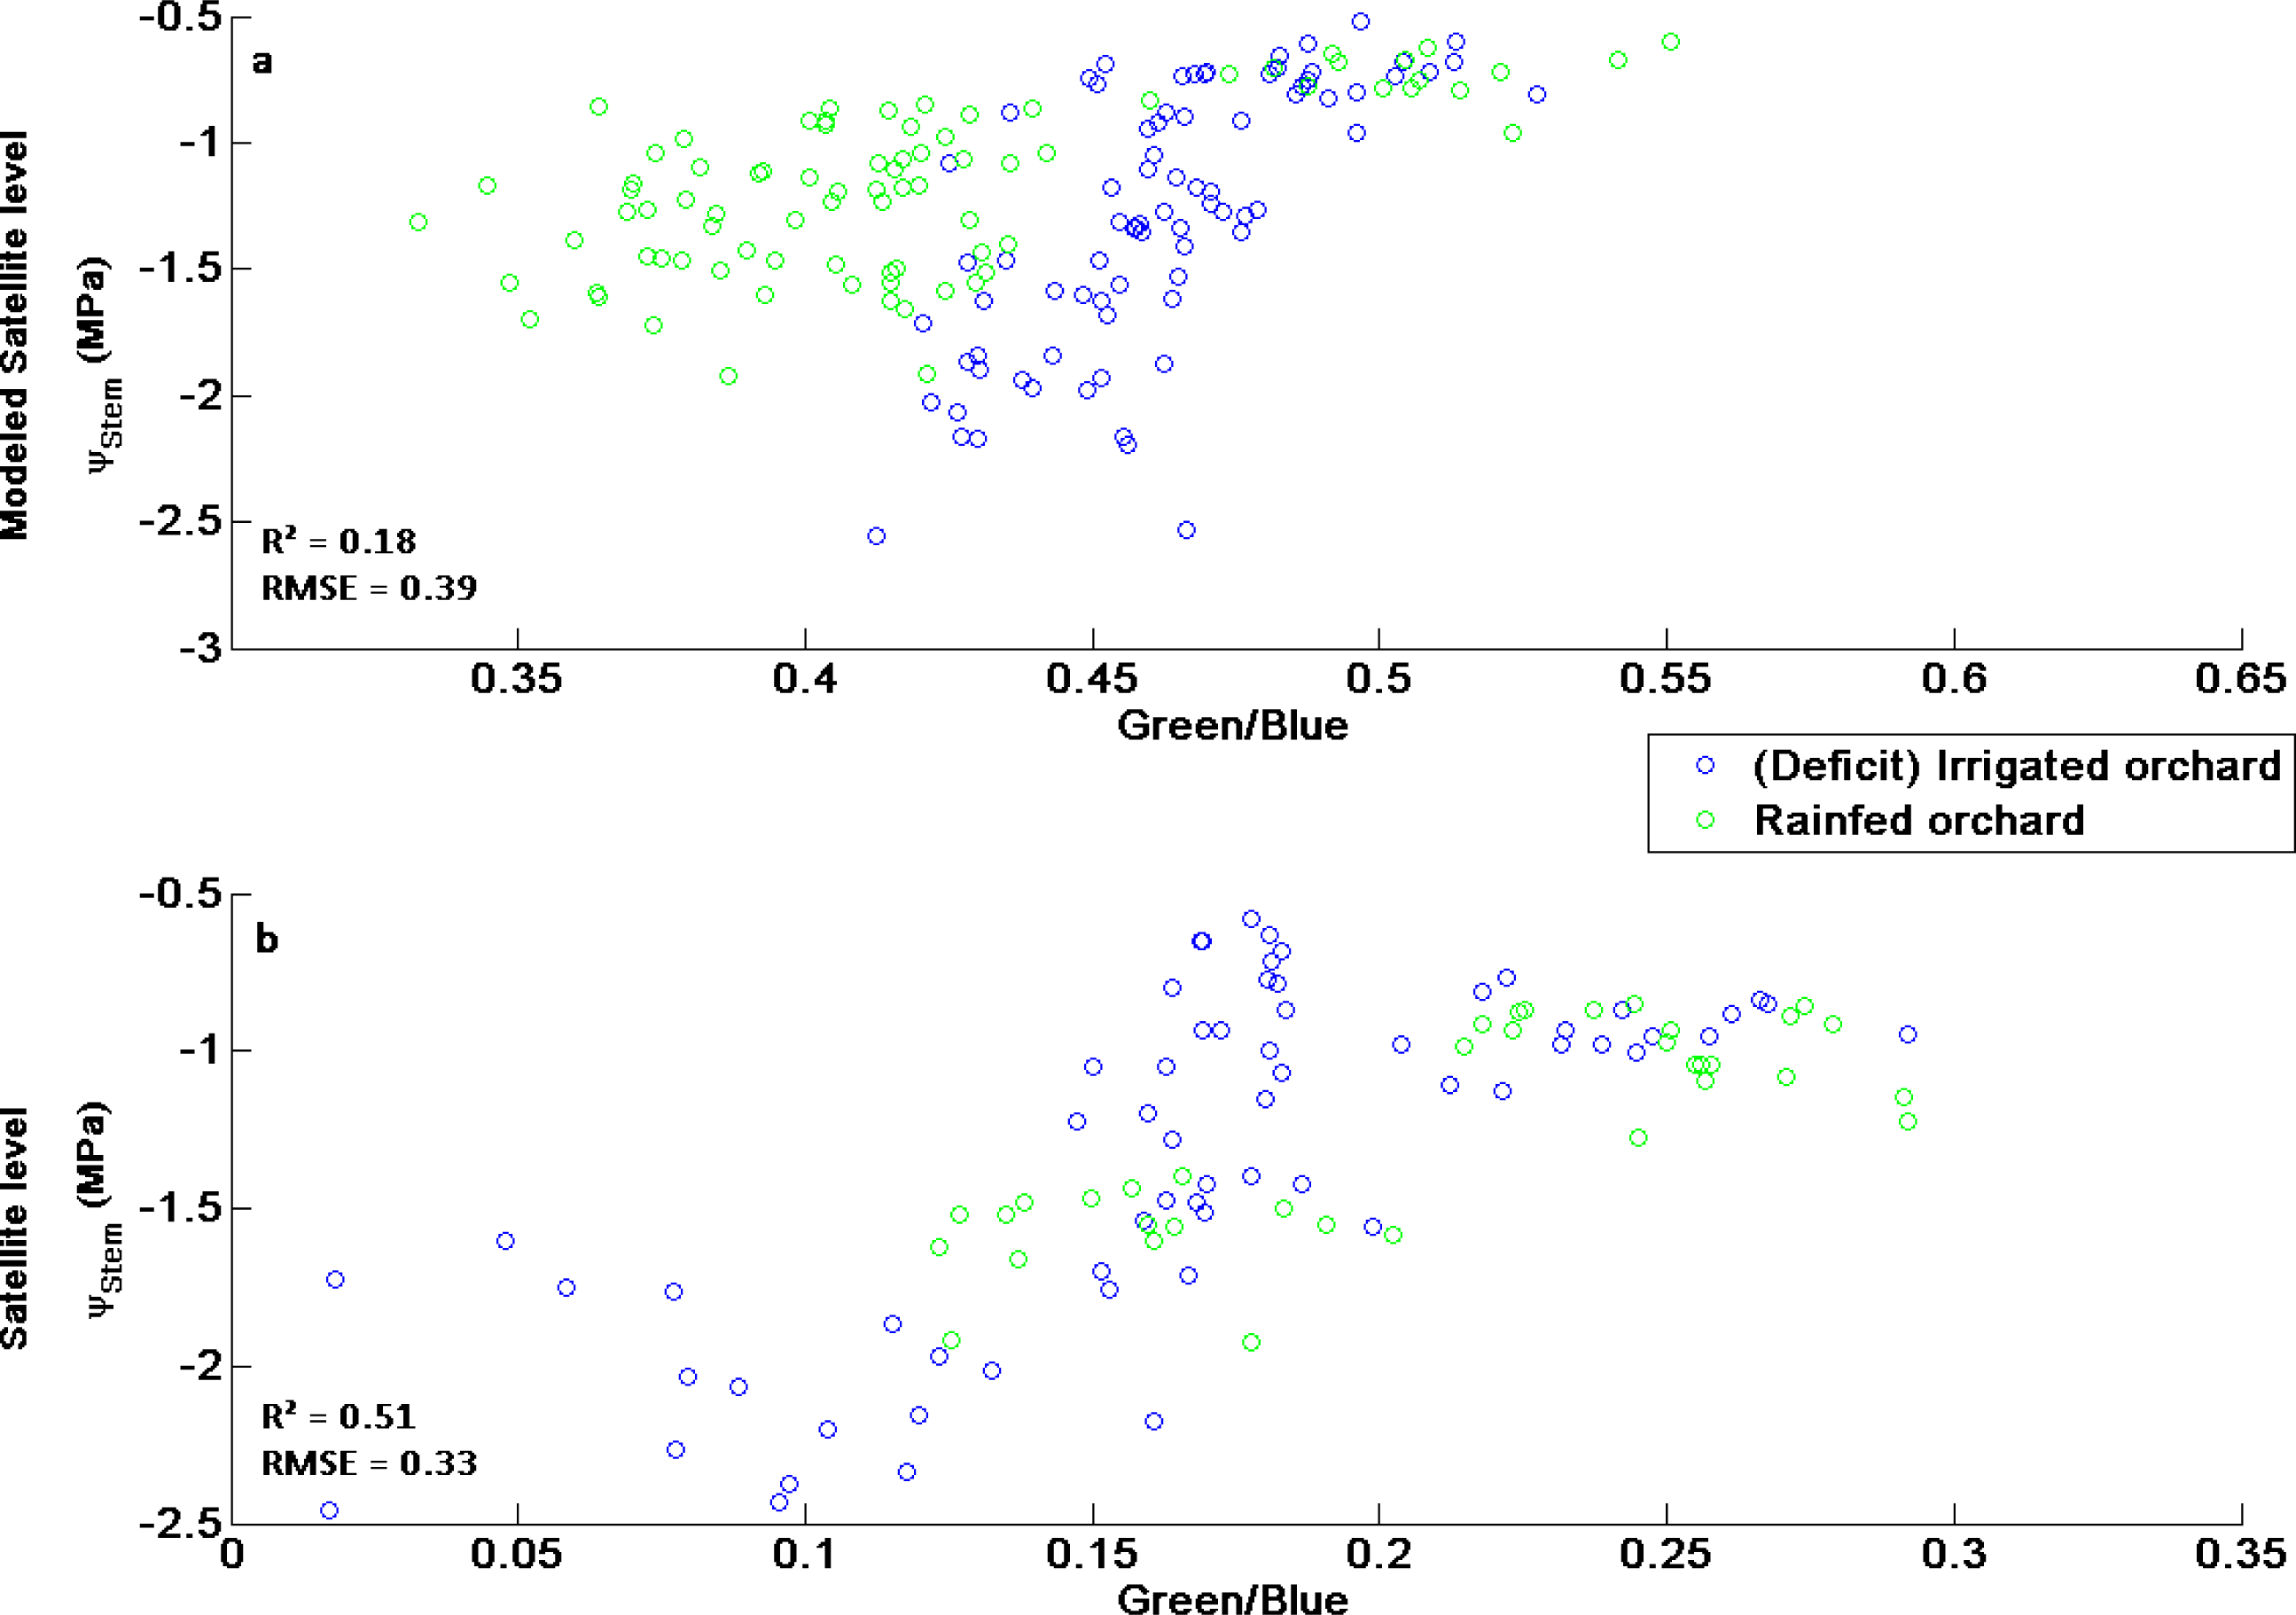
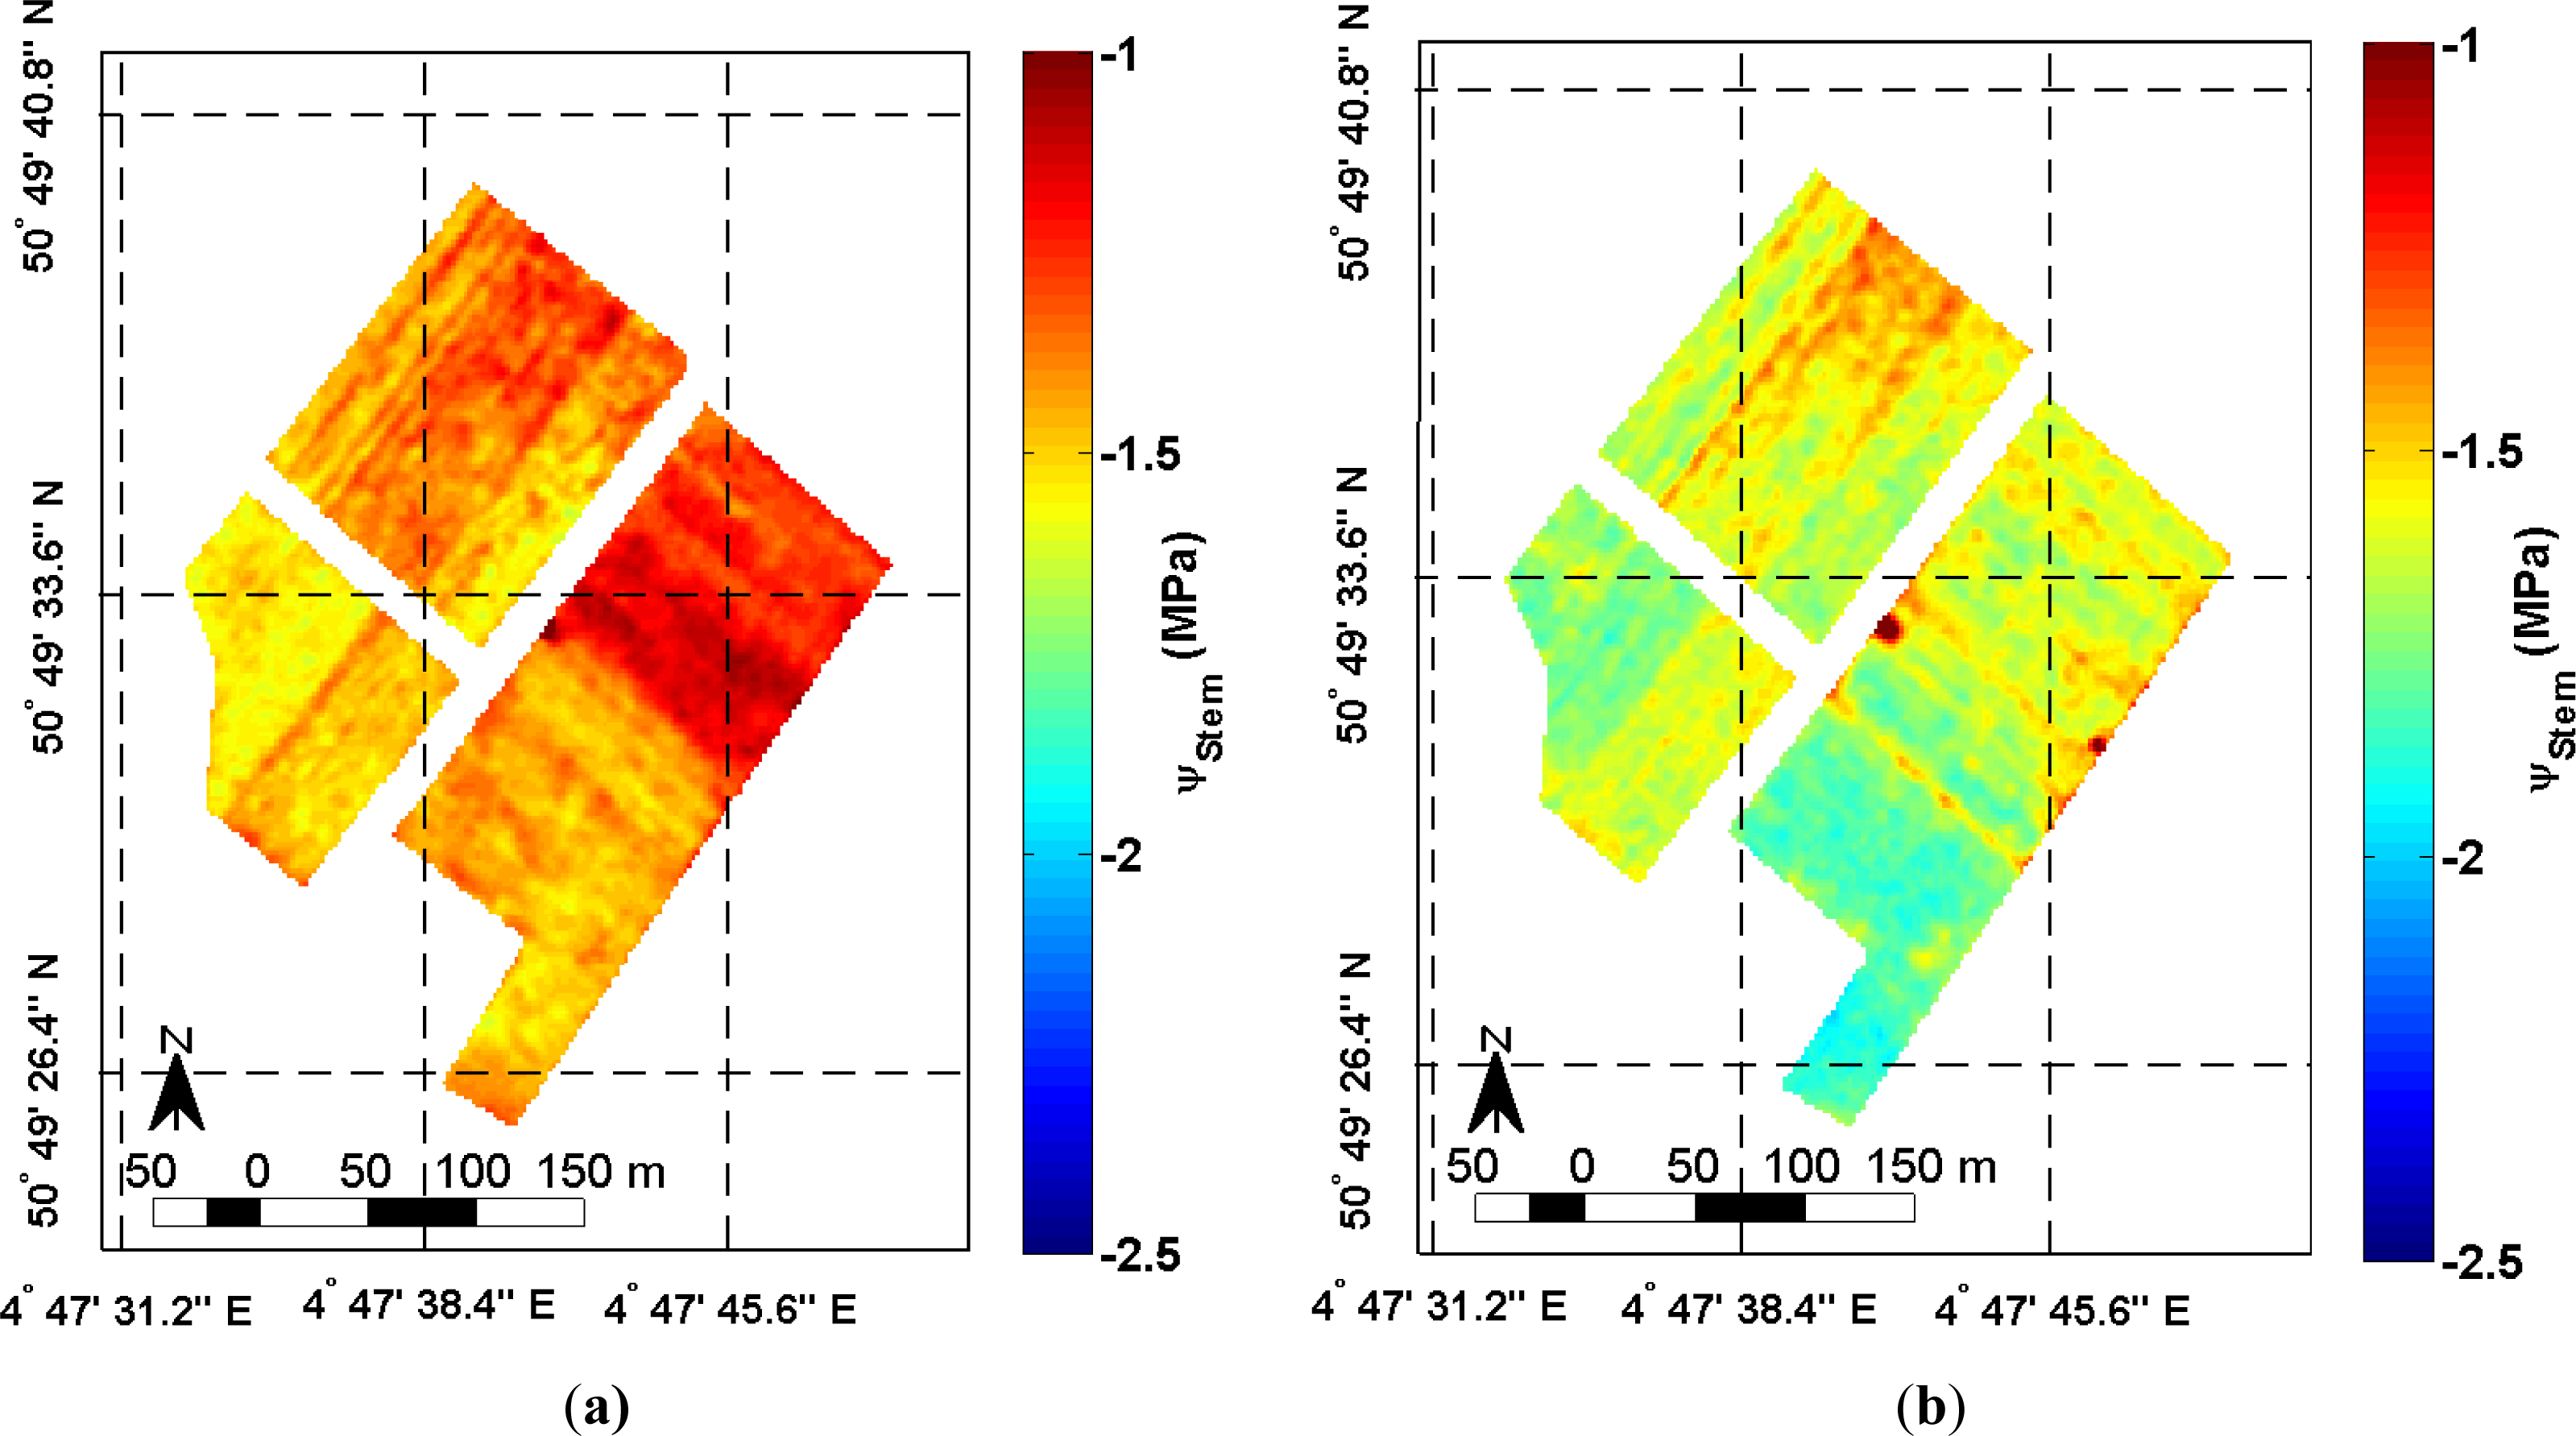
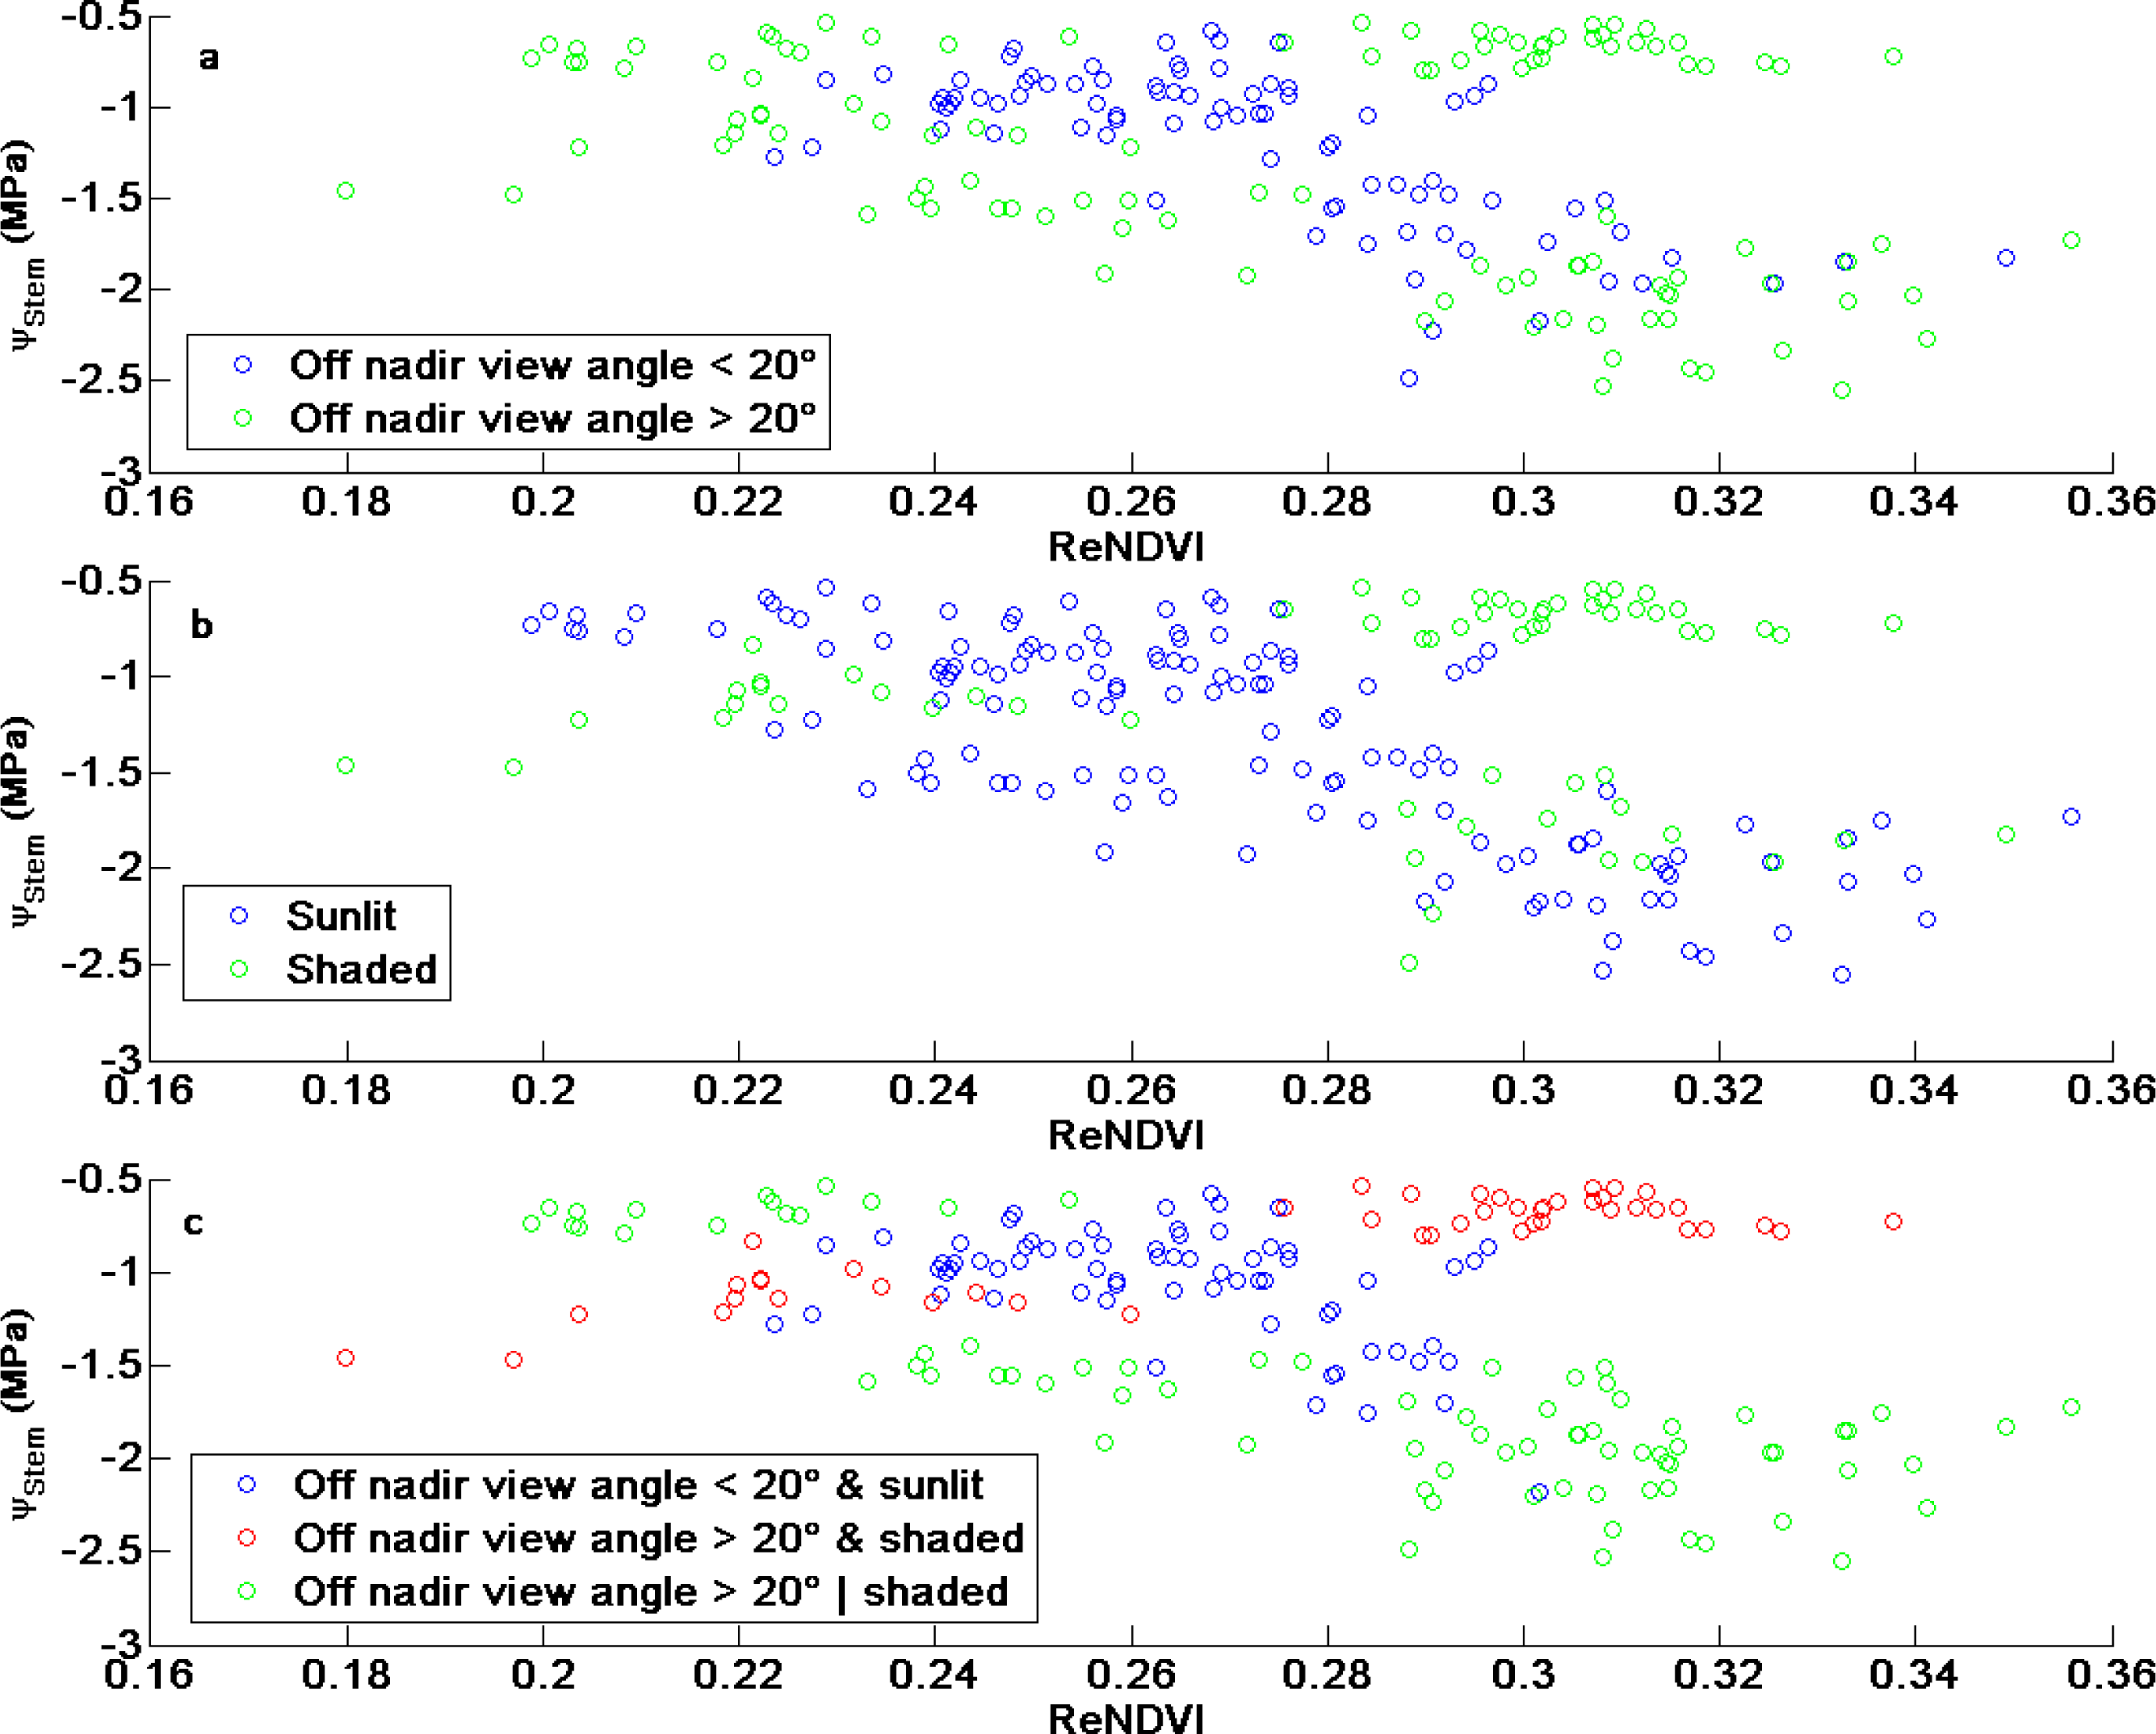
3.3. Satellite Level
4. Discussion
4.1. Potential of High Spatial and Multispectral Satellite Derived Ψstem Estimation
4.2. Limitations of High Spatial and Multispectral Satellite Imagery
5. Conclusions
Acknowledgments
Conflicts of Interest
References
- Janssens, P.; Deckers, T.; Elsen, F.; Elsen, A.; Schoofs, H.; Verjans, W.; Vandendriessche, H. Sensitivity of root pruned ‘Conference’ pear to water deficit in a temperate climate. Agric. Water Manag 2011, 99, 58–66. [Google Scholar]
- Pinter, P.J., Jr.; Hatfield, J.L.; Schepers, J.S.; Barnes, E.M.; Moran, M.S.; Daughtry, C.S.T.; Upchurch, D.R. Remote sensing for crop management. Photogramm. Eng. Remote Sens. 2003, 69. [Google Scholar] [CrossRef]
- Perry, E.M.; Dezzani, R.J.; Seavert, C.F.; Pierce, F.J. Spatial variation in tree characteristics and yield in a pear orchard. Precis. Agric 2010, 11, 42–60. [Google Scholar]
- Dorigo, W.A.; Zurita-Milla, R.; de Wit, A.J.W.; Brazile, J.; Singh, R.; Schaepman, M.E. A review on reflective remote sensing and data assimilation techniques for enhanced agroecosystem modeling. Int. J. Appl. Earth Obs. Geoinf 2007, 9, 165–193. [Google Scholar]
- Govender, M.; Dye, P.J.; Weiersbye, I.M.; Witkowski, E.T.F.; Ahmed, F. Review of commonly used remote sensing and ground-based technologies to measure plant water stress. Water SA 2009, 35, 741–752. [Google Scholar]
- Sepulcre-Canto, G.; Zarco-Tejada, P.J.; Jimenez-Munoz, J.C.; Sobrino, J.A.; Soriano, M.A.; Fereres, E.; Vega, V.; Pastor, M. Monitoring yield and fruit quality parameters in open-canopy tree crops under water stress. Implications for ASTER. Remote Sens. Environ 2007, 107, 455–470. [Google Scholar]
- Dzikiti, S.; Verreynne, J.S.; Stuckens, J.; Strever, A.; Verstraeten, W.W.; Swennen, R.; Coppin, P. Determining the water status of Satsuma mandarin trees [Citrus Unshiu Marcovitch] using spectral indices and by combining hyperspectral and physiological data. Agric. For. Meteorol 2010, 150, 369–379. [Google Scholar]
- Stuckens, J.; Verstraeten, W.W.; Delalieux, S.; Swennen, R.; Coppin, P. A dorsiventral leaf radiative transfer model: Development, validation and improved model inversion techniques. Remote Sens. Environ 2009, 113, 2560–2573. [Google Scholar]
- Acevedo-Opazo, C.; Tisseyre, B.; Guillaume, S.; Ojeda, H. The potential of high spatial resolution information to define within-vineyard zones related to vine water status. Precis. Agric 2008, 9, 285–302. [Google Scholar]
- Serrano, L.; González-Flor, C.; Gorchs, G. Assessment of grape yield and composition using the reflectance based Water Index in Mediterranean rainfed vineyards. Remote Sens. Environ 2012, 118, 249–258. [Google Scholar] [Green Version]
- Naor, A.; Gal, Y.; Peres, M. The inherent variability of water stress indicators in apple, nectarine and pear orchards, and the validity of a leaf-selection procedure for water potential measurements. Irrig. Sci 2006, 24, 129–135. [Google Scholar]
- McCutchan, H.; Shackel, K.A. Stem-water potential as a sensitive indicator of water stress in prune trees (Prunus domestica L. cv. French). J. Am. Soc. Hortic. Sci 1992, 117, 607–611. [Google Scholar]
- Suárez, L.; Zarco-Tejada, P.J.; Sepulcre-Cantó, G.; Pérez-Priego, O.; Miller, J.R.; Jiménez-Muñoz, J.C.; Sobrino, J. Assessing canopy PRI for water stress detection with diurnal airborne imagery. Remote Sens. Environ 2008, 112, 560–575. [Google Scholar]
- Stagakis, S.; González-Dugo, V.; Cid, P.; Guillén-Climent, M.L.; Zarco-Tejada, P.J. Monitoring water stress and fruit quality in an orange orchard under regulated deficit irrigation using narrow-band structural and physiological remote sensing indices. ISPRS J. Photogramm. Remote Sens 2012, 71, 47–61. [Google Scholar]
- Marshall, G.J.; Dowdeswell, J.A.; Rees, W.G. The spatial and temporal effect of cloud cover on the acquisition of high quality landsat imagery in the european arctic sector. Remote Sens. Environ 1994, 50, 149–160. [Google Scholar]
- Moran, M.S.; Fitzgerald, G.J.; Rango, A.; Walthall, C.L.; Barnes, E.D.; Bausch, W.C.; Clarke, T.R.; Daughtry, C.S.; Everitt, J.H.; Hatfield, J.L.; et al. Sensor development and radiometric correction for agricultural applications. Photogramm. Eng. Remote Sens 2003, 69, 705–718. [Google Scholar]
- Ceccato, P.; Flasse, S.; Grégoire, J.-M. Designing a spectral index to estimate vegetation water content from remote sensing data: Part 2. Validation and applications. Remote Sens. Environ 2002, 82, 198–207. [Google Scholar]
- Jackson, R.D.; Idso, S.B.; Reginato, R.J.; Pinter, P.J., Jr. Canopy temperature as a crop water stress indicator. Water Resour. Res 1981, 17, 1133–1138. [Google Scholar]
- Zhao, F.; Gu, X.; Verhoef, W.; Wang, Q.; Yu, T.; Liu, Q.; Huang, H.; Qin, W.; Chen, L.; Zhao, H. A spectral directional reflectance model of row crops. Remote Sens. Environ 2010, 114, 265–285. [Google Scholar]
- Haboudane, D.; Miller, J.R.; Pattey, E.; Zarco-Tejada, P.J.; Strachan, I.B. Hyperspectral vegetation indices and novel algorithms for predicting green LAI of crop canopies: Modeling and validation in the context of precision agriculture. Remote Sens. Environ 2004, 90, 337–352. [Google Scholar]
- Sansavini, S.; Musacchi, S. Canopy architecture, training and pruning in the Modern European pear orchards: An overview. Acta Hort 1994, 367, 152–172. [Google Scholar]
- Allen, R.G.; Pereira, L.S.; Raes, D.; Smith, M. Crop Evapotranspiration—Guidelines for Computing Crop Water Requirements—FAO Irrigation and Drainage Paper 56; Food and Agriculture Organization of the United Nations: Rome, Italy, 1998. [Google Scholar]
- Mitchell, P.D.; Jerie, P.H.; Chalmers, D.J. Effects of regulated water deficits on pear tree growth, flowering, fruit growth, and yield. J. Am. Soc. Hortic. Sci 1984, 109, 604–606. [Google Scholar]
- Scholander, P.F.; Bradstreet, E.D.; Hemmingsen, E.A.; Hammel, H.T. Sap pressure in vascular plants. Science 1965, 148, 339–346. [Google Scholar]
- Begg, J.E.; Turner, N.C. Water potential gradients in field tobacco. Plant Physiol 1970, 46, 343–346. [Google Scholar]
- Savitsky, A.; Golay, M.J.E. Smoothing and differentiation of data by simplified least squares procedures. Anal. Chem 1964, 36, 1627–1639. [Google Scholar]
- Radiometric Use of WorldView-2 Imagery. Available online: http://www.digitalglobe.com/sites/default/files/Radiometric_Use_of_WorldView-2_Imagery%20%281%29.pdf (accessed on 3 December 2013).
- Adler-Golden, S.; Berk, A.; Bernstein, L.S.; Richtsmeier, S.; Acharya, P.K.; Matthew, M.W.; Anderson, G.P.; Allred, C.L.; Jeong, L.S.; Chetwynd, J.H. Flaash, a Modtran4 Atmospheric Correction Package for Hyperspectral Data Retrievals and Simulations. In Summaries of the Seventh JPL Airborne Earth Science Workshop January 12–16, 1998; Jet Propulsion Laboratory, National Aeronautics and Space Administration: Pasadena, CA, USA, 1998. [Google Scholar]
- Grodecki, J.; Dial, G. Block adjustment of high-resolution satellite images described by rational polynomials. Photogramm. Eng. Remote Sens. 2003, 69. [Google Scholar] [CrossRef]
- Araujo, F.; Williams, L.E.; Grimes, D.W.; Matthews, M.A. A comparative study of young ‘Thompson Seedless’ grapevines under drip and furrow irrigation. I. Root and soil water distributions. Sci. Hortic 1995, 60, 235–249. [Google Scholar]
- Fernandez, J.E.; Moreno, F.; Cabrera, F.; Arrue, J.L.; Martın-Aranda, J. Drip irrigation, soil characteristics and the root distribution and root activity of olive trees. Plant Soil 1991, 133, 239–251. [Google Scholar]
- van Leeuwen, W.J.D.; Orr, B.J.; Marsh, S.E.; Herrmann, S.M. Multi-sensor NDVI data continuity: Uncertainties and implications for vegetation monitoring applications. Remote Sens. Environ 2006, 100, 67–81. [Google Scholar]
- Blackburn, G.A. Hyperspectral remote sensing of plant pigments. J. Exp. Bot 2007, 58, 855–67. [Google Scholar]
- Ceccato, P.; Flasse, S.; Tarantola, S.; Jacquemoud, S.; Grégoire, J.-M. Detecting vegetation leaf water content using reflectance in the optical domain. Remote Sens. Environ 2001, 77, 22–33. [Google Scholar]
- Gao, B. NDWI—A normalized difference water index for remote sensing of vegetation liquid water from space. Remote Sens. Environ 1996, 58, 257–266. [Google Scholar]
- Hunt, E.R., Jr.; Rock, B.N. Detection of changes in leaf water content using Near- and Middle-infrared reflectances. Remote Sens. Environ 1989, 30, 43–54. [Google Scholar]
- Danson, F.M.; Steven, M.D.; Malthus, T.J.; Clark, J.A. High-spectral resolution data for determining leaf water content. Int. J. Remote Sens 1992, 13, 461–470. [Google Scholar]
- Mogensen, V.O.; Jensen, C.R.; Mortensen, G.; Thage, J.H.; Koribidis, J.; Ahmed, A. Spectral reflectance index as an indicator of drought of field grown oilseed rape (Brassica napus L.). Eur. J. Agron 1996, 5, 125–135. [Google Scholar]
- Gamon, J.A.; Serrano, L.; Surfus, J.S. The photochemical reflectance index: An optical indicator of photosynthetic radiation use efficiency across species, functional types, and nutrient levels. Oecologia 1997, 112, 492–501. [Google Scholar]
- Blackburn, G.A. Relationships between spectral reflectance and pigment concentrations in stacks of deciduous broadleaves. Remote Sens. Environ 1999, 70, 224–237. [Google Scholar]
- Horler, D.N.H.; Dockray, M.; Barber, J. The red edge of plant reflectance. Int. J. Remote Sens 1983, 4, 273–288. [Google Scholar]
- Stagakis, S.; Markos, N.; Sykioti, O.; Kyparissis, A. Monitoring canopy biophysical and biochemical parameters in ecosystem scale using satellite hyperspectral imagery: An application on a Phlomis fruticosa Mediterranean ecosystem using multiangular CHRIS/PROBA observations. Remote Sens. Environ 2010, 114, 977–994. [Google Scholar]
- Lakso, A.N. The effects of water stress on physiological processes in fruit crops. Acta Hort 1984, 171, 275–290. [Google Scholar]
- Guerfel, M.; Baccouri, O.; Boujnah, D.; Chaïbi, W.; Zarrouk, M. Impacts of water stress on gas exchange, water relations, chlorophyll content and leaf structure in the two main Tunisian olive (Olea europaea L.) cultivars. Sci. Hortic 2009, 119, 257–263. [Google Scholar]
- Haas, R.H.; Schell, J.A. Monitoring the Vernal Advancement and Retrogradation (greenwave Effect) of Natural Vegetation; Remote Sensing Center, Texas A & M University: Denton, TX, USA, 1974. [Google Scholar]
- Penuelas, J.; Filella, I.; Biel, C.; Serrano, L.; Savé, R. The reflectance at the 950–970 nm region as an indicator of plant water status. Int. J. Remote Sens. 1993, 14, 1887–1905. [Google Scholar]
- Zarco-Tejada, P.J.; Miller, J.R.; Morales, A.; Berjón, A.; Agüera, J. Hyperspectral indices and model simulation for chlorophyll estimation in open-canopy tree crops. Remote Sens. Environ 2004, 90, 463–476. [Google Scholar]
- Somers, B.; Delalieux, S.; Verstraeten, W.; Coppin, P. A conceptual framework for the simultaneous extraction of sub-pixel spatial extent and spectral characteristics of crops. Photogramm. Eng. Remote Sens 2009, 75, 57–68. [Google Scholar]
- Tits, L.; Somers, B.; Stuckens, J.; Farifteh, J.; Coppin, P. Integration of in situ measured soil status and remotely sensed hyperspectral data to improve plant production system monitoring: Concept, perspectives and limitations. Remote Sens. Environ 2013, 128, 197–211. [Google Scholar]
- Iordache, D.-M.; Tits, L.; Plaza, A.; Bioucas-Dias, J.; Somers, B. A dynamic unmixing framework for site specific monitoring of plant production systems. IEEE J. Sel. Top. Appl. Earth Obs. Remote Sens. 2013. submitted. [Google Scholar]


| Location | Year | DOY of Ψstem Measurements | DOY of Leaf Level Reflectance Measurements | DOY of Canopy Level Reflectance Measurements |
|---|---|---|---|---|
| (Deficit) Irrigated Orchard | 2011 | 133, 140, 146, 167, 193, 215 and 238 | 214 | 141 |
| 2012 | 145, 150, 157, 166, 178, 180, 200, 207, 214, 233 and 242 | 242 | 208 and 214 | |
| 2013 | 159, 166, 170, 183, 187, 194, 205, 215 and 240 | 159, 166, 170, 183, 187, 194, 215 and 240 | 195 and 214 | |
| Rainfed Orchard | 2011 | 132, 141, 151, 179 and 214 | 214 | 178 |
| 2012 | 146, 151, 171, 185, 206, 217, 223 and 236 | 217 | 146 and 207 | |
| 2013 | 156, 163, 193, 199, 214 and 225 | 156, 163, 193, 214 and 225 | 157 and 213 | |
| Location | Year | DOY | Off-nadir Viewing Angle (°) | Satellite Azimuth (°) | Satellite Elevation (°) |
|---|---|---|---|---|---|
| (Deficit) Irrigated Orchard | 2011 | 214 | 10.8 | 45.9 | 78 |
| 2012 | 148 | 2.7 | 181.1 | 86.7 | |
| 232 | 18.9 | 209.8 | 68.6 | ||
| 2013 | 189 | 26.1 | 14.7 | 60.7 | |
| 214 | 25.6 | 107.9 | 61 | ||
| Rainfed Orchard | 2011 | 214 | 4.8 | 68.6 | 84.7 |
| 2012 | 148 | 15 | 199.8 | 72.9 | |
| 232 | 23.7 | 211.1 | 62.9 | ||
| 2013 | 187 | 28 | 99.1 | 58.2 | |
| 214 | 27.4 | 133.5 | 58.7 | ||
© 2013 by the authors; licensee MDPI, Basel, Switzerland This article is an open access article distributed under the terms and conditions of the Creative Commons Attribution license ( http://creativecommons.org/licenses/by/3.0/).
Share and Cite
Van Beek, J.; Tits, L.; Somers, B.; Coppin, P. Stem Water Potential Monitoring in Pear Orchards through WorldView-2 Multispectral Imagery. Remote Sens. 2013, 5, 6647-6666. https://doi.org/10.3390/rs5126647
Van Beek J, Tits L, Somers B, Coppin P. Stem Water Potential Monitoring in Pear Orchards through WorldView-2 Multispectral Imagery. Remote Sensing. 2013; 5(12):6647-6666. https://doi.org/10.3390/rs5126647
Chicago/Turabian StyleVan Beek, Jonathan, Laurent Tits, Ben Somers, and Pol Coppin. 2013. "Stem Water Potential Monitoring in Pear Orchards through WorldView-2 Multispectral Imagery" Remote Sensing 5, no. 12: 6647-6666. https://doi.org/10.3390/rs5126647