Distribution of Actual Evapotranspiration over Qaidam Basin, an Arid Area in China

Abstract
:1. Introduction
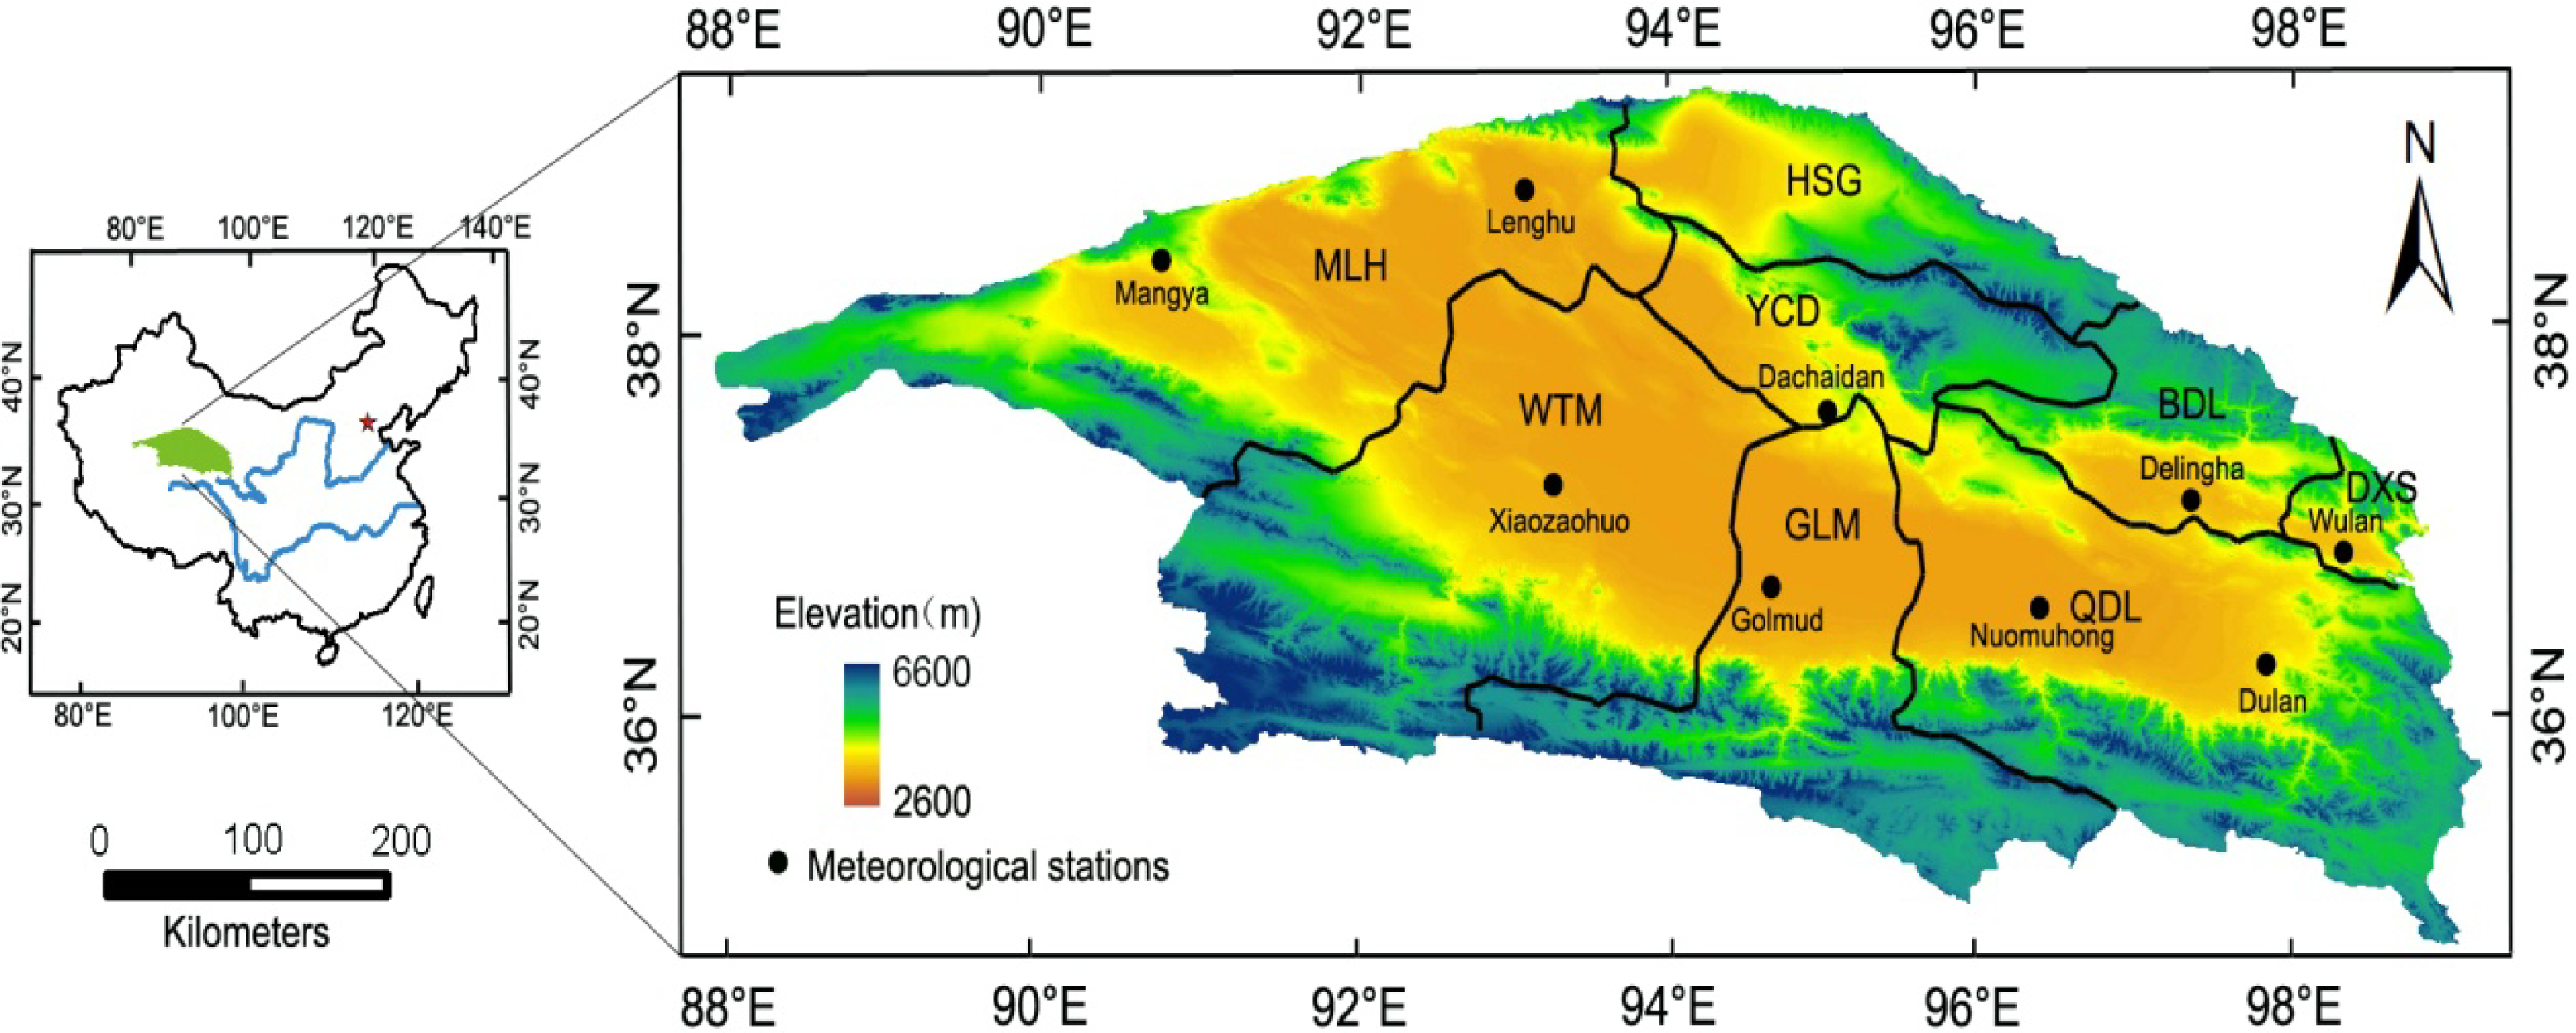
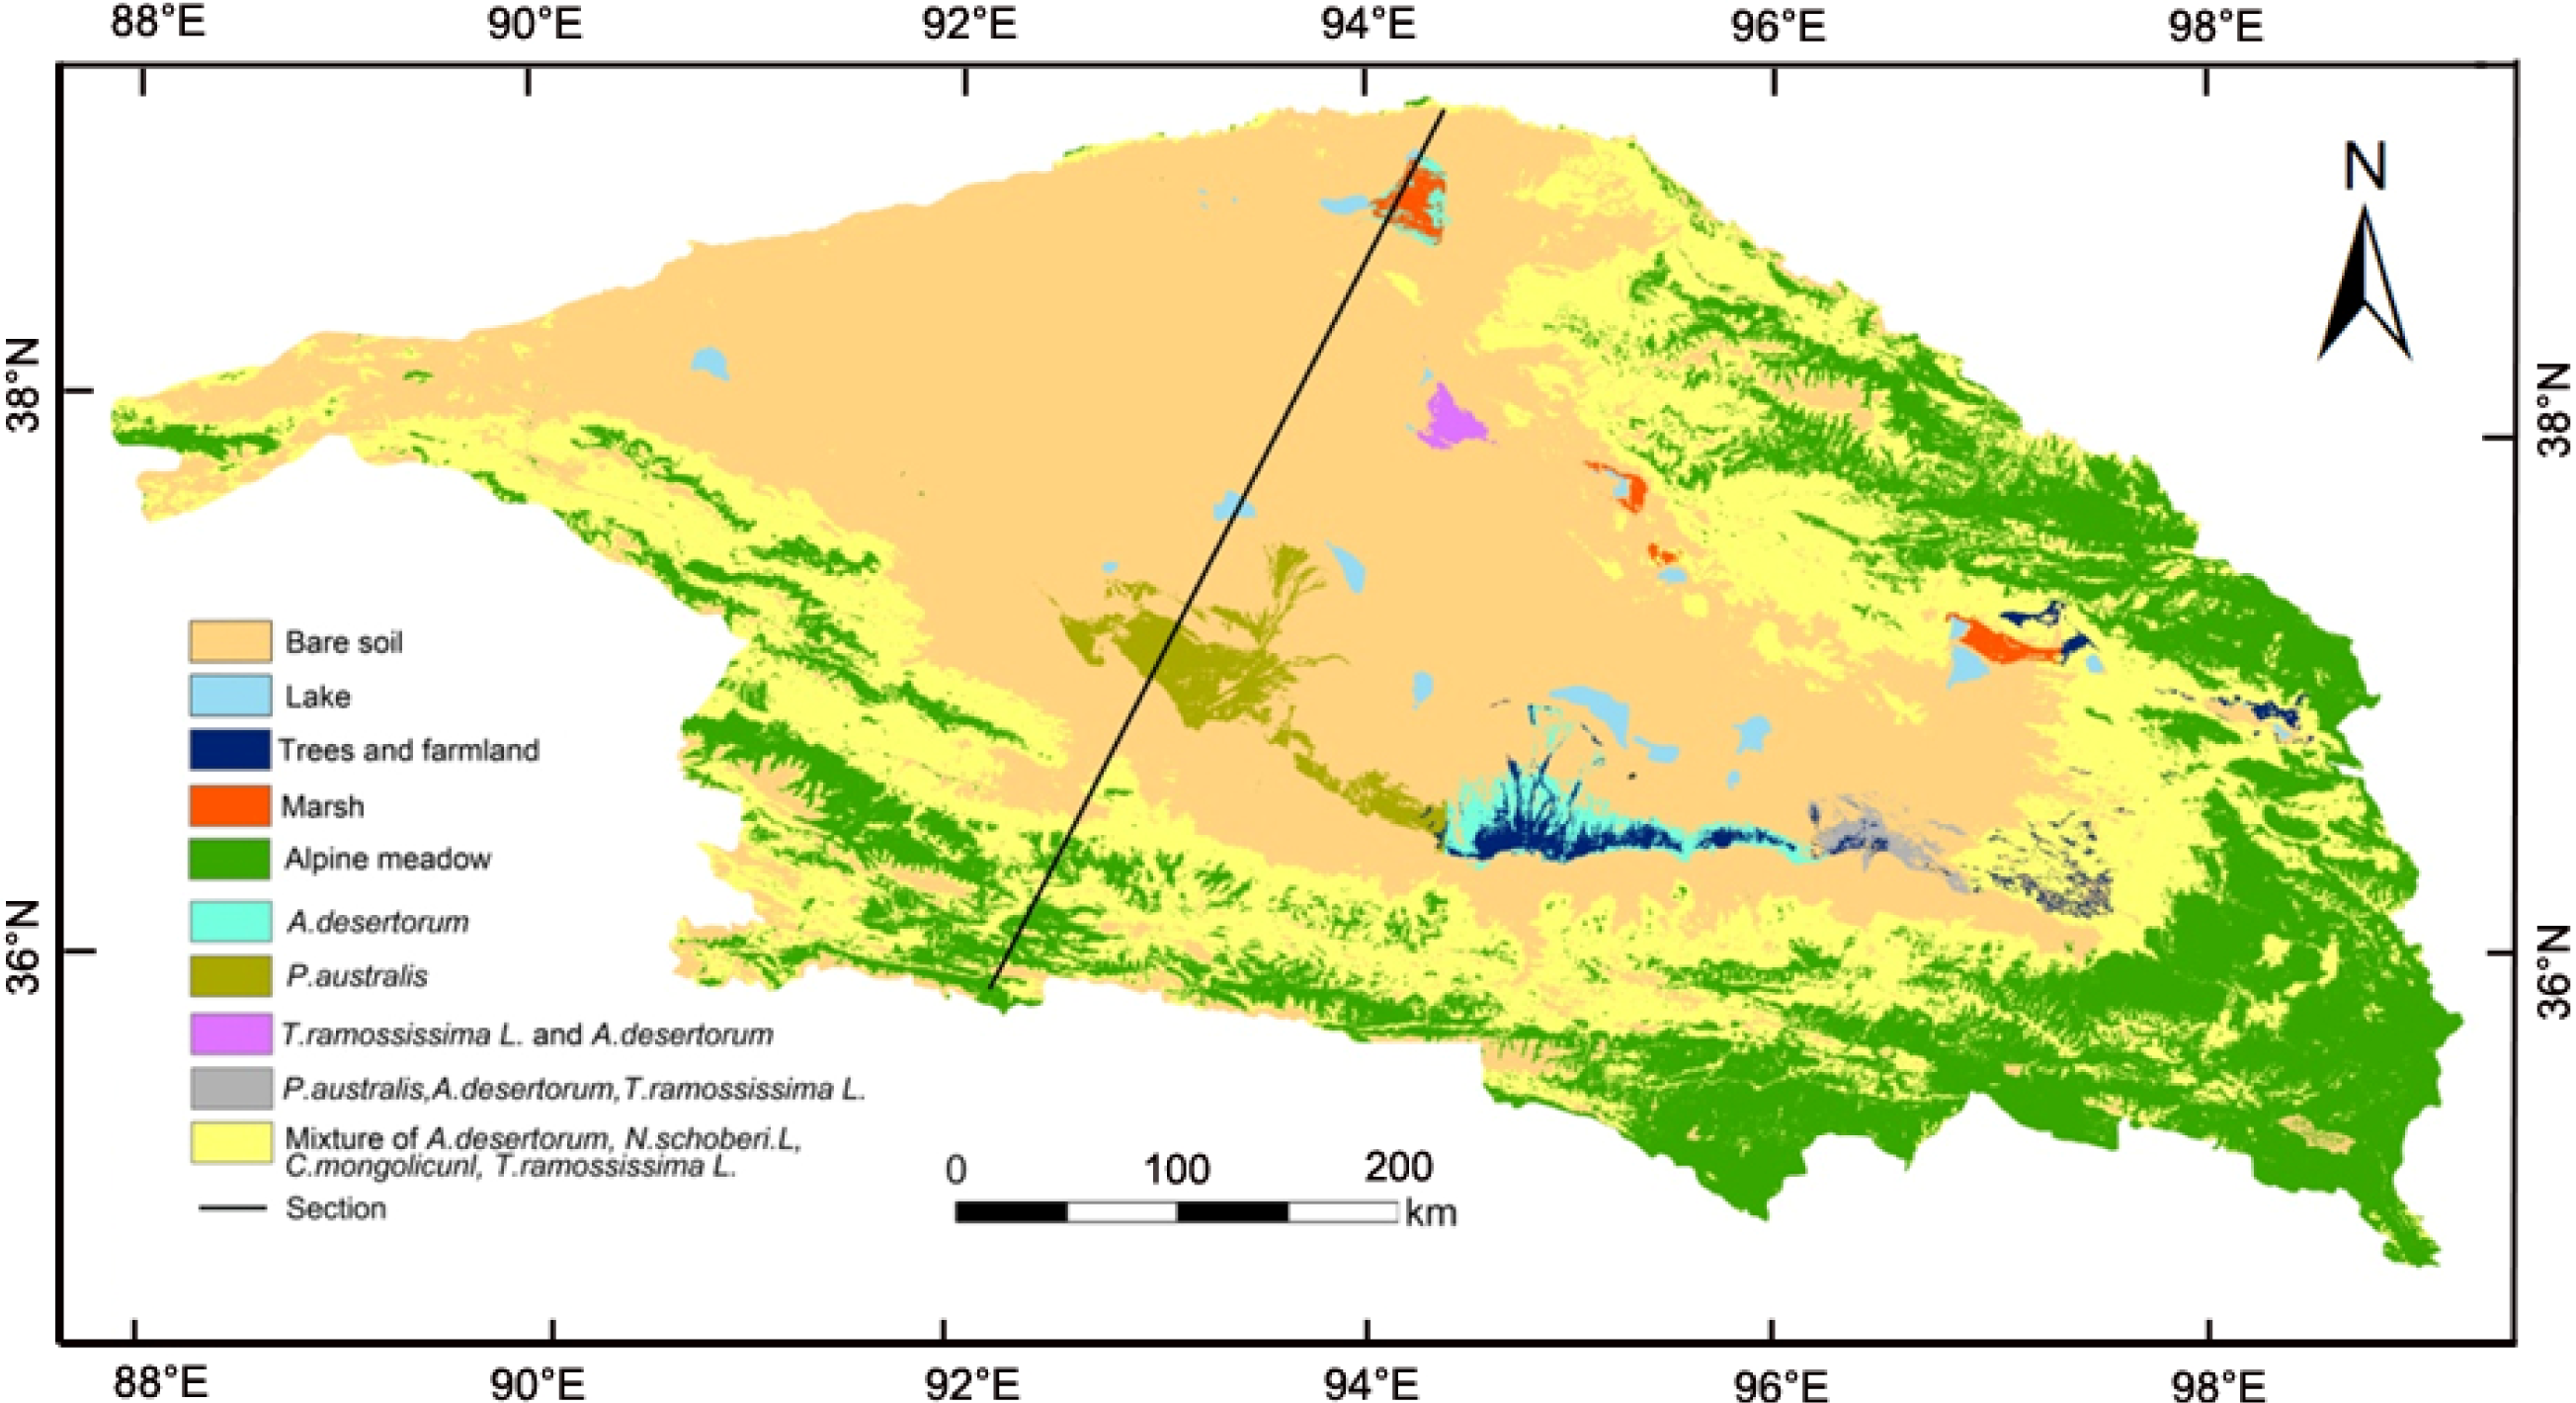
2. Study Area
3. Material and Methods
3.1. Surface Energy Balance System Algorithm
3.2. Dataset
3.2.1. MODIS Data
3.2.2. GLDAS
3.2.3. Meteorological Observation Data
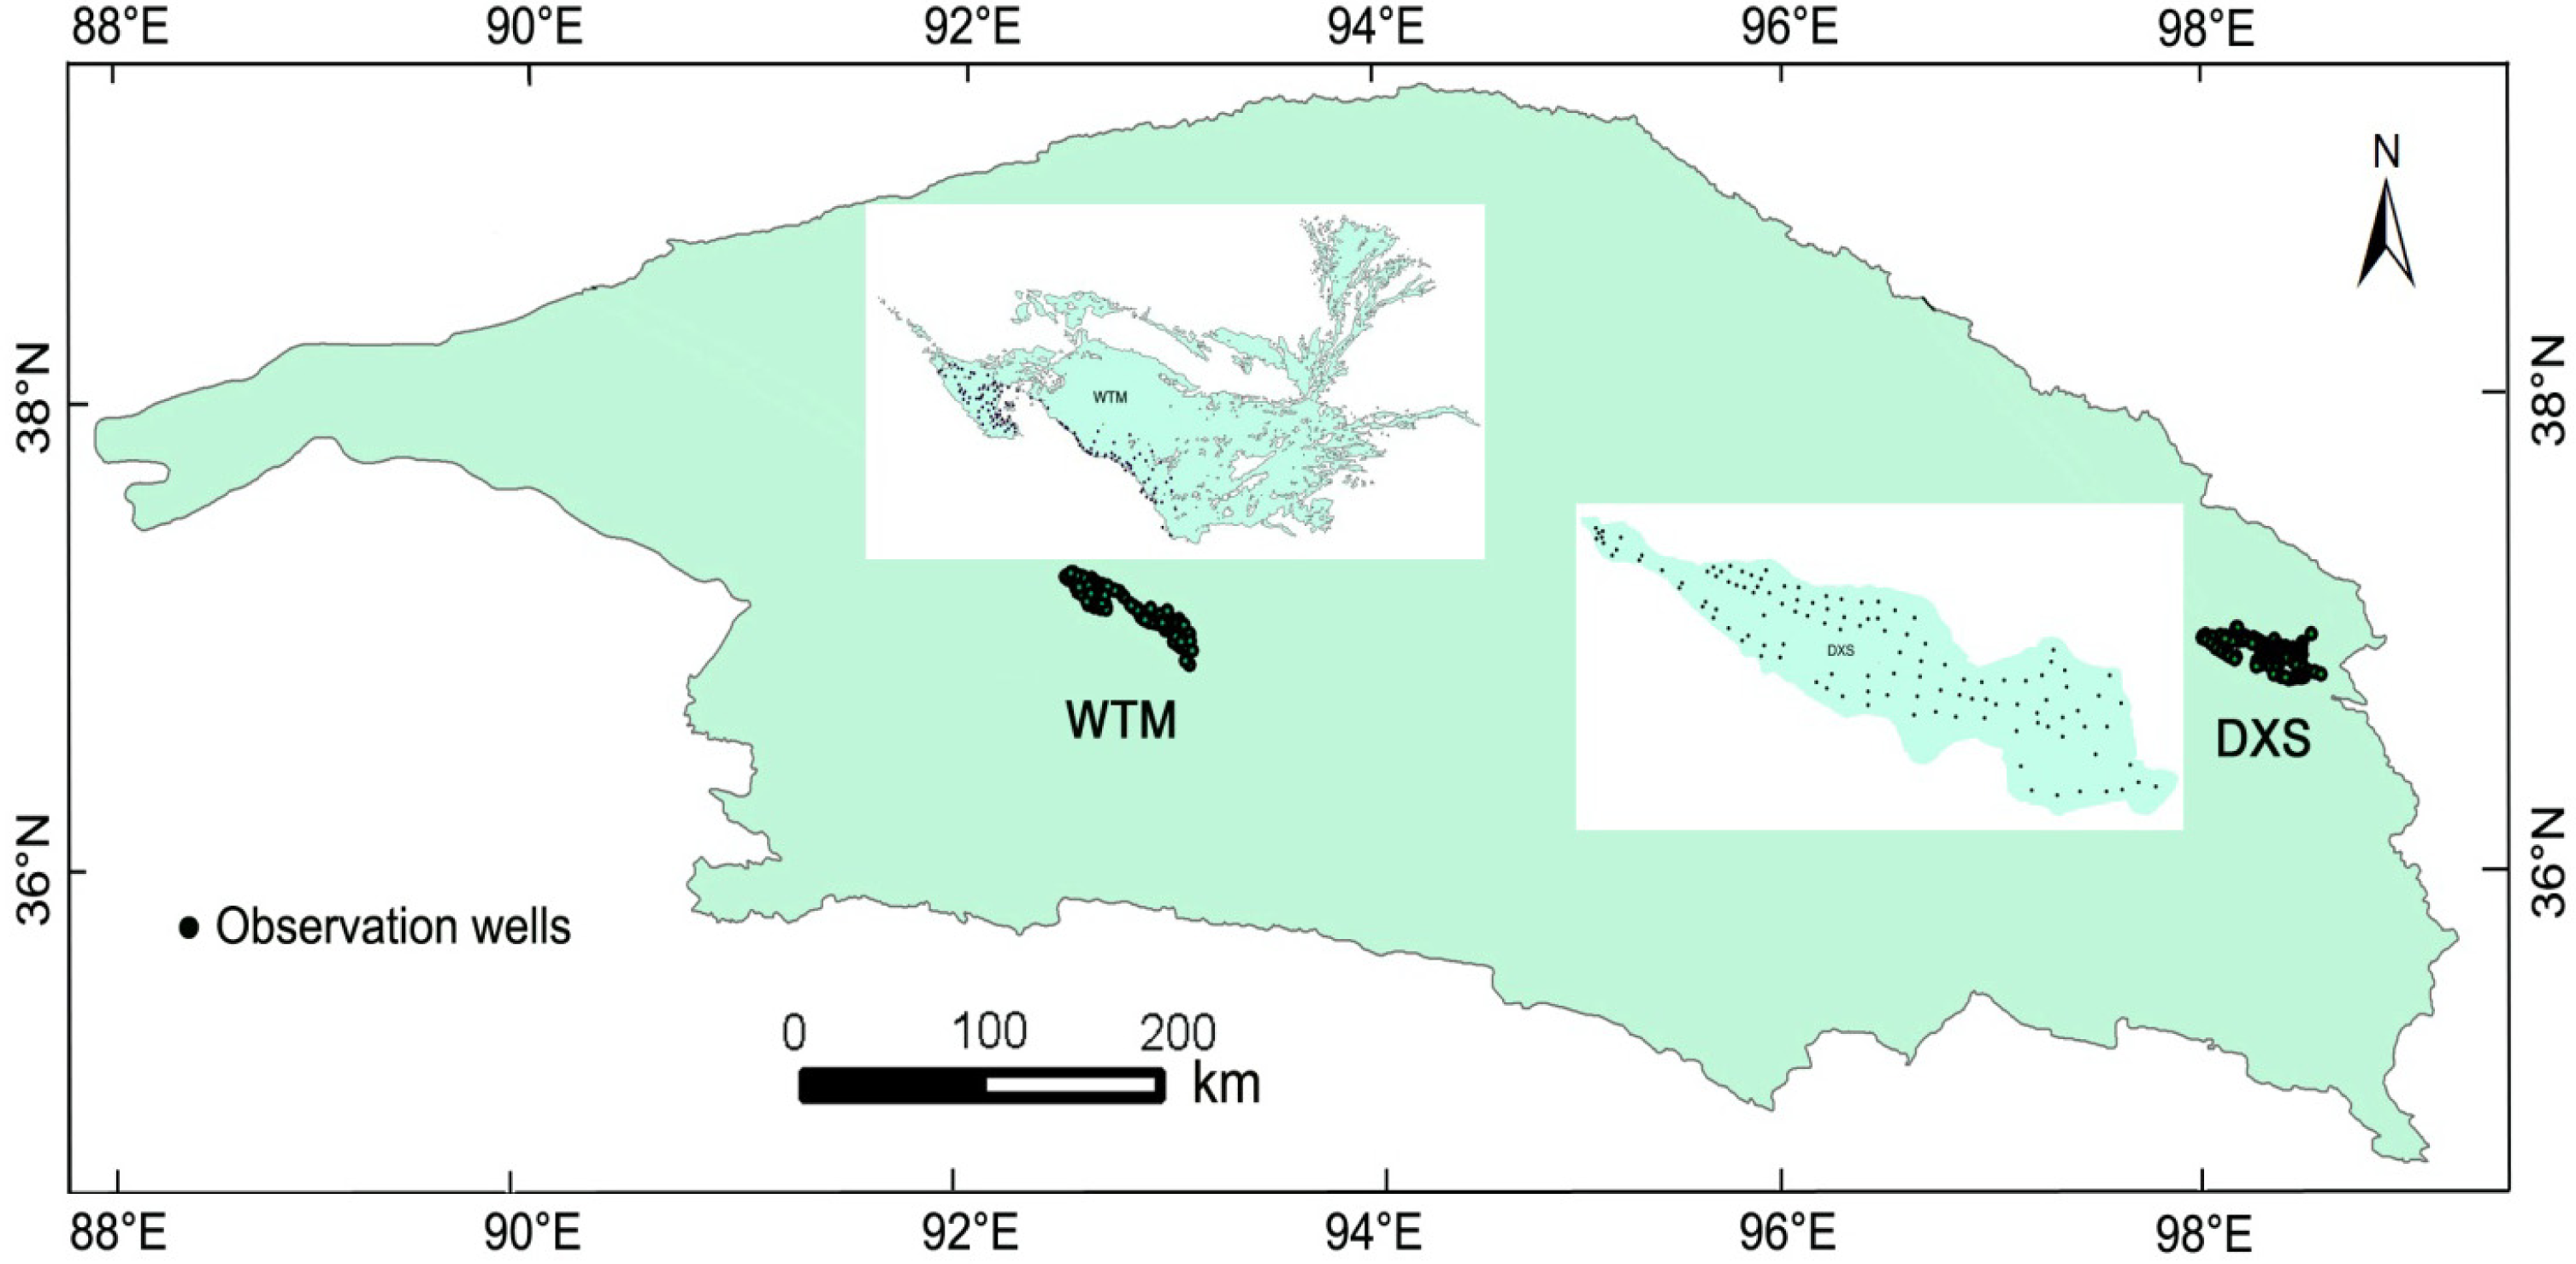
3.2.4. Water Table Depth
4. Results
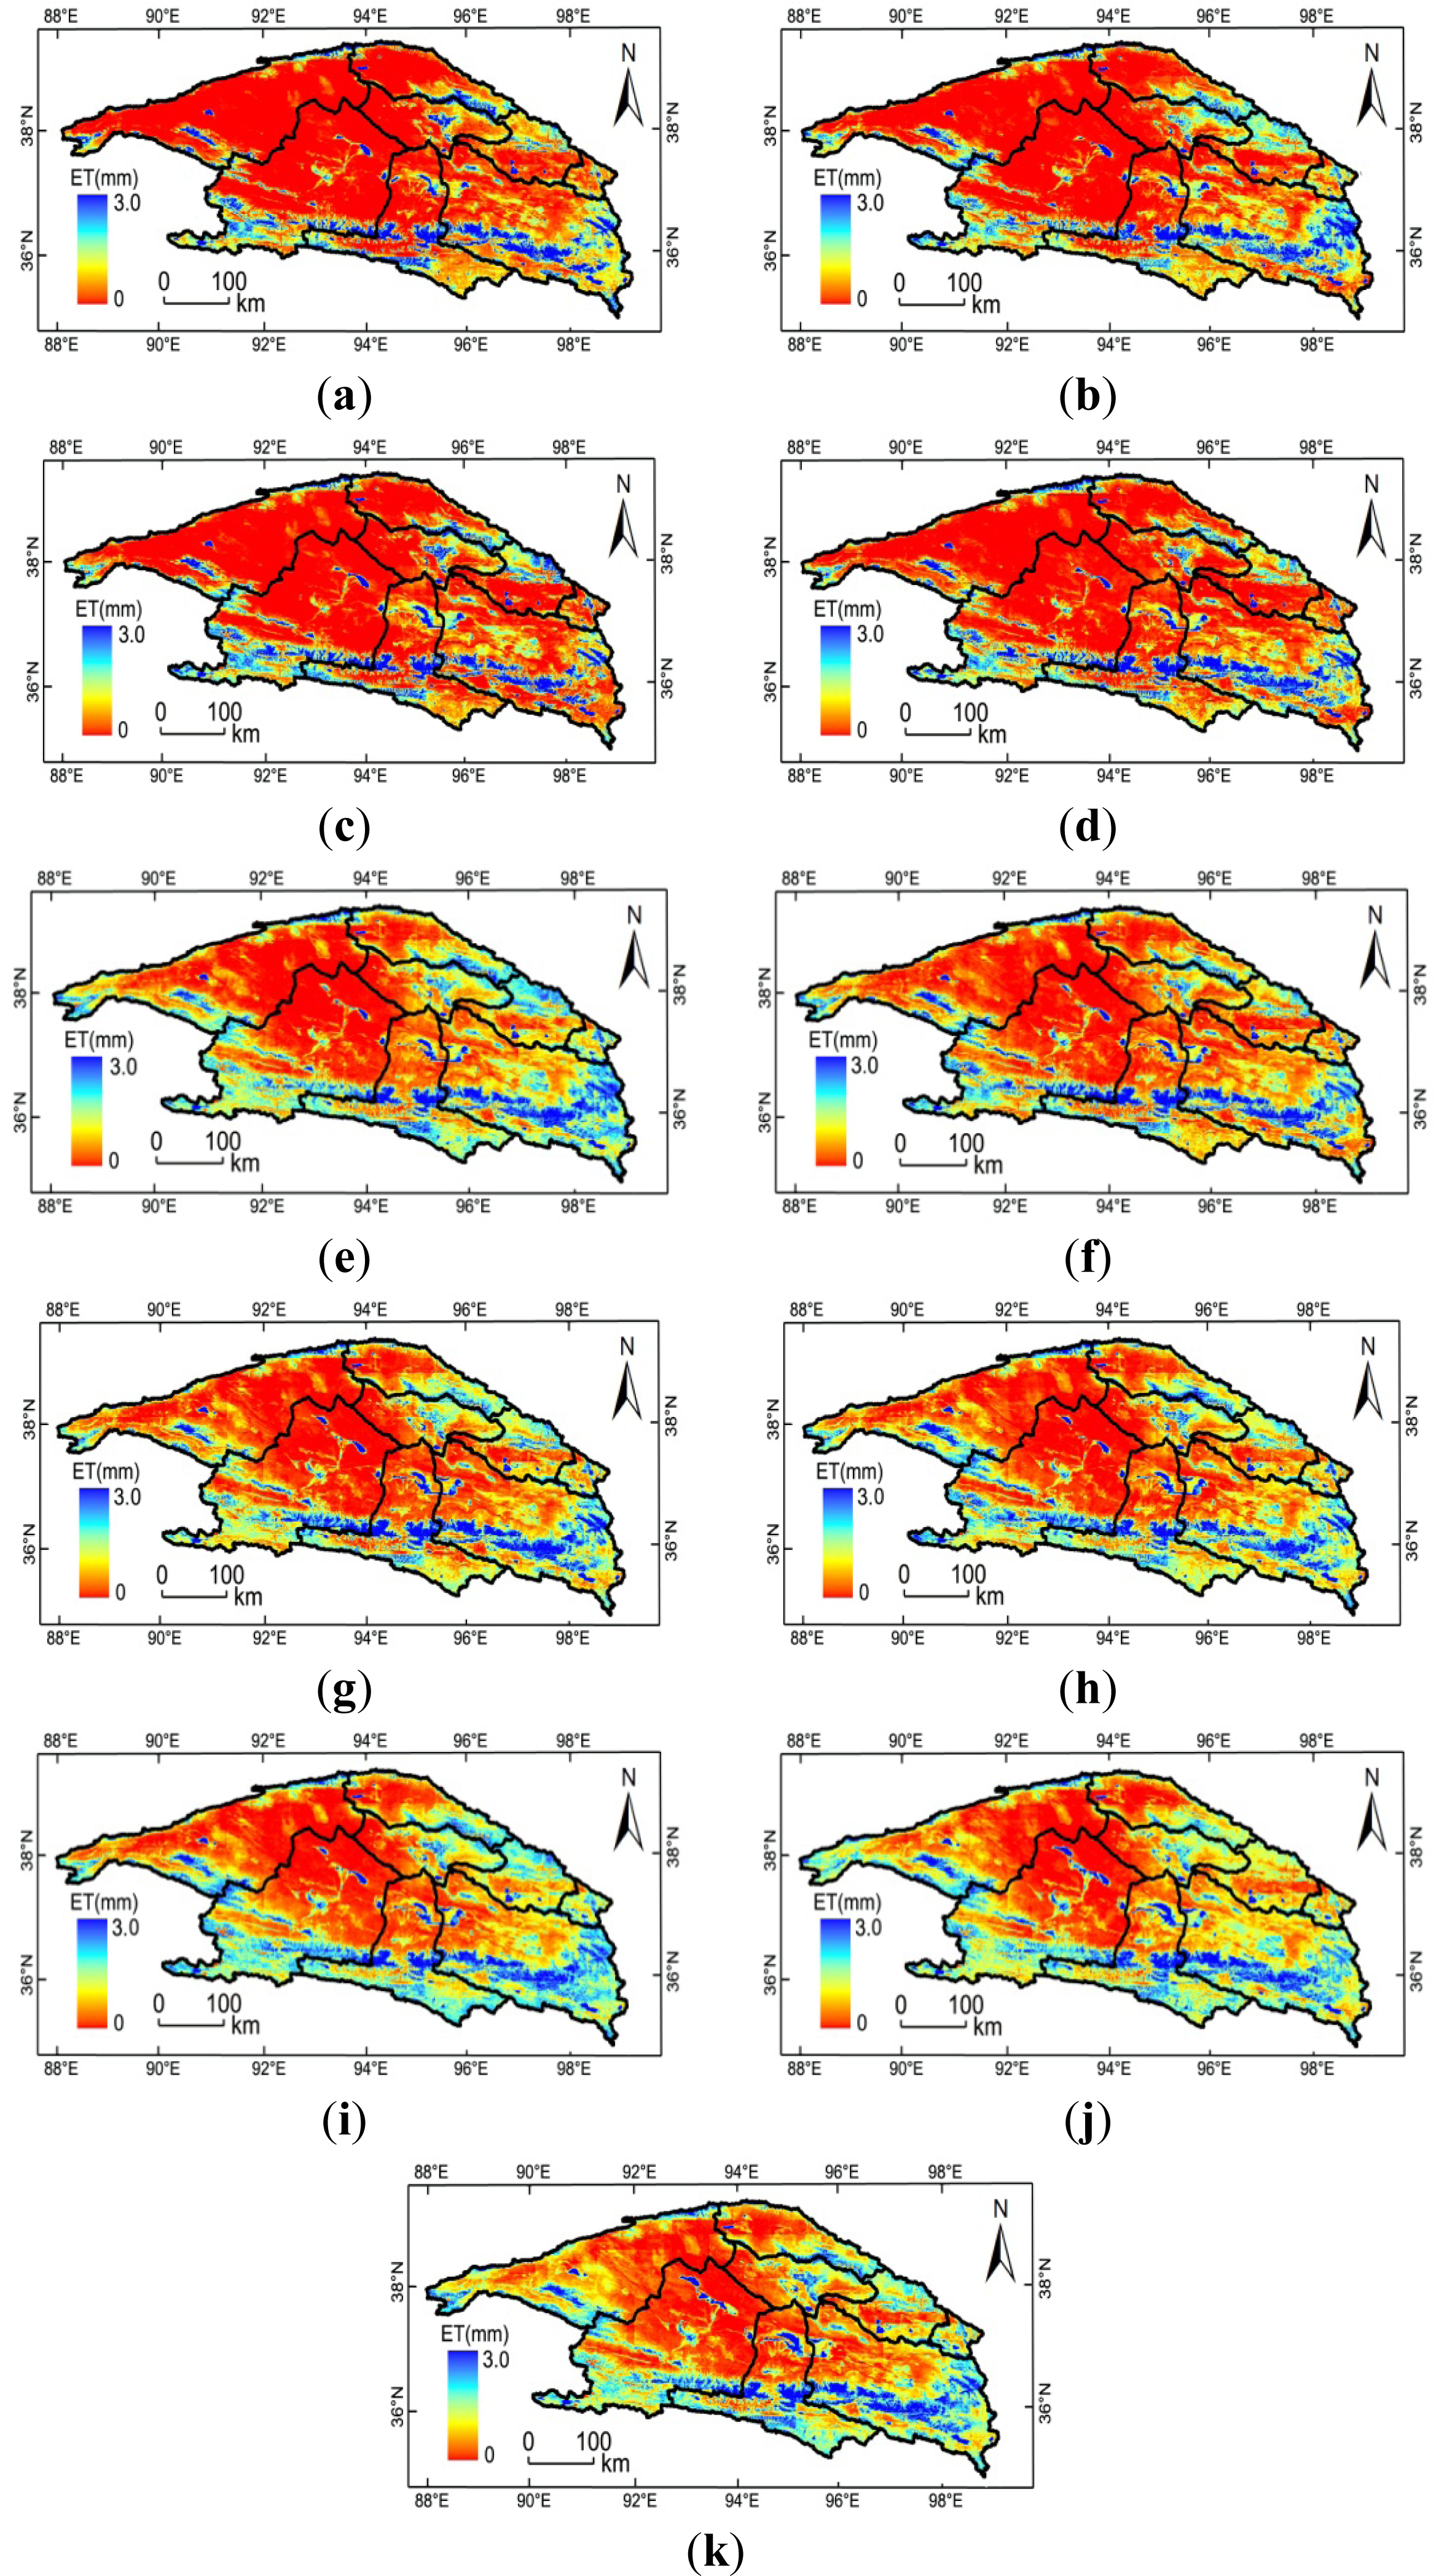
4.1. Spatial and Temporal Distribution of Actual Evapotranspiration by SEBS
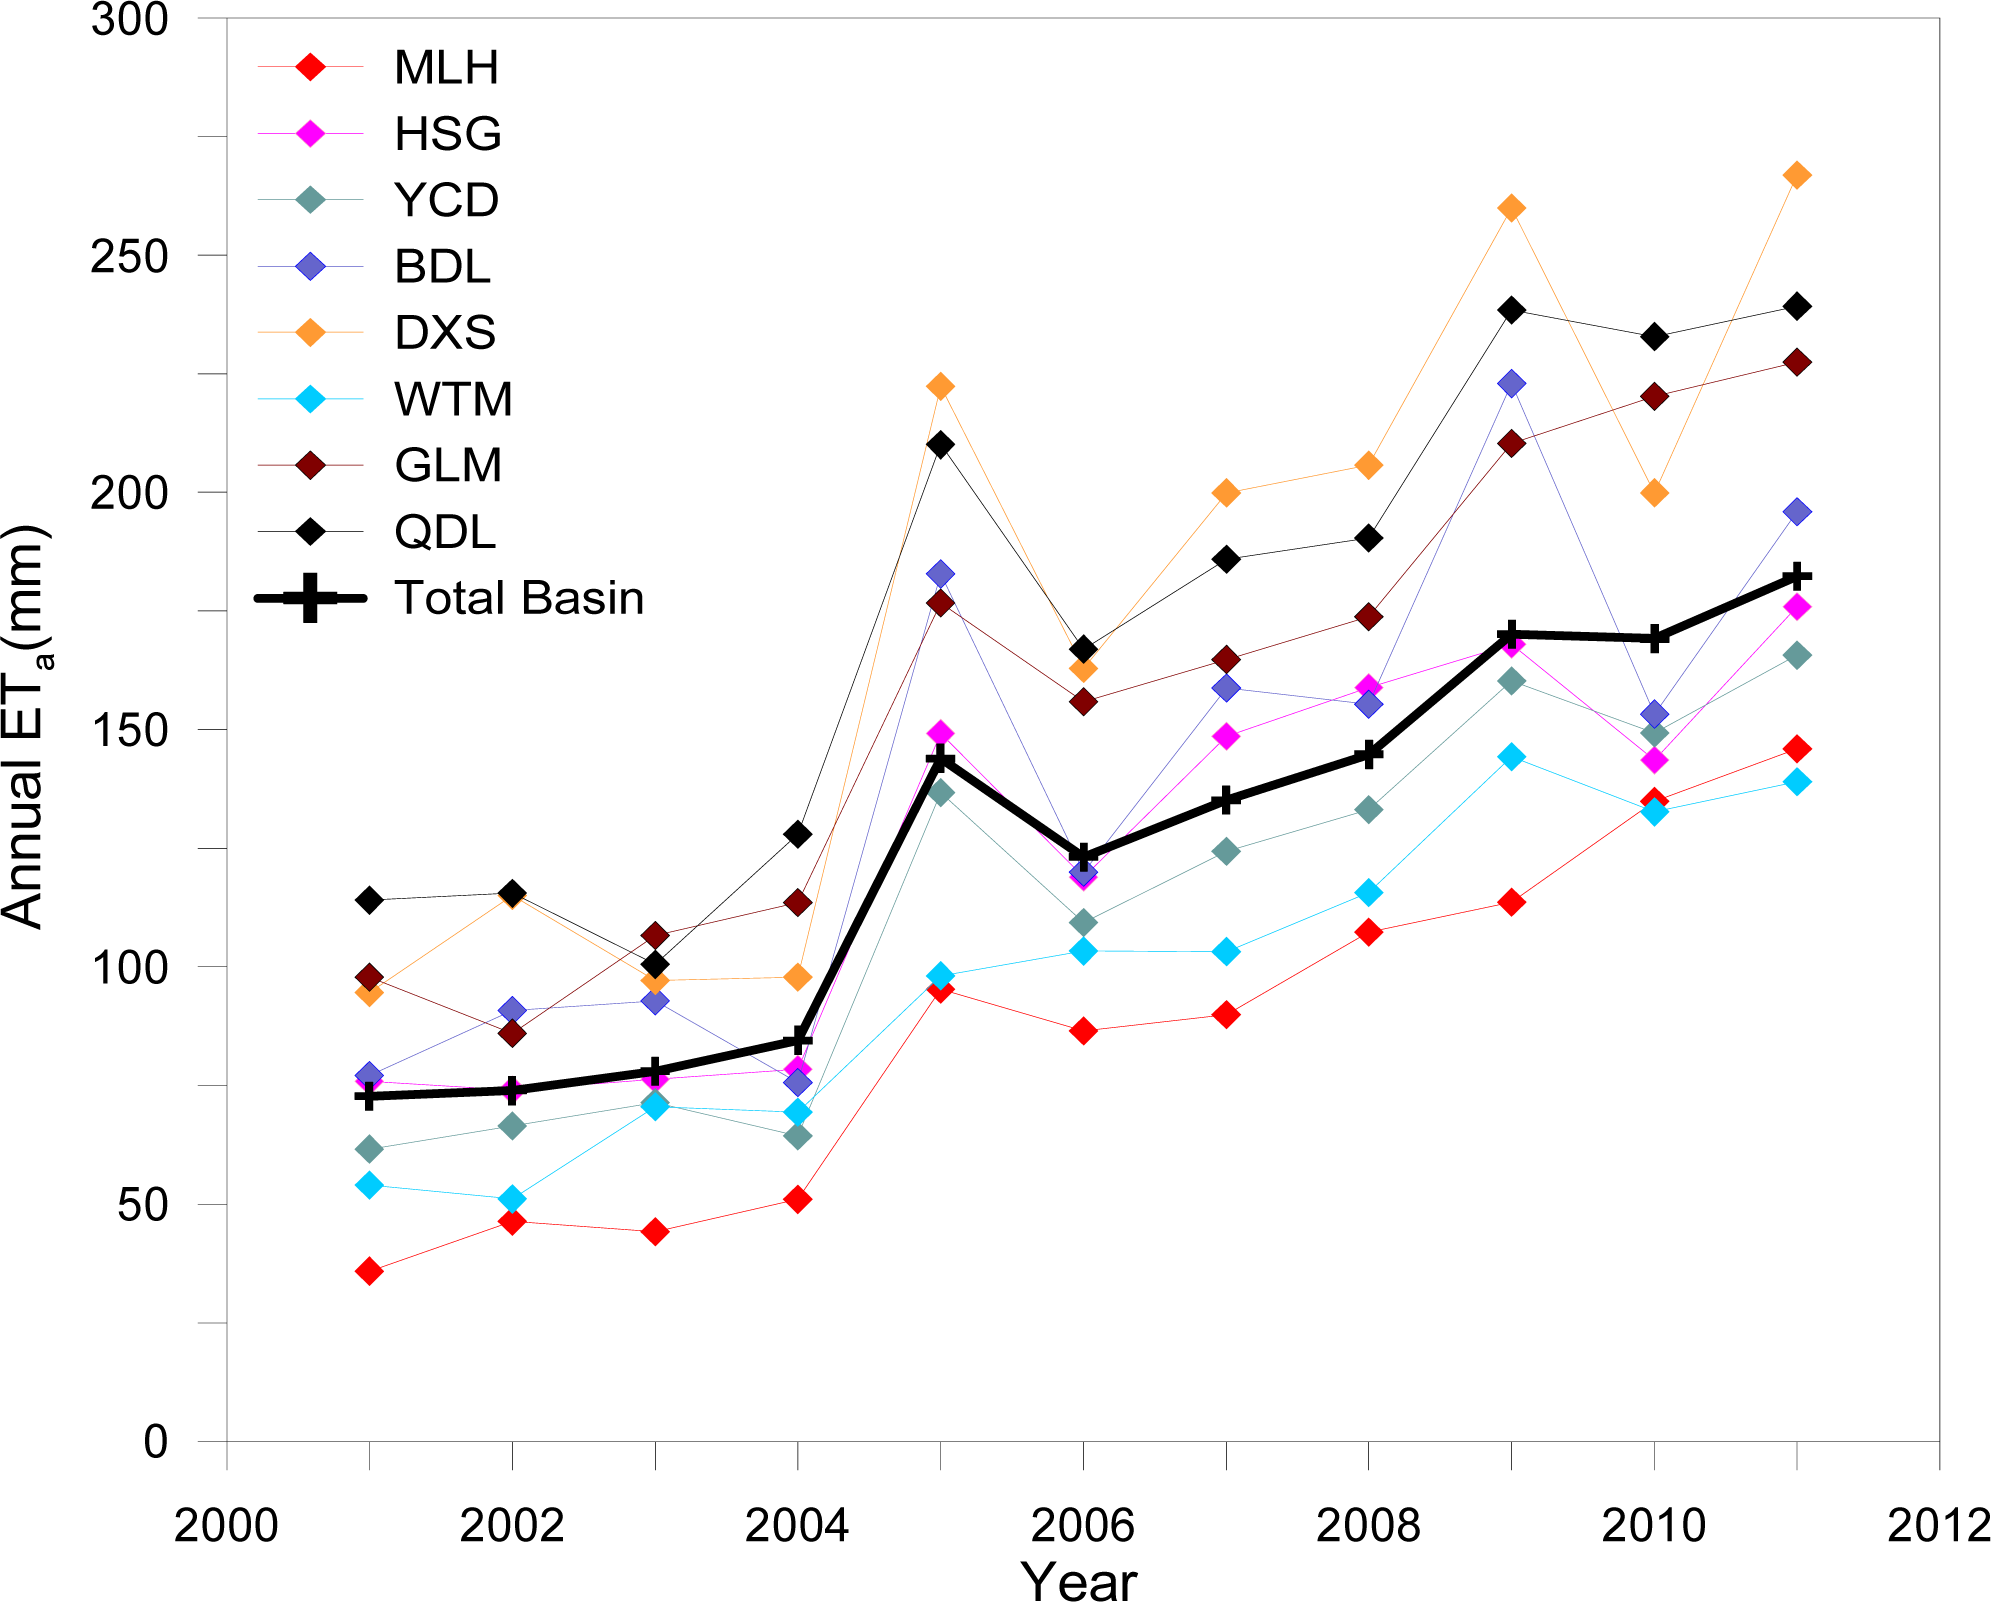
4.2. Long-Term Change of Annual Actual Evapotranspiration
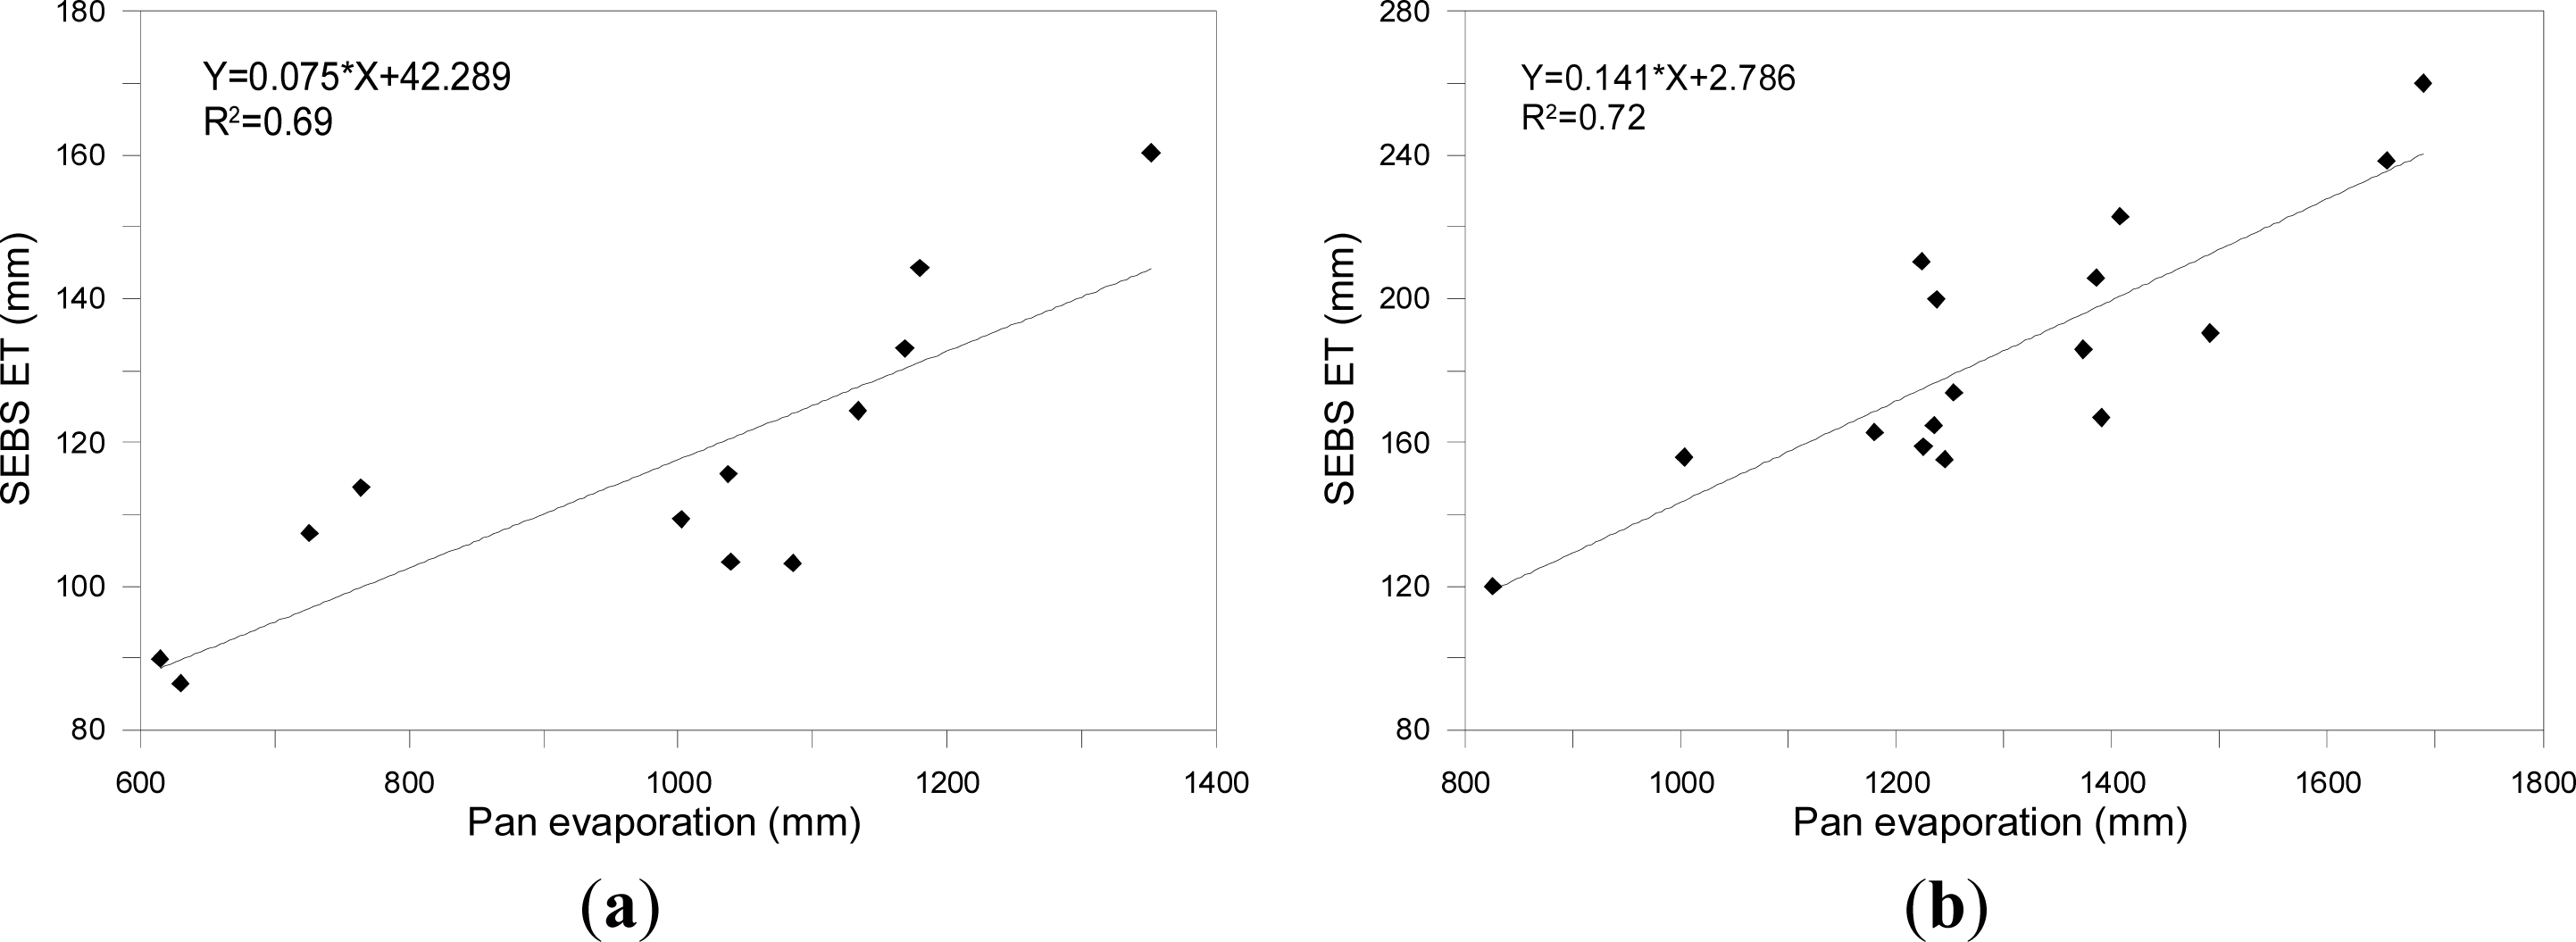
4.3. Conversion Coefficient of Evaporation
5. Discussion
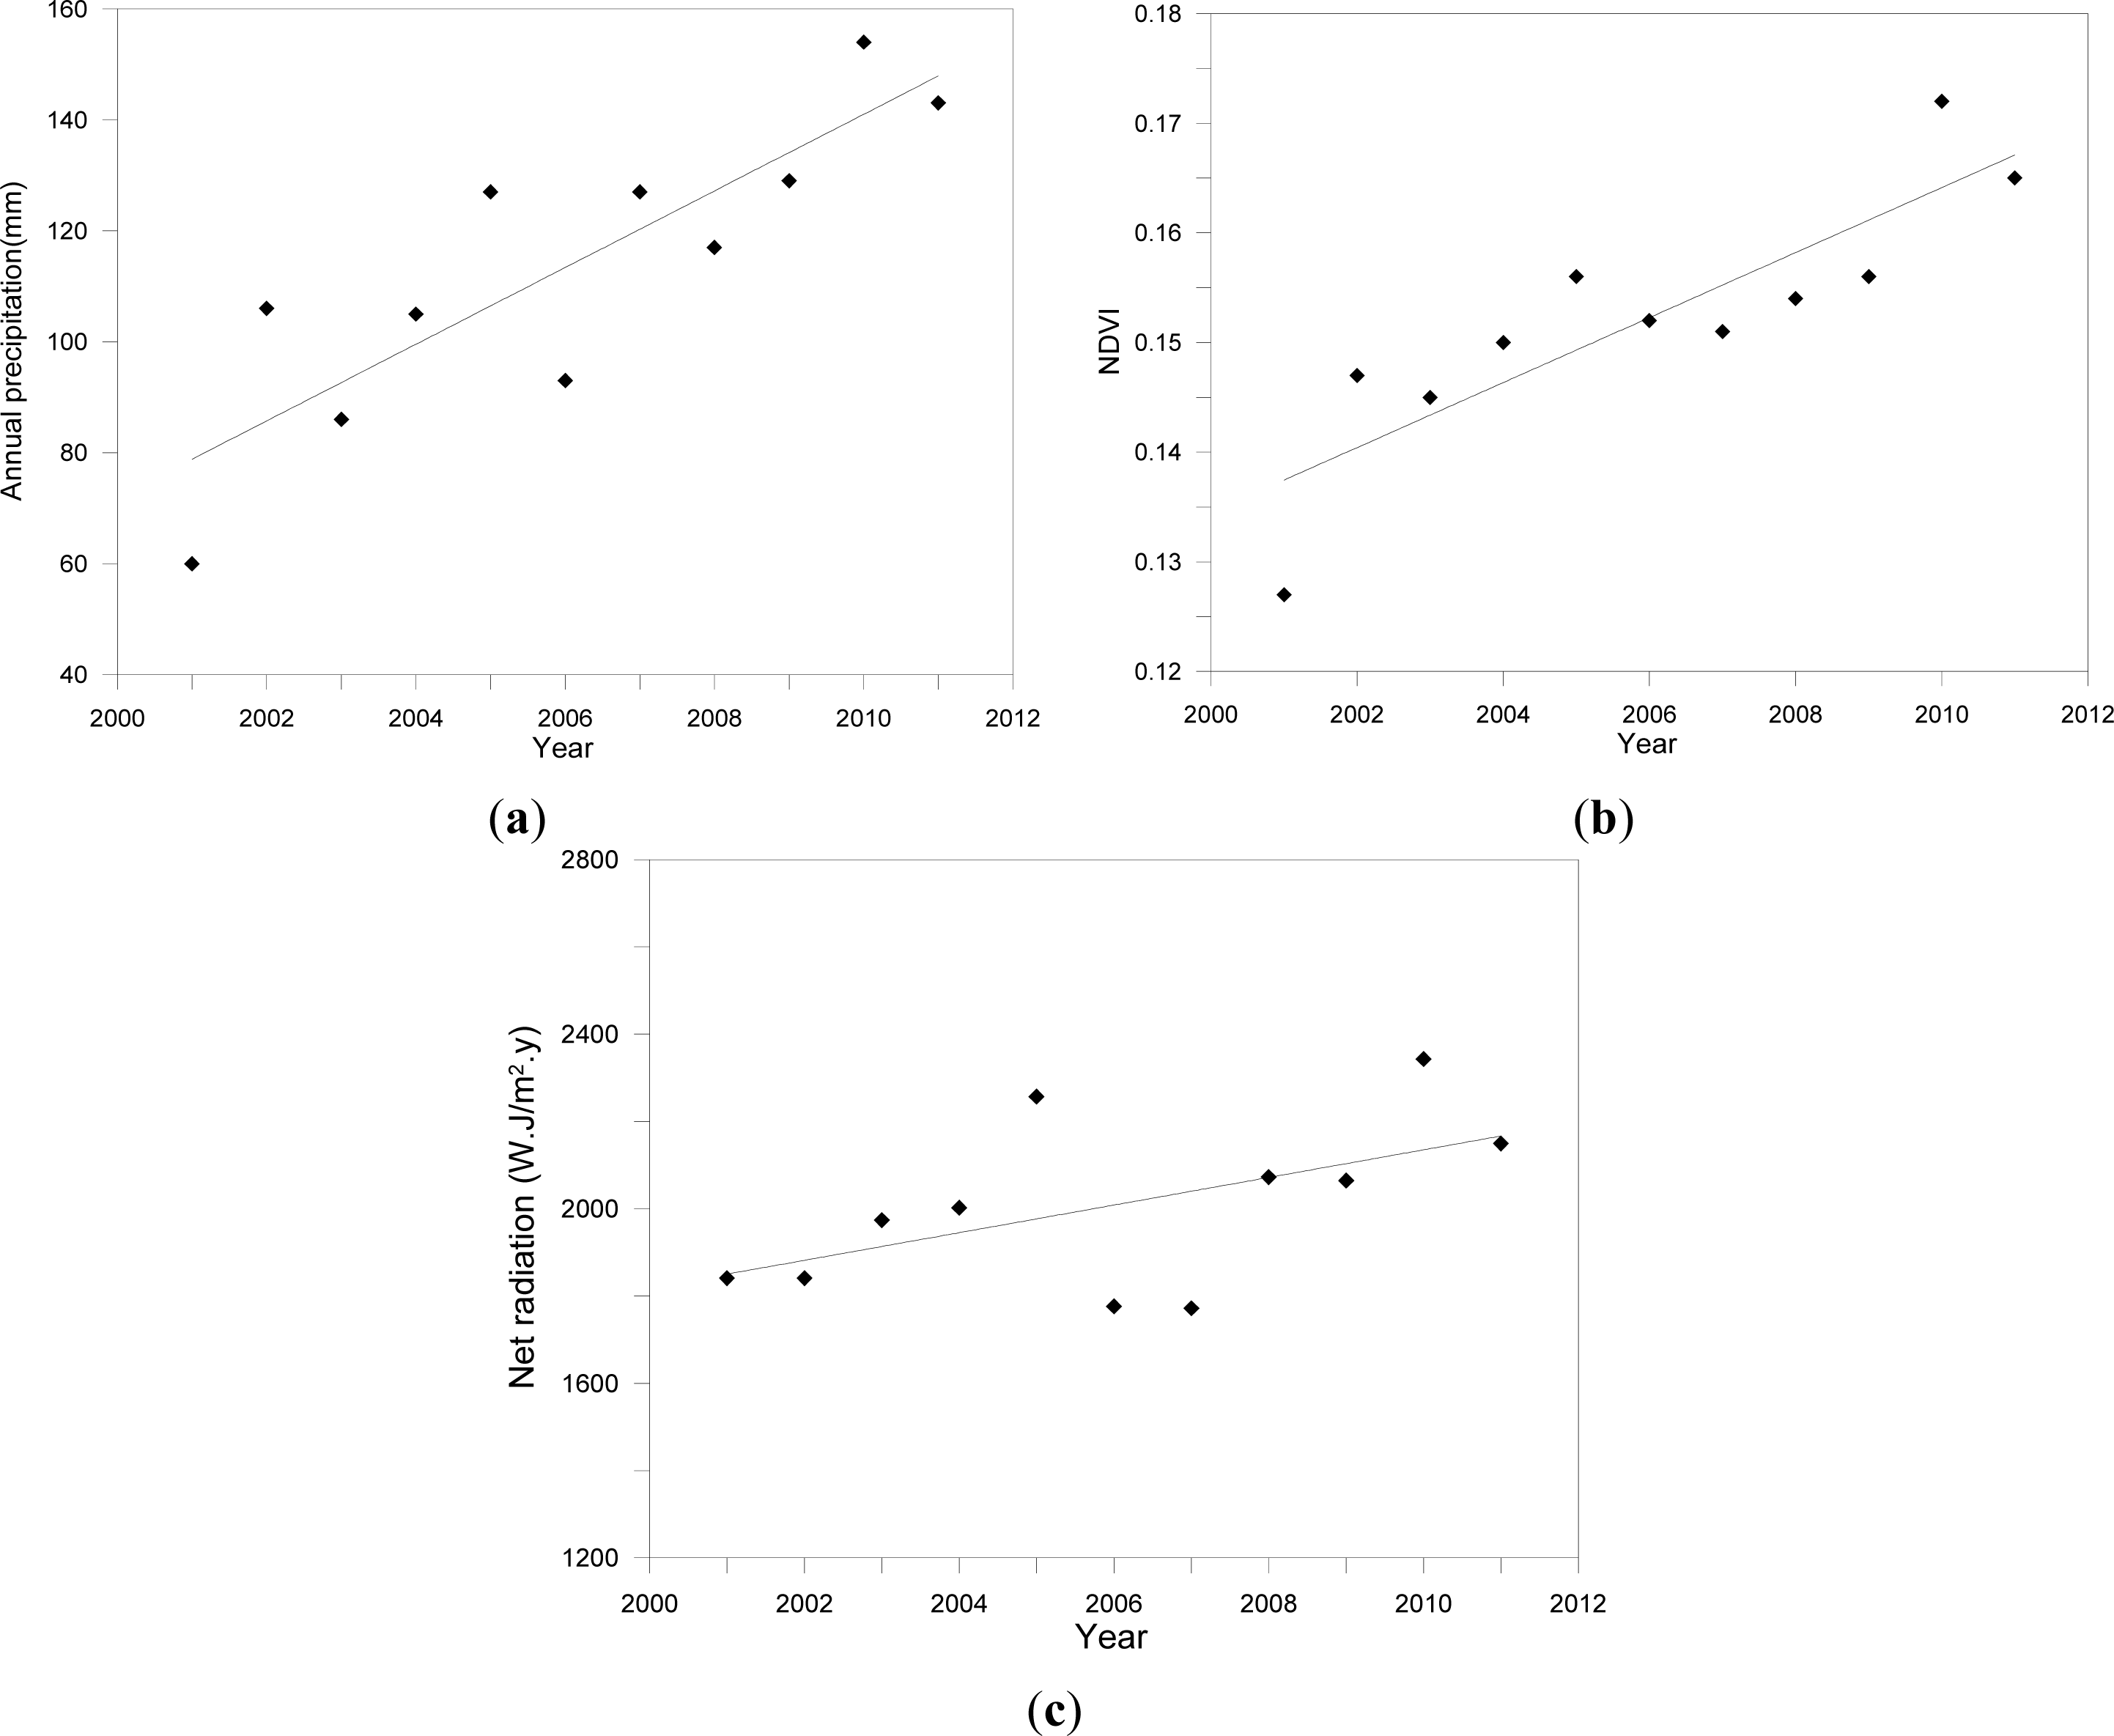
5.1. Effect of Precipitation, NDVI and Net Radiation on Actual Evapotranspiration
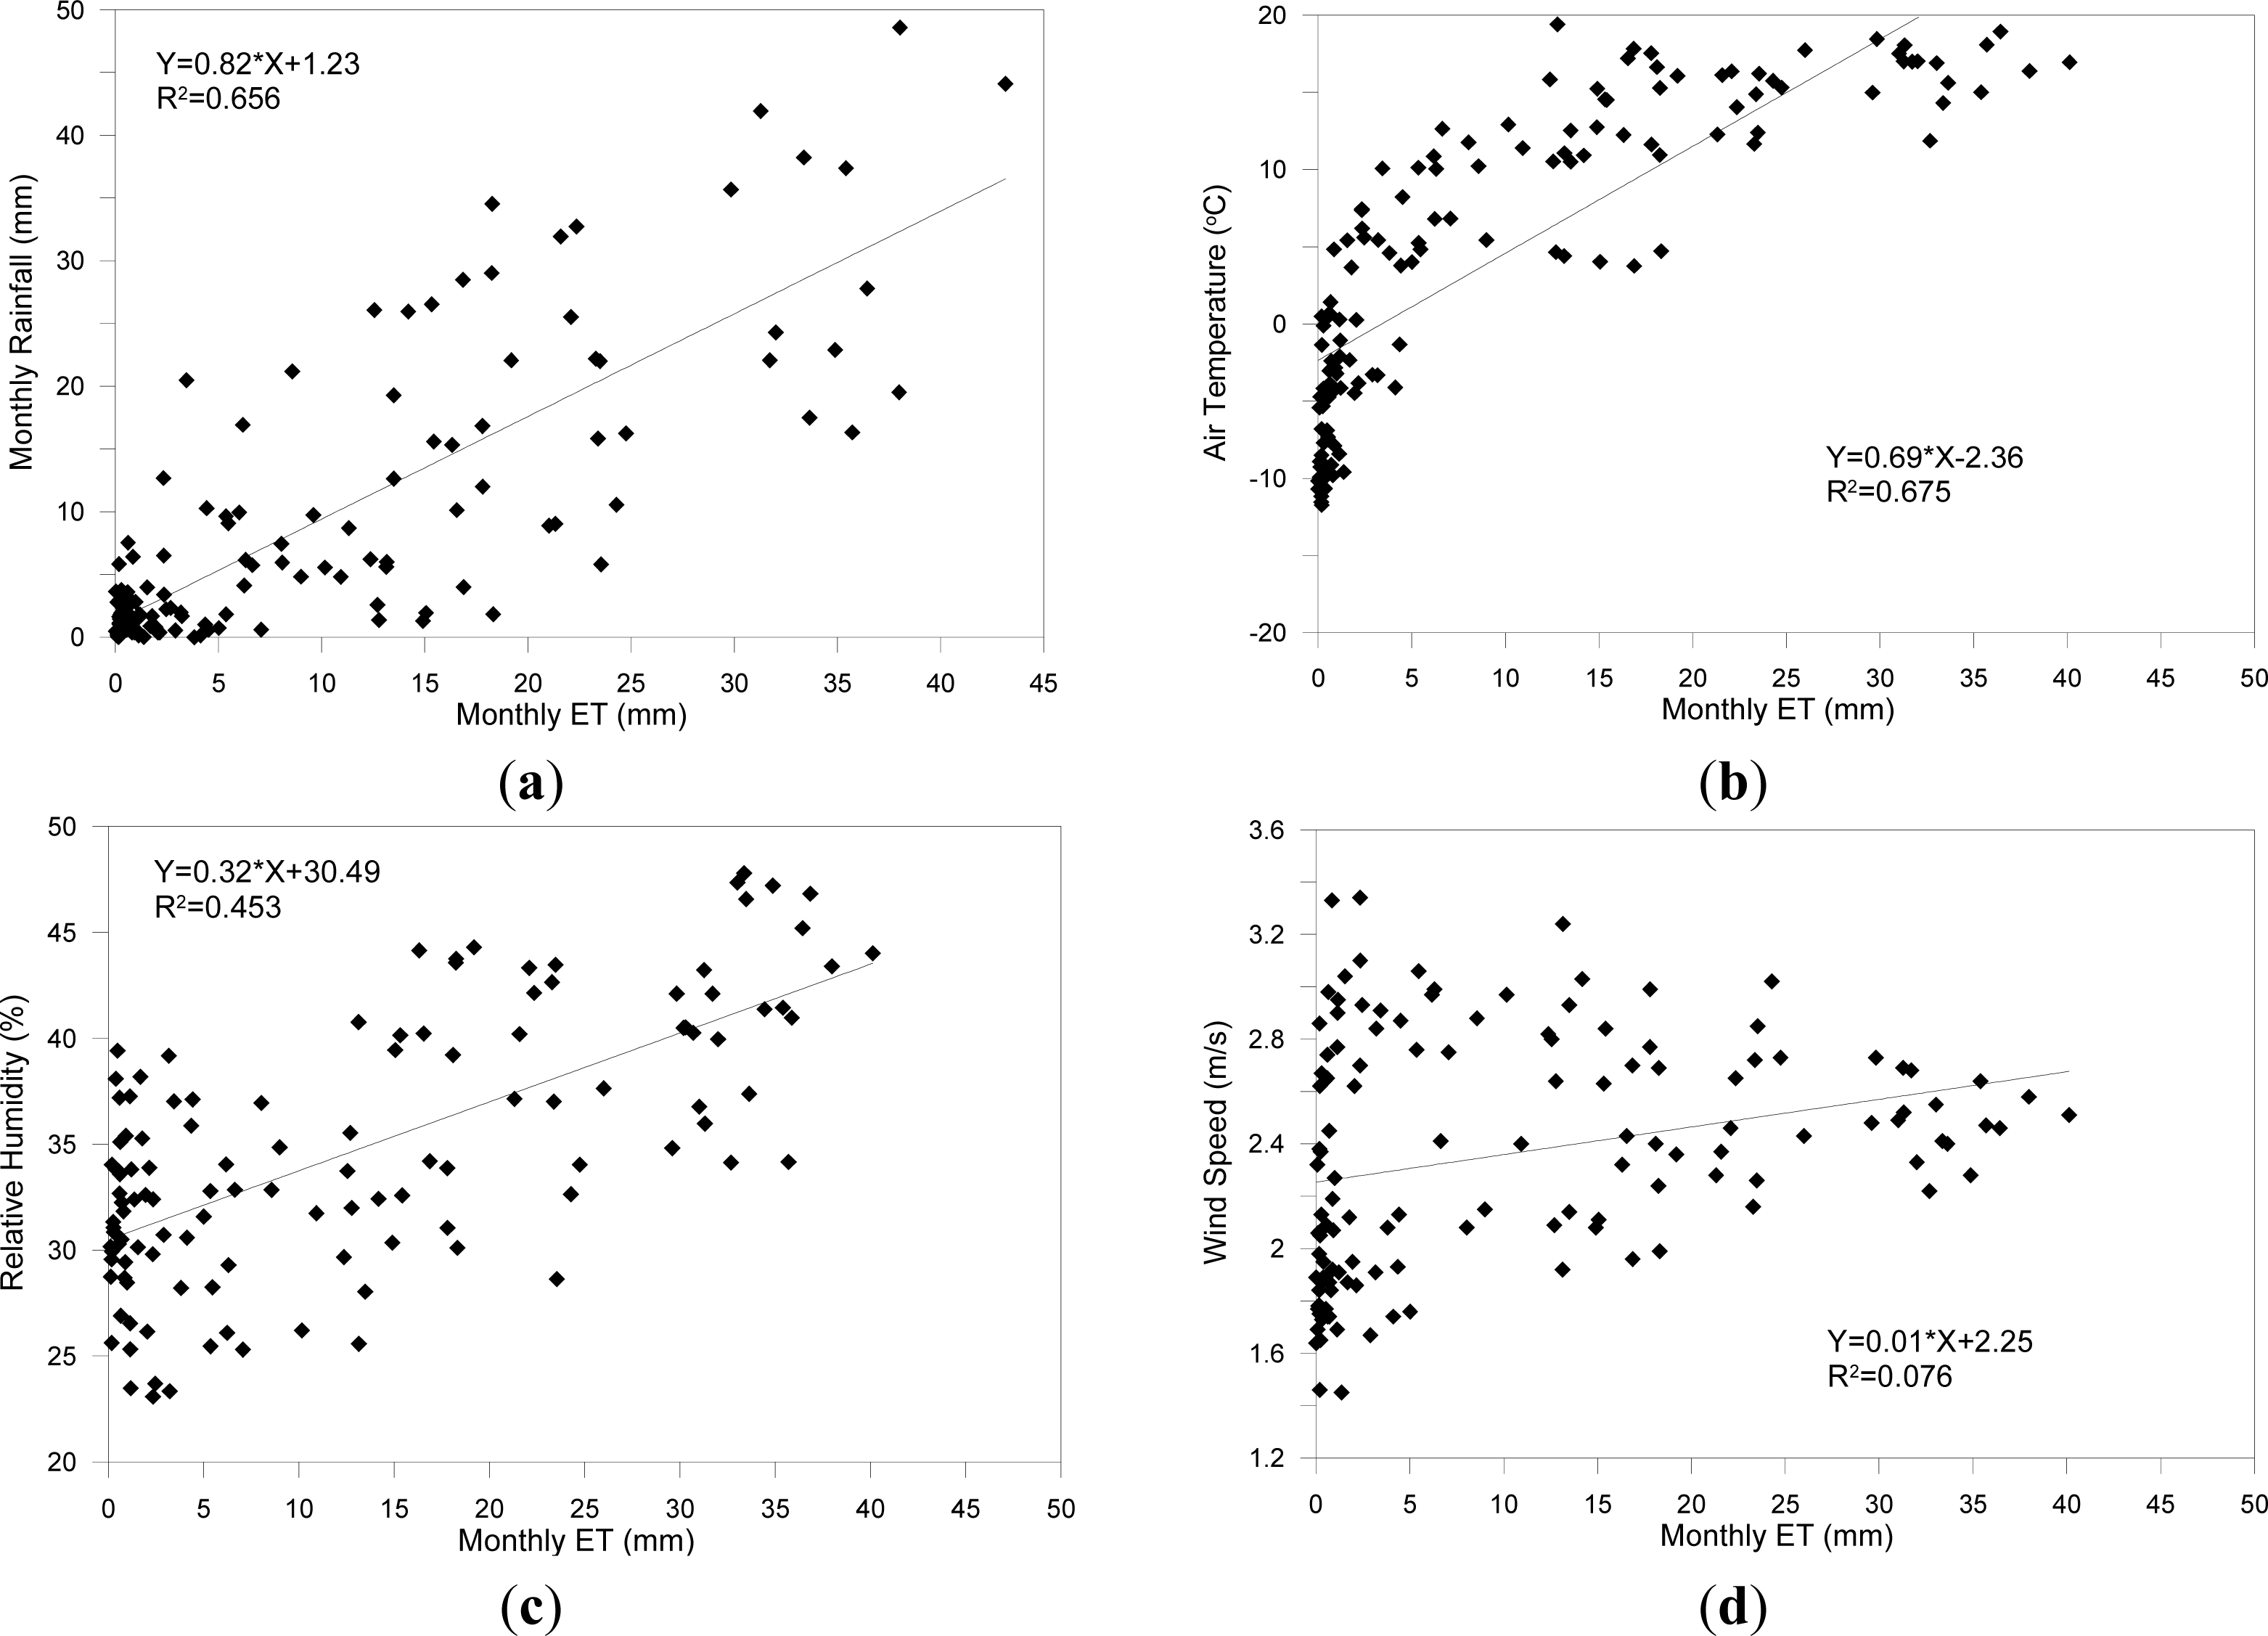
5.2. Meteorological Factors and Actual SEBS Evapotranspiration
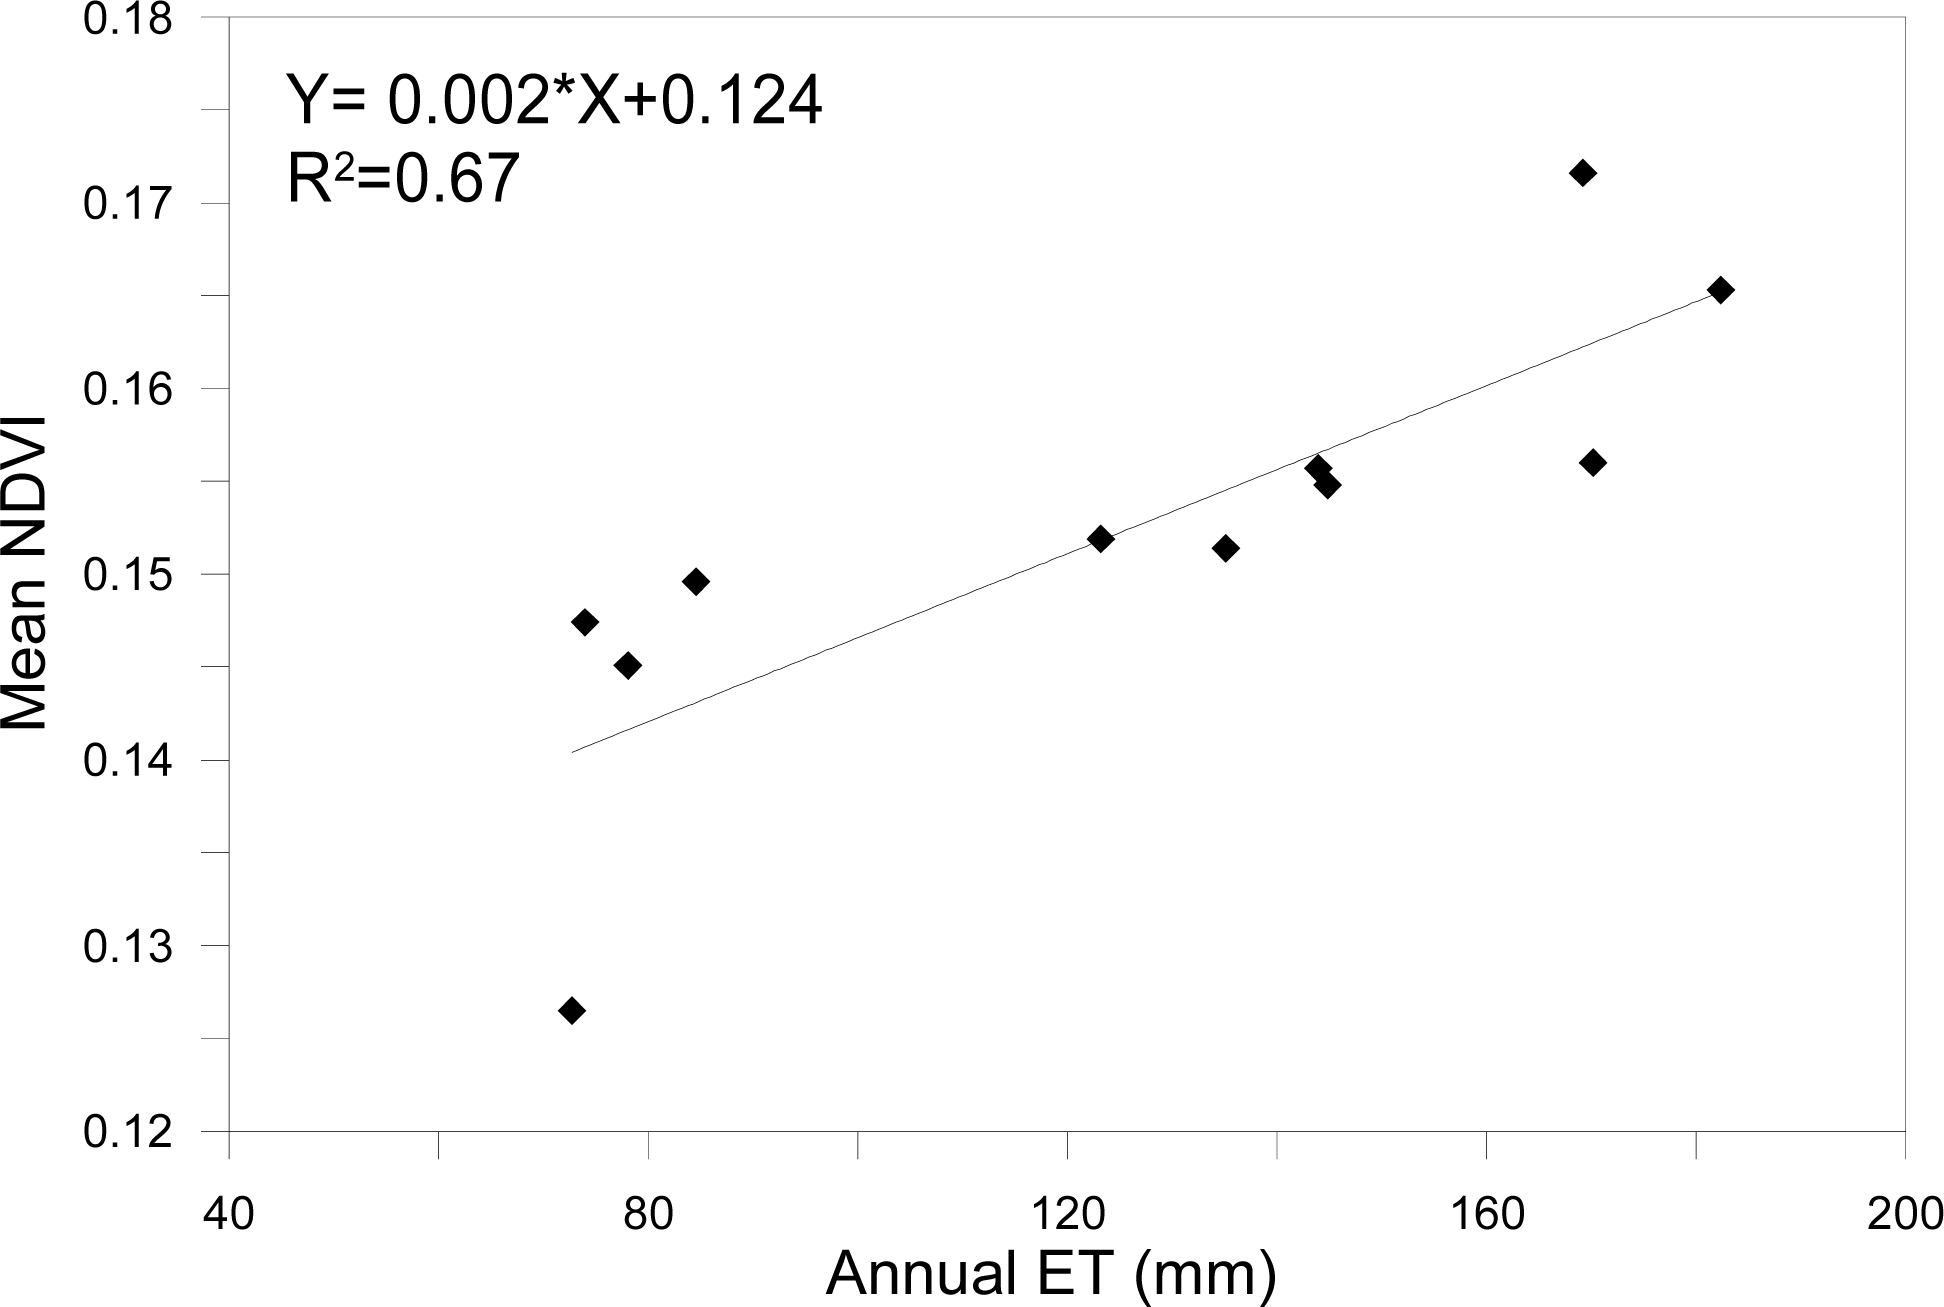
5.3. Vegetation and Actual SEBS Evapotranspiration
5.4. Land Cover Type and Actual SEBS Evapotranspiration
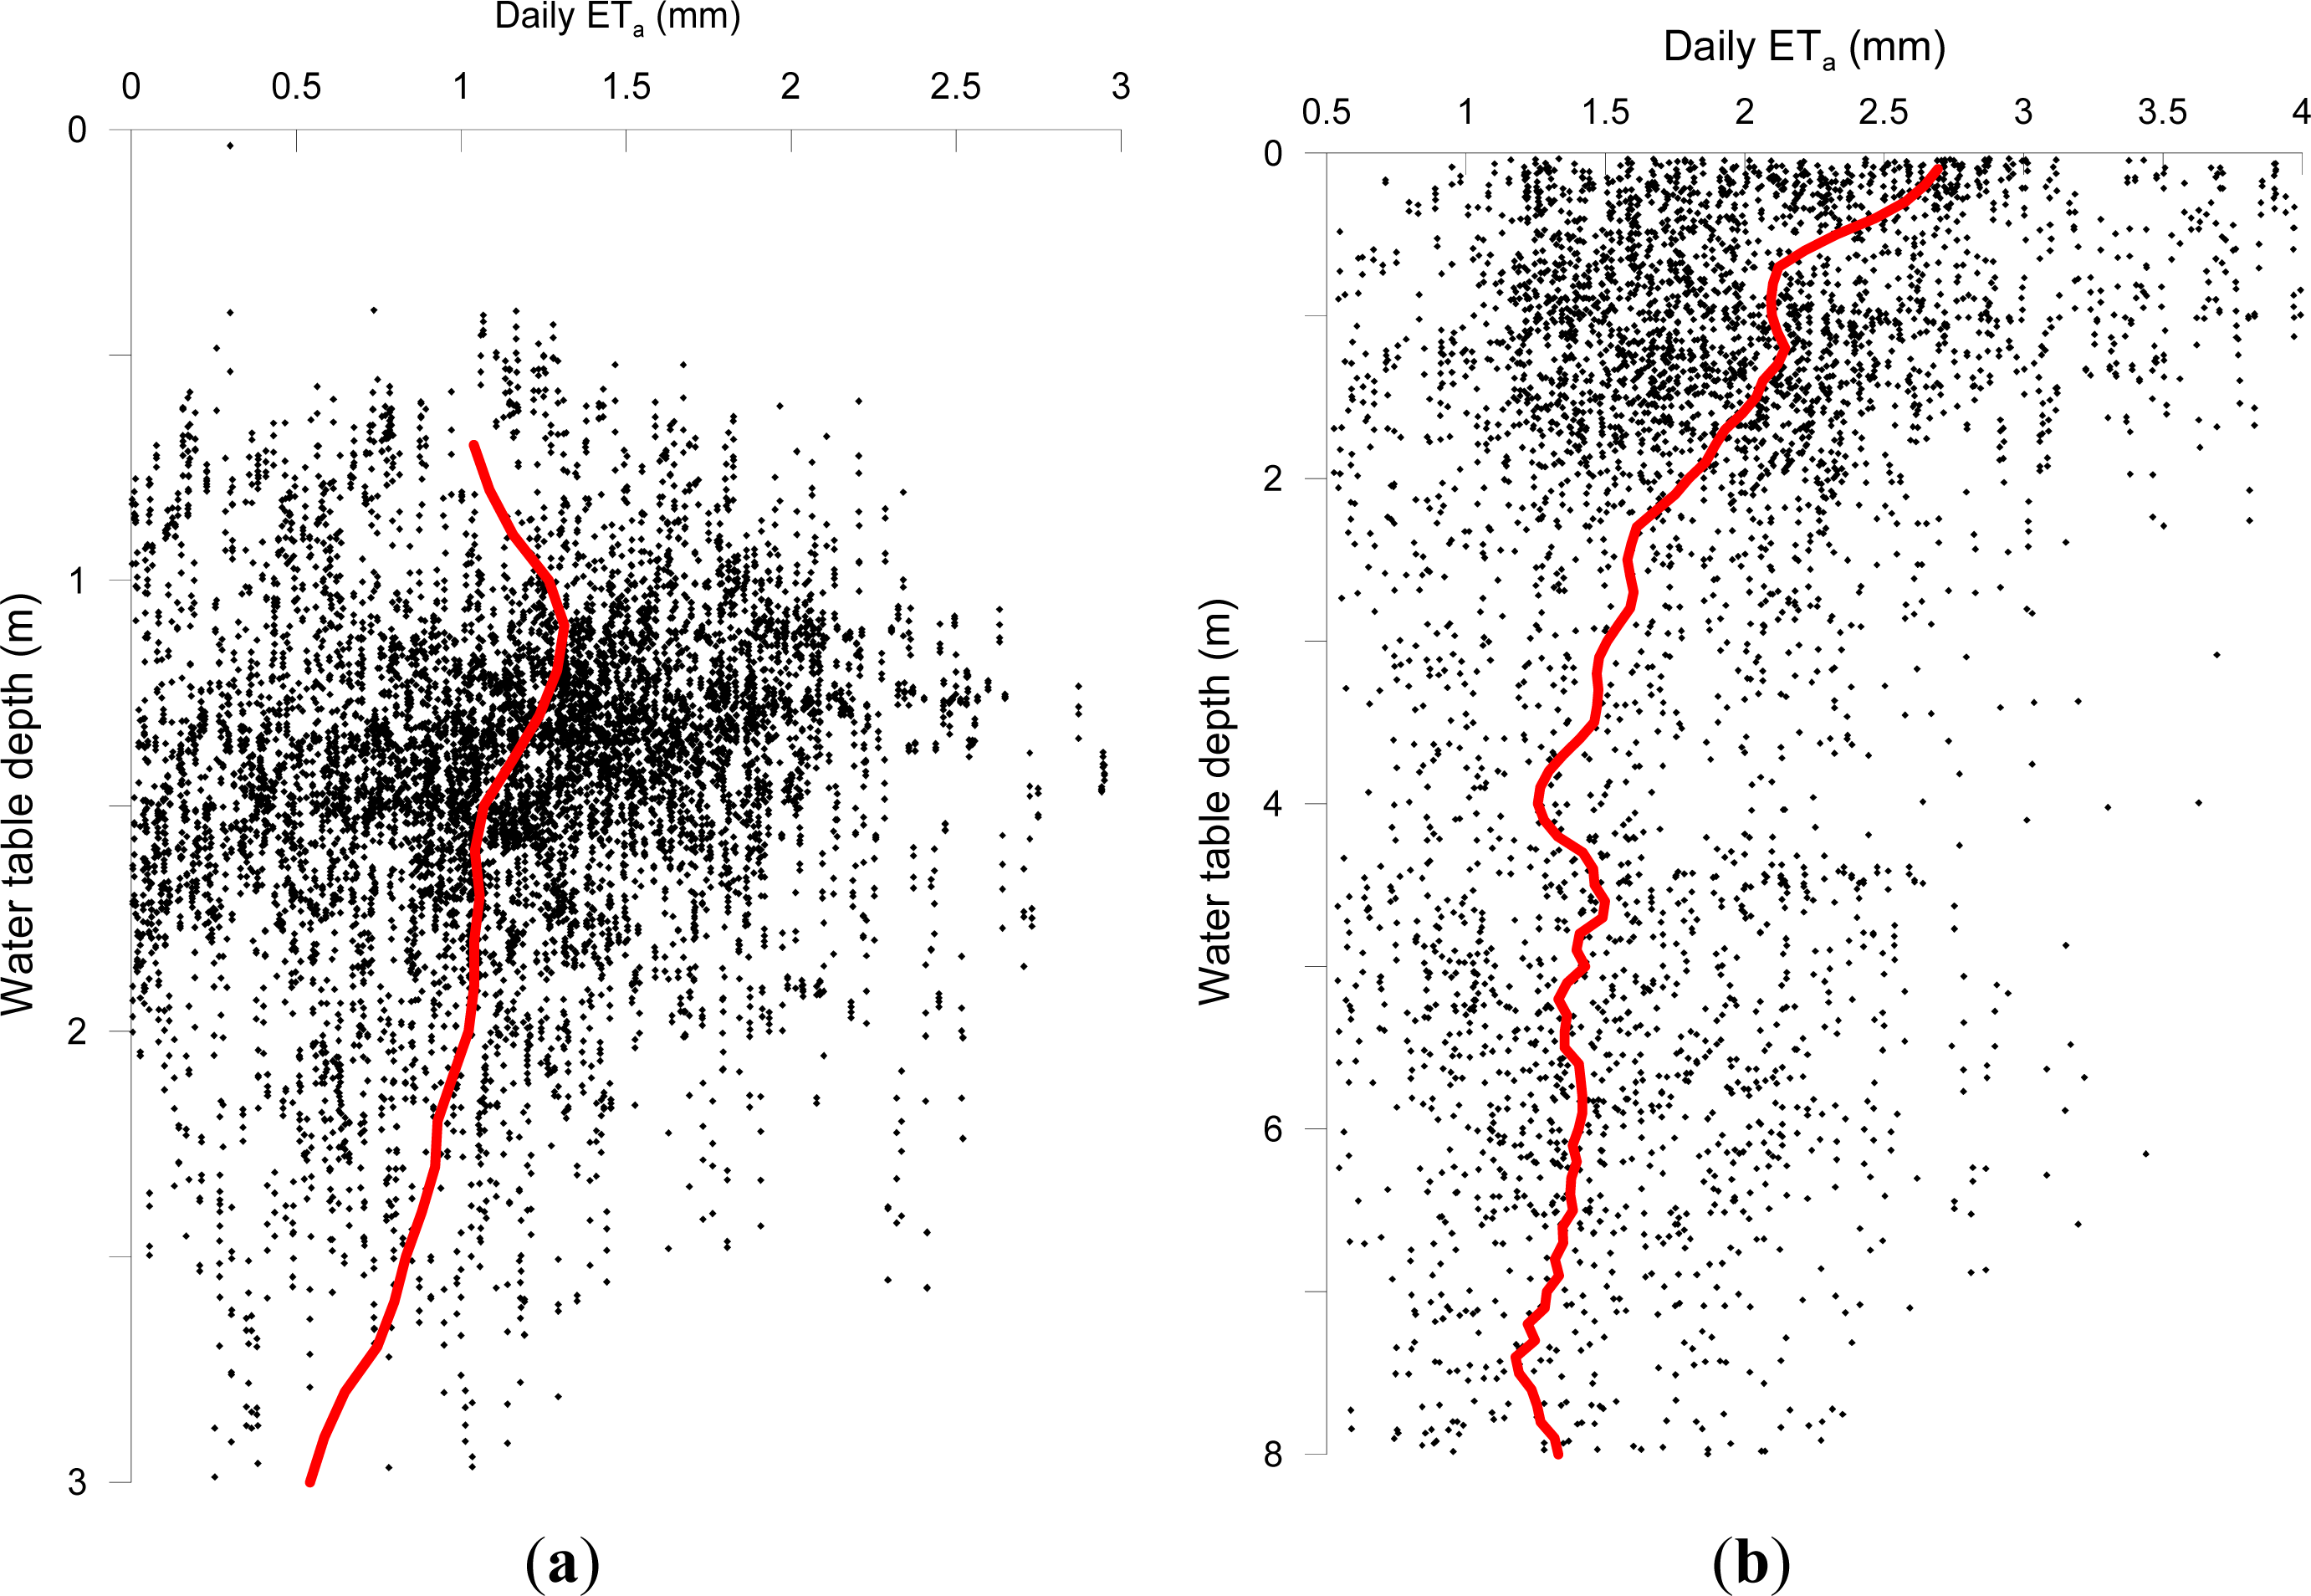
5.5. Water Table Depth and Actual SEBS Evapotranspiration
6. Conclusions
Acknowledgments
Conflicts of Interest
References
- Sun, R.; Gao, X.; Liu, C.-M.; Li, X.-W. Evapotranspiration estimation in the Yellow River Basin, China using integrated NDVI data. Int. J. Remote Sens 2004, 10, 2523–2534. [Google Scholar]
- Glenn, E.P.; Huete, A.R.; Nagler, P.L.; Hirschboeck, K.K.; Brown, P. Review: Integrating remote sensing and ground methods to estimate evapotranspiration. Crit. Rev. Plant Sci 2007, 26, 139–168. [Google Scholar]
- Yang, D.; Chen, H.; Lei, H. Estimation of evapotranspiration using a remote sensing model over agricultural land in the North China Plain. Int. J. Remote Sens 2010, 31, 3783–3798. [Google Scholar]
- Rwasoka, D.T.; Gumindoga, W.; Gwenzi, J. Estimation of actual evapotranspiration using the surface Energy Balance System(SEBS) algorithm in the Upper Manyame catchment in Zimbabwe. Phys. Chem. Earth 2011, 36, 736–746. [Google Scholar]
- Nagler, P.L.; Glenn, E.P.; Nguyen, U.; Scott, R.L.; Doody, T. Estimation riparian and agricultural actual evapotranspiration by reference evapotranspiration and MODIS enhanced vegetation index. Remote Sens 2013, 5, 3849–3871. [Google Scholar]
- Brown, K.W.; Rosenberg, N.J. A resistance model to predict evapotranspiration and its application to a sugar beet field. Agron. J 1973, 65, 341–347. [Google Scholar]
- Kite, G.W.; Pietroniro, A. Remote sensing application in hydrological modeling. Hydrol. Sci 1996, 41, 563–591. [Google Scholar]
- Rango, A.; Shalaby, A.I. Urgent Operational Applications of Remote Sensing in Hydrology. In Operational Hydrology Report 43; World Meteorology Organization: Geneva, Switzerland, 1999. [Google Scholar]
- Sobrino, J.A.; Gómez, M.; Jiménez-muñoz, J.C.; Olioso, A. Application of a simple algorithm to estimate daily evapotranspiration from NOAA-AVHRR images for the Iberian Peninsula. Remote Sens. Environ 2007, 110, 139–148. [Google Scholar]
- Morse, A.; Tasumi, M.; Allen, R.G.; Kramber, W.J. Application of the SEBAL Methodology for Estimating Consumptive Use of Water and Stream Flow Depletion in the Bear River Basin of Idaho through Remote Sensing. In The Raytheon Systems Company-Earth Observation System Data and Information System Project; The Raytheon Systems Company: Idaho Falls, ID, USA, 2000; p. 107. [Google Scholar]
- Menenti, M.; Choudhury, B.J. Parametrization of Land Surface Evapotranspiration Using a Location Dependent Potential Evapotranspiration and Surface Temperature Range. In Exchange Processes at the Land Surface for a Range of Space and Time Scales; Bolle, H.J., Ed.; IAHS: Wallingford, CT, USA, 1993; pp. 561–588. [Google Scholar]
- Norman, J.M.; Kustas, W.P.; Humes, K.S. A two-source approach for estimating soil and vegetation energy fluxes in observations of directional radiometric surface temperature. Agricult. For. Meteorol 1995, 77, 263–293. [Google Scholar]
- Bastiaanssen, W.G.M.; Ahmed, M.; Chemin, Y. Satellite surveillance of evaporative depletion across the Indus Basin. Water Resour. Res 2002, 38, 1273–1282. [Google Scholar]
- Roerink, G.J.; Su, Z.; Menenti, M. S-SEBI: A simple remote sensing algorithm to estimate the surface energy balance. Phys. Chem. Earth B 2000, 25, 147–157. [Google Scholar]
- Su, Z. The Surface Energy Balance System (SEBS) for estimation of turbulent heat fluxes. Hydrol. Earth Syst. Sci 2002, 6, 85–99. [Google Scholar]
- Gowda, P.H.; Chavez, J.L.; Colaizzi, P.D.; Evett, S.R.; Howell, T.A.; Tolk, J.A. Remote sensing based energy balance algorithms for mapping ET. Trans. ASABE 2007, 50, 1639–1644. [Google Scholar]
- Kalma, J.D.; Mcvicar, T.R.; McCabe, M.F. Estimating land surface evaporation: A review of methods using remotely sensed surface temperature data. Surv. Geophys 2008, 29, 421–469. [Google Scholar]
- Kustas, W.; Anderson, M. Advances in thermal infrared remote sensing for land surface modeling. Agric. For. Meteorol 2009, 149, 2071–2081. [Google Scholar]
- Bastiaanssen, W.G.M.; Menenti, M.; Feddes, R.A.; Holtslag, A.A.M. A remote sensing surface energy balance algorithm for land (SEBAL). 1. Formulation. J. Hydrol. 1998, 212–213, 198–212. [Google Scholar]
- Allen, R.G.; Tasumi, M.; Trezza, R. Satellite-based energy balance for mapping evapotranspiration with internalized calibration (METRIC)-Model. J. Irrig. Drain. Eng 2007, 133, 380–394. [Google Scholar]
- Sun, J.; Salvucci, G.D.; Entekhabi, D.; Farhadi, L. Parameter estimation of coupled water and energy balance models based on stationary constraints of surface states. Water Resour. Res 2011, 47, W02512. [Google Scholar]
- Sun, J.; Salvucci, G.D.; Entekhabi, D. Estimates of evapotranspiration from MODIS and AMSR-E land surface temperature and moisture over the Southern Great Plains. Remote Sens. Environ 2012, 127, 44–59. [Google Scholar]
- Kustas, W.P.; Norman, J.M. A two-source approach for estimating turbulent fluxes using multiple angle thermal infrared observations. Water Resour. Res 1997, 33, 1495–1508. [Google Scholar]
- Anderson, M.C.; Kustas, W.P.; Norman, J.M. Upscaling flux observations from local to continental scales using thermal remote sensing. Agron. J 2007, 99, 240–254. [Google Scholar]
- Su, Z.; Schmugge, T.; Kustas, W.P.; Massman, W.J. An evaluation of two models for estimation of roughness height for heat transfer between the land surface and atmosphere. J. Appl. Meteorol 2001, 40, 1933–1951. [Google Scholar]
- Melesse, A.M.; Nangia, V. Estimation of spatially distributed surface energy fluxes using remotely-sensed data for agricultural fields. Hydrol. Process 2005, 19, 2653–2670. [Google Scholar]
- Melesse, A.M.; Frank, A.; Nangia, V.; Hanson, J. Analysis of energy fluxes and land surface parameters in a grassland ecosystem: A remote sensing perspective. Int. J. Remote Sens 2008, 29, 3325–3341. [Google Scholar]
- Senay, G.B.; Budde, M.; Verdin, J.P.; Melesse, A.M. A coupled remote sensing and simplified energy balance approach to estimate actual evapotranspiration from irrigated fields. Sensors 2007, 7, 979–1000. [Google Scholar]
- Melesse, A.M.; Oberg, J.; Nangia, V.; Beeri, O.; Baumgartner, D. Spatiotemporal dynamics of evapotranspiration at the Glacial Ridge prairie restoration in northwestern Minnesota. Hydrol. Process 2006, 20, 1451–1464. [Google Scholar]
- Kustas, W.P.; Anderson, M.C.; Norman, J.M.; Li, F. Utility of radiometric—Aerodynamic temperature relations for heat flux estimation. Bound.-Layer Meteorol 2007, 122, 167–187. [Google Scholar]
- Melesse, A.M.; Abtew, W.; Dessalegne, T. Evaporation estimation of Rift Valley Lakes: Comparison of models. Sensors 2009, 9, 9603–9615. [Google Scholar]
- Gokmen, M.; Vekerdy, Z.; Verhoef, A.; Verhoef, W.; Batelaan, O.; van der Tol, C. Integration of soil moisture in SEBS for improving evapotranspiration estimation under water stress conditions. Remote Sens. Environ 2012, 121, 261–274. [Google Scholar]
- Jia, L.; Su, Z.; van Den Hurk, B.J.J.M.; Menenti, M.; Moene, A.R.; de Bruin, H.A.R.; Yrisarry, J.J.B.; Ibanez, M.; Cuesta, A. Estimation of sensible heat flux using the surface energy balance system SEBS and ATSR measurements. Phys. Chem. Earth 2003, 28, 75–88. [Google Scholar]
- Ma, Y.; Song, M.; Ishikawa, H.; Yang, K.; Koike, T.; Jia, L.; Menenti, M.; Su, Z. Estimation of the regional evaporative fraction over the Tibetan plateau area by using Landsat-7 ETM data and the field observations. J. Meteorol. Soc. Jpn 2007, 85A, 295–309. [Google Scholar]
- Jin, X.M.; Schaepman, M.E.; Clevers, J.G.P.W.; Su, Z. Impact and consequences of evapotranspiration changes on water resources availability in the arid Zhangye Basin, China. Int. J. Remote Sens 2009, 30, 3223–3238. [Google Scholar]
- Su, Z.; Pelgrum, H.; Menenti, M. Aggregation effects of surface heterogeneity in land surface processes. Hydrol. Earth Syst. Sci 1999, 3, 549–563. [Google Scholar]
- Kustas, W.P.; Daughtry, C.S.T. Estimation of the soil heat flux/net radiation ratio from spectral data. Agric. For. Meteorol 1989, 49, 205–223. [Google Scholar]
- Monteith, J.L. Principles of Environmental Physics; Edward Arnold: London, UK, 1973. [Google Scholar]
- Van der Kwast, J.; Timmermans, W.; Gieske, A.; Su, Z.; Olioso, A.; Jia, L.; Elbers, J.; Karssenberg, D.; de Jong, S. Evaluation of the Surface Energy Balance System (SEBS) applied to ASTER imagery with flux-measurements at the SPARC 2004 site (Barrax, Spain). Hydrol. Earth Syst. Sci 2009, 13, 1337–1347. [Google Scholar]
- Brutsaert, W. Evaporation into the Atmosphere: Theory, History, and Applications; Reidel Publishing: Dordrecht, The Netherlands, 1982. [Google Scholar]
- Jin, S; Sader, S.A. MODIS time-series imagery for forest disturbance detection and quantification of patch size effects. Remote Sens. Environ 2005, 99, 462–470. [Google Scholar]
- Sakamoto, T.; Yokozawa, M.; Toritani, H.; Shibayama, M.; Ishitsuka, N.; Ohno, H. A crop phenology detection method using time-series MODIS data. Remote Sens. Environ 2005, 96, 366–374. [Google Scholar]
- Knight, J.K.; Lunetta, R.L.; Ediriwickrema, J.; Khorram, S. Regional Scale Land-Cover Characterization using MODIS-NDVI 250m multi-temporal imagery: A phenology based approach. GISci. Remote Sens 2006, 43, 1–23. [Google Scholar]
- Lunetta, R.S.; Knight, J.F.; Ediriwickrema, J.; Lyon, J.G.; Worthy, L.D. Landcover change detection using multi-temporal MODIS NDVI data. Remote Sens. Environ 2006, 105, 142–154. [Google Scholar]
- Wardlow, B.D.; Egbert, S.L.; Kastens, J.H. Analysis of time-series MODIS 250 m vegetation index data for crop classification in the US Central Great Plains. Remote Sens. Environ 2007, 108, 290–310. [Google Scholar]
- Caccamo, G.; Chisholm, L.A.; Bradstock, R.A.; Puotinen, M.L. Assessing the sensitivity of MODIS to monitor drought in high biomass ecosystems. Remote Sens. Environ 2011, 115, 2626–2639. [Google Scholar]
- Hwang, T.; Song, C.; Bolstad, P.V.; Band, L.E. Downscaling real-time vegetation dynamics by fusing multi-temporal MODIS and Landsat NDVI in topographically complex terrain. Remote Sens. Environ 2011, 115, 2499–2512. [Google Scholar]
- Le Marie, G.; Marsden, C.; Verhoef, W.; Ponzoni, F.J.; Seen, D.L.; Bégué, A.; Stape, J.L.; Nouvellon, Y. Leaf area index estimation with MODIS reflectance time series and model inversion during full rotations of Eucalyptus plantation. Remote Sens. Environ 2011, 115, 586–599. [Google Scholar]
- Kumar, S.V.; Peters-Lidard, C.D.; Tian, Y.; Houser, P.R.; Geiger, J.; Olden, S.; Lighty, L.; Eastman, J.L.; Doty, B.; Dirmeyer, P.; et al. Land Information System—An interoperable framework for high resolution land surface modeling. Environ. Model. Softw 2006, 21, 1402–1415. [Google Scholar]
- Badola, A. Validation of Surface Balance Systems SEBS over Forest Land Cover and Sensitivity Analysis of the Model. Faculty of Geo-Information and Earth Observation (ITC), University of Twente, Enschede, The Netherlands, 2009. [Google Scholar]


| Hydrological Sub-Regions | Area (km2) | Abbreviation |
|---|---|---|
| Mangya—Lenghu area | 56,194 | MLH |
| Harteng—Suganhu area | 20,137 | HSG |
| Yuqia—Chaidam area | 18,598 | YCD |
| Bayin—Delingha area | 16,119 | BDL |
| Dulan—Xisai area | 4,642 | DXS |
| Nalinggele—Wutumeiren area | 65,378 | WTM |
| Golmud area | 36,098 | GLM |
| Qaidam—Dulan area | 59,067 | QDL |
| Year | Total Basin | MLH | HSG | YCD | BDL | DDDXS | WTM | GLM | QDL |
|---|---|---|---|---|---|---|---|---|---|
| 2001 | 72.7 | 35.9 | 75.9 | 61.6 | 77.1 | 94.6 | 54.0 | 97.9 | 114.1 |
| 2002 | 73.9 | 46.5 | 74.0 | 66.5 | 90.8 | 115.1 | 51.1 | 86.0 | 115.5 |
| 2003 | 78.1 | 44.2 | 76.3 | 71.4 | 92.9 | 97.1 | 70.6 | 106.7 | 100.6 |
| 2004 | 84.5 | 51.0 | 78.4 | 64.4 | 75.7 | 97.9 | 69.4 | 113.6 | 127.9 |
| 2005 | 143.9 | 95.3 | 149.2 | 136.7 | 182.8 | 222.3 | 98.1 | 176.6 | 210.1 |
| 2006 | 123.2 | 86.5 | 118.9 | 109.4 | 119.9 | 162.9 | 103.4 | 155.9 | 166.9 |
| 2007 | 135.1 | 89.9 | 148.6 | 124.4 | 158.8 | 199.9 | 103.2 | 164.8 | 185.9 |
| 2008 | 144.8 | 107.4 | 158.9 | 133.1 | 155.3 | 205.7 | 115.6 | 173.8 | 190.5 |
| 2009 | 170.1 | 113.7 | 167.9 | 160.3 | 222.9 | 260.0 | 144.3 | 210.3 | 238.5 |
| 2010 | 169.2 | 134.9 | 143.5 | 149.3 | 153.3 | 199.9 | 132.7 | 220.3 | 232.9 |
| 2011 | 182.3 | 145.9 | 175.9 | 165.7 | 195.9 | 266.8 | 139.0 | 227.4 | 239.3 |
© 2013 by the authors; licensee MDPI, Basel, Switzerland This article is an open access article distributed under the terms and conditions of the Creative Commons Attribution license ( http://creativecommons.org/licenses/by/3.0/).
Share and Cite
Jin, X.; Guo, R.; Xia, W. Distribution of Actual Evapotranspiration over Qaidam Basin, an Arid Area in China. Remote Sens. 2013, 5, 6976-6996. https://doi.org/10.3390/rs5126976
Jin X, Guo R, Xia W. Distribution of Actual Evapotranspiration over Qaidam Basin, an Arid Area in China. Remote Sensing. 2013; 5(12):6976-6996. https://doi.org/10.3390/rs5126976
Chicago/Turabian StyleJin, Xiaomei, Renhong Guo, and Wei Xia. 2013. "Distribution of Actual Evapotranspiration over Qaidam Basin, an Arid Area in China" Remote Sensing 5, no. 12: 6976-6996. https://doi.org/10.3390/rs5126976