Parameterization of High Resolution Vegetation Characteristics using Remote Sensing Products for the Nakdong River Watershed, Korea

Abstract
: Mesoscale regional climate models (RCMs), the primary tool for climate predictions, have recently increased in sophistication and are being run at increasingly higher resolutions to be also used in climate impact studies on ecosystems, particularly in agricultural crops. As satellite remote sensing observations of the earth terrestrial surface become available for assimilation in RCMs, it is possible to incorporate complex land surface processes, such as dynamics of state variables for hydrologic, agricultural and ecologic systems at the smaller scales. This study focuses on parameterization of vegetation characteristics specifically designed for high resolution RCM applications using various remote sensing products, such as Advanced Very High Resolution Radiometer (AVHRR), Système Pour l’Observation de la Terre-VEGETATION (SPOT-VGT) and Moderate Resolution Imaging Spectroradiometer (MODIS). The primary vegetative parameters, such as land surface characteristics (LCC), fractional vegetation cover (FVC), leaf area index (LAI) and surface albedo localization factors (SALF), are currently presented over the Nakdong River Watershed domain, Korea, based on 1-km remote sensing satellite data by using the Geographic Information System (GIS) software application tools. For future high resolution RCM modeling efforts on climate-crop interactions, this study has constructed the deriving parameters, such as FVC and SALF, following the existing methods and proposed the new interpolation methods to fill missing data with combining the regression equation and the time series trend function for time-variant parameters, such as LAI and NDVI data at 1-km scale.1. Introduction
Mesoscale regional climate models (RCMs) are recognized as an essential and powerful tool to address scientific information associated with climate variability, changes and impacts at local and regional scales [1–3]. Both global and regional climate models have recently increased in sophistication and are being run at the increasingly higher resolution, which is supported by increases in the availability of remote sensing observations, as well as computational power. RCM simulations at higher resolutions are necessary for resource management and impact assessment, for example, climate change effects on water resources, ecosystem, extreme weather, hurricane frequency, and so on. The land surface models (LSMs) coupled to these climate models have also evolved from simple bucket models to sophisticated assimilation schemes by utilizing high resolution satellite data, such as from the Terra and Aqua platforms. With a large volume of available satellite remote sensing data of the earth terrestrial surface, it becomes possible to precisely monitor the dynamics of the land surface state variables for agricultural and land use management [4].
Numerous RCMs have been developed, applied, compared and improved by many scientists and research groups. Meanwhile, the next-generation weather research and forecasting (WRF) model was developed by a broad community of government and university researchers [5–7], and then the climate extension of the WRF (CWRF) has been developed to enhance the capability for climate applications [8,9]. The common land model (CoLM) [10], a state-of-the-art soil-vegetation-atmosphere transfer (SVAT) model, has been incorporated into the CWRF model with numerous crucial evaluations and updates for land processes [11–22]. For all RCMs, one of the essential components is the representation of surface-atmosphere interactions, which generally requires specification of surface boundary conditions (SBCs). The construction of SBCs based on best observational data is desired for the surface modules dynamically combined in RCM general applications for a specific region of the world. The required set of SBCs may generally depend on surface parameters specified by the formulation complexity in the model. The primary SBCs for use in CoLM have been constructed for North America or Asia domain at the 30-km grid scale [23–26]. Among the static SBCs, vegetation parameters are the fundamental input fields in CoLM, which play an important role in surface-atmosphere flux interactions. The vegetative SBCs consist of the land cover category (LCC), the fractional vegetation cover (FVC), the leaf area index (LAI) and the surface albedo localization factors (SALF) to mainly determine contribution partitioning between bare soil and vegetation for fluxes crucial to land-atmosphere interactions. Hence, this study has collected raw data sets at the fine resolution of 1 km from remote sensing satellite products provided by Advanced Very High Resolution Radiometer (AVHRR), Système Pour l’Observation de la Terre-VEGETATION (SPOT-VGT) or Moderate Resolution Imaging Spectroradiometer (MODIS) for complex land surface processes in the high resolution simulations, such as dynamics of state variables for hydrologic, agricultural and ecologic systems at smaller scales. This study has provided the deriving parameters, such as FVC and SALF, following the existing methodologies for 1-km scale SBCs in CoLM applications. This study has also proposed data interpolation methods for missing values, since it is important to construct 1-km SBCs without missing data, especially for time-variant parameters, such as NDVI and LAI.
The remote sensing observations provided in various map projections and different data formats often contain missing values or inconsistencies between variables. It is, therefore, significant and required for labor-intensive efforts to convert the vast and various raw data sets onto the RCM-specific grid mesh and model input data format. This study employs the Geographic Information System (GIS) software application tools from Environmental Systems Research Institute, Inc., particularly to determine the geographic conversion information from a specific map of each raw data to the identical RCM grid system. The missing values in raw data due to cloud contamination and atmospheric effects are filled by an interpolation scheme utilizing the regression equations between LAI and NDVI (main algorithm) and the cosine function based on the time series trend of observations (backup algorithm). This study has parameterized the high resolution vegetation characteristics by using remote sensing products and constructed the primary vegetative SBCs at the 1-km grid spacing over the Nakdong River Watershed domain in Korea, especially for future CoLM modeling efforts on climate-crop interactions. To assess impacts of the new SBCs treatments, future studies are required to perform the RCM climate sensitivity to these SBCs constructed at 1-km scale.
2. Study Area and General Considerations
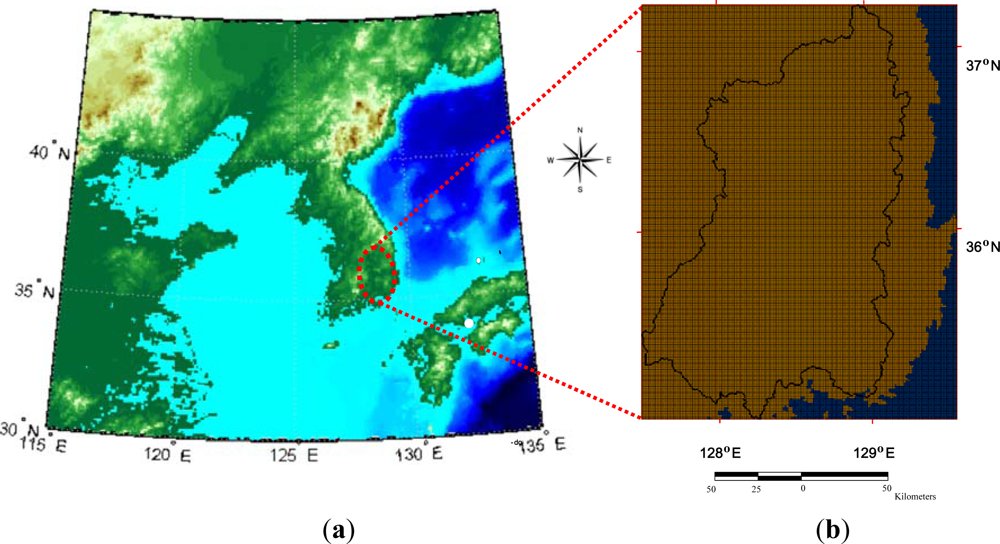
For high resolution simulations in the CoLM, especially on climate-crop interactions over the Nakdong River Watershed in Korea, this study sets the study domain centered at 38.0°N and 127.0°W on the Transverse Mercator map projection, with total grid numbers of 203 (west-east) × 268 (south-north) at the 1-km horizontal grid spacing. Figure 1(a) shows the country map of Korea overlaid with latitude and longitude lines, and Figure 1(b) denotes the 203 × 268 dimensional 1-km spacing grids over the Nakdong River Watershed domain projected on the Transverse Mercator map.
The vegetation fields of SBCs, such as LCC, FVC, LAI and SALF, need to be modified from the remote sensing products. Especially for acceptable switching time dependence between FVC and LAI, it may be arguable whether the FVC, LAI or both variables should carry the information for time variations of terrestrial vegetation phenology. This study determines a static FVC by long-term climatological controls for distinct LCC types, whereas LAI includes temporal variations, following the argument of Zeng et al.[27] that assuming a static FVC and time-variant LAI is more realistic from a modeling perspective.
The various remote sensing data sets that have different map projections and formats often contain missing values or inconsistencies between raw data sets. For most procedures to convert raw data sets onto the RCM-specific grid mesh and compute model input data parameters, this study mainly uses ArcInfo and ArcMap commands. In particular, IMAGEGRID and GRIDPOLY convert input data from the remote sensing image to the ArcGIS raster grid and to the polygon coverage formats, respectively; PROJECT remaps the raw data onto the Nakdong River watershed domain projection; GRID DOCELL and IF statements conditionally merge, replace or adjust different input datasets for more improved products. The time series LAI data that have missing value pixels due to cloud contamination and atmospheric effects are filled by an interpolation scheme based on the regression equations and time series trend of observations.
3. Results and Discussion on Parameterizations
This study has constructed and displayed the high resolution vegetative SBCs, such as LCC, FVC, LAI and SALF, from remote sensing products over the Nakdong River Watershed domain for prediction on fluxes crucial to land-atmosphere interactions in applications of distributed models, as well as land surface models at small scales. The details about the raw data sets and processing procedures for each vegetative SBCs over the study domain are discussed below.
3.1. Land Cover Category (LCC)
The CoLM uses the LCC to define static canopy data for morphological, optical and physiological properties in the land surface module. This study uses the 24-category USGS land cover classification developed from the April 1992–March 1993 AVHRR satellite-derived Normalized Difference Vegetation Index (NDVI) composites. This data is based on a flexible database structure and seasonal land cover region concepts. The regions are composed of relatively homogeneous land cover associations, which exhibit distinctive phenology and have common levels of primary production. Since some LSMs have used the International Geosphere Biosphere Programme (IGBP) 17-category land cover classification system [28,29], which is different from the USGS categories in the CoLM, there is a need to translate the old parameter sets for each IGBP class to the USGS LCC.
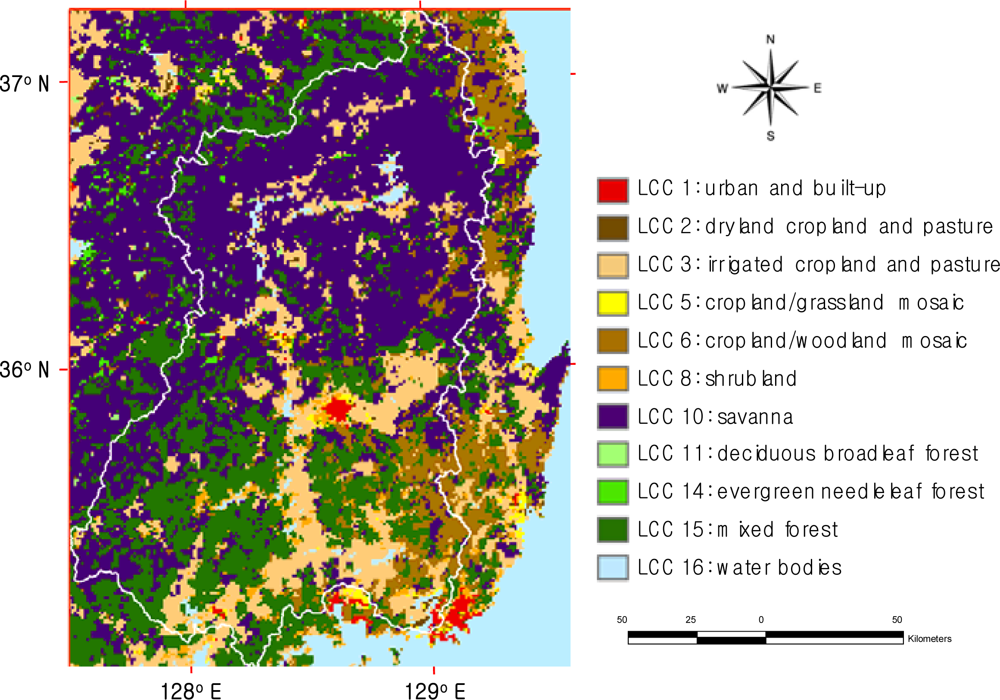
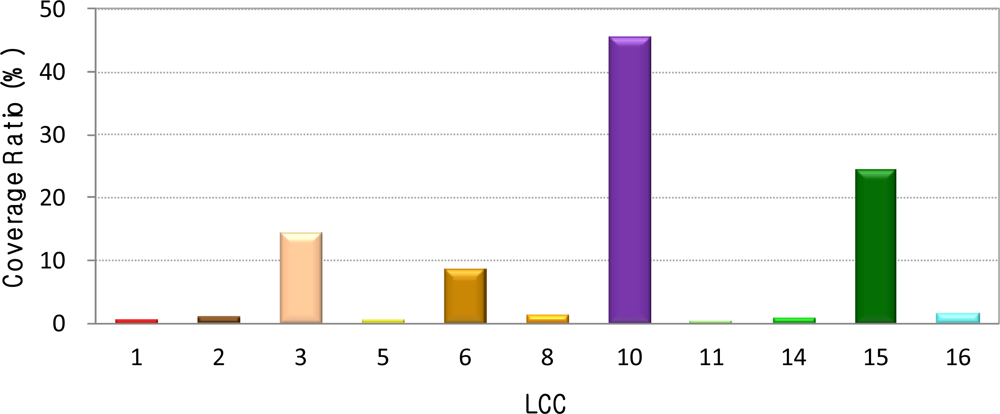
The raw data of the USGS LCC are available at 1-km spacing on the geographic coordinate system in BIL image format [30] converted into the ArcGIS raster grid and polygon coverage and then remapped onto the Transverse Mercator map projection. As illustrated in Figure 2 and Table 1, among the total 24-category USGS LCC, only 11 LCC types exist over the Nakdong River Watershed domain, and LCC types, 10 (savanna) of 45.5%, 15 (mixed forest) of 24.6% and 3 (irrigated cropland and pasture) of 14.6%, are in the majorities. Figure 3 shows the LCC geographic distribution over the Nakdong River Watershed domain.
3.2. Fractional Vegetation Cover (FVC)
The FVC is an ecological parameter that determines contribution partitioning between bare soil and vegetation for surface evapotranspiration, photosynthesis, albedo and other fluxes crucial to land-atmosphere interactions. The time-invariant FVC is computed from the NDVI product derived from the red and near infrared spectrums of multi–spectral remotely sensed data. The NDVI are measured from different satellite sensors, such as SPOT-VGT, MODIS, AVHRR, etc. The current CoLM uses the USGS LCC system developed from the AVHRR NDVI for April 1992–March 1993, but the AVHRR does not provide 1-km NDVI data for long-period time. For parameterizing the 1-km FVC, therefore, this study employs 1-km SPOT-VGT NDVI data that shows higher linear agreements with the AVHRR NDVI and is slightly better than the MODIS NDVI [31,32]. The SPOT-VGT NDVI data set is comprised of the vegetation data by a multispectral sensor instrument from the SPOT 4 platform and the SPOT 5 platform. The sensor has four spectral bands: blue (0.43–0.47 μm), red (0.61–0.68 μm), near-infrared (0.78–0.89 μm) and shortwave infrared (1.58–1.74 μm). The red and near-infrared bands are used to characterize vegetation, and the blue wavelength band is used for atmospheric correction for the other bands.
This study has collected the 10-day composites of the global 1-km SPOT-VGT NDVI product [33] for 10 years during 2001–2010. The raw NDVI data are adjusted to be confined by the USGS LCC for a consistent representation of water bodies, and the 10-year average of the annual maximum NDVI for each LCC are chosen to minimize the effect of cloud contamination on data quality. For each pixel, the FVC is computed by the following equation [34]:
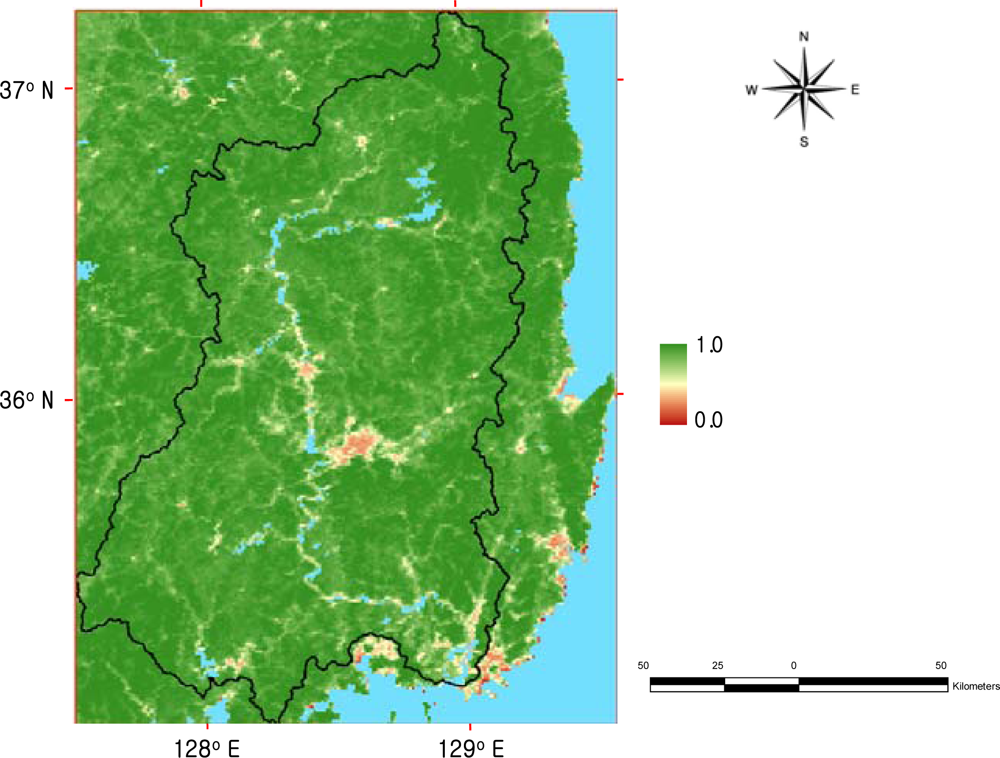
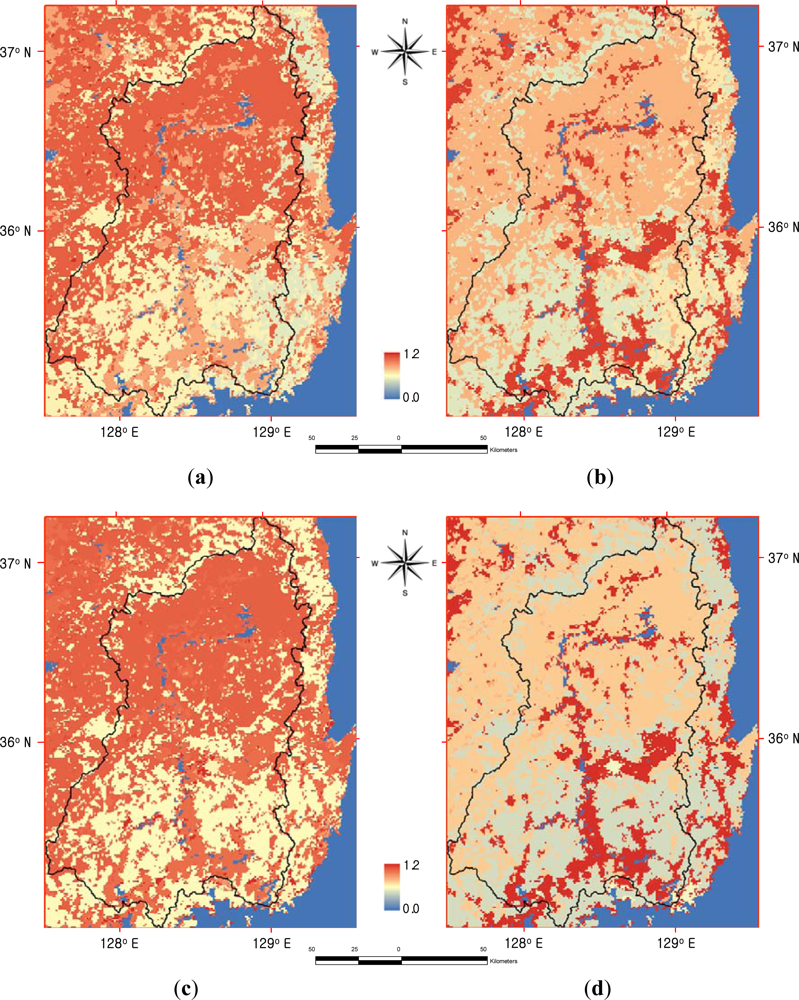
The SPOT-VGT NDVI data on the geographic coordinate system at 1-km spacing are remapped onto the Transverse Mercator map projection, and then the resultant 1-km FVC data are computed from Equation (1). Figure 4 illustrates the 1-km FVC geographic distribution derived from the average annual maximum SPOT-VGT NDVI over the Nakdong River Watershed domain. Table 1 presents the statistical quantities of average annual maximum SPOT-VGT NDVI and FVC values for the eleven LCC types along with the contributing area ratio over the Nakdong River Watershed domain. Note that time-variant FVC data sets can be constructed with 10-day composites of SPOT-VGT NDVI data following the same procedure for the consistency with the LAI time-series data sets, if necessary.
3.3. Leaf Area Index (LAI)
The LAI, an important structural property of a plant canopy, is defined as the total one-sided area of all green canopy elements over vegetated ground. The LAI data is required to calculate surface photosynthesis, evapotranspiration and net primary production as inputs for terrestrial energy, carbon, water cycle processes and vegetation biogeochemistry simulations. This study has constructed LAI data set from the MOD 15 LAI data [35] on the Integerized Sinusoidal projection, provided by MODIS from the Terra (EOS AM) and Aqua (EOS PM) satellites. The MOD 15 LAI data are the only available 1-km global data products updated once each eight-day period throughout each calendar year. This satellite-derived parameter is derived from the atmosphere corrected surface reflectance product MOD09, land cover product MOD12 and ancillary information on surface characteristics using a 3-D radiative transfer model and a look-up table (LUT) method (main algorithm). LUTs are generated for each biome by running the algorithm for various combinations of LAI and soil type. When the main algorithm fails, a backup algorithm based on relations between LAI and NDVI is utilized to retrieve LAI values.
Many studies have shown that the widely used spectral reflectance index NDVI is a good estimator of LAI and has been used to estimate LAI indirectly [36–41]. In order to check consistency between LAI and NDVI in different data sources and to find an effective and fast way for missing LAI values, this study has investigated the relationship between NDVI and LAI with respect to LCC types. For this analysis, both the raw LAI and NDVI data sets are respectively reconstructed as monthly time series for 10 years data sets during 2001–2010.
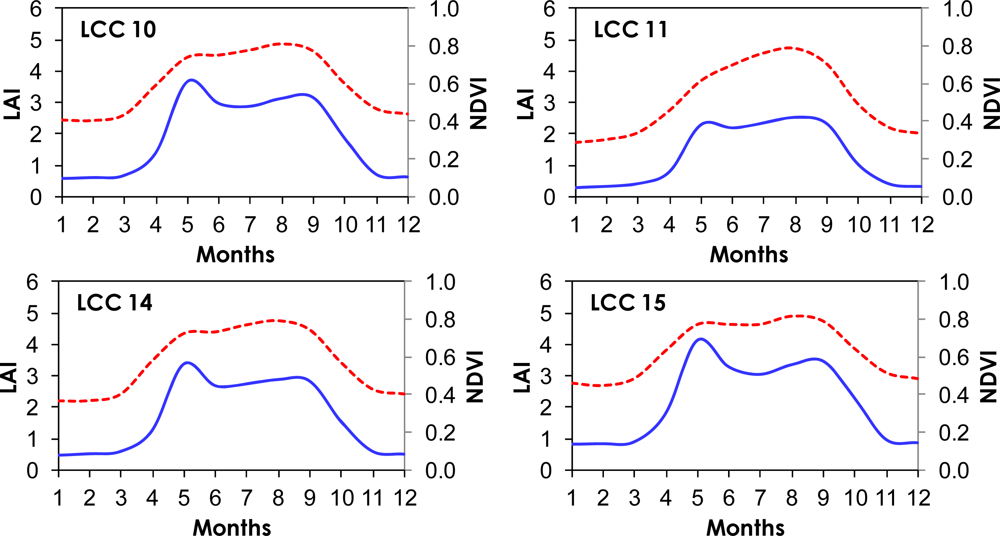
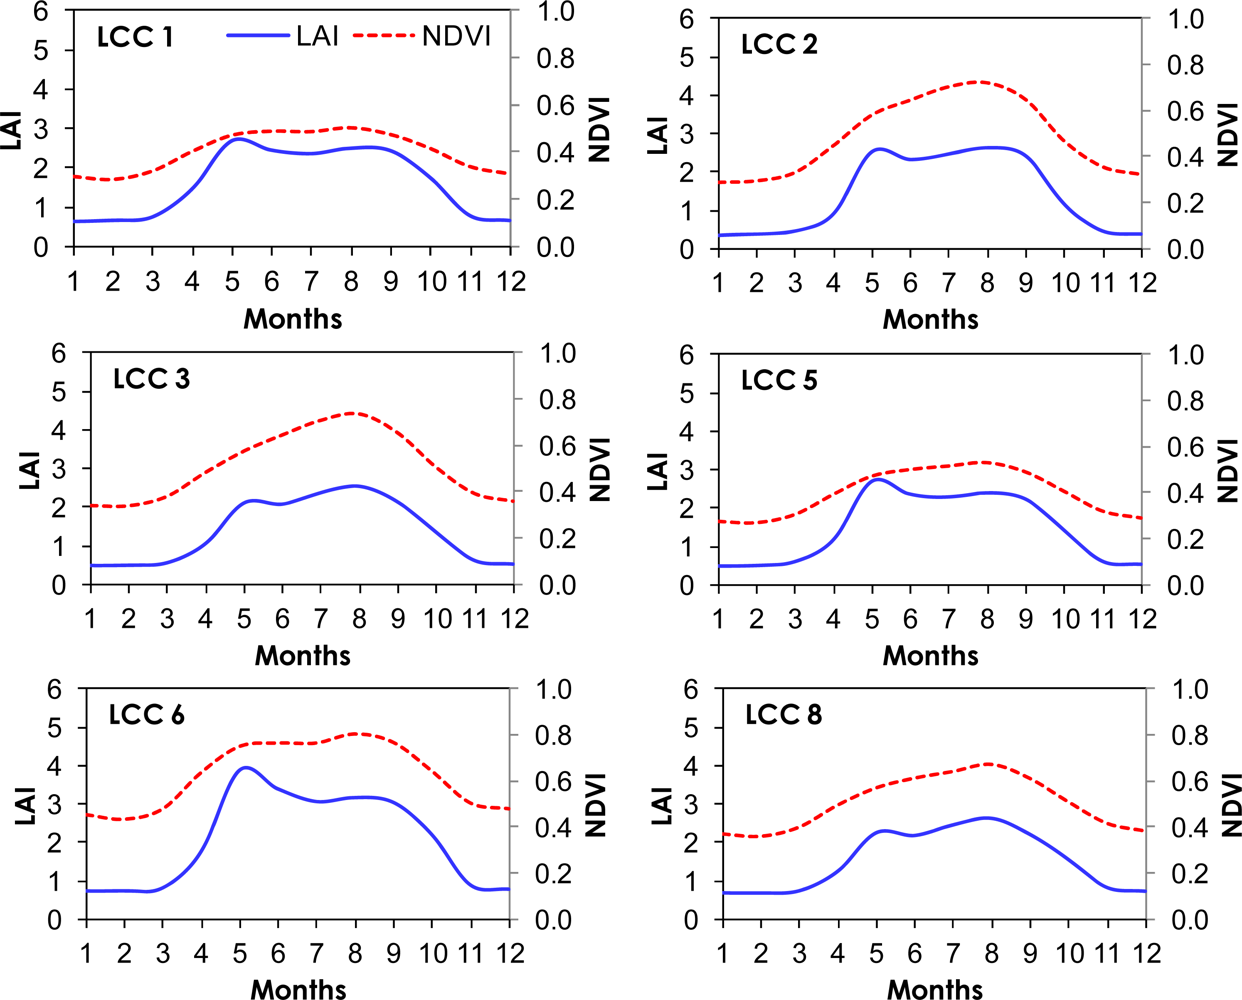
Figure 5 presents monthly variations of LAI and NDVI climatologies for the ten LCC regions (except LCC 16 (waterbodies) in the total eleven LCC types) over the Nakdong River Watershed domain. For most LCC types in the study domain, the annual cycle patterns of the LAI climatologies increase dramatically from winter to summer, which are similar to seasonal variations of NDVI climatologies. NDVI climatologies peak around August for the all LCC, while LAI climatologies have the maximum in May for LCC types 1 (urban and built-up land), 5 (cropland/grassland mosaic), 6 (cropland/woodland mosaic), 10 (savanna), 14 (evergreen needleleaf forest), 15 (mixed forest) and in August for LCC types 2 (dryland cropland and pasture), 3 (irrigated cropland and pasture), 8 (shrubland), 11 (deciduous broadleaf forest) over the Nakdong River Watershed. Since both LAI and NDVI data contain large uncertainties in winter due to cloud contamination, especially for LCC type 14 (evergreen needleleaf forests), low values in winter months need to be adjusted for the real growth rate [42].
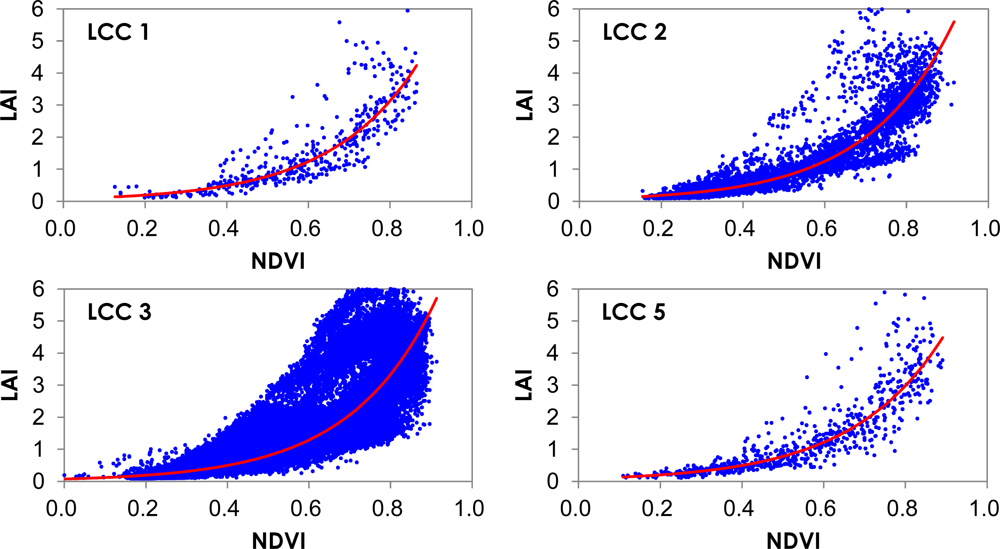
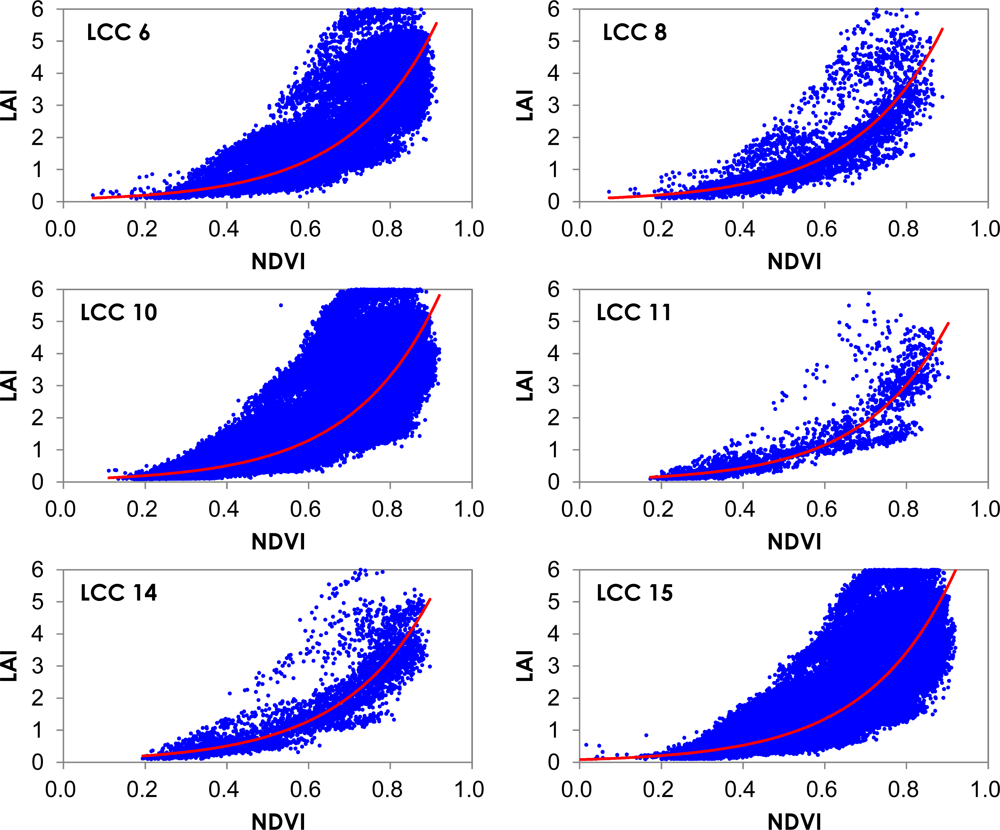
In order to understand the relationship between LAI and NDVI, this study has performed regression analysis by creating scatter plots and regression equations between LAI and NDVI for the ten LCC types over the study domain, as shown in Figure 6. Table 2 also summarizes and compares the regression equations of the LAI-NDVI relationship corresponding to each LCC type in the study domain. The LAI for the ten LCC types in the Nakdong River Watershed domain shows the relatively high correlations with the general exponential relationship of NDVI.
Applying NDVI data in regression equations can be rapidly and simply used for missing LAI predictions, usually measured though time-consuming algorithms. The raw missing LAI data are filled by regression equations in Table 2 and adjusted to be confined by the USGS LCC for a consistent representation of water bodies. Note that the adjusted LAI data with respect to unit ground area can be divided by the FVC (time-invariant or time-variant values) for further necessary process to define the green LAI with respect to vegetated area only, following Zeng et al.[42]. In case the monthly LAI still has missing value pixels due to missing NDVI values simultaneously, alternatively, they are filled by an interpolation equation assumed as the cosine function for the time series trend of the 10-year observations:
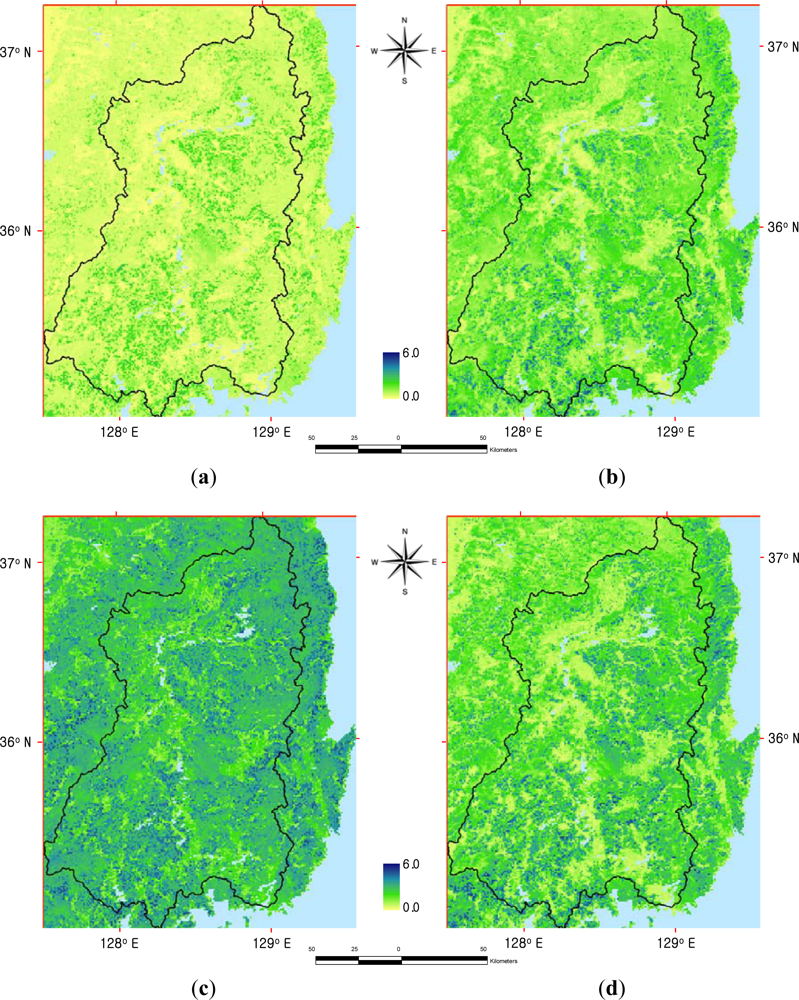
Figure 7 depicts seasonal variations of geographic distributions for January, April, July and October mean LAI climatologies after filling up all missing points in the Nakdong River Watershed. It is observed that the seasonal trend of LAI is apparent for certain categories, especially those with croplands, where nothing may remain on the field after crops are harvested in fall.
3.4. Soil Albedo Localization Factor (SALF)
The surface albedo has a strong influence on the surface energy budget and partitioning, such as circulation patterns, hydrological processes and absorption of photosynthetically active radiation (PAR), which determines the productivity of the Earth’s ecosystem [43–46]. In the original CoLM, the surface albedo parameterization [10] was adopted from Dickinson et al.[44], with improvements by Zeng et al.[42]. The current CoLM specifies separate albedos for bare soil αg,λ,η and vegetation canopy αc,λ,η and determines the total snow-free surface albedo αλ,η as an area weighted mixture of the two [24].
4. Conclusions
As the mesoscale climate and hydrology modeling studies need to incorporate more sophisticated linkages and process interactions at smaller scales from several 10s km to a few km, this study focuses on the construction of the high resolution vegetative SBCs by using 1-km spatial resolution remote sensing data from AVHRR, SPOT-VGT and MODIS, which are freely available. The several primary vegetative SBCs were constructed from remote sensing products at the 1-km grid spacing in the Nakdong River Watershed domain of the Korean Peninsula to parameterize the high resolution vegetation characteristics for use in the CoLM, especially for climate-crop interaction simulations.
The primary vegetative SBCs that play an important role in surface-atmosphere interactions include land cover category, fractional vegetation cover, leaf area index and soil albedo localization factor. This study appropriately manipulates and manages remote sensing observations with various map projections and different data formats that often contain missing values or inconsistencies between raw products. The GIS application tools are mainly employed to process vast amount of raw data sets. They determine the geographic conversion information from a specific map projection of each remote sensing data to the Nakdong River Watershed domain.
The land cover category types over the Nakdong River Watershed domain consist of the eleven LCC types among the total 24-category USGS LCC, and LCC types 10 (savanna), 15 (mixed forest) and 3 (irrigated cropland and pasture) command a majority in coverage. For the fractional vegetation cover parameter, the static FVC data was constructed with the 10-year average of the annual maximum NDVI to minimize the effect of cloud contamination on data quality, and the time-variant FVC data sets can be also constructed for consistency with the LAI time-series data sets, if necessary. To fill the missing values in raw LAI data due to cloud contamination and atmospheric effects, this study has examined the seasonal trend and consistency between SPOT-VGT NDVI and MODIS LAI and shown that the MODIS LAI data has very high correlations (coefficients of determination R2 are 0.773 to 868 for the ten LCC types) with exponential equations of the SPOT-VGT NDVI data for the study watershed. As a result, this study has proposed an interpolation scheme that consists of the regression equations between LAI and NDVI as the main algorithm and the cosine function for the time series trend of LAI observations as the backup algorithm when both LAI and NDVI values are missing. For surface albedo parameterization, the four kinds of soil albedo localization factors were computed with a combination of spectral bands (visible and near-infrared wavebands) and incident solar radiation (direct beam and diffuse radiation).
The construction of vegetative SBCs without missing data is required to improve model predictability in the high resolution RCM simulations. Hence, the 1-km vegetative SBCs constructed in this study are specifically designed for mesoscale modeling applications to all effective, dynamically coupled or uncoupled combinations of the surface modules, especially for future CWRF modeling efforts on climate-crop interactions. Since this study deals with various remote sensing products, the SBCs so constructed may carry over uncertainties inherent in the raw data. Note that the evaluation of the raw data quality from the remote sensing satellite products is beyond the scope of this study. The climatic impacts of these vegetative SBCs, singly or in combination, will be investigated and documented in the future. Future studies also will be required to construct other high resolution SBCs required in the CWRF model, implement the comprehensive set of SBCs for general CWRF applications and assess impacts of the SBCs treatments by analysis on the RCM climate sensitivity to these SBCs.
Acknowledgments
This research was supported by the Basic Science Research Program through the National Research Foundation of Korea (NRF) funded by the Ministry of Education, Science and Technology (2010-0003954).
References
- Giorgi, F.; Mearns, O. Introduction to special section: Regional climate modeling revisited. J. Geophys. Res 1999, 104, 6335–6352. [Google Scholar]
- Intergovernmental Panel on Climate Change. Climate Change 2001: The Scientific Basis; IPCC:; Cambridge University Press: Cambridge, UK/New York, NY, USA, 2001; p. 881. [Google Scholar]
- Leung, L.R.; Mearns, L.O.; Giorgi, F.; Wilby, R.L. Regional climate research. Bull. Amer. Meteorol. Soc 2003, 84, 89–95. [Google Scholar]
- Zhan, X.W.; Gao, W.; Qi, J.G.; Houser, P.R.; Slusser, J.R.; Pan, X.L.; Gao, Z.Q.; Ma, Y.J. Remote sensing and modeling the dynamics of soil moisture and vegetative cover of arid and semiarid areas. Proc. SPIE 2004, 5153, 51–60. [Google Scholar]
- The Weather Research & Forecasting Model. Available online: http://www.wrf-model.org/ (accessed on 16 August 2012).
- Chen, F.; Dudhia, J. Coupling an advanced land surface-hydrology model with the Penn. State-NCAR MM5 modeling system. Part I: Model implementation and sensitivity. Mon. Wea. Rev 2001, 129, 569–585. [Google Scholar]
- Klemp, J.; Skamarock, W.; Dudhia, J. Conservative split-explicit time integration methods for the compressible nonhydrostatic equations. Mon. Wea. Rev. 2007, 135, 2897–2913. [Google Scholar]
- Liang, X.-Z.; Li, L.; Dai, A.; Kunkel, K.E. Regional climate model simulation of summer precipitation diurnal cycle over the United States. Geophys. Res. Lett 2004, 31, L24208. [Google Scholar]
- Liang, X.-Z.; Xu, M.; Yuan, X.; Ling, T.; Choi, H.I.; Zhang, F.; Chen, L.; Liu, S.; Su, S.; Qiao, F.; et al. Regional climate-weather research and forecasting model. Bull. Amer. Meteor. Soc 2012, 93, 1363–1380. [Google Scholar]
- Dai, Y.; Zeng, X.; Dickinson, R.E.; Baker, I.; Bonan, G.B.; Bosilovich, M.G.; Denning, A.S.; Dirmeyer, P.A.; Houser, P.R.; Niu, G.; et al. The common land model. Bull. Amer. Meteor. Soc 2003, 84, 1013–1023. [Google Scholar]
- Niu, G.-Y.; Yang, Z.-L. The versatile integrator of surface and atmosphere processes (VISA) Part II: Evaluation of three topography based runoff schemes. Global Planet. Change 2003, 38, 191–208. [Google Scholar]
- Niu, G.-Y.; Yang, Z.-L.; Dickinson, R.E.; Gulden, L.E. A simple TOPMODEL-based runoff parameterization (SIMTOP) for use in GCMs. J. Geophys. Res 2005, 110, D21106. [Google Scholar]
- Liang, X.-Z.; Xu, M.; Zhu, J.; Kunkel, K.E.; Wang, J.X.L. Development of the Regional Climate-Weather Research and Forecasting Model (CWRF): Treatment of Topography. Proceedings of the 2005 WRF/MM5 User’s Workshop, Boulder, CO, USA, 27–30 June 2005; p. 5.
- Niu, G.-Y.; Yang, Z.-L. Effects of frozen soil on snowmelt runoff and soil water storage at a continental scale. J. Hydrometeorol 2006, 7, 937–952. [Google Scholar]
- Qian, T.; Dai, A.; Trenberth, K.E.; Oleson, K.W. Simulation of global land surface conditions from 1948 to 2004: Part I: Forcing data and evaluations. J. Hydrometeorol 2006, 7, 953–975. [Google Scholar]
- Choi, H.I.; Kumar, P.; Liang, X.-Z. Three-dimensional volume-averaged soil moisture transport model with a scalable parameterization of subgrid topographic variability. Water Resour. Res 2007, 43, W04414. [Google Scholar]
- Niu, G.-Y.; Yang, Z.-L.; Dickinson, R.E.; Gulden, L.E.; Su, H. Development of a simple groundwater model for use in climate models and evaluation with Gravity Recovery and Climate Experiment data. J. Geophys. Res 2007, 112, D07103. [Google Scholar]
- Lawrence, P.J.; Chase, T.N. Representing a new MODIS consistent land surface in the Community Land Model (CLM3.0). J. Geophys. Res 2007, 112, G01023. [Google Scholar]
- Lawrence, D.M.; Thornton, P.E.; Oleson, K.W.; Bonan, G.B. The partitioning of evapotranspiration into transpiration, soil evaporation, and canopy evaporation in a GCM: Impacts on land-atmosphere interaction. J. Hydrometeorol 2007, 8, 862–880. [Google Scholar]
- Oleson, K.W.; Niu, G.-Y.; Yang, Z.-L.; Lawrence, D.M.; Thornton, P.E.; Lawrence, P.J.; Stockli, R.; Dickinson, R.E.; Bonan, G.B.; Levis, S.; et al. Improvements to the community land model and their impact on the hydrological cycle. J. Geophys. Res. 2008, 113, G01021. [Google Scholar]
- Choi, H.I.; Liang, X.-Z. Improved terrestrial hydrologic representation in mesoscale land surface models. J. Hydrometeorol 2010, 11, 797–809. [Google Scholar]
- Kim, E.S.; Choi, H.I.; Kim, S. Implementation of a topographically controlled runoff scheme for land surface parameterizations in regional climate models. KSCE J. Civ. Eng 2011, 15, 1309–1318. [Google Scholar]
- Liang, X.-Z.; Choi, H.L.; Kunkel, K.E.; Dai, Y.; Joseph, E.; Wang, J.X.L.; Kumar, P. Surface boundary conditions for mesoscale regional climate models. Earth Interact 2005, 9, 1–28. [Google Scholar]
- Liang, X.-Z.; Xu, M.; Gao, W.; Kunkel, K.E.; Slusser, J.; Dai, Y.; Min, Q.; Houser, P.R.; Rodell, M.; Schaaf, C.B.; et al. Development of land surface albedo parameterization bases on Moderate Resolution Imaging Spectroradiometer (MODIS) data. J. Geophys. Res 2005, 110, D11107. [Google Scholar]
- Gao, W.; Gao, Z.Q.; Choi, H.I.; Xu, M.; Slusser, J.R. Construction of surface boundary conditions for regional climate modeling in China by using the remote sensing data. Proc. SPIE 2005, 5884, 331–335. [Google Scholar]
- Choi, H.I. Use of sensor imagery data for surface boundary conditions in regional climate modeling. Sensors 2011, 11, 6728–6742. [Google Scholar]
- Zeng, X.; Dickinson, R.E.; Walker, A.; Shaikh, M.; DeFries, R.S.; Qi, J. Derivation and evaluation of global 1-km fractional vegetation cover data for land modeling. J. Appl. Meteor 2000, 39, 826–839. [Google Scholar]
- Belward, A.S. The IGBP–DIS Global 1 km Land Cover Data Set (DISCover): Proposal and Implementation Plans; IGBP–DIS Working Paper No. 13; IGBP–DIS Office: Toulouse, France, 1996; p. 61. [Google Scholar]
- Loveland, T.R.; Reed, B.C.; Brown, J.F.; Ohlen, D.O.; Zhu, Z.; Yang, L.; Merchant, J.W. Development of a global land cover characteristics database and IGBP DISCover from 1 km AVHRR data. Int. J. Remote Sens 2000, 21, 1303–1330. [Google Scholar]
- GLCC Database; US Geological Survey: Washington, DC, USA. Available online: http://edc2.usgs.gov/glcc/glcc.php (accessed on 28 June 2008).
- Brown, M.; Pinzón, J.; Didan, K.; Morisette, J.; Tucker, C. Evaluation of the consistency of long-term NDVI time series derived from AVHRR, SPOT-vegetation, SeaWiFS, MODIS, and Landsat ETM+ sensors. IEEE Trans. Geosci. Remote Sens 2006, 44, 1787–1793. [Google Scholar]
- Swinnen, E.; Veroustraete, F. Extending the SPOT-VEGETATION NDVI time series (1998–2006) back in time with NOAA-AVHRR data (1985–1998) for Southern Africa. IEEE Trans. Geosci. Remote Sens 2008, 46, 558–572. [Google Scholar]
- Free VEGETATION Products; VITO: Belgium. Available online: http://free.vgt.vito.be (accessed on 1 April 1998).
- Gutman, G.; Ignatov, A. The derivation of the green vegetation fraction from NOAA/AVHRR data for use in numerical weather prediction models. Int. J. Remote Sens 1998, 19, 1533–1543. [Google Scholar]
- MOD 15 LAI Data; US Geological Survey: Reston, VA, USA. Available online: https://lpdaac.usgs.gov/get_data (accessed on 10 November 2011).
- Colombo, R.; Bellingeri, D.; Fasolini, D.; Marino, C.M. Retrieval of leaf area index in different vegetation types using high resolution satellite data. Remote Sens. Environ 2003, 86, 120–131. [Google Scholar]
- Lu, L.; Li, X.; Ma, M.G.; Che, T.; Huang, C.L.; Veroustraete, F.; Dong, Q.H.; Ceulemans, R.; Bogaert, J. Investigating Relationship between Landsat ETM+ Data and LAI in a Semiarid Grassland of Northwest China. Proceedings of 2004 IEEE International Geoscience and Remote Sensing Symposium, Anchorage, AK, USA, 20– 24 September 2004; 6, pp. 3622–3625.
- Van Wijk, M.T.; Williams, M. Optical instruments for measuring leaf area index in low vegetation: application in arctic ecosystems. Ecol. Appl 2005, 15, 1462–1470. [Google Scholar]
- Steltzer, H.; Welker, J.M. Modeling the effect of photosynthetic vegetation properties on the NDVI-LAI relationship. Ecology 2006, 87, 2765–2772. [Google Scholar]
- Fan, L.; Gao, Y.; Brück, H.; Bernhofer, C. Investigating the relationship between NDVI and LAI in semiarid grassland in Inner Mongolia using in-situ measurements. Theor. Appl. Climatol 2009, 95, 151–156. [Google Scholar]
- Martinez, B.; Cassiraga, E.; Camacho, F.; Garcia-Haro, J. Geostatistics for mapping leaf area index over a cropland landscape: Efficiency sampling assessment. Remote Sens 2010, 2, 2584–2606. [Google Scholar]
- Zeng, X.; Shaikh, M.; Dai, Y.; Dickinson, R.E.; Myneni, R. Coupling of the common land model to the NCAR community climate model. J. Climate 2002, 15, 1832–1854. [Google Scholar]
- Charney, J.G.; Quirk, W.J.; Chow, S.-H.; Kornfield, J. A comparative study of the effects of albedo change on drought in semi-arid regions. J. Atmos. Sci 1977, 34, 1366–1385. [Google Scholar]
- Dickinson, R.E. Land surface processes and climate-surface albedos and energy balance. Adv. Geophys 1983, 25, 305–353. [Google Scholar]
- Mintz, Y. Chapter 6 The Global Climate. In The Sensitivity of Numerically Simulated Climates to Land-Surface Conditions; Houghton, J, Ed.; Cambridge University Press: New York, NY, USA, 1984; pp. 79–105. [Google Scholar]
- Sellers, P.J. Canopy reflectance, photosynthesis and transpiration. Int. J. Remote Sens 1985, 6, 1335–1372. [Google Scholar]


| LCC Type | Description | Coverage(%) | Max.NDVI | FVC |
|---|---|---|---|---|
| 1 | urban and built-up land | 0.7 | 0.50 | 0.54 |
| 2 | dryland cropland and pasture | 1.0 | 0.72 | 0.83 |
| 3 | irrigated cropland and pasture | 14.6 | 0.74 | 0.85 |
| 5 | cropland/grassland mosaic | 0.5 | 0.53 | 0.57 |
| 6 | cropland/woodland mosaic | 8.7 | 0.80 | 0.93 |
| 8 | shrubland | 1.4 | 0.67 | 0.76 |
| 10 | savanna | 45.5 | 0.81 | 0.95 |
| 11 | deciduous broadleaf forest | 0.4 | 0.79 | 0.92 |
| 14 | evergreen needleleaf forest | 0.9 | 0.79 | 0.92 |
| 15 | mixed forest | 24.6 | 0.82 | 0.95 |
| 16 | water bodies | 1.7 | - | - |
| LCC Type | Description | Regression Equations | R² | No. Of Pixels | No. Of Data |
|---|---|---|---|---|---|
| 1 | Urban and built-up land | 0.810 | 36 | 432 | |
| 2 | dryland cropland and pasture | 0.861 | 366 | 4,392 | |
| 3 | irrigated cropland and pasture | 0.828 | 5,388 | 64,656 | |
| 5 | cropland/grassland mosaic | 0.868 | 56 | 672 | |
| 6 | cropland/woodland mosaic | 0.811 | 3,645 | 43,740 | |
| 8 | shrubland | 0.773 | 395 | 4,740 | |
| 10 | savanna | 0.845 | 20,878 | 250,536 | |
| 11 | deciduous broadleaf forest | 0.863 | 196 | 2,352 | |
| 14 | evergreen needleleaf forest | 0.856 | 384 | 4,608 | |
| 15 | mixed forest | 0.813 | 11,099 | 133,188 |
Share and Cite
Choi, H.I. Parameterization of High Resolution Vegetation Characteristics using Remote Sensing Products for the Nakdong River Watershed, Korea. Remote Sens. 2013, 5, 473-490. https://doi.org/10.3390/rs5020473
Choi HI. Parameterization of High Resolution Vegetation Characteristics using Remote Sensing Products for the Nakdong River Watershed, Korea. Remote Sensing. 2013; 5(2):473-490. https://doi.org/10.3390/rs5020473
Chicago/Turabian StyleChoi, Hyun Il. 2013. "Parameterization of High Resolution Vegetation Characteristics using Remote Sensing Products for the Nakdong River Watershed, Korea" Remote Sensing 5, no. 2: 473-490. https://doi.org/10.3390/rs5020473