Article

Divergent Arctic-Boreal Vegetation Changes between North America and Eurasia over the Past 30 Years

1
Department of Earth and Environment, Boston University, 675 Commonwealth Avenue, Boston, MA 02215, USA
2
Atmospheric and Environmental Research Incorporated, Lexington, MA 02421, USA
*
Author to whom correspondence should be addressed.
These authors contributed equally to this work.
Remote Sens. 2013, 5(5), 2093-2112; https://doi.org/10.3390/rs5052093
Submission received: 1 March 2013 / Revised: 24 April 2013 / Accepted: 24 April 2013 / Published: 2 May 2013
(This article belongs to the Special Issue Monitoring Global Vegetation with AVHRR NDVI3g Data (1981-2011))

Abstract

:
Arctic-Boreal region—mainly consisting of tundra, shrub lands, and boreal forests—has been experiencing an amplified warming over the past 30 years. As the main driving force of vegetation growth in the north, temperature exhibits tight coupling with the Normalized Difference Vegetation Index (NDVI)—a proxy to photosynthetic activity. However, the comparison between North America (NA) and northern Eurasia (EA) shows a weakened spatial dependency of vegetation growth on temperature changes in NA during the past decade. If this relationship holds over time, it suggests a 2/3 decrease in vegetation growth under the same rate of warming in NA, while the vegetation response in EA stays the same. This divergence accompanies a circumpolar widespread greening trend, but 20 times more browning in the Boreal NA compared to EA, and comparative greening and browning trends in the Arctic. These observed spatial patterns of NDVI are consistent with the temperature record, except in the Arctic NA, where vegetation exhibits a similar long-term trend of greening to EA under less warming. This unusual growth pattern in Arctic NA could be due to a lack of precipitation velocity compared to the temperature velocity, when taking velocity as a measure of northward migration of climatic conditions.

1. Introduction

Vegetation dynamics play a key role in the changing climate system through important physical, chemical, and biological processes and feedbacks within the global carbon and hydrological cycles [1,2]. A principal feature of the changing climate is the observed increase in global surface temperatures over the past century—especially in the Arctic-Boreal region (also known as poleward amplification of warming) [3], which has been reported to significantly impact local vegetation [47]. Previous studies on these vegetation changes indicate different ecosystem responses in northern Eurasia (EA) and North America (NA), with persistent greening (increase in vegetation greenness) in EA, but which fragmented patterns in NA [4,8]. These divergent changes consist of continued circumpolar Arctic tundra greening [5,911], but Boreal forest browning (decrease in vegetation greenness), particularly in NA [10,1214].
While the causes of this divergence are myriad and complicated, temperature is construed as a dominant factor, given its strong influence on vegetation growth in the Arctic-Boreal region [47,15]. In the Arctic tundra region, strong positive feedbacks associated with expansion of tree/shrub and reduction in snow/sea ice extent, which further amplifies the warming, causes continued greening in the tundra [11,1619]. Vegetation changes in the Boreal region have been attributed to several factors—temperature-induced drought [12,13,20,21], increase in winter snow depth responsible for water supply [22], and disturbances (fires, insects) [10,14,23,24]. However, knowledge gaps exist as to whether the observed divergence in vegetation changes between EA and NA is persistent over time, and over what spatial scales, the study of which is critical to advancing our understanding in this area, and provides the principal motivation for this study.
In this paper, we utilize over 30 years of data on vegetation greenness, temperature, precipitation and other environmental factors in order to characterize the divergence in Arctic-Boreal vegetation changes between EA and NA.

2. Data and Methods

2.1. Data

2.1.1. AVHRR NDVI3g

Normalized Difference Vegetation Index (NDVI) is a radiometric measure of the amount of photosynthetically active radiation (∼400 to 700 nm) absorbed by chlorophyll in the green leaves of a vegetation canopy [25] and has proven to be a good surrogate of vegetation photosynthetic activity [26]. The latest version of the Normalized Difference Vegetation Index (GIMMS NDVI3g) data set generated from the Advanced Very High Resolution Radiometers (AVHRR) onboard a series of NOAA satellites (NOAA 7, 9, 11, 14, 16, 17 and 18) was used in this study. This data set was produced with the goal of improving data quality in the northerly lands where the growing seasons are short, using improved calibration procedures compared to previous versions (e.g., NDVIg) [5,27].
The NDVI3g data set has a spatial resolution of 8 × 8 km2. The maximum NDVI value over a 15-day period is used to represent each 15-day interval to minimize corruption of vegetation signals from atmospheric effects, scan angle effects, cloud contamination and effects of varying solar zenith angle at the time of measurement [28]. This compositing scheme results in two maximum-value NDVI composites per month. The entire available NDVI3g record—July 1981 to December 2011—was used in this study. NDVI values greater than 0.1 were used in this analysis, which eliminated spurious signals (e.g., from the soil background, etc.) not related to photosynthetically active vegetation.

2.1.2. Temperature and Precipitation Data

A station observation-based global land monthly mean surface air temperature dataset [29] developed from the Climate Prediction Center (CPC), National Centers for Environmental Prediction (NCEP) was used in this study. The data set is at 0.5° × 0.5° spatial resolution for the period from 1948 to present, based on observations collected from the Global Historical Climatology Network (GHCN) and the Climate Anomaly Monitoring System (CAMS). The temperature record between May and September from 1981 to 2011 was used to study the inter-annual variation.
Monthly total precipitation data were obtained from the Climatic Research Unit (CRU) TS (time-series) datasets with the current version 3.1. The CRU TS3.1 datasets are month-by-month variation in climate over the last century from 1901 to 2009 at a 0.5° × 0.5° spatial resolution with global coverage [30]. Precipitation is one of the nine climate variables obtained from station-based observations. Precipitation data for the period from January 1981 to December 2009 were used in this study to calculate the annual total precipitation.

2.1.3. Land Cover Data

The latest version of the MODIS International Geosphere-Biosphere Programme (IGBP) land cover map [31] and the Circumpolar Arctic Vegetation Map (CAVM) [32] were used in this study. The MODIS IGBP map was derived using spectral and temporal information from MODIS instruments aboard EOS Terra and Aqua platforms. It identified 17 land cover classes including 11 natural vegetation classes, three developed and mosaicked land classes, and three non-vegetated land classes. The CAVM map was used to identify the tundra vegetation and associated characteristics of the circumpolar region as a supplement to the IGBP classes (Figure 1).

2.1.4. Freeze/Thaw Data

Daily records of landscape freeze/thaw data for the period 1 January 1988 to 31 December 2007 were obtained from the National Snow and Ice Data Center (NSIDC). The data records include daily AM freeze/thaw, PM freeze/thaw and combined freeze/thaw, among other parameters at a spatial resolution of 25 × 25 km2[33]. The combined parameter, which describes daily AM and PM thawed or frozen ground state, both measured independently, was used to estimate dates of spring thaw and autumn freeze.

2.2. Methods

2.2.1. Definitions

Arctic-Boreal region: The Arctic (8.16 million km2) is defined here as the vegetated area north of 65°N, excluding crops and forests, but including the tundra south of 65°N. The Boreal region (17.86 million km2) is defined as the vegetated area between 45°N and 65°N, excluding crops, tundra, broadleaf forests and grasslands south of the mixed forests, but including needleleaf forests north of 65°N. These definitions are a compromise between ecological and climatological conventions. Importantly, they include all non-cultivated vegetation types within these two regions.
NA vs. EA: The Arctic-Boreal region is further divided into North America and northern Eurasia, where the North America continent contains Arctic vegetation with an area of 3.39 million km2 and Boreal vegetation with an area of 6.88 million km2, while the Eurasia continent contains Arctic vegetation with an area of 4.77 million km2 and Boreal vegetation with an area of 11.20 million km2. Iceland is included in North America instead of Eurasia.
Photosynthetically Active Period (PAP): The period between the dates of spring thaw and autumn freeze has been reported to be representative of the Photosynthetically Active Period [33,34]. Therefore, the combined parameter in the daily ground-state freeze/thaw data set (specifically, AM and PM thawed ground-state) was used to estimate, for each pixel (p) and year (y), a spring thaw date, [t1(p, y)], as the date corresponding to the eighth day of the first 15-day period in a given year with thawed ground (AM and PM thawed) for at least 12 days. Similarly, the end date of landscape thaw in the autumn, [t2(p, y)], was estimated as the date corresponding to the eighth day of the last 15-day period in a given year with thawed ground (AM and PM thawed) for at least 12 days. The resulting dates t1(p, y) and t2(p, y) were averaged over the 20-year period of the record (1988 to 2007) because the freeze/thaw data series is shorter than the NDVI data series (1981 to 2011). This might introduce an error because a tendency for lengthening ground non-frozen state has been reported [33,35]. However, this error should be small because the NDVI values at about t1 and t2 are low and contribute little to the PAP mean NDVI.
PAP mean NDVI (NPAP): Satellite data-based Normalized Difference Vegetation Index (NDVI) exhibits positive values during winter from evergreen vegetation, although vegetation photosynthetic activity is effectively zero due to frozen soils and/or cold air temperatures. Therefore, only NDVI values during the PAP are indicative of vegetation photosynthetic activity. NDVI values averaged over the PAP for each year are thus indicative of the mean vegetation photosynthetic activity over the growing season. Since there are differences in temporal and spatial resolutions between the NDVI3g and Freeze/Thaw data sets, bi-weekly NDVI data were transformed to daily data using linear interpolation and the PAP dates derived from Freeze/Thaw data in 25 km spatial resolution were resized to 8-km resolution as the NDVI data using nearest-neighbor interpolation. In addition, PAP mean NDVI would be set to invalid for a given pixel if 80% of the NDVI values of that pixel during the PAP were less than 0.1, so as to filter out poor quality data.
May-to-September mean temperature (TMS): PAP mean temperature could not be accurately evaluated because of the even coarser temporal resolution of temperature data (monthly) than the NDVI data set. Therefore, May-to-September mean temperature was used as a close analogue to PAP mean temperature. The use of May-to-September mean temperature instead of annual mean temperature is more suitable because photosynthetic activity occurs at temperatures above a given threshold (e.g., above 0 °C) during the growing season [33].
Annual total precipitation (PAT): Precipitation variation affects vegetation by modifying the soil moisture availability, and therefore both summer and winter precipitation contribute to the vegetation growth [22,36]. Therefore, annual total precipitation was used in this study by summing up the monthly total precipitation for each year.

2.2.2. Trend Estimation

Statistical models that assume stationary errors such as ordinary least square linear trend estimation will result in spurious significance if the time series has a unit root [37]. On the other hand, statistical methods that deal with non-stationary errors often suffer from low power, and are further affected by parameter selections [38]. We used a robust general model for trend estimation proposed by Vogelsang [38,39] with no requirement of a priori knowledge as to whether the time series is stationary or non-stationary, which also avoids estimation of autocorrelation parameters. This model has also been used in the previous studies [9,10,40].
By forming partial sums of the time series, the simple linear trend can be transformed to
z t = α t + β [ 1 2 ( t 2 + t ) ] + S t
where z t = j = 1 t y j and S t = j = 1 t ε j. The Ordinary Least Squares (OLS) estimate of β in this equation is the linear trend estimation. β is then evaluated for statistical significance using the tPST test [38,39]. It is robust, as the test is designed to have power when the error is stationary, and remains robust if there is high autocorrelation or a unit root in the errors. In addition, it also has high power for finite sample-size tests. It avoids parameter selections such as autocorrelation lag lengths as in the case of certain models for dealing with non-stationary errors.

2.2.3. Latitudinal Profile

Latitudinal variations/profiles of NPAP, TMS and PAT were calculated for the Arctic-Boreal region (shown in Figure 1). For each variable, values were averaged over each one-degree latitudinal band using valid pixels (i.e., only pixels within the Arctic-Boreal region and within NA, EA or circumpolar (CP) region). These values were weighed by the fraction of land area of the corresponding valid pixels to ensure correct spatial averaging. Examples of latitudinal profiles of May-to-September mean temperature and annual total precipitation from the period 1982–1986 (baseline period) are shown in Figure 2.

2.2.4. Velocity of Climate Change

To test northward movement, which characterizes the general pace of shifting climate in the Arctic-Boreal region, the velocity of climate change [41] can be used for temperature and precipitation. The concept of velocity translates temporal changes into space. For instance, northerly pixels are cooler than southerly ones in the baseline period. When these northerly pixels show a time trend in temperature or warming, the equivalent phenomenon in space is shifting southerly pixels to the north, in other words, northern movement of climate change. According to [41], the velocity of climate change along any direction can be defined as:
V θ = β S NS cos θ + S EW sin θ
where Vθ is the magnitude of velocity of a given variable (temperature, precipitation, etc.) along the direction θ, with North as 0° and moving clockwise on a 360° circle. β is the Vogelsang’s temporal trend estimation for each variable. SNS is the North-South spatial gradient, and SEW is the East-West spatial gradient, both of which are derived from the baseline period’s average (1982–1986) for each variable. Since velocity changes are along the North-South direction, the velocity of climate change along the North-South direction, VN, is the following when defining North as positive for both spatial gradient and velocity:
V N = β S NS
Both the spatial gradient map for the baseline period (1982–1986) and the trend estimation maps for long-term periods (1982–1999 and 1982–2011) were calculated using a 0.5° spatial resolution using May-to-September mean temperature and annual total precipitation, and thus the results for velocity of climate change were also based on the 0.5° × 0.5° map for these variables.

3. Results and Discussion

We use the mean NDVI over the Photosynthetically Active Period (NPAP) and the mean temperature from May to September (TMS) to represent the inter-annual vegetation dynamics and the corresponding temperature changes [5,
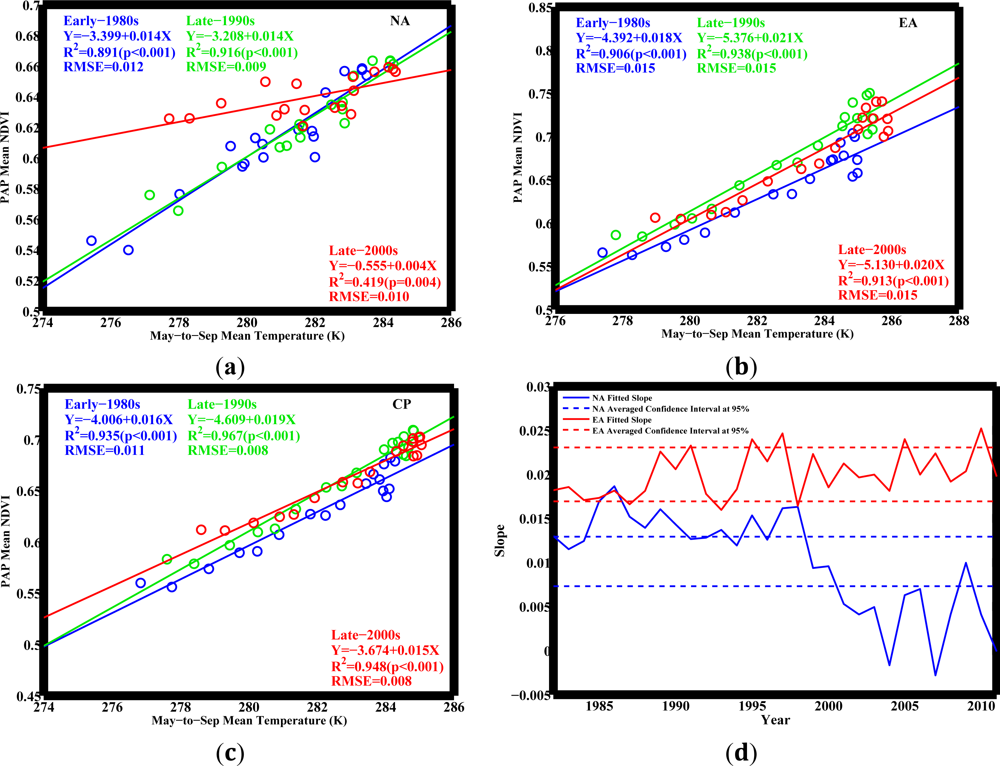
33] The tight coupling between temperature and vegetation growth can be found in the linear relationships between NPAP and TMS across latitudes in both NA and EA for the past 30 years (Figure 3). The circumpolar pattern follows EA, as the vegetated area in EA is 50% greater than that in NA. The consistent NPAPTMS relationships across both NA and EA (and hence in CP) during the early-1980s and late-1990s indicate stable ecosystem response to temperature.
However, this relationship changes during the late-2000s in NA in a manner that the response of northerly vegetation to temperature no longer resembles that of southerly vegetation observed during early-1980s (Figure 3(a)). This weakened relationship in NA has two implications: (1) The slope in the late-2000s (0.004) is 2/3 times smaller than the slope in the early-1980s (0.014). If future changes of temperature and vegetation growth follow the line of the late-2000s in NA, similar to the changes in the late-1990s following the line established in the early-1980s, the same amount of warming would cause 2/3 less greening compared to the changes in the early-1980s; (2) Taking a close look at the latitudinal points, these deviations are found mostly in the Arctic region of NA, where temperature is relatively low, but vegetation grows abnormally fast with rising temperatures in the period between the late-1990s and the late-2000s. Vegetation greening in this period is not subject to temperature change as before. Such deviations hint at novel vegetation responses, implying that temperature may no longer be the dominant factor as before governing vegetation growth in this region.

3.1. Spatial Analysis of Long-Term Trend

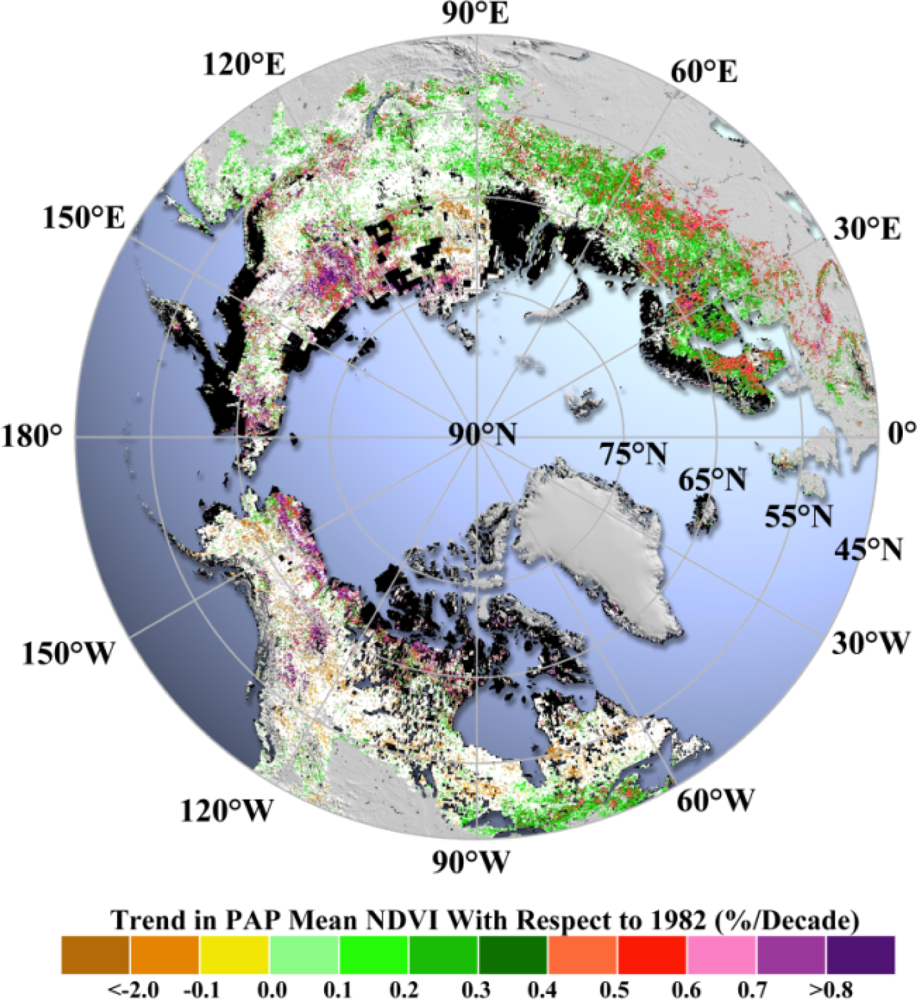
Pixel-wise application of the robust trend estimation model (cf. Section 2.2.2) shows that increases in NPAP for both NA and EA (Figure 4) prevail during the periods from 1982 to 2011. Spatial patterns are also assessed to provide a general picture of the difference in vegetation growth between NA and EA.
EA shows significant greening, i.e., about 45 times more greening (increase in NPAP) area than the browning (decrease in NPAP) area. By contrast, the greening area in NA is about two times larger than the browning area. Comparing the greening areas between EA and NA alone, the area in EA is 2.6 times larger than that in NA. In particular, the fraction of greening in the Arctic region of EA is similar to that of NA; and the fraction of greening in the Boreal region of EA is two times larger than that in NA (Table 2). Within the Boreal region, forests and other natural vegetation in NA have similar fractions of greening (14%–16%). However, more than 70% of the boreal forests in EA show greening compared to 44% of greening for other natural vegetation in EA (Table 3).
As for the browning trend, vegetation in NA has a larger area of browning compared to EA, especially in the Boreal region (Figure 4). Browning area in NA is 4.2 times larger than that in EA. In particular, the fraction of browning in the Arctic region of EA is still comparable to that in NA. On the contrary, the fraction of browning in the Boreal region of NA is 20 times larger than that in EA. Within the NA region, the majority of browning area is located in the Boreal zone. The fraction of browning in the Boreal region of NA is two times larger than that in the Arctic of NA (Table 2). Within the Boreal region, the fraction of browning area of forests is comparable to that of other natural vegetation (8.2% vs. 7.4%) in NA, while in EA almost no forests show browning (0.03%) compared to other natural vegetation (0.41%), even if both fractions are small (Table 3).
The observed spatial changes (Figure 4) are consistent with earlier studies reporting continued Arctic greening in NA and EA [4,5,811]. However, the previously reported Boreal browning in EA [9] is not found here, possibly due to the improved data quality in the northerly lands of the new AVHRR NDVI3g product [27]. However, the contrast between Boreal NA and EA, with more significant browning in NA, cannot be attributed to altered vegetation response to temperature, given that spatial patterns of vegetation and temperature trends are consistent [14,15,21,42]. Our analysis of temperature trends (Table 4) shows more extensive cooling in Boreal NA compared to Boreal EA, about seven times higher, which could plausibly account for the browning trends found in Boreal NA.
On the other hand, we also find more extensive cooling in Arctic NA compared to Arctic EA—about over seven times higher—but with comparable vegetation changes. This implies more greening under conditions of relatively less warming in Arctic NA. Therefore, the observed loss of vegetation sensitivity to temperature in NA can be partly attributed to the spatial distribution of vegetation and temperature trends. If vegetation response to temperature has changed in the Arctic of NA, one would suspect that other variables such as precipitation, insolation and CO2 concentration driving the changes of vegetation [7,24,43] in the Arctic-Boreal region could play a bigger role.
We also analyzed precipitation trends (Table 4), and found similar wetting/drying in NA and EA. For the Boreal region, the observed browning in NA could possibly be attributed to the more extensive cooling in the same region, when taking temperature as the dominant climatic factor, regardless of the similarities in precipitation. Based on the same reasoning, is it true that precipitation is becoming more important in the Arctic, as NDVI changes follow the precipitation spatial fractions (similar changes in both NA and EA), instead of temperature? It is difficult to judge merely based on the spatial patterns, as both warming and wetting are spatially more extensive than the observed vegetation changes in either NA or EA. Again, Figure 3 gives a hint that vegetation tends to be in line with the climate change, and warming causes vegetation to resemble the southerly species, which is in favor of that climate condition. Therefore, it is necessary to investigate the spatial pattern of climate itself and how it shifts over time.

3.2. Analysis of Latitudinal Profiles of Temperature and Precipitation

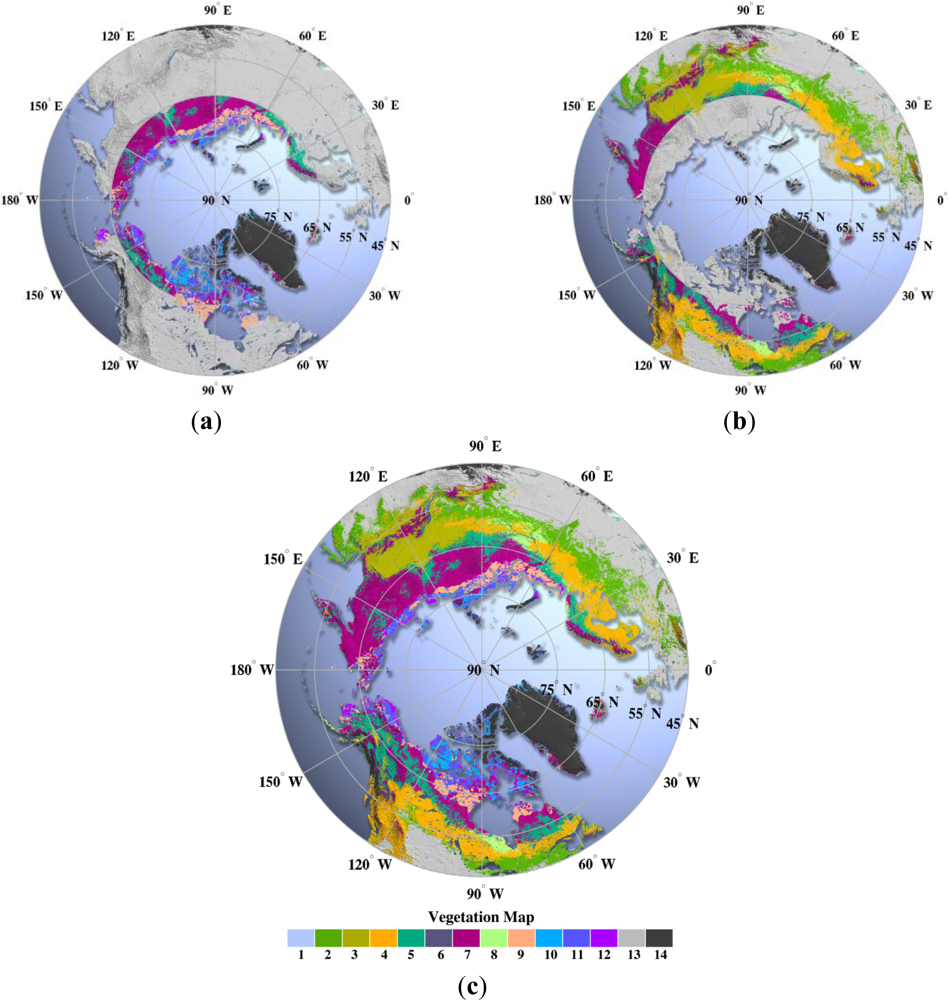
Different spatial patterns of climate can result in unique distributions of ecosystems across space. For example, there are more tundra regions in the North America even to south of 65°N [32], and most deciduous needleleaf forests are located in Eurasia [31]. Under the rapid climate changes in the recent decades, vegetation must keep pace with the shifting climate for survival [44]. In particular, temperature is most essential, as vegetation responses are expected to track the rate of isotherm migration over space [41,45,46]. Ground surveys also show evidence that vegetation appears to have an upward shift in mountainous areas [47,48] and a northward shift in tundra areas [16,18,19,49,50] responding to the temperature changes.
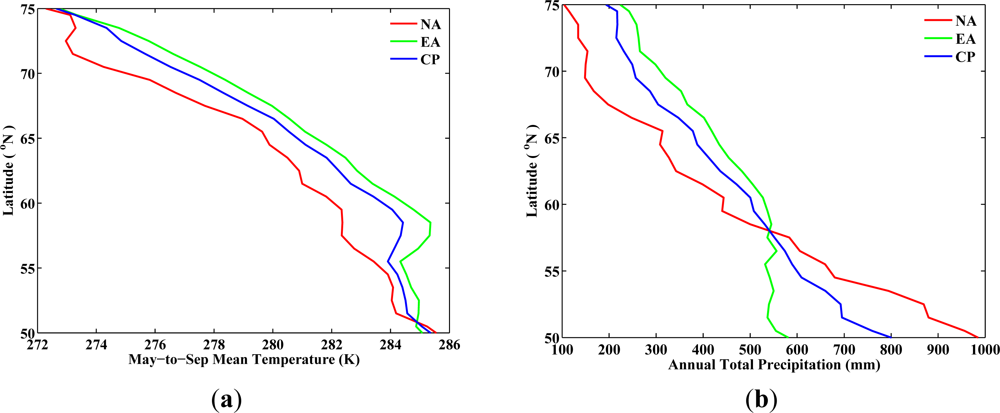
From the analysis for the period from 1982 to 1986 (baseline period), the latitudinal variations of TMS for NA and EA show similar changes across latitudes (Figure 2). Although the absolute values of TMS in EA are one to two degrees higher than the one in NA between latitudes 55°N and 70°N, the average rate of decrease in TMS per degree latitude toward north is 0.5 K for both NA and EA (Table 5). However, vegetated regions in NA and EA do not share the same spatial pattern in PAT across latitudes. The average rate of decrease in PAT per degree latitude toward north in NA is more than two times faster than that in EA (35 mm per degree in NA vs. 15 mm per degree in EA, Table 5). This implies that at a given latitude, northward migration of vegetation would require greater precipitation changes in NA than in EA, so as to create a favorable temperature and precipitation environment for vegetation to the south. Precipitation may not be as essential as temperature in governing the growth of local vegetation in the north [7], especially in the Arctic. It is still important for precipitation to keep the same pace as the temperature change in order to support the northward migration of structurally different vegetation, such as shrubs and trees, which need more water supplies. The choice of PAT is based on the fact that winter biological processes can contribute to the positive feedback of vegetation growth related to winter snow accumulation [22,36], and summer precipitation is also responsible for the vegetation changes [12,14,21,49].

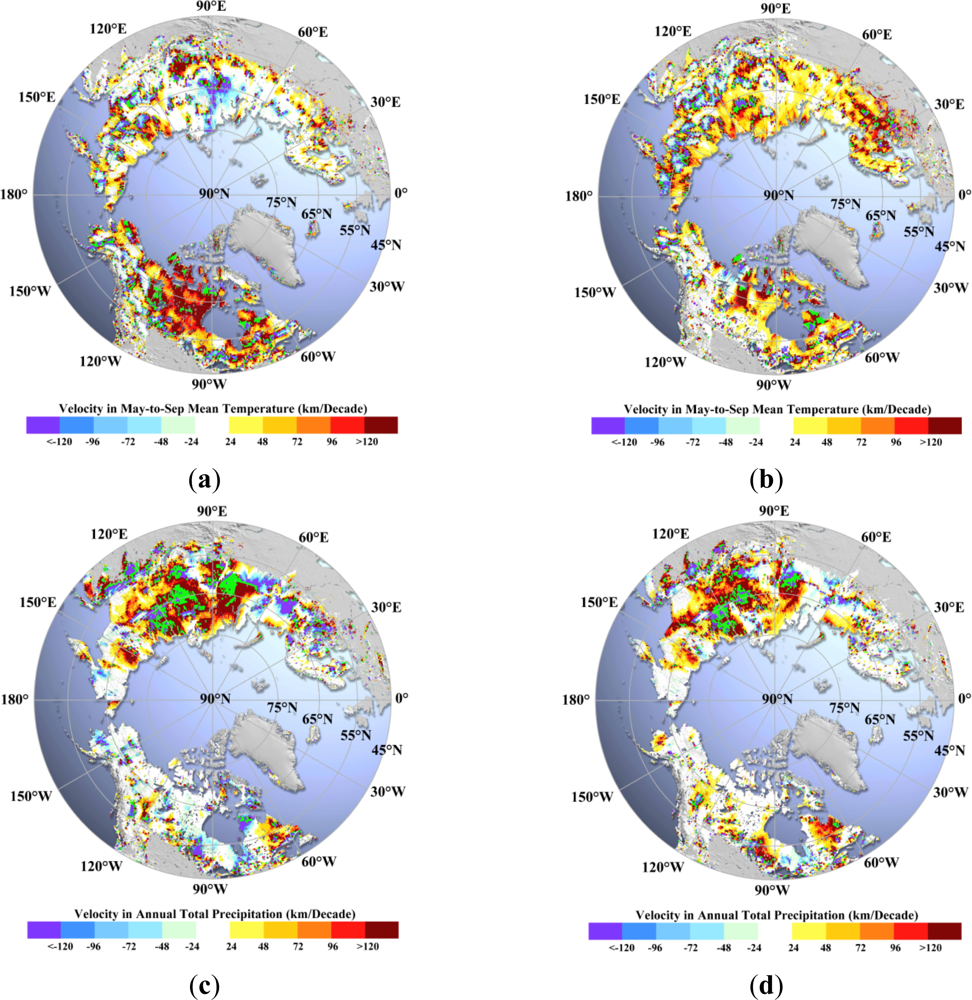
3.3. Velocity of Climate

Velocity of climate is defined as the ratio of the (time) trend to the baseline north-south gradient of a given variable (e.g., TMS, PAT, etc.). Although the velocity of precipitation is expected to have similar spatial patterns to temperature velocity, but with higher uncertainties [46], previous studies have only focused on vegetation response to temperature velocity [41]. We analyzed both temperature and precipitation velocities using TMS and PAT along the North-South direction for two time periods—the earlier 18-year period from 1982 to 1999, and the entire 30-year period from 1982 to 2011 (from 1982 to 2009 for precipitation)—with the emphasis on the spatial matching of temperature and precipitation velocities. Such a consistency in velocity is crucial to our hypothesis, i.e., a favorable environment for vegetation migration is only available when the precipitation velocity keeps up with the temperature velocity.
For the period from 1982 to 1999, both NA and EA show a majority of positive velocity of temperature change (Figure 5), while precipitation velocity in NA is mainly negative velocity in contrast to a mostly positive velocity in EA (Figure 5(c)). Positive velocity here indicates a northward movement. More than 28% (11%) of the vegetated areas in NA (EA) have high rates of positive velocity in temperature (>100 km/decade, Table 6). The fraction of areas with high rates of positive precipitation velocity (>100 km/decade) in EA is four times larger than that in NA (Table 6). Although the precipitation velocity has different patterns between NA and EA, vegetation in both regions still shows the consistent response to temperature (Figure 3). This can be due to the uncertainties due to the shorter time period, and lag in vegetation response to precipitation velocity [14,22,36,49].
For the period from 1982 to 2011, the velocity measurements are statistically more reliable due to the longer period. With both NA and EA showing a majority of positive velocity in both temperature and precipitation (Figure 5(b,d)), NA exhibits a lack of high rates of positive precipitation velocity compared to temperature velocity, particularly in the Arctic. Fractions of vegetated areas with high rates of positive velocity in temperature (>100 km/decade) are comparable between NA (17%) and EA (17%) (Table 6). However, the fraction of vegetated areas with a high rate of positive velocity of precipitation (>100 km/decade) is smaller in the Arctic of NA (4%) compared to temperature (17%), unlike in EA. This difference in velocities of temperature and precipitation in the Arctic of NA could account for dramatic (unpredictable) greening, but a later decrease in vegetation sensitivity to temperature changes. Concordant velocities of temperature and precipitation, such as in EA and in the Boreal of NA, support continued vegetation migration (greening).
The actual vegetation migration rates depend on other factors such as land cover types [44] and the sizes and distributions of natural habitats [51]. On the other hand, the inconsistent velocities of temperature and precipitation shifts in the Arctic of NA are creating new climate states, leading to unpredictable vegetation responses.

4. Concluding Remarks

The Arctic-Boreal regions of North America and Eurasia display divergent responses of vegetation growth to temperature changes. We also found substantial greening in Eurasia (46% of Eurasia show greening) and a larger fraction of browning in the Boreal region of North America (8%) than in the Boreal region of Eurasia (0.4%) using the recently updated satellite dataset. The analysis of temperature and precipitation latitudinal profiles indicates that precipitation is a key driving factor in vegetation growth, besides temperature, especially in North America. While Eurasia and North America have comparable temperature velocities, the velocity of precipitation in North America is much smaller compared to Eurasia. Particularly in Arctic North America, the fraction of areas showing high rates of precipitation velocity is always less than that of temperature velocity. This continuous lack of precipitation velocity results in unfavorable climates for northward migration. If the weakened sensitivity of vegetation growth to temperature increase observed in North America during the late-2000s holds true into the future, then, the Normalized Difference Vegetation Index will not increase as much as it did in the early-1980s or mid-1990s for the same amount of warming. Whether this divergence between North America and Eurasia will continue is worth further investigation. Nevertheless, it is clear that factors other than temperature are influencing trends in northern vegetation growth.

Acknowledgments

This research was funded by NASA Earth Science Division
  • Conflict of InterestThe authors declare no conflict of interest.

References

  1. Bonan, G.B. Forests and climate change: Forcings, feedbacks, and the climate benefits of forests. Science 2008, 320, 1444–1449. [Google Scholar]
  2. Heimann, M.; Reichstein, M. Terrestrial ecosystem carbon dynamics and climate feedbacks. Nature 2008, 451, 289–292. [Google Scholar]
  3. Serreze, M.C.; Barry, R.G. Processes and impacts of Arctic amplification: A research synthesis. Global Planet. Change 2011, 77, 85–96. [Google Scholar]
  4. Zhou, L.; Tucker, C.J.; Kaufmann, R.K.; Slayback, D.; Shabanov, N.V.; Myneni, R.B. Variations in northern vegetation activity inferred from satellite data of vegetation index during 1981 to 1999. J. Geophys. Res. 2001, 106, 20069–20083. [Google Scholar]
  5. Bhatt, U.S.; Walker, D.A.; Raynolds, M.K.; Comiso, J.C.; Epstein, H.E.; Jia, G.; Gens, R.; Pinzon, J.E.; Tucker, C.J.; Tweedie, C.E.; et al. Circumpolar arctic tundra vegetation change is linked to sea ice decline. Earth Interact. 2010, 14, 1–20. [Google Scholar]
  6. Macias-Fauria, M.; Forbes, B.C.; Zetterberg, P.; Kumpula, T. Eurasian Arctic greening reveals teleconnections and the potential for structurally novel ecosystems. Nat. Clim. Change 2012, 2, 613–618. [Google Scholar] [Green Version]
  7. Piao, S.; Friedlingstein, P.; Ciais, P.; Zhou, L.; Chen, A. Effect of climate and CO2changes on the greening of the Northern Hemisphere over the past two decades. In Geophys. Res. Lett.; 2006. [Google Scholar] [CrossRef]
  8. Bogaert, J.; Zhou, L.; Tucker, C.J.; Myneni, R.B.; Ceulemans, R. Evidence for a persistent and extensive greening trend in Eurasia inferred from satellite vegetation index data. J. Geophys. Res. 2002. [Google Scholar] [CrossRef]
  9. Beck, P.S.A.; Goetz, S.J. Satellite observations of high northern latitude vegetation productivity changes between 1982 and 2008: Ecological variability and regional differences. Environ. Res. Lett. 2011. [Google Scholar] [CrossRef]
  10. Goetz, S.J.; Bunn, A.G.; Fiske, G.J.; Houghton, R.A. Satellite-observed photosynthetic trends across boreal North America associated with climate and fire disturbance. Proc. Natl. Acad. Sci. USA 2005, 102, 13521–13525. [Google Scholar]
  11. Sturm, M.; Racine, C.; Tape, K. Climate change: Increasing shrub abundance in the Arctic. Nature 2001, 411, 546–547. [Google Scholar]
  12. Angert, A.; Biraud, S.; Bonfils, C.; Henning, C.C.; Buermann, W.; Pinzon, J.; Tucker, C.J.; Fung, I. Drier summers cancel out the CO2 uptake enhancement induced by warmer springs. Proc. Natl. Acad. Sci. USA 2005, 102, 10823–10827. [Google Scholar]
  13. Barber, V.A.; Juday, G.P.; Finney, B.P. Reduced growth of Alaskan white spruce in the twentieth century from temperature-induced drought stress. Nature 2000, 405, 668–673. [Google Scholar]
  14. Goetz, S.J.; Mack, M.C.; Gurney, K.R.; Randerson, J.T.; Houghton, R.A. Ecosystem responses to recent climate change and fire disturbance at northern high latitudes: Observations and model results contrasting northern Eurasia and North America. Environ. Res. Lett. 2007. [Google Scholar] [CrossRef]
  15. Wang, X.; Piao, S.; Ciais, P.; Li, J.; Friedlingstein, P.; Koven, C.; Chen, A. Spring temperature change and its implication in the change of vegetation growth in North America from 1982 to 2006. Proc. Natl. Acad. Sci. USA 2011, 108, 1240–1245. [Google Scholar]
  16. Chapin, F.S.; Sturm, M.; Serreze, M.C.; McFadden, J.P.; Key, J.R.; Lloyd, A.H.; McGuire, A.D.; Rupp, T.S.; Lynch, A.H.; Schimel, J.P.; et al. Role of land-surface changes in Arctic summer warming. Science 2005, 310, 657–660. [Google Scholar]
  17. Euskirchen, E.S.; McGUIRE, A.D.; Chapin, F.S. Energy feedbacks of northern high-latitude ecosystems to the climate system due to reduced snow cover during 20th century warming. Glob. Change Biol. 2007, 13, 2425–2438. [Google Scholar]
  18. Tape, K.; Sturm, M.; Racine, C. The evidence for shrub expansion in Northern Alaska and the Pan-Arctic. Glob. Change Biol. 2006, 12, 686–702. [Google Scholar]
  19. Walker, M.D.; Wahren, C.H.; Hollister, R.D.; Henry, G.H.R.; Ahlquist, L.E.; Alatalo, J.M.; Bret-Harte, M.S.; Calef, M.P.; Callaghan, T.V.; Carroll, A.B.; et al. Plant community responses to experimental warming across the tundra biome. Proc. Natl. Acad. Sci. USA 2006, 103, 1342–1346. [Google Scholar]
  20. Buermann, W.; Lintner, B.R.; Koven, C.D.; Angert, A.; Pinzon, J.E.; Tucker, C.J.; Fung, I.Y. The changing carbon cycle at Mauna Loa Observatory. Proc. Natl. Acad. Sci. USA 2007, 104, 4249–4254. [Google Scholar]
  21. Piao, S.; Wang, X.; Ciais, P.; Zhu, B.; Wang, T.; Liu, J. Changes in satellite-derived vegetation growth trend in temperate and boreal Eurasia from 1982 to 2006. Glob. Chang. Biol. 2011, 17, 3228–3239. [Google Scholar]
  22. Bulygina, O.N.; Groisman, P.Y.; Razuvaev, V.N.; Korshunova, N.N. Changes in snow cover characteristics over Northern Eurasia since 1966. Environ. Res. Lett. 2011. [Google Scholar] [CrossRef]
  23. Lantz, T.C.; Gergel, S.E.; Henry, G.H.R. Response of green alder (Alnus viridis subsp. fruticosa) patch dynamics and plant community composition to fire and regional temperature in north-western Canada. J. Biogeogr. 2010, 37, 1597–1610. [Google Scholar]
  24. Soja, A.J.; Tchebakova, N.M.; French, N.H.F.; Flannigan, M.D.; Shugart, H.H.; Stocks, B.J.; Sukhinin, A.I.; Parfenova, E.I.; Chapin, F.S., III; Stackhouse, P.W., Jr. Climate-induced boreal forest change: Predictions versus current observations. Global Planet. Change 2007, 56, 274–296. [Google Scholar]
  25. Myneni, R.B.; Hall, F.G.; Sellers, P.J.; Marshak, A.L. The interpretation of spectral vegetation indexes. IEEE. Trans. Geosci. Remote Sens. 1995, 33, 481–486. [Google Scholar]
  26. Myneni, R.B.; Keeling, C.D.; Tucker, C.J.; Asrar, G.; Nemani, R.R. Increased plant growth in the northern high latitudes from 1981 to 1991. Nature 1997, 386, 698–702. [Google Scholar]
  27. Pinzon, J.E.; et al. Revisiting error, precision and uncertainty in NDVI AVHRR data: Development of a consistent NDVI3g time series. Remote Sens. 2013. in preparation. [Google Scholar]
  28. Holben, B. Characteristics of maximum-value composite images from temporal AVHRR data. Int. J. Remote Sens. 1986, 7, 1417–1434. [Google Scholar]
  29. Fan, Y.; van den Dool, H. A global monthly land surface air temperature analysis for 1948–present. J. Geophys. Res. 2008. [Google Scholar] [CrossRef]
  30. Mitchell, T.D.; Jones, P.D. An improved method of constructing a database of monthly climate observations and associated high-resolution grids. Int. J. Climatol. 2005, 25, 693–712. [Google Scholar]
  31. Friedl, M.A.; Sulla-Menashe, D.; Tan, B.; Schneider, A.; Ramankutty, N.; Sibley, A.; Huang, X. MODIS Collection 5 global land cover: Algorithm refinements and characterization of new datasets. Remote Sens. Environ. 2010, 114, 168–182. [Google Scholar]
  32. Walker, D.A.; Raynolds, M.K.; Daniëls, F.J.A.; Einarsson, E.; Elvebakk, A.; Gould, W.A.; Katenin, A.E.; Kholod, S.S.; Markon, C.J.; Melnikov, E.S.; et al. The Circumpolar Arctic vegetation map. J. Veg. Sci. 2005, 16, 267–282. [Google Scholar]
  33. Kim, Y.; Kimball, J.S.; Zhang, K.; McDonald, K.C. Satellite detection of increasing Northern Hemisphere non-frozen seasons from 1979 to 2008: Implications for regional vegetation growth. Remote Sens. Environ. 2012, 121, 472–487. [Google Scholar]
  34. McDonald, K.C.; Kimball, J.S.; Njoku, E.; Zimmermann, R.; Zhao, M. Variability in springtime thaw in the terrestrial high latitudes: Monitoring a major control on the biospheric assimilation of atmospheric CO2 with spaceborne microwave remote sensing. Earth Interact. 2004, 8, 1–23. [Google Scholar]
  35. Zhang, K.; Kimball, J.S.; Kim, Y.; McDonald, K.C. Changing freeze-thaw seasons in northern high latitudes and associated influences on evapotranspiration. Hydrol. Process. 2011, 25, 4142–4151. [Google Scholar]
  36. Sturm, M.; Schimel, J.; Michaelson, G.; Welker, J.M.; Oberbauer, S.F.; Liston, G.E.; Fahnestock, J.; Romanovsky, V.E. Winter biological processes could help convert Arctic tundra to shrubland. Bioscience 2005, 55, 17–26. [Google Scholar]
  37. Dickey, D.A.; Fuller, W.A. Distribution of the estimators for autoregressive time series with a unit root. J. Am. Stat. Assoc. 1979, 74, 427–431. [Google Scholar]
  38. Vogelsang, T. Trend function hypothesis testing in the presence of serial correlation. Econometrica 1998, 66, 123–148. [Google Scholar]
  39. Fomby, T.B.; Vogelsang, T.J. The application of size-robust trend statistics to global-warming temperature series. J. Climate 2002, 15, 117–123. [Google Scholar]
  40. Bunn, A.G.; Goetz, S.J. Trends in satellite-observed circumpolar photosynthetic activity from 1982 to 2003: The influence of seasonality, cover type, and vegetation density. Earth Interact. 2006, 10, 1–19. [Google Scholar]
  41. Burrows, M.T.; Schoeman, D.S.; Buckley, L.B.; Moore, P.; Poloczanska, E.S.; Brander, K.M.; Brown, C.; Bruno, J.F.; Duarte, C.M.; Halpern, B.S.; et al. The pace of shifting climate in marine and terrestrial ecosystems. Science 2011, 334, 652–655. [Google Scholar]
  42. Xu, L.; Myneni, R.B.; Chapin, F.S., III; Callaghan, T.V.; Pinzon, J.E.; Tucker, C.J.; Zhu, Z.; Bi, J.; Ciais, P.; Tømmervik, H.; et al. Temperature and vegetation seasonality diminishment over northern lands. Nat. Clim. Change 2013. [Google Scholar] [CrossRef]
  43. Nemani, R.R.; Keeling, C.D.; Hashimoto, H.; Jolly, W.M.; Piper, S.C.; Tucker, C.J.; Myneni, R.B.; Running, S.W. Climate-driven increases in global terrestrial net primary production from 1982 to 1999. Science 2003, 300, 1560–1563. [Google Scholar]
  44. Pearson, R.G. Climate change and the migration capacity of species. Trends Ecol. Evol. 2006, 21, 111–113. [Google Scholar]
  45. Ackerly, D.D.; Loarie, S.R.; Cornwell, W.K.; Weiss, S.B.; Hamilton, H.; Branciforte, R.; Kraft, N.J.B. The geography of climate change: Implications for conservation biogeography. Divers. Distrib. 2010, 16, 476–487. [Google Scholar]
  46. Loarie, S.R.; Duffy, P.B.; Hamilton, H.; Asner, G.P.; Field, C.B.; Ackerly, D.D. The velocity of climate change. Nature 2009, 462, 1052–1055. [Google Scholar]
  47. Kelly, A.E.; Goulden, M.L. Rapid shifts in plant distribution with recent climate change. Proc. Natl. Acad. Sci. USA 2008, 105, 11823–11826. [Google Scholar]
  48. Lenoir, J.; Gégout, J.C.; Marquet, P.A.; de Ruffray, P.; Brisse, H. A significant upward shift in plant species optimum elevation during the 20th century. Science 2008, 320, 1768–1771. [Google Scholar]
  49. Blok, D.; Sass-Klaassen, U.; Schaepman-Strub, G.; Heijmans, M.M.P.D.; Sauren, P.; Berendse, F. What are the main climate drivers for shrub growth in Northeastern Siberian tundra? Biogeosciences 2011, 8, 1169–1179. [Google Scholar] [Green Version]
  50. Myers-Smith, I.H.; Forbes, B.C.; Wilmking, M.; Hallinger, M.; Lantz, T.; Blok, D.; Tape, K.D.; Macias-Fauria, M.; Sass-Klaassen, U.; Lévesque, E.; et al. Shrub expansion in tundra ecosystems: Dynamics, impacts and research priorities. Environ. Res. Lett. 2011. [Google Scholar] [CrossRef]
  51. Damschen, E.I.; Haddad, N.M.; Orrock, J.L.; Tewksbury, J.J.; Levey, D.J. Corridors increase plant species richness at large scales. Science 2006, 313, 1284–1286. [Google Scholar]
Figure 1. Vegetation map of the Arctic-Boreal region compiled from the Circumpolar Arctic Vegetation Map (CAVM) [32] and the latest version of the MODIS IGBP Land Cover Map [31]. (a) Arctic (8.16 million km2) defined as the vegetated area north of 65°N, excluding crops and forests, but including the tundra south of 65°N; (b) Boreal region (17.86 million km2) defined as the vegetated area between 45°N and 65°N, excluding crops, tundra, broadleaf forests, but including needleleaf forests north of 65°N. Grasslands south of the mixed forests are excluded as these are not conventionally considered as Boreal vegetation; (c) Combined vegetation map of the Arctic and Boreal regions. The 14 different classes are described in Table 1. This vegetation map is based on CAVM and infilling with merged MODIS IGBP Land Cover Map classes where CAVM ended. These Arctic and Boreal definitions are a compromise between ecological and climatological conventions. The vegetation labels are less critical as they include all natural (non-cultivated) vegetation types within these two regions and no vegetation-class dependent analysis was performed in this study.
Remotesensing 05 02093f1
Figure 2. Latitudinal variations/profiles of May-to-September mean temperature (TMS) and annual total precipitation (PAT) for the baseline period (early-1980s, 1982 to 1986) over the Arctic and Boreal regions. For each latitude band, the climatic variables of interest (May-to-September mean temperature and annual total precipitation) are averaged over the vegetated areas within North America (NA), Eurasia (EA), and circumpolar (CP) regions.
Remotesensing 05 02093f2
Figure 3. Photosynthetically Active Period (PAP) mean Normalized Difference Vegetation Index (NDVI) (NPAP) vs. May-to-Sep mean temperature. (TMS). (a) Relationship between NPAP and TMS averaged over given time-periods, the early-1980s, late-1990s, and late-2000s, in the Arctic-Boreal region of North America. Each point represents a one-degree latitudinal-band average for a specific region and time period. There are 18 such points covering latitudes from 52°N to 70°N for each color in the plot; (b) Same as (a) but in the Arctic-Boreal region of Eurasia; (c) Same as (a) but in the entire circumpolar Arctic-Boreal region; (d) Year-to-year variation of the slope in the NPAP-TMS relationship from 1982 to 2011 for the Arctic-Boreal region of North America (Blue) and Eurasia (Red), and the dashed lines represent 95% confidence intervals. The periods early-1980s, late-1990s and late-2000s refer to the years 1982 to 1986, 1995 to 1999, and 2006 to 2010, respectively. The Arctic-Boreal region is defined as in Figure 1.
Remotesensing 05 02093f3
Figure 4. Spatial patterns of PAP mean NDVI (NPAP) trends in the Arctic-Boreal region for the period 1982 to 2011. Shown are areas with statistically significant (p < 0.1) trends from the Vogelsang’s tPST method (cf. Section 2.2.2) (areas with statistically insignificant trends are shown in white color). Grey color denotes land areas not considered in this study. Black color indicates vegetated areas with low NDVI (a majority of NDVI values less than 0.1 during PAP). Numerical values quantifying PAP mean NDVI trends are given in Tables 2 and 3.
Remotesensing 05 02093f4
Figure 5. Spatial patterns of velocities in the Arctic-Boreal region for temperature (TMS) during (a) 1982 to 1999 and (b) 1982 to 2011; and for precipitation (PAT) during (c) 1982 to 1999 and (d) 1982 to 2009. Positive values in velocity indicate northward movements, while negative values in velocity indicate southward movements. Grey areas correspond to lands not considered in this study. Light green color shows vegetated areas with extremely high values of velocity (<−500 km / decade or >500 km / decade). Numerical values quantifying the velocity spatial patterns are given in Tables 6 and 7.
Remotesensing 05 02093f5
Table 1. Vegetation classes in the Arctic and Boreal regions of this study (Figure 1). Vegetation Classes 9 to 12 are as per the Circumpolar Arctic Vegetation Map [32]. The rest of the vegetation classes are based on the MODIS International Geosphere-Biosphere Programme (IGBP) land covers (definitions in [31]).
Vegetation ClassDescription
Class 1Oceans and inland lakes
Class 2Mixed Forests
Class 3Deciduous Needleleaf Forests
Class 4Evergreen Needleleaf Forests
Class 5Forest-Shrubs Ecotone
Class 6Closed Shrublands
Class 7Open Shrublands
Class 8Grasslands/Wetlands (North of Forests)
Class 9Erect Shrub Tundra
Class 10Prostrate Shrub Tundra
Class 11Graminoid Tundra
Class 12Wetlands
Class 13Other Vegetation (e.g., crops) Not Considered in this Study
Class 14Barren
Table 2. Changes in PAP mean NDVI (NPAP) over the Arctic-Boreal vegetation for the period from 1982 to 2011. Greening (Browning) indicates areas showing statistically significant (p < 0.1) increase (decrease) in NPAP trends from the Vogelsang’s tPST method (cf. Section 2.2.2). The greening, browning and no-change fractions are from Arctic-Boreal areas in North America (NA), Eurasia (EA) and circumpolar (CP) regions. The spatial patterns of these results are shown in Figure 4. The Arctic and Boreal regions are defined as in Figure 1.
Region (Areas in 106 km2)Greening (%)Browning (%)No-Change (%)Invalid Area (106 km2)
NAArctic (3.39)38.092.6959.221.80
Boreal (6.88)16.738.0675.210.93
Total (10.27)21.236.9271.852.73

EAArctic (4.77)36.402.9260.681.93
Boreal (11.20)48.200.4051.401.48
Total (15.99)45.520.9853.503.42

CPArctic (8.16)37.012.8460.153.73
Boreal (18.11)36.263.3160.432.42
Total (26.27)36.423.2060.386.15
Table 3. Comparison of changes in PAP mean NDVI (NPAP) between Boreal forests with woody fraction greater than 30% and other natural vegetation. Abbreviation “G” in the table refers to areas showing statistically significant (p < 0.1) increase in NPAP(Greening), while “B” refers to areas showing statistically significant (p < 0.1) decrease in NPAP (Browning). Abbreviation “N” refers to areas showing no statistically significant changes in NPAP (No-change). Statistical significance was assessed using the Vogelsang’s tPST method (cf. Section 2.2.2). Boreal forests include Evergreen and Deciduous needleleaf forests and Mixed forests. Other natural vegetation include Broadleaf forests, Closed and Open shrublands, Woody grasslands and Grasslands. The greening, browning and no-change fractions are with respect to areas in North America (NA), Eurasia (EA) and circumpolar (CP) regions. Boreal forest entries in parenthesis are proportions with respect to the total area of Boreal forests in NA, EA and CP, respectively.
Region (Areas in 106 km2)North AmericaEurasiaCircumpolar

Forests Woody Fraction > 30%Other Natural VegetationForests Woody Fraction > 30%Other Natural VegetationForests Woody Fraction > 30%Other Natural Vegetation

G(%)B(%)N(%)G(%)B(%)N(%)G(%)B(%)N(%)G(%)B(%)N(%)G(%)B(%)N(%)G(%)B(%)N(%)
ArcticN/AN/AN/A38.092.6959.22N/AN/AN/A36.402.9260.68N/AN/AN/A37.012.8460.15
NA = 3.39
EA = 4.77
CP = 8.16

Boreal1.08 (13.93)0.64 (8.22)6.04 (77.85)15.657.4269.184.39 (77.44)0.00 (0.03)1.28 (22.53)43.800.4150.123.13 (48.52)0.24 (3.76)3.08 (47.72)33.123.0757.35
NA = 6.88
EA = 11.2
CP = 18.11

Total1.84 (21.68)0.55 (6.44)6.09 (71.87)19.406.3865.753.50 (74.12)0.00 (0.03)1.22 (25.85)42.030.9752.282.87 (46.93)0.21 (3.36)3.05 (49.72)33.553.0057.33
NA = 10.27
EA = 15.99
CP = 26.27
Table 4. Changes in May-to-September mean temperature (TMS) and annual total precipitation (PAT) over the Arctic-Boreal region for the period from 1982 to 2011 (2009 for precipitation). Increase and decrease in the trend estimations of TMS and PAT are calculated from the Vogelsang’s trend estimation method. The fractions are with respect to Arctic, Boreal, or total Arctic-Boreal areas in North America (NA), Eurasia (EA) and circumpolar (CP) regions that have valid PAP mean NDVI time series. Statistical significance was not assessed in this table.
RegionTemperaturePrecipitation

Increase (%)Decrease (%)Increase (%)Decrease (%)
NAArctic84.4415.5671.1528.85
Boreal85.7914.2163.6536.35
Total85.5014.5065.2834.72

EAArctic98.141.8673.9726.03
Boreal97.942.0664.4735.53
Total97.982.0166.7633.24

CPArctic93.236.7772.9627.04
Boreal93.336.6764.1535.85
Total93.316.6966.1933.81
Table 5. Statistics of baseline slopes for temperature and precipitation (Figure 2). Slope is defined as the change of temperature (K) or precipitation (mm) per degree latitude toward north, averaged over the one-degree latitudinal band for the Arctic and Boreal regions. The 95% confidence intervals for the slopes are given for the linear regression models, and R2 is also provided in the table. The baseline period is defined as the early-1980s from 1982 to 1986. Temp. is the May-to-September mean temperature averaged over the baseline period, and precip. is the annual total precipitation averaged over the baseline period.
Stats.North AmericaEurasiaCircumpolar

Temp. (K)Precip. (mm)Temp. (K)Precip. (mm)Temp. (K)Precip. (mm)
Slope−0.53−35.0−0.47−14.5−0.48−23.1
Confidence Interval−0.59−38.7−0.55−16.6−0.55−24.1
−0.47−31.3−0.39−12.3−0.42−22.0
R20.940.940.870.900.900.99
Table 6. Spatial fractions of temperature velocities in the Arctic-Boreal region along the North-South direction. Numbers in the table indicates the fractions of area in percent that are within a certain range of velocity values (<−200 km/decade, <−100 km/decade, <0 km/decade, >0 km/decade, >100 km/decade or >200 km/decade) with respect to the Arctic, Boreal and total areas in North America (NA), Eurasia (EA) and the entire circumpolar (CP) regions for two time periods. Positive values in velocity indicate northward movements, while negative values in velocity indicate southward movements.
Region (Areas in 106 km2)Temperature Velocity (km/Decade)
1982–19991982–2011

<200<100<0>0>100>200<200<-100<0>0>100>200
NAArctic (1.49)2.606.1917.8482.1639.0312.332.095.4423.9976.0116.607.63
Boreal (5.40)4.259.8430.2469.7625.728.732.637.1233.8966.119.613.75
Total (6.89)3.909.0627.5972.4128.579.502.526.7831.8968.1111.024.53

EAArctic (2.51)3.7910.3043.2956.719.483.073.477.6318.4581.5516.995.29
Boreal (8.12)3.789.1241.7258.2812.234.943.968.6929.1870.8117.496.00
Total (10.63)3.789.4042.0957.9111.574.493.858.4526.7873.2117.385.84

CPArctic (3.99)3.388.9034.6165.3919.566.232.996.8620.4079.6016.866.11
Boreal (13.52)3.969.3937.4062.6017.306.363.458.0930.9869.0214.485.14
Total (17.52)3.839.2836.7663.2417.826.333.357.8328.7071.3014.995.35
Table 7. Same as Table 6 but for precipitation velocities.
Region (Areas in 106 km2)Precipitation Velocity (km/Decade)
1982–19991982–2009

<200<-100<0>0>100>200<200<100<0>0>100>200
NAArctic (1.49)2.958.4769.7030.303.301.790.932.2935.0864.924.141.20
Boreal (5.40)3.178.8153.6846.327.422.512.335.9538.7161.2910.042.88
Total (6.89)3.138.7457.1142.896.542.352.035.1637.9362.078.762.52

EAArctic (2.51)3.706.2826.9173.0930.2813.703.225.8232.0367.9716.607.08
Boreal (8.12)6.6415.7340.5759.4322.6410.754.599.6838.6361.3719.017.57
Total (10.63)5.9413.4737.3062.7024.4711.464.278.7737.0762.9318.447.46

CPArctic (3.99)3.427.1042.9157.0920.199.252.364.5133.1766.8311.964.89
Boreal (13.52)5.2212.9145.9354.0716.427.383.698.1938.6661.3415.425.70
Total (17.52)4.8111.5745.2454.7617.297.813.397.3537.4162.5914.635.52

