1. Introduction
A National Base Map (NBM) generally covers most areas of a given nation and is closely linked to data on the main objects of a nation, including land development and the national quality of life. Being an important resource for the development and management of a nation, it requires a high degree of accuracy and continuous updates.
National Base Maps are regularly constructed and updated using aerial photogrammetry in many countries. Therefore, the work principles, standards and allowable accuracy levels for National Base Maps depend on aerial photogrammetry regulations, and the updates of large areas takes place every few years, depending on the economic feasibility of aerial photogrammetry.
The current National Base Map production system requires modification of the map updates process due to the following external factors: (1) More frequent map updates are required due to the surge in the demand for geographic information from the private sector, based on the activities of location-based services (LBS). The proliferation of smartphones and wide-area wireless Internet access makes it possible to use many kinds of LBS. (2) Higher-quality geographic information that represents detailed features of roads is required because the public uses roads daily due to the popularity of automated navigation systems, but such information is difficult to construct using aerial photogrammetry. These reasons led to the development of a new method of performing the frequent unscheduled updates of National Base Maps, to more quickly update the features of the map.
In this study, the Land-based Mobile Mapping System (LMMS) was selected as a new tool for map updates because it has many advantages that enable fast and precise map updates. The objectives of this research are to find a method of updating National Base Maps via LMMS, to shorten the map updating period, and to build more detailed geographic information on objects on and near roads.
The University of Ohio introduced LMMS technology in 1991 with its development of the first LMMS, GPSVan™ [
1]. The concept, composition and data processing flow of LMMS has been described in many studies [
2–
4]. LMMS research has been ongoing for over 20 years, and has reached the industrialization phase. The accuracy level of LMMS surveys is very high in open areas; and VISAT™, which the University of Calgary in Canada developed, has an accuracy level with an absolute error of 30 cm and a relative error of 10 cm within a corridor of 30 m [
5]. Kaartinen
et al. [
6] tested the performance of various LMMS equipped with mobile laser scanner on established urban test field. With all LMMS properly calibrated, the elevation accuracy was better than 3.5 cm up to a range of 35 m. The best system achieved a planimetric accuracy of 2.5 cm over a range of 45 m. This high accuracy level of LMMS has led to its application in many surveying and mapping areas.
In the early 2000s, despite the high accuracy level of LMMS, further development was deemed necessary to meet diverse surveying and mapping needs [
7]. Today, much research is being conducted on the application of LMMS to the construction of geographical information databases, with the introduction of a mobile laser scanner and the development of many different software applications for LMMS. For example, Ishikawa
et al. [
8] conducted research to automatically produce road data by linking data from the mobile laser scanner and the digital camera of the LMMS. Haala
et al. [
9] studied a method of producing 3D point data in a downtown area using the land-based MMS of a mobile laser scanner as a sensor attached to a vehicle. Jaakkola
et al. [
10] proposed automatic methods of road surface modeling using laser-based mobile mapping. Petrie [
2,
11] organized various LMMS equipment and relevant services, as well as equipment suppliers, to build a 3D geographical information database. Rau
et al. [
12] showed a single-step system calibration method for direct sensor orientation of an LMMS. Madeira
et al. [
13] suggested a sensor integration method for a low-cost LMMS to maintain quality georeferencing information. In some studies, many kinds of platforms for mobile mapping system (MMS) were introduced [
3,
14,
15]. These researchers showed that a technological foundation for the industrial use of LMMS technology for surveying and mapping has been established.
Recent studies related to LMMS have addressed its availability and advantages for producing geographic information, but few studies have used LMMS to update National Base Maps. A detailed study was required to assess if LMMS could meet the relevant regulations and standards of National Base Map production, which were based on the standards of aerial photogrammetry. Also, further research to overcome the degradation of the accuracy of Global Positioning System/Inertial Navigation System (GPS/INS) measurement in downtown areas was required. Furthermore, there were requirements to identify the types of map layers that can be updated via LMMS, analyze the performance criteria for the equipment that comprise LMMS, and set the standards for the application of LMMS data. In this research, a comprehensive study was conducted on these topics that concern the frequent unscheduled updates of National Base Maps using LMMS. Two LMMS equipment were used to demonstrate the frequent unscheduled updates of National Base Maps for four study areas in Korea.
3. Improvement of the Accuracy of Land-Based Mobile Mapping System (LMMS) Surveying
3.1. Problems
The positioning system of LMMS is a GPS/INS system composed of GPS, INS, Distance Measurement Instrument (DMI), etc. The system plays the role of a geo-referencing mapping sensor etc., so the accuracy of LMMS surveying is governed by the GPS/INS system in use. GPS/INS systems can precisely determine the position and altitude of LMMS mapping sensors, which makes accurate object surveying with LMMS possible. However, the following two problems must be overcome.
First, the accuracy of GPS/INS is degraded in environments with poor GPS reception. There are many indicative factors of GPS data quality [
16], and one of the most important of these is the number of received GPS signals. This number frequently drops to below four in downtown areas, thus degrading the accuracy of the GPS positioning result, which plays an important role in GPS/INS integration. In the research of Kennedy
et al. [
17], during the use of a GPS/INS equipped with DMI, the HG1700 produced by Honeywell and the OEM4-G2 GPS board produced by Novatel, an elevation error of at least 0.5 m and a plane error of at least 1.5 m occurred when the GPS signal reception was disconnected for more than 60 seconds. Also, in the research of Haala
et al. [
9], 20% of the measurement results on a narrow road in a downtown area where the GPS signal reception environment was very poor had an error of 1 m or more. The accuracy of the GPS/INS integration result is low in an area with poor GPS reception, which leads to the degradation of LMMS surveying and its failure to meet the level of accuracy required for the National Base Map.
Second, the redundant data collection to achieve enough resolution for mapping can lead to data deviations. The deviations could occur in the LMMS data that were obtained in duplicate, even though the data were captured in an environment with good GPS signal reception, due to the limitation of the accuracy of the GPS/INS integration result. The deviations were generally less than 0.5 m, but they caused such difficulty in the map production and so degraded the relative accuracy of the mapping results that a method of eliminating them became necessary.
3.2. Methods
An adopted method of improving the accuracy of LMMS data was the correction of the GPS/INS integration result using minimal control and tie points, followed by the reprocessing of the LMMS data based on the corrected GPS/INS integration data. The premise of the method was that GPS/INS errors are systematic and could be modeled with minimal control and tie points. Thus, an experiment was conducted to first verify the tendency of GPS/INS errors, and then to develop the correction method.
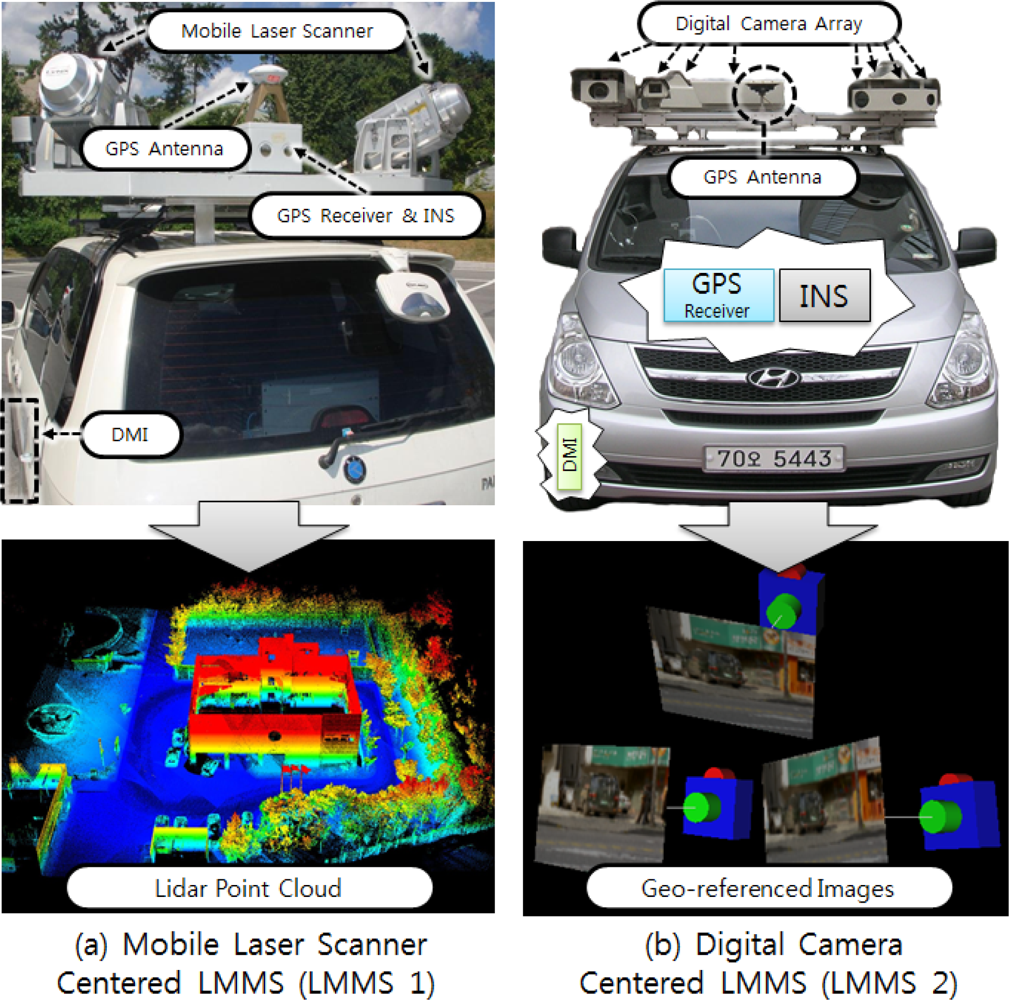
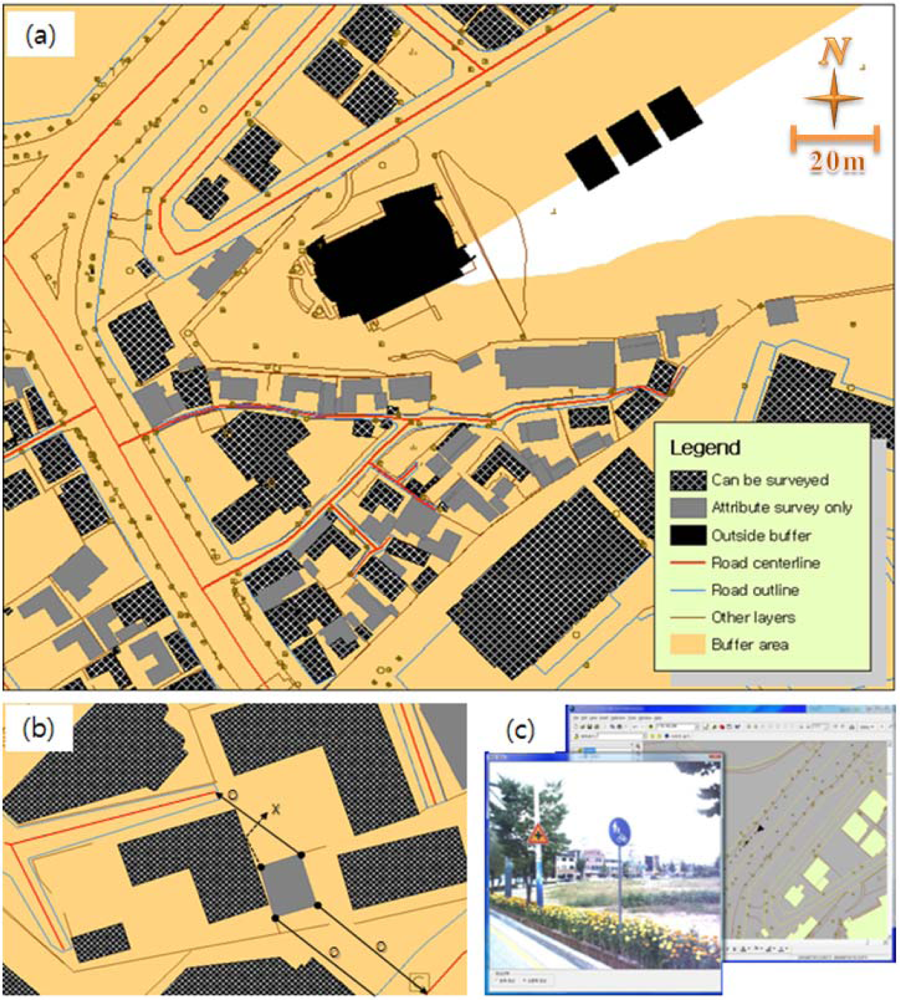
The tendency of the GPS/INS integration results to have absolute errors was analyzed using the GPS/INS data that were gathered with LMMS 2, as shown in
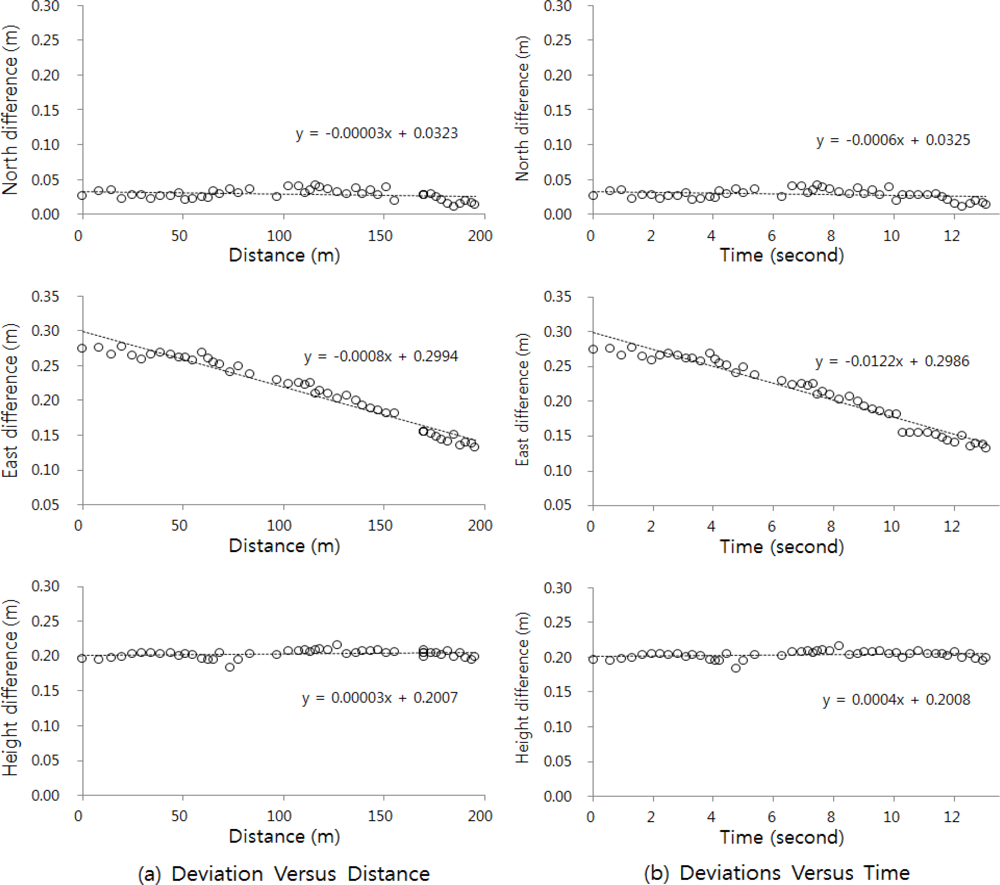
Figure 1(b), in the area where it was possible to receive sufficient GPS signals. The data were processed in two ways to generate reference data and simulated data. The reference data were processed using all the gathered data via tightly coupled integration. For the simulated data, all the GPS data from a specific section were deleted to simulate a complete GPS outage environment, after which the integration was processed. The GPS/INS integration errors in the GPS outage environment were analyzed by comparing the reference data with the simulated data from the section, as shown in
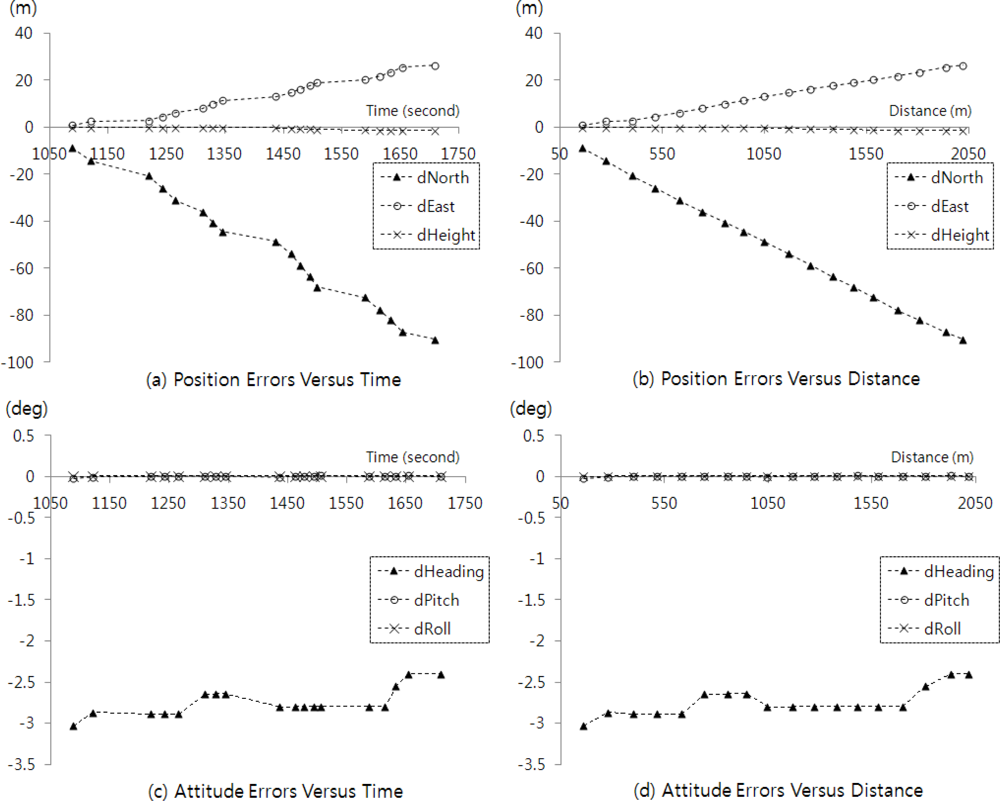
Figure 3.
According to the results shown in
Figure 3(b), the position errors tended to have a positive linear correlation with the driving distance after the GPS outage. The position errors were originally predicted to be positively correlated with the time after the GPS outage, because the irregularities occurred in relation to the time, as shown in
Figure 3(a). These results indicate that to reduce GPS/INS errors, the minimum control points can be evenly applied in terms of the distance.
Figure 3(c,d) shows the correlation of the attitude errors with the driving time and distance after the GPS outage, and that the attitude errors did not significantly increase with the roll and pitch values, though relatively consistently larger heading errors occurred. The average heading error was −2.75 degrees and had a deviation of approximately 0.30 degrees. If a consistent correction of −2.75 degrees were applied to the heading result, the residual 0.30 degrees might have occurred and caused an approximately 0.2 m in-plane error over a distance of 40 m, which is within the permissible error range in the map production regulations of South Korea. Thus, the experiment results showed that the attitude errors can be modified by applying the minimum number of control points.
Second, the tendency for deviations to occur in doubly collected LMMS data was analyzed. Because the LMMS data were geo-referenced with GPS/INS data, the deviations indicate relative errors in the GPS/INS integration results. LMMS data was collected with LMMS 1, as shown in
Figure 1(a). Fifty samples were collected from the LiDAR point cloud that gathered on a 200 m road via round-tripped LMMS. The samples had deviations from the 3D coordinates of the LiDAR points, and the tendency of the deviations to occur was analyzed in the time and distance domain. The analysis results are shown in
Figure 4. They indicate that all the deviations in the elevation and planar coordinates had linearly propositional relationships with the distance and the time. These results mean that the tendency of relative errors to occur in GPS/INS integration results can be modeled using a minimum number of control points. Also, duplicate LMMS data can be adjusted by applying the corrected GPS/INS results.
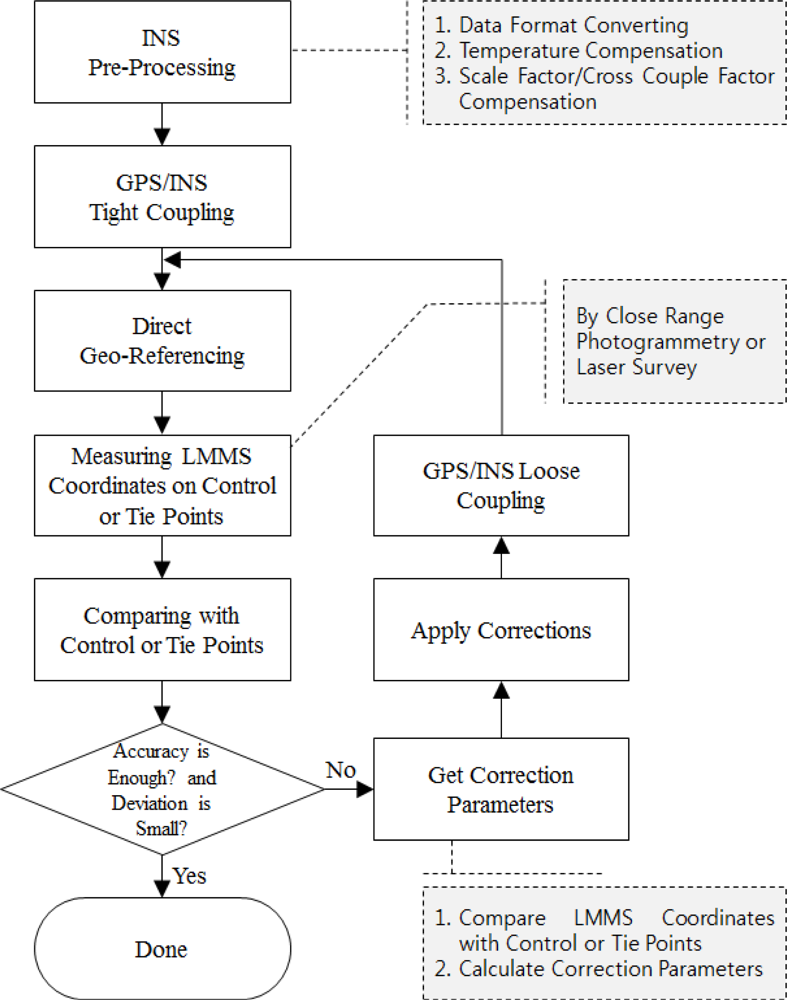
The method of improving LMMS data was proposed based on the experiment result on the tendency of GPS/INS errors to occur. It was assumed that most errors could be modeled and removed using a minimal number of control points if they have a certain tendency. The proposed method is described in
Figure 5, and its verification is discussed in Section 3.3.
In the method, general LMMS processing was first conducted according to the following order: INS pre-processing, GPS/INS tight coupling and direct geo-referencing of LMMS data. Then the LMMS coordinates on the control or tie points were measured via close-range photogrammetry or laser surveying using the geo-referenced LMMS data. Next, the correction parameters were calculated using the differences between the measured LMMS coordinates and the reference coordinates (the gathered coordinates of the control or tie points). Of the many types of correction parameters, four were used in this study: the heading correction value and 3D initial coordinates. The parameters were applied to GPS/INS observables in the correction application stage. The INS observables were reprocessed by applying the heading corrections, and accurate 3D initial coordinates were inserted in the time series of the GPS coordinates. Then GPS/INS loose coupling was conducted using the updated GPS/INS observables. Finally, the LMMS data were geo-referenced again based on the GPS/INS loose coupling results.
3.3. Verification of the Method
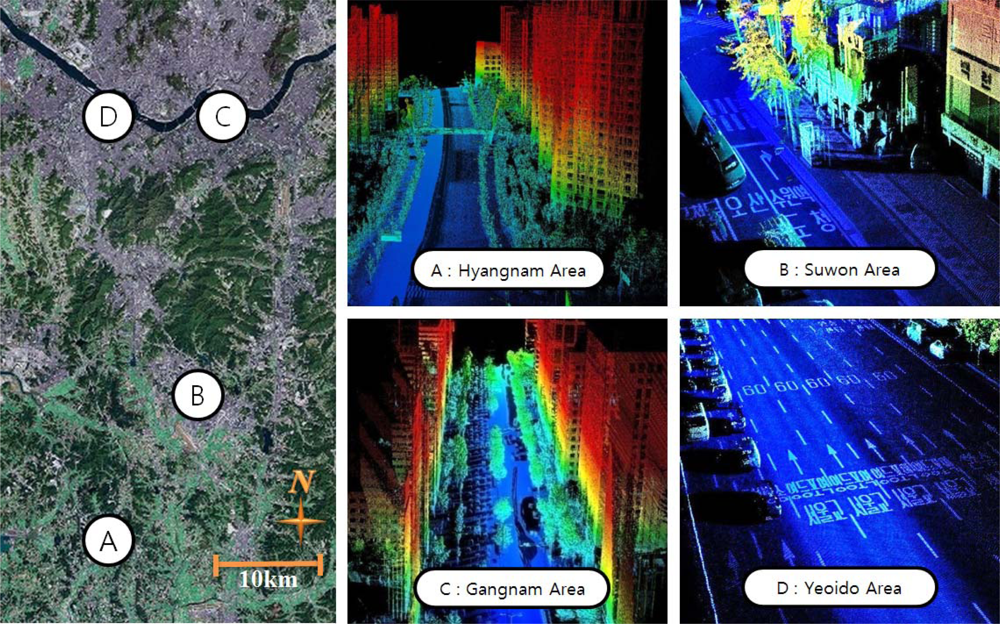
The absolute accuracy of LMMS data was improved using control points. The LMMS data were gathered in the four study areas, three of which have environments with poor GPS signal reception because of the density of high buildings. Many control and check points were accurately surveyed with portable ground surveying equipment and were used to improve LMMS data and evaluate the improvements. The distance between the control points was varied to find the minimal number of points needed to improve all the gathered LMMS data. The minimal number of control points was very important in this study because the method would have become redundant had the minimal number of control points been too large.
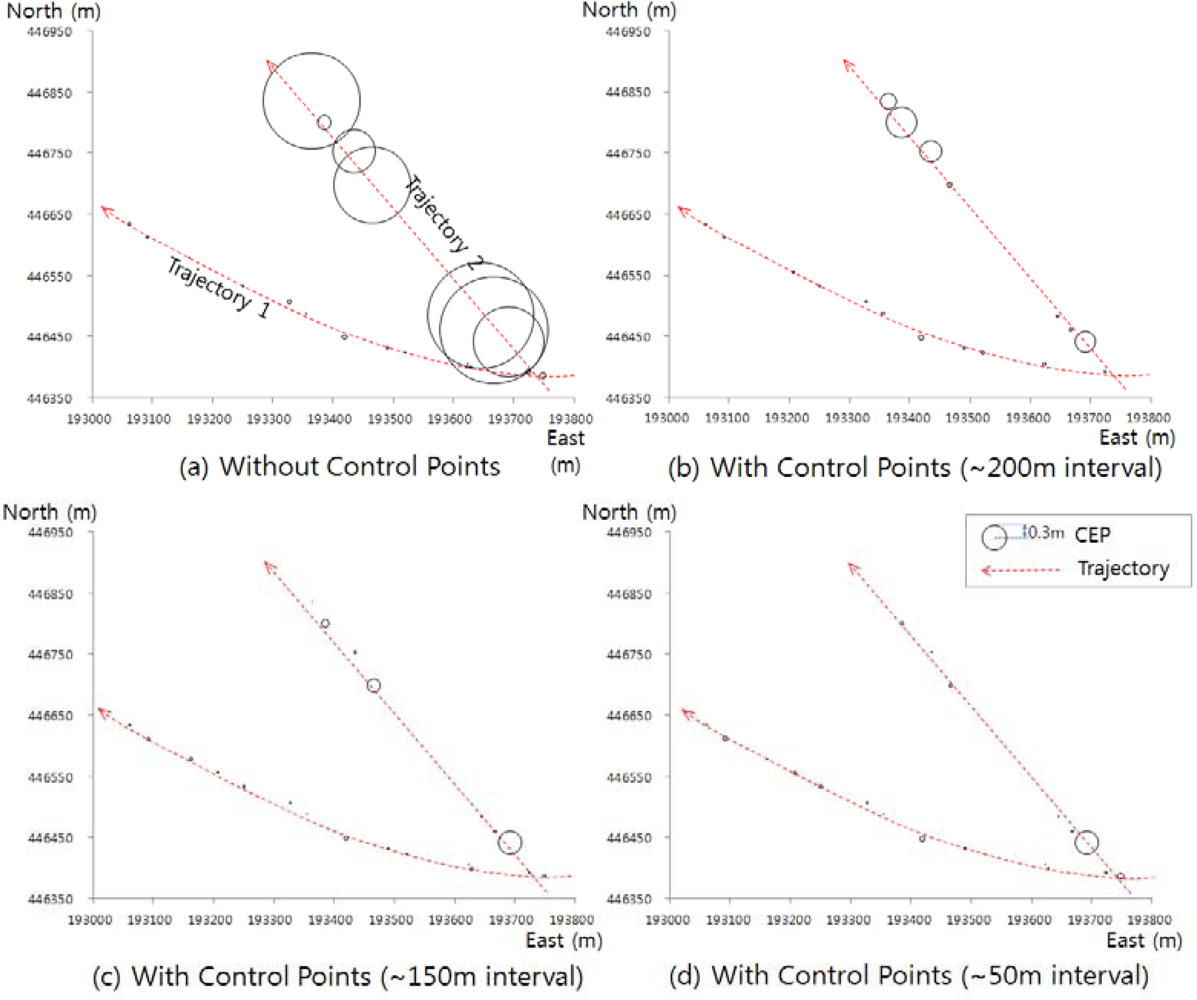
Figure 6 shows the results of the experiments conducted in Yeoido. The diagrams of the plane errors changed in accordance with the interval between the control points. The error refers to the Circular Error Probability and was calculated from the LMMS survey that was conducted on two roads, one of which had a good GPS signal reception environment, and the other, a bad GPS signal reception environment.
In
Figure 6, the driving path of the LMMS on the road with a good GPS signal reception environment is marked as Trajectory 1, and the other path, as Trajectory 2. Significant errors occurred in the areas around the roads on Trajectory 2, as shown in
Figure 6(a). In contrast,
Figure 6(b–d) shows a significant decrease in the positioning errors with the adjustments made on the GPS/INS integration using the control points. In the adjustment of the GPS/INS integration results, several intervals between the control points were applied, from about 50 m to about 200 m, to determine the maximum length of the intervals. This was required to calculate the minimum number of control points needed to ensure the accuracy of the LMMS survey. As shown in
Figure 6(b–d), the control points were surveyed at the intervals to make the map production more accurate.
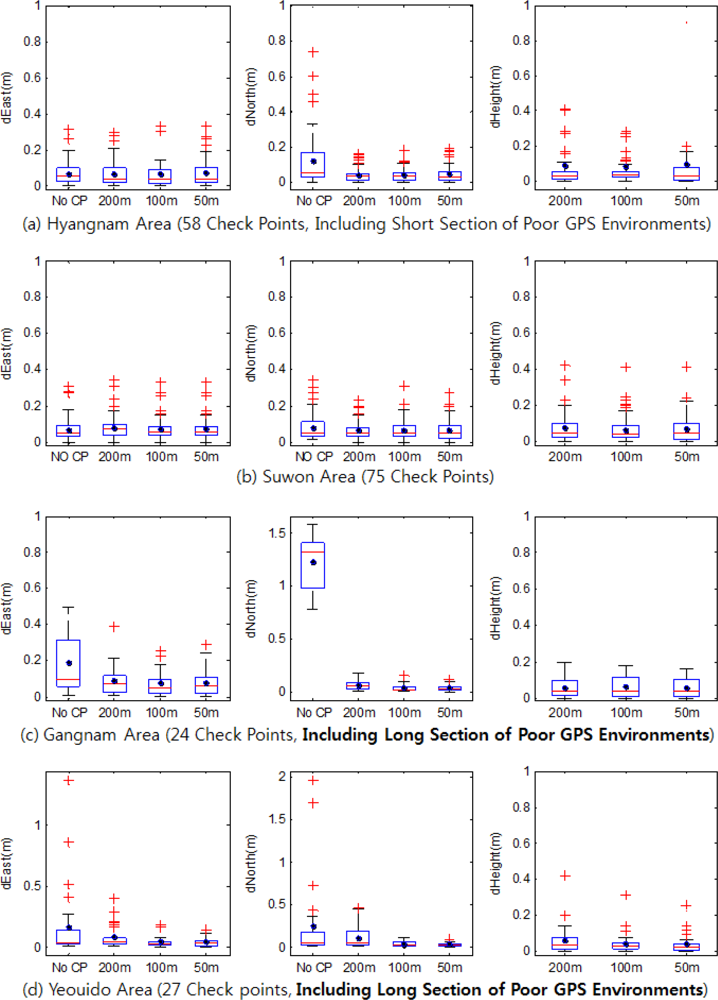
Figure 7 shows the results of all the experiments that showed variations in the LMMS surveying error in the cases wherein non-control points were used and in the cases wherein control points were used at 50–200 m intervals. The figure shows that the number of errors was significantly reduced by applying the minimum number of control points at about 200 m intervals, and that the smaller the interval was, the more accurate the surveying results were in general. The actual accuracy of the method, however, was not strictly dependent on the frequency of control points. These effects were evident in Kangnam and Yeouido, which have long sections with poor GPS environments.
Figures 6 and
7 show the effect of the method on the improvement of the accuracy of LMMS data. However, the method is costly for the survey of control points. The feasibility of the method can be determined based on the adequacy of its cost. For this, the cost of updating the map with LMMS data was calculated, improved by the proposed method, and compared with the map updating cost using the as-built drawings of constructions. The difference was insignificant, and the proposed method was shown to be feasible for the updating of the National Base Map.
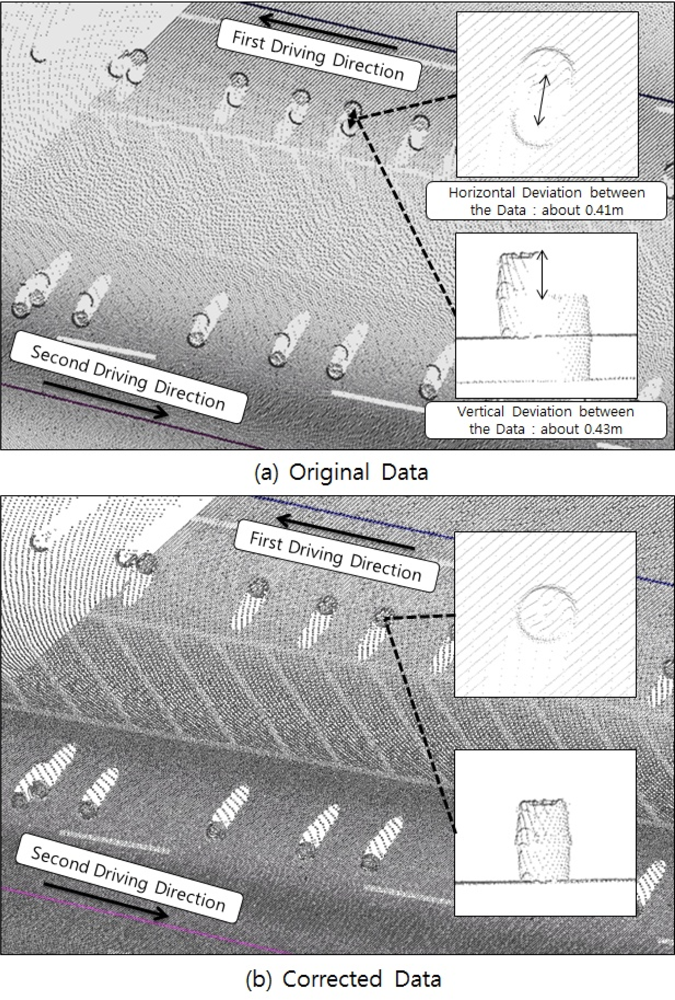
Then, the deviation between the duplicate LMMS data was removed using the method shown in
Figure 5 and minimal tie points.
Figure 8 shows the effect of the method. The LiDAR point cloud data on the 200 m road was corrected using the modeled tendency of the GPS/INS results to have relative errors. In this process, only six tie points were used to model the relative error tendency.
Figure 8(a) shows that deviations of about 0.4 m occurred in the duplicate data in each planar and elevation direction, but most of them were removed by applying the minimum number of tie points. The result is shown in
Figure 8(b).
4. Map Updating Method Using Land-Based Mobile Mapping System (LMMS) Data
This study on a method of updating the National Base Map using LMMS data was needed to meet relevant regulations and standards of National Base Map production, which were based on the standards of aerial photogrammetry. To carry out the practical research, frequent unscheduled National Base Map updates were made in the study areas, and the results were used in the study on (1) mapping methods by type of object; (2) analysis of the updatable area of the map via LMMS surveying; and (3) analysis of the types of map layers that can be updated via LMMS.
4.1. Mapping Methods by Type of Object
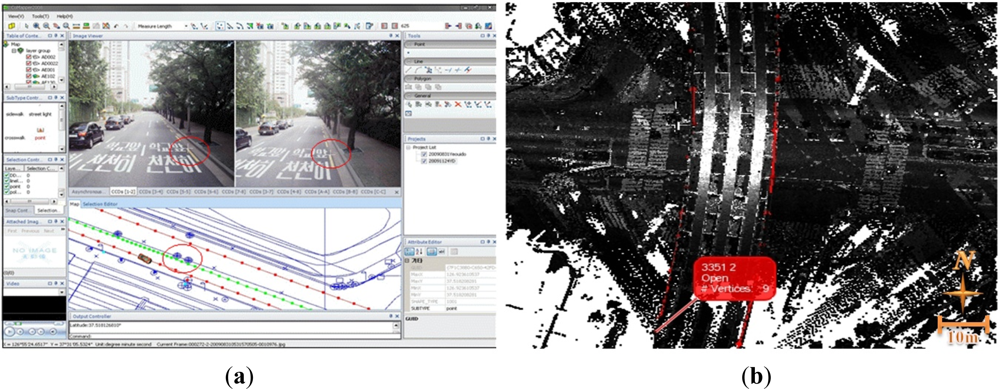
The surveying methods that were used for the mapping objects are shown in
Figure 9. One of them is close-range photogrammetry using stereo images (
Figure 9(a)), and another is 3D screen digitization using a LiDAR point cloud (
Figure 9(b)). The latter was more suitable for mapping objects, considering work efficiency and accuracy, because the former was unsuitable for objects with softly curved shapes that made it hard to identify conjugate points in their stereo images.
In the case of mapping utilities displayed as symbols and placed at a point on the map, the close-range photogrammetric surveying method was adequate, considering work efficiency. In the case of mapping objects that were featured as polylines on the map, the 3D screen digitization method was adequate. For mapping landforms, there was a requirement to generate a digital elevation model (DEM) using a filtered LiDAR point cloud. Contour lines and spot heights were extracted from the generated DEM.
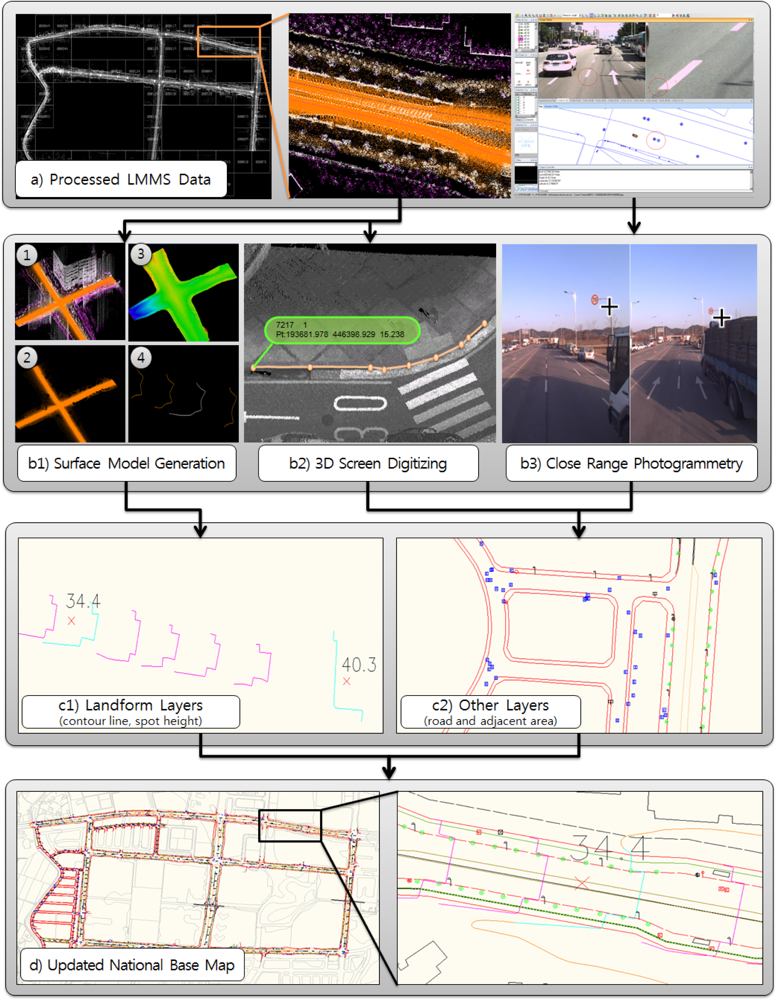
Figure 10(b,c) shows the adequate mapping methods by feature type using the processed LMMS data (shown in
Figure 10(a)).
In
Figure 10(b1,c1), the process of generating the contour line spot height is shown. In the process, first, the LiDAR point clouds were classified as the points on the ground surface and the other points similar to ①; second, only points on the ground surface were selected, as in ②; and then the Triangulated Irregular Network (TIN) data was produced, as in ③. Finally, as in the last stage of ④, the contour lines and the spot height were extracted from the TIN data, and the contour lines were equalized to meet the standards for the National Base Map, as shown in
Figure 10(c1).
The results of the demonstrated frequent unscheduled updates of the National Base Map are shown in
Figure 10(d). The gray features were mapped in previous new productions, and the other colored features were mapped in the updates in this study via LMMS. The figure shows that most of the objects on or near the roads were captured using LMMS data.
In this study, automated feature extraction methods were not applied because they were less than 100% complete. The practical application of LMMS to map updates to meet relevant regulations and standards of the National Base Map production was focused on. Thus, manual feature extraction methods were mainly used. The adoption of automated methods, such as the following, for more efficient and cost-effective map updates must be studied, though.
Many researches have been conducted to develop automated feature extraction methods using digital images and LiDAR point clouds. For example, Vosselman and Liang [
18] introduced an automated method of detecting road edges from high-resolution aerial LiDAR data. The key concepts of the method were the detection of the occurrence of small height jumps on road sides, neighbouring adjacent LiDAR points and filtering based on the heights. The analysis result of the study showed that the completeness varied between 50% and 86% and that the accuracy was about 0.18 m. Zhu
et al. [
19] developed the Road Extraction Assisted by Laser (REAL) method of automatically extracting city roads through a shadow path using both digital aerial images and aerial LiDAR data. Yang
et al. [
20,
21] proposed a method of automatically extracting road markings and street-scene objects from mobile LiDAR data. The method used 2D feature images that were generated by interpolating mobile LiDAR data for the detection of the boundary lines of the target objects. The LiDAR data included in the boundary was analyzed to detect the target objects.
4.2. Analysis of the Updatable Area of the Map via Land-based Mobile Mapping System (LMMS) Surveying
There are natural limitations in the LMMS surveying range, unlike in the aerial photogrammetry range, due to the surveying sensor platform that is being operated on the ground. Therefore, to evaluate the applicability of LMMS to the frequent updates of the National Base Map, the LMMS-updatable area of the map should be analyzed. For this, the maximum surveying range relative to the position of the LMMS should be determined.
In this study, the LMMS-updatable area of the map was studied using the results of the analysis of the maximum range of the main LMMS surveying methods,
i.e., of laser surveying and close-range photogrammetric surveying.
Figure 11 shows the analysis results for the maximum range of the laser surveying and the change in the possibility of precision mapping based on the average spacing of the LiDAR point cloud that was built with a laser scanner.
The maximum surveying range of the laser scanner (Lynx Mobile Mapper V200) that was used in this study was 200 m in the specifications. Considering the adequate point density for precise mapping, however, the maximum surveying range was reduced to about 40 m. If the surveying range was more than 40 m, the average spacing between the LiDAR points would have exceeded 0.1 m, which increased the difficulty of precision mapping, as shown in the right picture in
Figure 11, because of the low point density. Also, had there been obstacles such as parked cars and fences, the surveying range would have been further reduced, as shown in the left picture in
Figure 11. The value “40 m” was not absolute but experimental, and so could be changed depending on the types of lasers that were used, the values of the operating parameters and the standards required for map production.
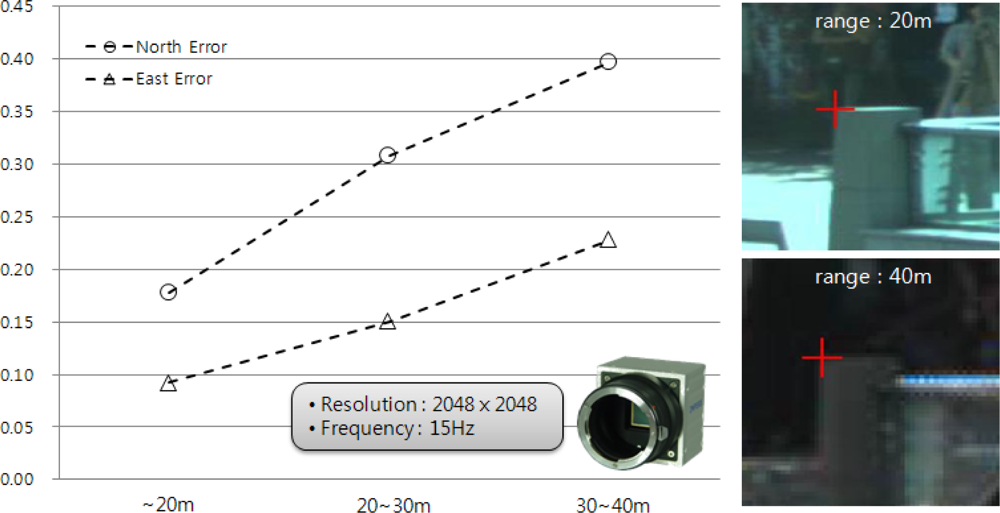
The change in the accuracy of photogrammetric surveying based on the distance between the digital camera and the objects is shown in the graph in
Figure 12. The graph indicates that the size of the errors increased as the distance increased. It was also found that the error was below 0.5 m within a distance of 40 m. Had the distance been beyond 40 m, gross errors would often have occurred, and it would have been more difficult to precisely measure the image coordinates of the conjugate points because of the low resolution, as shown in the right picture in
Figure 12.
Regarding the study results, the maximum LMMS surveying range can be determined depending on the accuracy of the surveying method and the required resolution of the LMMS data. In the LMMS that was used in this study, the maximum surveying range was about 40 m, which depended on the performance of the sensors and the requirements in the regulations for the National Base Map. This result means that maps of most areas near roads or railways can be updated using LMMS, but complementary field surveying is needed for areas where there are obstacles between the LMMS device and the target objects, as shown in the left picture in
Figure 11.
4.3. Analysis for the Types of Map Layers that can be Updated via Land-Based Mobile Mapping System (LMMS)
The types of layers that can be updated via LMMS were analyzed based on the maximum surveying range and other characteristics of LMMS. This analysis was important because the results defined the applicability of LMMS to National Base Map updates, and can be used to formulate LMMS surveying specifications using a different technology or that comply with different regulations.
As shown in
Figure 13, buffer analysis and line-of-sight analysis were used in this study, and a ready-made digital map was used as the analysis target. The analysis was conducted to check the quantity of objects that can be surveyed via LMMS with respect to their shape, position and properties, from the whole object that is included in each layer. If over 80% of the objects in a layer could be surveyed via LMMS, the layer was classified as updatable via LMMS. The possibility of surveying an object via LMMS was assessed by checking the line-of-sight visibility between the object and the road centerline. If each node point of the object was visible from the road centerlines located within a 40 m radius from it, the object was classified as applicable to LMMS.
Table 4 shows the major layers of the 1/5,000-scale digital map (Korean National Base Map) data and the 1/1,000-scale digital map that can be updated via LMMS. The National Base Map has 17 types of layers; and the highly applicable 1:1,000-scale digital map has 35 types of layers that are updatable via LMMS, and its main features represent objects on or near roads. Though there are few types of layers, the areas that require frequent updates usually include new road construction areas and housing development areas, which are close to roads and are easily accessible to vehicles. Thus, it was found that LMMS can be used for frequent updates of the National Base Map and main digital maps.
5. Conclusions
This study was conducted to apply the Land-based Mobile Mapping System (LMMS) to the updates of the National Base Map, which has been made via aerial photogrammetry and managed with high precision and quality. For this, a method was proposed to improve the weak points of LMMS, such as the low accuracy within the bad Global Positioning System (GPS) signal reception area and mutual deviations between LMMS data obtained in duplicate. Next, an effective feature mapping method using LMMS data was proposed, and the updatable area and map layer types were analyzed to prove that LMMS enables the updates of the National Base Map.
Using the proposed LMMS data correction method, an absolute position error of maximum 1.5 m, which would have appeared in the LMMS data obtained from bad GPS signal reception area, was reduced to an average of 10 cm or less with minimum control points placed at approximately 200 m intervals. In addition, an average deviation of 0.4 m, which would have appeared among duplicate LMMS data obtained from the 200 m-long road, was reduced to several centimeters using six tie points.
The maximum surveying range of the LMMS used in this study was about 40 m considering required resolution and accuracy of the LMMS data; the required density of LiDAR point cloud was over 100 points per square meter for mapping the shape of the objects, and the accuracy of close-range photogrammetric surveying could meet the standards of 1:1,000-scale digital map within a corridor of 40 m. Through the line-of-sight analysis and buffer analysis regarding the maximum surveying, it was found that the 16 types of layers in the Korean National Base Map and 35 types of layers in a 1:1,000-scale map could be updated via LMMS surveying.


