Article

Evaluating Ecohydrological Impacts of Vegetation Activities on Climatological Perspectives Using MODIS Gross Primary Productivity and Evapotranspiration Products at Korean Regional Flux Network Site

Water Resources and Remote Sensing Laboratory, Department of Civil and Environmental Engineering, Hanyang University, 222 Wangsimni-ro, Seongdong-gu, Seoul 133-791, Korea
*
Author to whom correspondence should be addressed.
Remote Sens. 2013, 5(5), 2534-2553; https://doi.org/10.3390/rs5052534
Submission received: 15 April 2013 / Revised: 26 April 2013 / Accepted: 9 May 2013 / Published: 21 May 2013

Abstract

:
Accurate assessments of spatio-temporal variations in gross primary productivity (GPP), evapotranspiration (ET), and water use efficiency (WUE) play a crucial role in the evaluation of carbon and water balance as well as have considerable effects on climate change. In this study, Moderate Resolution Imaging Spectroradiometer (MODIS) products were used to quantify the mean annual GPP and ET at Korean regional flux network site. We found that the seasonal mean values of WUE were 2.86 to 2.92 g·C·g·H2O−1 in the dormant season and 1.81 to 1.88 g·C·g·H2O−1 in the growing season during 2007 and 2008. The WUE was relatively stable during the growing season and tended to vary in the dormant season. Remote sensing data obtained by the MODIS satellite were appeared to be effective to improve our understanding of the spatio-temporal variation of ecohydrological parameters which have not yet been investigated in a number of previous articles. Based on the results of this study, we summarize the interactions between carbon and water circulation in terrestrial ecosystems and how their ecological procedures generated by the photosynthesis of vegetation influence in climatological perspectives.

1. Introduction

Vegetation growth is regarded as crucial portion of global carbon and water cycling, and its role has been receiving more attention due to global climate change including increases in the atmospheric carbon dioxide concentration [14]. The continued increase in atmospheric concentrations of carbon dioxide due to anthropogenic emissions is predicted to lead significant changes in climate [5]. Explicit changes in other factors such as land use, land cover types and atmospheric which influence the water budget, plant water use strategy, and the global carbon cycle are expected due to the result of global climate change [6,7]. The monitoring of the carbon cycle has been emphasized in many ecological studies [1,8,9], particularly focused on the relationship between the carbon cycle and vegetation production in the ecosystem, and parameters for detecting vegetation production.
The gross primary productivity (GPP) and net primary productivity (NPP) have been widely used [1014] in traditional methods to study the carbon cycle. The GPP is calculated using observations of vegetation at the beginning of the carbon cycle and is the primary indicator of vegetation carbon fluxes. The GPP is essential in order to control parameter estimations of global carbon variation. Running et al. [10] developed the theoretical basis for the global-scaled NPP algorithm. Tum and Gunther [13] noted that the NPP was based on the dynamic vegetation model of the Biosphere Energy Transfer Hydrology (BETHY/DLR) study in Germany and Austria during 2000 and 2001. Matsushita and Tamura [6] developed a method for estimation of the NPP in East Asia by implementing the Boreal Ecosystem Productivity Simulator (BEPS) model, which combines several sets of data for global applications of the algorithm. Cao et al. [15] and Singh et al. [16] used the Global Production Efficiency Model (GLO-PEM) to calculate the spatio-temporal variation of the NPP between 1981 and 2000 at global scale. Xiao et al. [17] developed satellite-based Vegetation Photosynthesis Model (VPM) to analyze the seasonal variation of GPP in evergreen needleleaf forests. Yuan et al. [11] conducted various spatial and temporal resolutions to quantify the global carbon cycle using EC-LUE (Eddy covariance Light Use Efficiency) model, generated by only four parameters: normalized difference vegetation index (NDVI), photosynthetically active radiation (PAR), air temperature, and the energy flux terms.
The parameters used in these models were limited because they did not consider water circulation. There are many methods for analyzing of the relationships between the water and carbon cycles. The WUE, ratio of carbon gain during plant photosynthesis to water loss during evapotranspiration (ET), is an imperative concept to study these interactive effects, because it couples the water and carbon cycles very effectively [1821]. The WUE can be defined in various ways, such as in different spatial scales, for different study objectives [18,22,23]. Hwang et al. [22] used an eco-hydrological model, the Regional Hydro-Ecological Simulation System (RHESSys), as a scaling tool at regional catchment scale. The RHESSys represented the spatial variation of the water and carbon cycles in a forest ecosystem. Yu et al. [18] analyzed the seasonal variation of the WUE in an ecosystem and demonstrated spatial patterns of ecosystem variables such as GPP, ET, and WUE at 1 km spatial resolution over three local flux tower sites in China between 2003 and 2005. Despite the completion of many studies focused on flux tower measurements, only a limited number of flux tower field measurements for WUE have been available in recent decades, and for only a few ecosystems, in comparison to the development of eddy covariance systems [2426]. Due to the limited number of field measurements, it is also difficult to determine representative data at regional scale. Alternatively, many studies have focused on remote sensing technology [16,19,22,27]. Continuous data from remote sensing technologies have many advantages when compared to general point measurement data. In this study, we used the satellite remote sensing method to improve the understanding of spatio-temporal variations of the WUE and GPP [15,22,24]. The National Aeronautics and Space Agency (NASA) and United States Geological Survey (USGS) have provided the Moderate Resolution Imaging Spectroradiometer (MODIS) global GPP and ET products [10,2730].
The main purposes of this study are to (1) quantify the carbon and water circulation in South Korea from 2007 to 2008 using MODIS satellite remote sensing technology, (2) validate the flux tower measurements with the MODIS products including the GPP and ET, and (3) understand the spatio-temporal variability using a distributed map of the GPP, ET, and WUE in South Korea through validation with ground measurements and MODIS products. This will improve our understanding of the primary mechanism for the coupling of the carbon and water cycles, which is of great importance in predicting the effects of climate change on the ecosystem carbon budget and water resources.

2. Materials

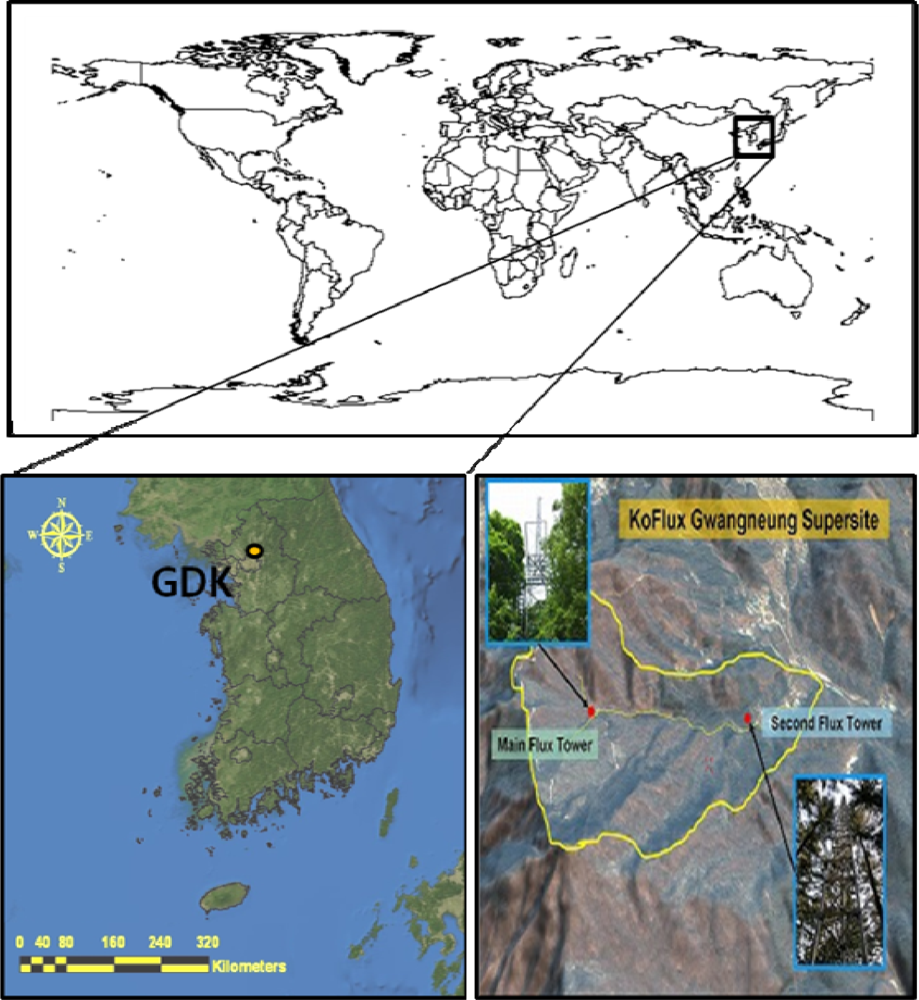
2.1. Site Description

The study site was located in South Korea, where the mapping extent is 32 to 38°N in latitude and 124 to 132°E in longitude. The KoFlux Gwangneung Supersite (GDK) is located in mid-western of South Korea (37.75°N, 127.15°E) and represents a classical cool-temperature, broadleaves forest zone with complex terrain (Figure 1).
The elevation is 340 m, the slope ranges from 10 to 20°, and the canopy height is approximately 18 m. The annual mean temperature is 11.5 °C, the annual mean precipitation is 1,365 mm [31,32] and the maximum leaf area index (LAI) is approximately 6 (Table 1). The data was collected for the study period of 1 January 2007 to 31 December 2008. The MODIS products replaced meteorological observations, as the observed input data and the primary product measurements were used to validate satellite-based estimates.

2.2. Eddy Covariance System

In this study, two meteorological variables (i.e., vapor pressure deficit (VPD) and air temperature) measured by the eddy covariance system at every half hour interval were used to estimate the ET and gross primary productivity. The eddy covariance system is an essential part of the mass conservation equation, which provides the framework to estimate the net ecosystem exchange (NEE, in mgC·m−2·d−1) between the photosynthetic carbon assimilation and releasing respiration. Negative NEE is expressed as another parameter, net ecosystem productivity (NEP, in mgC·m−2·d−1). The GPP is calculated using the following equation:
GPP = NEP + R e = NEE + R e
where Re is the total ecosystem respiration. The ground-measured GPP was validated with the MODIS-based GPP in this study.
The eddy covariance system was applied to the flux observation. This method has been widely used for flux tower measurements worldwide, since the energy and water exchange between the surface and atmosphere can be directly determined:
NEE = Storage flux + eddy flux + advective v flux + advective h flux
The first component on the right side of the equation is the amount of flux stored below the measurement height, second is the flux generated by vertical turbulent motions, third is the amount of flux advected by the mean vertical flow in the presence of the vertical gradient of concentrations, and last component is the fluxes generated by the horizontal flow divergence of the mean flows and the concentrations below the measurement height. Among these components, the conventional eddy covariance system depends on the measurement of the second term, eddy flux. This term is considered to be very useful and efficient tool under steady state conditions over flat terrain with an extended upwind fetch of the underlying vegetation [33]. Due to the inherent complexity, heterogeneity, and variability of the eddy flux in nature, the eddy covariance method has been used over various landscapes and extended temporal scales, resulting in many problems and subsequent remedies [33]. We selected flux tower data measured by the eddy covariance system in order to validate the MODIS ET product.

2.3. The Properties of the MODIS Satellite

The MODIS multispectral sensor of the NASA Earth Observing System (EOS) is being provided atmosphere, land, and ocean products. The overpass time of the Terra satellite is approximately 10:30 AM when descending and 10:30 PM when ascending. The Aqua satellite overpass time is approximately 1:30 AM when descending and 1:30 PM when ascending. The MODIS 17 GPP and 16 global ET products from the Terra satellite were employed to estimate the WUE during 2007 and 2008. The provided datasets in the Hierarchical Data Format (HDF)-EOS with Sinusoidal (SIN) projection was reprojected using Transverse Mercator (TM) coordinate system.

2.4. MODIS 17 GPP/NPP Algorithm and Estimated Products

The GPP is one of the parameters representing the material circulation of the terrestrial ecosystem and is used for detecting and measuring the change in carbon circulation [10,11,18,22,28]. Primary production can be divided into the GPP, which represents the total amount of organic matter produced by vegetation through photosynthesis, and the NPP, which excludes the breathing quantity of the vegetation from total organic matter [19]. These two indices are expressed as the amount of carbon per unit area. In this study, the 8-day GPP output with spatial resolution of 1 km from the MODIS primary product provided by the NASA was used. The MODIS 17 GPP algorithm is associated with carbon circulation. The GPP is a function of sunlight and active radiation-related parameters. The MODIS GPP algorithm is based on the radiation use efficiency of vegetation [10,19] as expressed in the following equations:
GPP = ε × FPAR × PAR
ε = ε max × f ( T min ) × f ( VPD )
PAR = 0.45 × R s
where ε is the radiation use efficiency of vegetation, PAR is the photosynthetically available radiation (MJ·m−2·d−1), εmax is the maximum radiation use efficiency, Tmin is the daily minimum temperature (°C), VPD is the vapor pressure deficit (the difference between the vapor pressure and actual pressure) (Pa), Rs is the short wave radiant energy (MJ m−2 d−1), and FPAR is the fraction of the PAR absorbed by the plant with a value ranging from 0 to 1. When the PAR absorbed by the plant is large or the value of ε is high, then the GPP value increases. Equation (3) shows that the MODIS GPP algorithm assumes that the value of ε is determined according to the vegetation type [34]. The PAR is assumed to be 45% of Rs (Equation (3)), which expresses the change in use efficiency determined by the opening and closing of the stomata according to Tmin and VPD which have upper and lower limits ranging from εmax to 0. The MODIS 15 FPAR product is used due to its similarity with normalized difference vegetation index (NDVI) [10]. The meteorological data of the MODIS GPP algorithm used the Data Assimilation Office (DAO) provided by the NASA, having a spatial resolution of 1.00° × 1.25° as input data. The upper and lower thresholds of εmax, Tmin and VPD determined the opening and closing of the stomata use constant, which were determined according to the vegetation type [34].

2.5. MODIS 16 Global ET Products

The MODIS 16 global ET product was developed centered on Cleugh et al.’s [29] Penman-Monteith based ET (RS-PM) method [30]. The RS-PM method is based on the Penman-Monteith (P-M) equation [35]:
λ E = s A + ρ C p ( e sat e ) / r a s + γ ( 1 + r s / r a )
where λE is the latent heat flux (W·m−2), esat is the saturated water vapor pressure (Pa), s is the slope of the curve relating the saturated water vapor pressure to the temperature (kPa·K−1), A is the available energy (W·m−2), ρ is the air density (kg·m−3), Cp is the specific heat capacity of the air (J·kg−1·K−1), e is the actual water vapor pressure (Pa), ra and rs are the aerodynamic and surface resistances (s·m−1), respectively, and γ is the psychrometric constant (Pa·K−1). The RS-PM algorithm uses the Global Modeling and Assimilation Office (GMAO) meteorological data at a 1.00° × 1.25° resolution (Global Modeling and Assimilation Office, 2004). The algorithm also needs the Collection 4 MODIS land cover (MOD12Q1; [36]), MOD13A2 NDVI/EVI [37,38], MOD15A2 LAI [39], and the 0.05° albedo from the MOD43C1 [4043] data as remote sensing inputs. In this study, the MODIS 16 global ET product was used to estimate the WUE.

2.6. Estimating the WUE Based on Remote Sensing Technology

The previous studies applied the GPP and NPP as parameters of the carbon cycle [10,18,19,22]. These parameters have been widely used and applied to many studies as the amount of carbon produced from photosynthesis and the respiration generated from the stomata of the vegetation, respectively. This study introduced the new carbon cycle index to understand the change in vegetation due to climate change as a hydrological factor. The WUE is the amount of carbon included in 1 kg of water in the atmosphere and it can be used as an index representing the carbon and water cycles [19]. The WUE can be defined in many ways at an ecosystem scale. The three mainly used definitions include the GPP based WUE: GPP/ET, the NPP based WUE: NPP/ET, and the net ecosystem carbon production (NEP) based WUE: NEP/ET. The ET value can be replaced by the annual rainfall and the photochemical reflectance index to calculate the rainfall use efficiency (RUE, [44,45]) and light use efficiency (LUE, [12,27]), respectively. In this study, the first definition (GPP-based WUE) was primarily used to deal with our objectives, since the GPP can reflect the annual net carbon fixation in the plant biomass and also examined how the WUE is distributed nationally.

3. Results and Discussion

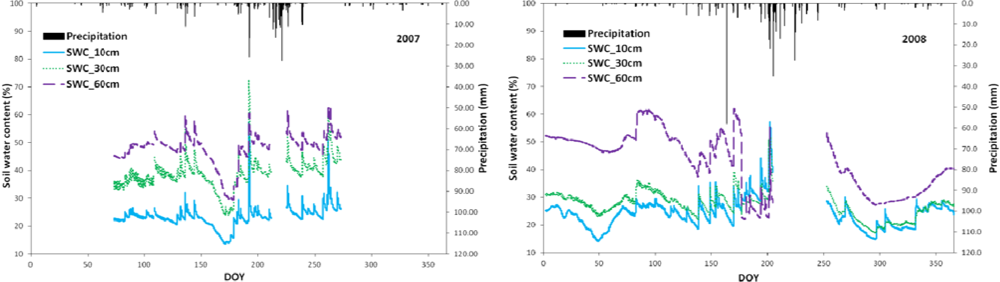
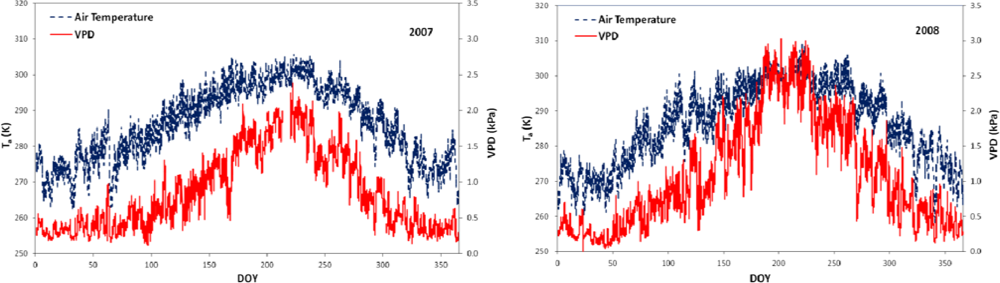
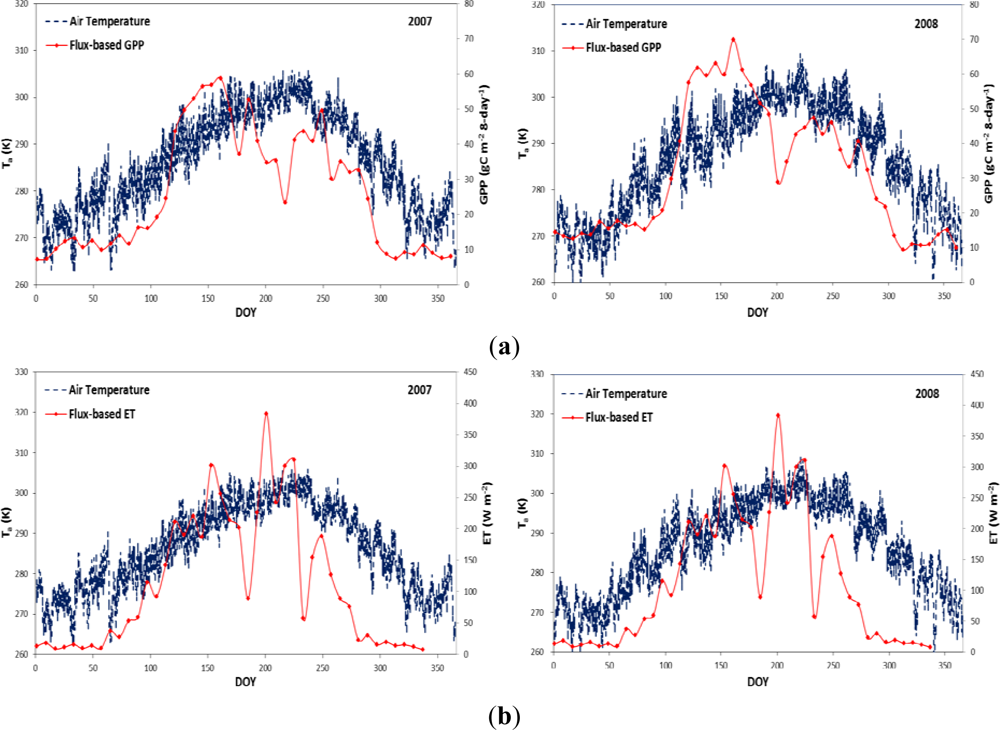
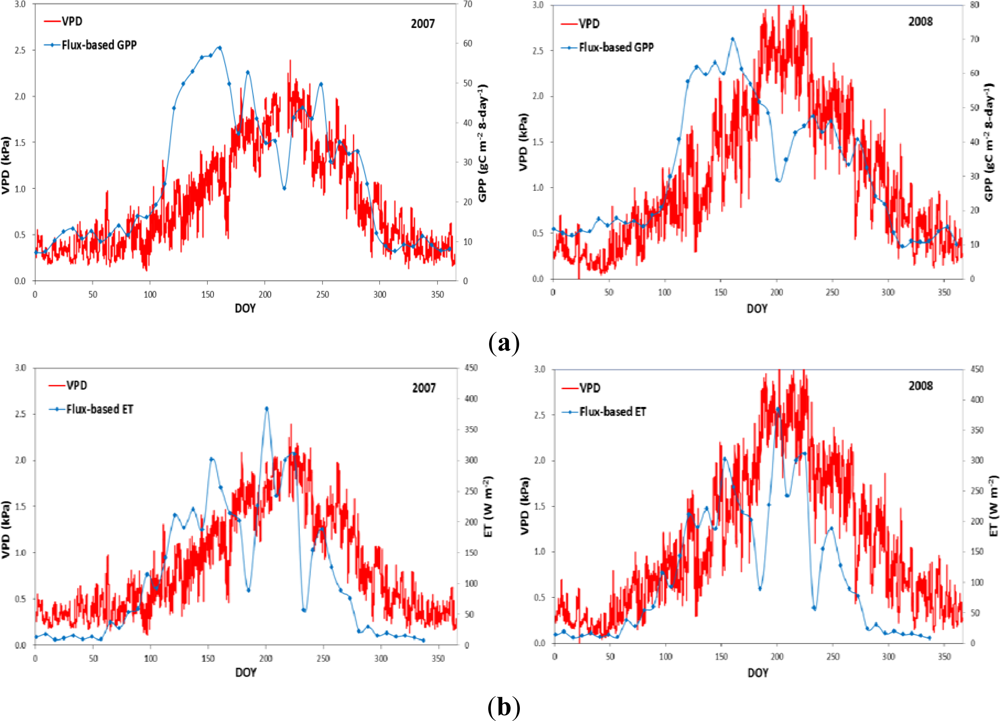
3.1. Temporal Variation of Hydrometeorological Conditions

Figure 2 the shows time series of the hydrometeorological variables (i.e., precipitation, soil water content, vapor pressure deficit (VPD), and air temperature) to understand the algorithms of the GPP and ET. The temporal variation of the soil water content was similar with that of the precipitation in both 2007 and 2008 (Figure 2). The maximum precipitation was occurred from July to August (i.e., from 200 to 250 day of year) and the air temperature was also high during this period (Figure 3).
These results were supported by the many previous studies. Yu et al. [18] analyzed the temporal variation of hydrometeorological variables at three sites (CBS, QYZ, and DHS) in eastern China. Among these sites, the CBS site showed that precipitation, air temperature, soil water content, and VPD were synchronous. Their results showed the similar trends with our results because CBS and our study site, GDK are characterized as dense forest ecosystems which include the monsoon climate region [46,47]. Lee et al. [48] investigated the effect of climate change on the thermal structure of lakes in response to watershed hydrology and showed the similar tendency between precipitation and air temperature in the Asian monsoon climate region. Zhang et al. [49] discussed temporal variation of rainfall and showed the positive correlation between rainfall and soil moisture. Inversely, other two sites, the QYZ and the DHS introduced in Yu et al. [18], showed frequently seasonal drought resulting in low efficiency of water use in a subtropical forest ecosystem in eastern China. Their results indicated that the seasonal distribution of precipitation, air temperature, and soil water content were asynchronous. Their results also specified that the precipitation decreased, to some degree, whereas the air temperature reached its maximum as the vapor pressure deficit (VPD) increased significantly. For this reason, we know that the carbon absorption and vegetation growth were controlled by the activities of this meteorological variable.
The seasonal trends of ground measured GPP and ET showed similar pattern with air temperature as shown in Figure 4. In dormant season (from DOY 1 to 100 and 300 to 365), air temperature showed high variability while GPP and ET were generally stable by non-vegetation activities. Conversely, these variables showed active variation caused by vegetation activities in growing season (from DOY 100 to 300). Comparison of air temperature with GPP and ET showed that GPP and ET had many spike data which was affected by atmospheric condition such as cloud effects. This spike data was removed by adopting of the various calibration methods. The temporal variation of VPD was in good agreement with ground-based GPP and ET as shown in Figure 5. Generally, variables in Figure 5 showed the similar trends with those in Figure 4. The hydrometeorological variables of Figures 4 and 5 were closely related to the ground measured GPP and ET.

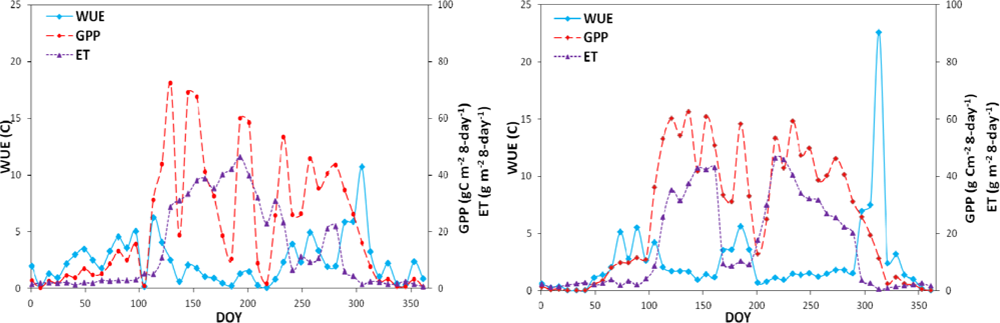
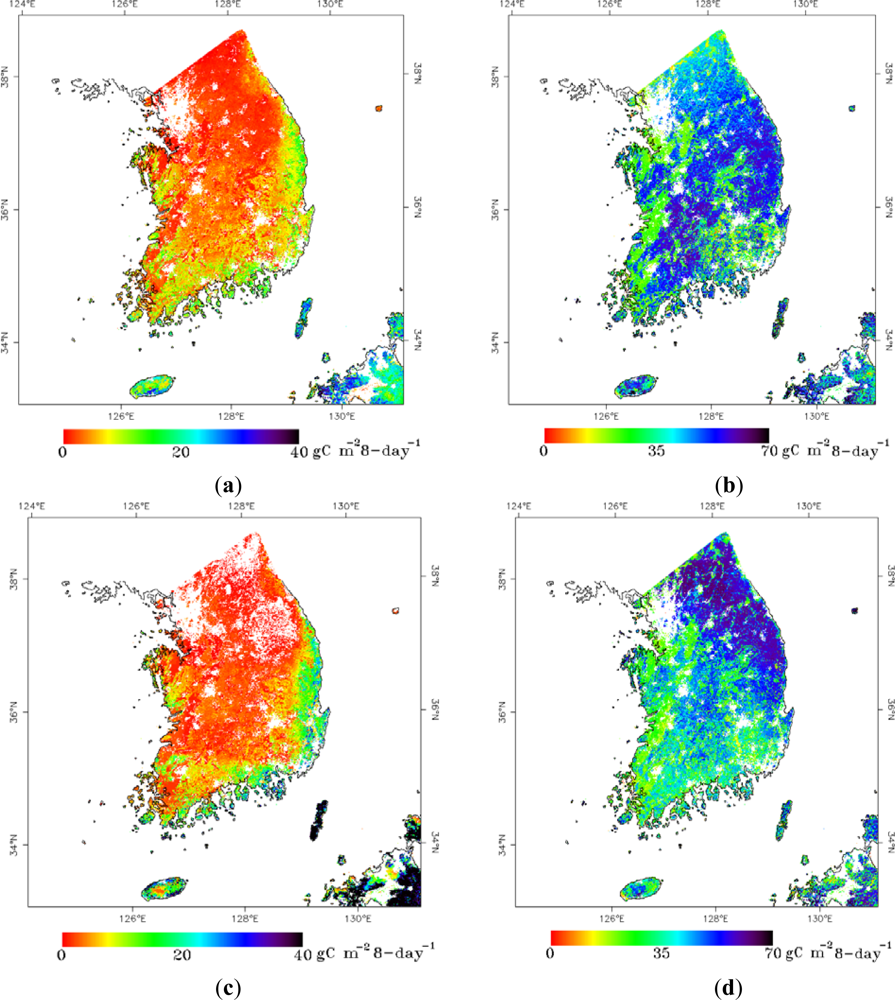
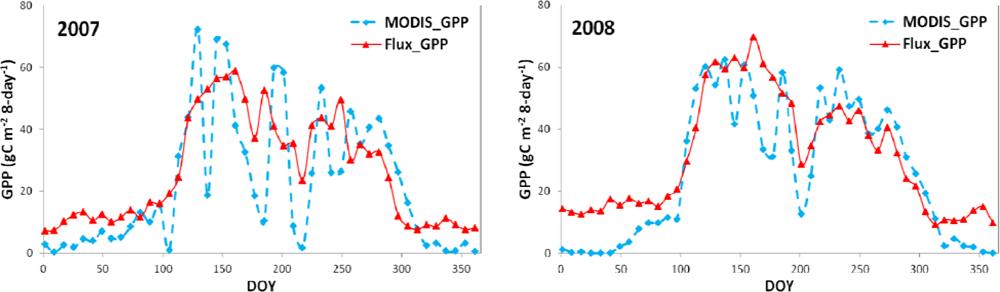
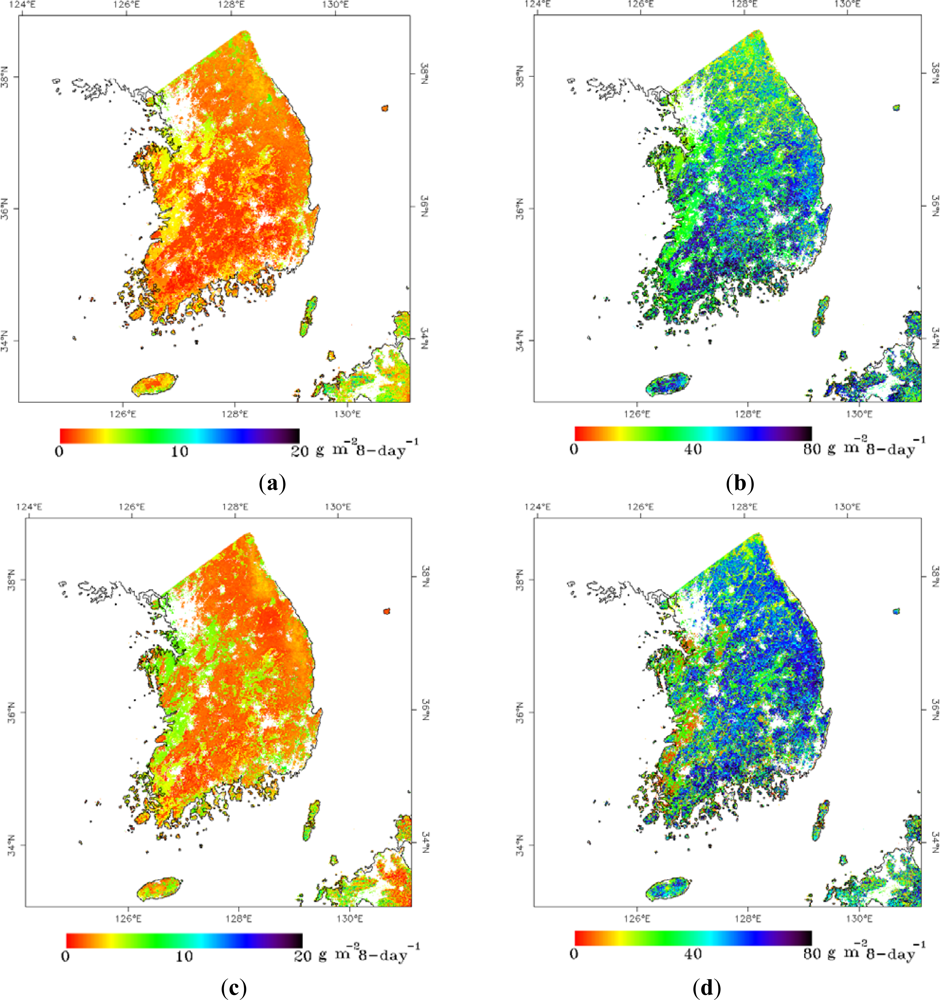
3.2. Spatio-Temporal Variation of Terrestrial Ecosystems’ GPP, ET, and WUE

The maps presented in Figure 6 are the GPP distributions from the MODIS 17 product in the dormant and growing seasons in 2007 and 2008. We found that the GPP of the terrestrial ecosystem in South Korea was ranged from 1 to 70 gC·m−2·8-day−1 and its annual mean was between 21.91 and 25.91 gC·m−2·yr−1. The estimated GPP was higher near the coastline than in the inland areas [46,47] and we detected a trend that the value of Rs, or daily incoming shortwave radiation, was overestimated in areas near the coastline, while the VPD values were underestimated in the inland areas during winter season [46]. However, a large amount of vegetation production detected in the e summer was due to the fact that the Rs had the most significant impact on the estimated GPP in the areas near the coastline and the VPD was more significantly affected in the inland areas [46,47]. The VPD was underestimated in the summer in the entire region except the inland areas, because the GPP values were overestimated in the inland areas (Figure 4) [46].
The MODIS GPP values were lower than the flux tower ground measurement data, because of the underestimation of input data including VPD, Rs, and Tmin (Figure 7). In Figure 7, we found decreasing trends of MODIS-based GPP on growing season, because it was affected by atmospheric effects such as cloud effect which reflect the inaccuracy of the MODIS products. Many methods were developed in previous studies to improve the accuracy of MODIS dataset. Zhao et al. [28] introduced the smoothing method to improve MOD 17 GPP products. In Figure 8, the MODIS-based GPP was fitted well with the flux tower measured GPP. The fitted lines between the MODIS-based GPP (y) and the flux tower measurement GPP (x) were: y = 1.22x − 7.02 with correlation coefficient (R) = 0.85, Bias = 2.94 gC·m−2 and root-mean-squared-error (RMSE) = 14.12 gC·m−2 in 2007 and y = 1.28x − 11.66 with R = 0.94, Bias = 3.63·gC·m−2 and RMSE = 9.04 gC·m−2 in 2008 (Table 2). In Hwang et al. [22] which compared MODIS GPP product with the products of GPP using the RHESSys model at same study site, we found that results of validation showed almost similar patterns.
The spatial distributions of the ET retrieved from the MOD16 from summer to winter in 2007 and 2008 are shown in Figure 9. The estimated ET values were approximately 5 to 35 g·m−2·8-day−1 in the flat western region of Korea and approximately 10 to 70 g·m−2·8-day−1 in the eastern mountainous forest region during 2007 and 2008. Even though we found that the ET values in the western region were substantially underestimated, the general pattern of the MODIS 16 ET values in South Korea were in agreement with the highest ET values over the eastern forested regions and the lowest ET values in inland region [50].
The distribution of the ET showed similar trends with GPP distributions [11,18,19]. The ET near the coastline had higher value, while the ET distribution in the summer was different than the GPP distribution. Since the plateau with higher ET value has lower temperature and air pressure values, there was lower ET in that area [51]. The global MOD16 terrestrial calculated ET was higher than in comparison with the ground measured ET at the GDK flux tower site as shown in Figure 10 [50]. Validation of the MODIS 16 global ET product was performed using flux tower measurements registered by the AsiaFlux network [50] and the results are presented in Figure 11 and Table 2. The fitted lines between the MODIS-based ET (y) and the flux tower measurement ET (x) were: y = 1.07x + 17.15, with a relatively high correlation coefficient, R = 0.76, bias = 2.52 g m−2, RMSE = 9.84 kg m−2 in 2007 and y = 1.26x + 18.90 with R = 0.83, Bias = 4.70 kg m−2, RMSE = 10.41 g m−2 in 2008.
Understanding the spatial distribution of the WUE is significant to estimate the effect of the water cycle on the ecosystem carbon budget and to evaluate the spatial distribution of the water transferring capacity of ecosystems [18]. Yu et al. [18] referred only to the temporal pattern of the WUE in different ecosystems, while we showed the spatial distribution map of the WUE (Figure 12). As shown in Figure 12(a,c), the WUE values near the coastline were higher than inland areas in dormant season because of overestimated GPP values near the coastline. Based on the spatial distribution of the WUE in the growing season (Figure 12(b,d)), the lower WUE was located in the inland area (cropland and rice paddy). The ET of cropland and rice paddy (irrigated region) was much higher than that of other areas [19,52]. The actual ET of rice paddy had similar values with potential ET because of high irrigation. Consequently, the WUE of the cropland was lower than other types of ground cover [19]. The WUE was high in areas located at higher elevations. The summit is located at higher elevation and therefore it has a lower air temperature which results in lower ET values [50]. Figure 13 describes correlated relationship between the GPP and ET. The slope of the GPP-ET curvature in this figure represents WUE which was the ratio of GPP and ET. In dormant season, GPP and ET were correlated most significantly at GPP value less than 10 gC·m−2·8-day−1 and at ET around the 0 to 5 g·m−2·8-day−1 during 2007, whereas GPP and ET values were affected the WUE value in very little extent during 2008, with no correlation at higher values of GPP and ET during 2007 and 2008 (Figures 13 (a,c)). In contrast, in growing season, GPP and ET showed the positive relationship for all ranges, particularly GPP ranging from 10 to 50 gC·m−2·8-day−1 and ET from 10 to 40 g·m−2·8-day−1 (Figures 13(b,d)). Figure 13(b) showed the dense effect of GPP and ET values on WUE during 2007, whereas Figure 13(d) showed the spatially scattered effect of GPP and ET on WUE in 2008.
We found that the seasonal mean of the WUE for the terrestrial ecosystem in 2007 was 2.86 g·C·g·H2O−1, ranging from 0.20 to 10.73 g·C·g·H2O−1 in the dormant season and the mean WUE was 1.81 g·C·g·H2O−1, ranging from 0.07 to 4.06 g·C·g·H2O−1 in the growing season. Then, the seasonal mean WUE was 2.92 g·C·g·H2O−1 in 2008, ranging from 0.05 to 22.60 g·C·g·H2O−1 in the dormant season and the mean WUE was 1.88 g·C·g·H2O−1, ranging from 0.72 to 5.61 g·C g H2O−1 in the growing season (Figure 14). While the WUE was relatively stable during the growing season and variation in its pattern was observed during the dormant season (Figure 14) [18], the mean value of the WUE in the dormant season was higher than in the growing season. In such cases, the WUE can be affected by both the GPP and ET in the growing season, and therefore the changing patterns of the WUE show a stable trend, because the vegetation productivity related to both the GPP and ET is actively generating.

4. Conclusions

Understanding the spatio-temporal variation of the WUE and its environmental control mechanism are of great significance to estimate the effect of the water cycle on the ecosystem carbon budget and to evaluate the spatio-temporal variation of the water circulation of ecosystems. This study represents the first attempt to assess the spatio-temporal variation of the GPP, ET, and WUE using remote sensing technology and to understand the interactions between carbon and water circulations in South Korea. We used the GPP with the MOD 17 GPP products and MOD 16 global ET products to derive regional scale map of the WUE which showed the spatial variability of the WUE in South Korea. Using MODIS products, we quantified the mean annual GPP as 21.91 and 25.91 gC·m−2·8-day−1 and the mean annual ET as 13.85 and 15.84 g·m−2·8-day−1 for the period of 2007 and 2008, respectively. The seasonal mean of the WUE was 2.86 and 2.92 g·C·g·H2O−1 in the dormant season and 1.81 and 1.88 g·C·g·H2O−1 in the growing seasons during 2007 and 2008. In case of spatial variation, it was identified that the WUE values near the coastline were higher than inland areas in dormant season because of overestimated GPP values near the coastline. The lower WUE was identified in the agricultural area such as cropland and rice paddy. The WUE was high in highly elevated areas as in case of the plateau which was located at a higher elevation resulted in lower ET and high WUE value. In case of temporal variation, Understanding the spatio-temporal pattern of WUE is the most significant to estimate the ecosystem carbon budget (photosynthesis of the vegetation) and to evaluate the spatio-temporal variation of water circulation. We investigated the interaction between the carbon and water circulation in terrestrial ecosystems and found that these ecological procedures were generated by the photosynthesis of the vegetation. The MODIS-based GPP, ET, and WUE map introduced in this study were appeared to be useful for understanding of the relationship between the water and carbon cycle with reasonable accuracy.
  • Conflict of InterestThe authors declare no conflict of interest.

References and Notes

  1. Nemani, R.R.; Keeling, C.D.; Hashimoto, H.; Jolly, W.M.; Piper, S.C.; Tucker, C.J.; Myneni, R.B.; Running, S.W. Climate-Driven increases in global terrestrial net primary production from 1982 to 1999. Science 2003, 300, 1560–1563. [Google Scholar]
  2. Cook, B.D.; Davis, K.J.; Wang, W.; Desai, A.R.; Berger, B.W.; Teclaw, R.M.; Martin, J.G.; Bolstad, P.V.; Bakwin, P.S.; Yi, C.; Heilman, W. Carbon exchange and venting anomalies in an upland deciduous forest in northern Wisconsin, USA. Agr. For. Meteorol. 2004, 126, 271–295. [Google Scholar]
  3. Goodale, C.L.; Apps, M.J.; Birdsey, R.A.; Field, C.B.; Heath, L.S.; Houghton, R.A.; Jenkins, J.C.; Kohlmaier, G.H.; Kurz, W.; Liu, S.; Nabuurs, G.-J.; Nilsson, S.; Shvidenko, A.Z. Forest carbon sinks in the northern hemisphere. Ecol. Appl. 2002, 12, 891–899. [Google Scholar]
  4. McCaughey, J.H.; Pejam, M.R.; Arain, M.A.; Cameron, D.A. Carbon dioxide and energy fluxes from a boreal mixedwood forest ecosystems in Ontario, Canada. Agr. For. Meteorol. 2006, 140, 79–96. [Google Scholar]
  5. Cox, P.M.; Betts, R.A.; Jones, C.D.; Spall, S.A.; Totterdell, I.J. Acceleration of global warming due to carbon-cycle feedbacks in a coupled climate model. Nature 2000, 408, 184–187. [Google Scholar]
  6. Matsushita, B.; Tamura, M. Integrating remotely sensed data with an ecosystem model to estimate net primary productivity in East Asia. Remote Sens. Environ. 2002, 81, 58–66. [Google Scholar]
  7. Climate Change 2007: Synthesis Report. Contribution of Working Groups Groups I, II and III to the Fourth Assessment Report of the Intergovernmental Panel on Climate Change; IPCC: Geneva, Switzerland, 2007.
  8. Churkina, G.; Running, S.W.; Schloss, A.L. Comparing global models of terrestrial net primary productivity (NPP): The importance of water availability. Glob. Change Biol. 2000, 5, 46–55. [Google Scholar]
  9. Morisette, J.T.; Heinsch, F.A.; Running, S.W. Monitoring global vegetation using moderate-resolution satellites. Eos Trans. AGU 2006, 87, 214–231. [Google Scholar]
  10. Running, S.W.; Thornton, P.E.; Nemani, R.; Glassy, J. Global Terrestrial Gross and Net Primary Productivity from the Earth Observing System. In Methods in Ecosystem Science; Sala, O.E., Jackson, R.B., Eds.; Springer-Verlag: New York, NY, USA, 2000; pp. 44–57. [Google Scholar]
  11. Yuan, W.; Liu, S.; Yu, G.; Bonnefond, J.-M.; Chen, J.; Davis, K.; Desai, A.R.; Goldstein, A.H.; Gianelle, D.; Rossi, F.; et al. Global estimates of evapotranspiration and gross primary production based on MODIS and global meteorology data. Remote Sens. Environ. 2010, 114, 1416–1431. [Google Scholar]
  12. Polley, H.W.; Phillips, R.L.; Frank, A.B.; Bradford, J.A.; Sims, P.L.; Morgan, J.A.; Kiniry, J.R. Variability in light-use efficiency for Gross Primary Productivity on great plains grasslands. Ecosystems 2011, 14, 15–27. [Google Scholar]
  13. Tum, M.; Gunther, K.P. Validating modelled NPP using statistical yield data. Biomass Bioenerg. 2011, 35, 4665–4674. [Google Scholar]
  14. Webb, W.; Szarek, S.; Lauenroth, W.K.; Kinerson, R.; Smith, M. Primary productivity and water use in native forest, grassland, and desert ecosystems. Ecology 1978, 59, 1239–1247. [Google Scholar]
  15. Cao, M.; Prince, S.D.; Small, J.; Goetz, S.J. Remotely sensed interannual variations and trends in terrestrial net primary productivity 1981–2000. Ecosystems 2004, 7, 233–242. [Google Scholar]
  16. Singh, R.P.; Rovshan, S.; Goroshi, S.K.; Panigrahy, S.; Parihar, J.S. Spatial and temporal variability of Net Primary Productivity (NPP) over terrestrial biosphere of India using NOAA-AVHRR Based GloPEM Model. J. Indian Soc. Remote Sens. 2011, 39, 345–353. [Google Scholar]
  17. Xiao, X.; Hollinger, D.; Aber, J.; Goltz, M.; Davidson, E.A.; Zhang, Q.; Moore, B. Satellite-Based modeling of gross primary production in an evergreen needleleaf forest. Remote Sens. Environ. 2004, 89, 519–534. [Google Scholar]
  18. Yu, G.; Song, X.; Wang, Q.; Liu, Y.; Guan, D.; Yan, J.; Sun, X.; Zhang, L.; Wen, X. Water-Use efficiency of forest ecosystems in eastern China and its relations to climatic variables. New Phytol. 2008, 177, 927–937. [Google Scholar]
  19. Tian, H.; Chen, G.; Liu, M.; Zhang, C.; Sun, G.; Lu, C.; Xu, X.; Ren, W.; Pan, S.; Chappelka, A. Model estimates of net primary productivity, evapotranspiration, and water use efficiency in the terrestrial ecosystems of the southern United States during 1895–2007. Forest Ecol. Manage. 2010, 259, 1311–1327. [Google Scholar]
  20. Allen, L.H., Jr; Kakani, V.G.; Vu, J.C.V.; Boote, K.J. Elevated CO2 increase water use efficiency by sustaining photosynthesis of water-limited maize and sorghum. J. Plant Physiol. 2011, 168, 1909–1918. [Google Scholar]
  21. Jassal, R.S.; Black, T.A.; Spittlehouse, D.L.; Brummer, C.; Nesic, Z. Evapotranspiration and water use efficiency in different-aged Pacific Northwest Douglas-fir stands. Agr. For. Meteorol. 2009, 149, 1168–1178. [Google Scholar]
  22. Hwang, T.; Kang, S.; Kim, J.; Kim, Y.; Lee, D.; Band, L. Evaluating drought effect on MODIS Gross Primary Production (GPP) with an eco-hydrological model in the mountainous forest, East Asia. Glob. Change Biol. 2008, 14, 1037–1056. [Google Scholar]
  23. Law, B.; Falge, E.; Gu, L.; Baldocchi, D.D.; Bakwin, P.; Berbigier, P.; Davis, K.; Dolman, A.J.; Falk, M.; Fuentes, J.D.; et al. Environmental controls over carbon dioxide and water vapor exchange of terrestrial vegetation. Agr. For. Meteorol. 2002, 113, 97–120. [Google Scholar]
  24. Sakamoto, T.; Gitelson, A.A.; Wardlow, B.D.; Verma, S.B.; Suyker, A.E. Estimating daily gross primary production of maize based only on MODIS WDRVI and shortwave radiation data. Remote Sens. Environ. 2011, 115, 3091–3101. [Google Scholar]
  25. Jongen, M.; Pereira, J.S.; Aires, L.M.I.; Pio, C.A. The effects of drought and timing of precipitation on the inter-annual variation in ecosystem-atmosphere exchange in a Mediterranean grassland. Agr. For. Meteorol. 2011, 151, 595–606. [Google Scholar]
  26. Ponton, S.; Flanagan, F.B.; Alstad, K.P.; Johnson, B.G.; Morgenstern, K.; Kljun, N.; Black, T.A.; Barr, A.G. Comparison of ecosystem water use efficiency among Douglas-fir forest, aspen forest and grassland using eddy covariance and carbon isotope techniques. Glob. Change Biol. 2006, 12, 294–310. [Google Scholar]
  27. Drolet, G.G.; Middleton, E.M.; Huemmrich, K.F.; Hall, F.G.; Amiro, B.D.; Barr, A.G.; Black, T.A.; McCaughey, J.H.; Margolis, H.A. Regional mapping of gross light-use efficiency using MODIS spectral indices. Remote Sens. Environ. 2008, 112, 3064–3078. [Google Scholar]
  28. Zhao, M.; Heinsch, F.A.; Nemani, R.R.; Running, S.W. Improvements of the MODIS terrestrial gross and net primary production global data set. Remote Sens. Environ. 2005, 95, 164–176. [Google Scholar]
  29. Cleugh, H.A.; Leuning, R.; Mu, Q.; Running, S.W. Regional evaporation estimates from flux tower and MODIS satellite data. Remote Sens. Environ. 2007, 106, 285–304. [Google Scholar]
  30. Mu, Q.; Heinsch, F.A.; Zhao, M.; Running, S.W. Development of a global evapotranspiration algorithm based on MODIS and global meteorology data. Remote Sens. Environ. 2007, 111, 519–536. [Google Scholar]
  31. Lim, J.-H.; Shin, J.H.; Jin, G.Z.; Chun, J.H.; Oh, J.S. Forest stand structure, site characteristics and carbon budget of the Kwangneung Natural Forest in Korea (in Korean). Korean J. Agr. Forest Meteorol. 2003, 5, 101–109. [Google Scholar]
  32. Ryu, Y.; Kang, S.; Moon, S.-K.; Kim, J. Evaluation of land surface radiation balance derived from moderate resolution imaging spectroradiometer (MODIS) over complex terrain and heterogeneous landscape on clear sky days. Agr. For. Meteorol. 2008, 148, 1538–1552. [Google Scholar]
  33. Kim, J.; Lee, D.; Hong, J.; Kang, S.; Kim, S.-J.; Moon, S.-K.; Lim, J.-H.; Son, Y.; Lee, J.; Kim, S. HydroKorea and CarboKorea: Cross-scale studies of ecohydrology and biogeochemistry in a heterogeneous and complex forest catchment of Korea. Ecol. Res. 2006, 21, 881–889. [Google Scholar]
  34. Heinsch, F.A.; Reeves, M.; Bowker, C.F.; Votava, P.; Kang, S.; Milesi, C.; Zhao, M.; Glassy, J.; Jolly, W.M.; Kimball, J.S.; et al. User’s Guide: GPP and NPP (MOD17A2/A3) Products. NASA MODIS Land Algorithm.. 2003. Available online: http://www.ntsg.umt.edu/sites/ntsg.umt.edu/files/modis/MOD17UsersGuide.pdf (accessed on 4 November 2012).
  35. Monteith, J.L. Evaporation and environment. Symp. Soc. Exp. Biol. 1965, 19, 205–234. [Google Scholar]
  36. Friedl, M.; McIver, D.; Hodges, J.; Zhang, X.; Muchoney, D.; Strahler, A.; Woodcock, C.; Gopal, S.; Schneider, A.; Cooper, A. Global land cover mapping from MODIS: Algorithms and early results. Remote Sens. Environ. 2002, 83, 287–302. [Google Scholar]
  37. Huete, A.R.; Didan, K.; Miura, T.; Rodriguez, E.P.; Gao, X.; Ferreira, L.G. Overview of the radiometric and biophysical performance of the MODIS vegetation indices. Remote Sens. Environ. 2002, 83, 195–213. [Google Scholar]
  38. Huete, A.R.; Didan, K.; Shimabukuro, Y.E.; Ratana, P.; Saleska, S.R.; Hutyra, L.R.; Yang, W.; Nemani, R.R.; Myneni, R. Amazon rainforests green-up with sunlight in dry season. Geophys. Res. Lett. 2006, 33. [Google Scholar] [CrossRef]
  39. Myneni, R.B.; Hoffman, S.; Knyazikhin, Y.; Privette, J.L.; Glassy, J.; Tian, Y.; Wang, Y.; Song, X.; Zhang, Y.; Smith, G.R.; et al. Global products of vegetation leaf area and fraction absorbed PAR from year one of MODIS data. Remote Sens. Environ. 2002, 83, 214–231. [Google Scholar]
  40. Jin, Y.; Schaaf, C.B.; Gao, F.; Li, X.; Strahler, A.H.; Lucht, W.; Liang, S. Consistency of MODIS surface bidirectional reflectance distribution function and albedo retrievals: 1. Algorithm performance. J. Geophys. Res. 2003, 108. [Google Scholar] [CrossRef]
  41. Lucht, W.; Schaaf, C.B.; Strahler, A.H. An Algorithm for the retrieval of albedo from space using semiempirical BRDF models. IEEE Trans. Geosci. Remote Sens. 2000, 38, 977–998. [Google Scholar]
  42. Salomon, J.; Schaaf, C.B.; Strahler, A.H.; Gao, F.; Jin, Y. Validation of the MODIS bidirectional reflectance distribution function and albedo retrievals using combined observations from the aqua and terra platforms. IEEE Trans. Geosci. Remote Sens. 2006, 44, 1555–1565. [Google Scholar]
  43. Schaaf, C.B.; Gao, F.; Strahler, A.H.; Lucht, W.; Li, X.; Tsang, T.; Strugnell, N.C.; Zhang, X.; Jin, Y.; Muller, J.-P; et al. First operational BRDF, Albedo and Nadir Reflectance Products from MODIS. Remote Sens. Environ. 2002, 83, 135–148. [Google Scholar]
  44. Bai, Y.; Wu, J.; Qi, X.; Pan, Q.; Huang, J.; Yang, D.; Han, X. Primary production and rain use efficiency across a precipitation gradient on the Mongolia plateau. Ecology 2008, 89, 2140–2153. [Google Scholar]
  45. Huxman, T.E.; Smith, M.D.; Fay, P.A.; Knapp, A.K.; Shaw, M.R.; Loik, M.E.; Smith, S.D.; Tissue, D.T.; Zak, J.C.; Weltzin, J.F.; et al. Convergence across biomes to a common rain use efficiency. Nature 2004, 429, 651–654. [Google Scholar]
  46. Kang, S.; Kim, Y.; Kim, Y. Errors of MODIS product of Gross Primary Productivity by using Data Assimilation Office Meteorological data (in Korean). Korean J. Agr. Forest Meteorol. 2005, 7, 171–183. [Google Scholar]
  47. Kim, Y.; Kang, S.; Kim, J. Enhancing the reliability of MODIS Gross Primary Productivity (GPP) by improving input data (in Korean). Korean J. Agr. Forest Meteorol. 2007, 9, 132–139. [Google Scholar]
  48. Lee, H.W.; Kim, E.J.; Park, S.S.; Choi, J.H. Effects of climate change on the thermal structure of lakes in the Asian Monsoon Area. Climatic Change 2012, 112, 859–880. [Google Scholar]
  49. Zhang, Z.; Xu, C.-Y.; El-Tahir, M.E.H.; Cao, J.; Singh, V.P. Spatial and temporal variation of precipitation in Sudan and their possible cause during 1948–2005. Stoch. Environ. Res. Risk Assess. 2012, 26, 429–441. [Google Scholar]
  50. Kim, H.W.; Hwang, K.; Mu, Q.; Lee, S.O.; Choi, M. Validation of MODIS 16 global terrestrial evapotranspiration products in various climates and land cover types in Asia. KSCE J. Civil Eng. 2012, 16, 229–238. [Google Scholar]
  51. Monteith, J.L. Principles of Environmental Physics, 1st ed.; Edward Arnold: London, UK, 1973. [Google Scholar]
  52. Moon, B.-K.; Hong, J.; Lee, B.-R.; Yun, J.I.; Park, E.W.; Kim, J. CO2 and Energy Exchange in a Rice Paddy for the Growing season of 2002 in Hari, Korea. Korean J. Agr. Forest Meteorol. 2003, 5, 51–60. [Google Scholar]
Figure 1. Geographical locations of the study site (Asiaflux website: www.asiaflux.net).
Remotesensing 05 02534f1
Figure 2. Temporal variation of precipitation and soil water content (SWC) at depth of 10, 30, and 60 cm at GDK site in South Korea.
Remotesensing 05 02534f2
Figure 3. Temporal variation of air temperature (Ta) and saturated vapor pressure deficit (VPD) at GDK site in South Korea.
Remotesensing 05 02534f3
Figure 4. Temporal variation of air temperature (Ta), ET, and GPP at GDK site in South Korea. (a) Ta and flux-based GPP; (b) Ta and flux-based ET.
Remotesensing 05 02534f4
Figure 5. Temporal variation of saturated vapor pressure deficit (VPD), ET, and GPP at GDK site in South Korea. (a) VPD and flux-based GPP; (b) VPD and flux-based ET.
Remotesensing 05 02534f5
Figure 6. Spatial distribution of GPP in South Korea. (a) 17–24 January 2007. (b) 21–28 August 2007. (c) 17–24 January 2008. (d) 21–28 August 2008.
Remotesensing 05 02534f6
Figure 7. Time series of observed and estimated GPP.
Remotesensing 05 02534f7
Figure 8. Relationship between MODIS-based GPP and flux tower measurement GPP.
Remotesensing 05 02534f8
Figure 9. Spatial distribution of ET in South Korea. (a) 17–24 January 2007. (b) 21–28 August 2007. (c) 17–24 January 2008. (d) 21–28 August 2008.
Remotesensing 05 02534f9
Figure 10. Relationship between MODIS-based ET and flux tower measurement ET.
Remotesensing 05 02534f10
Figure 11. Time series of observed and estimated ET.
Remotesensing 05 02534f11
Figure 12. Spatial distribution of WUE in South Korea. (a) 17–24 January 2007. (b) 21–28 August 2007. (c) 17–24 January 2008. (d) 21–28 August 2008.
Remotesensing 05 02534f12
Figure 13. Spatial relationship between GPP and ET. (a) 17–24 January 2007. (b) 21–28 August 2007. (c) 17–24 January 2007 (d) 21–28 August 2008.
Remotesensing 05 02534f13
Figure 14. Time series of MODIS-based GPP, ET, and WUE at GDK site in South Korea.
Remotesensing 05 02534f14
Table 1. Site descriptions.
PropertiesKoFlux Gwangneung Supersite (GDK)
Latitude37.75°N
Longitude127.15°E
Elevation340 m
Slope10–20°
Land coverMixed forests
Soil textureSandy loam
Predominant speciesQuercus sp., Carpinus sp. (80–200 years old)
Depth of soil moisture10, 30, 60 cm
Canopy height18 m
Maximum Leaf Area Index (LAI)6
Mean annual temperature11.5 °C
Mean annual precipitation1,365 mm
Table 2. Statistical comparing observed and estimated GPP and ET.
GDKAverageBiasRMSERegression SlopeCorrelation Coefficient (R)
GPP (gC·m−2·8-day−1)200721.702.9414.121.220.85
200824.633.639.641.280.94

ET (g·m−2·8-day −1)200713.852.529.841.070.76
200815.844.7010.411.260.83

