Performance Analysis of Mobile Laser Scanning Systems in Target Representation


Abstract
:1. Introduction
2. Materials
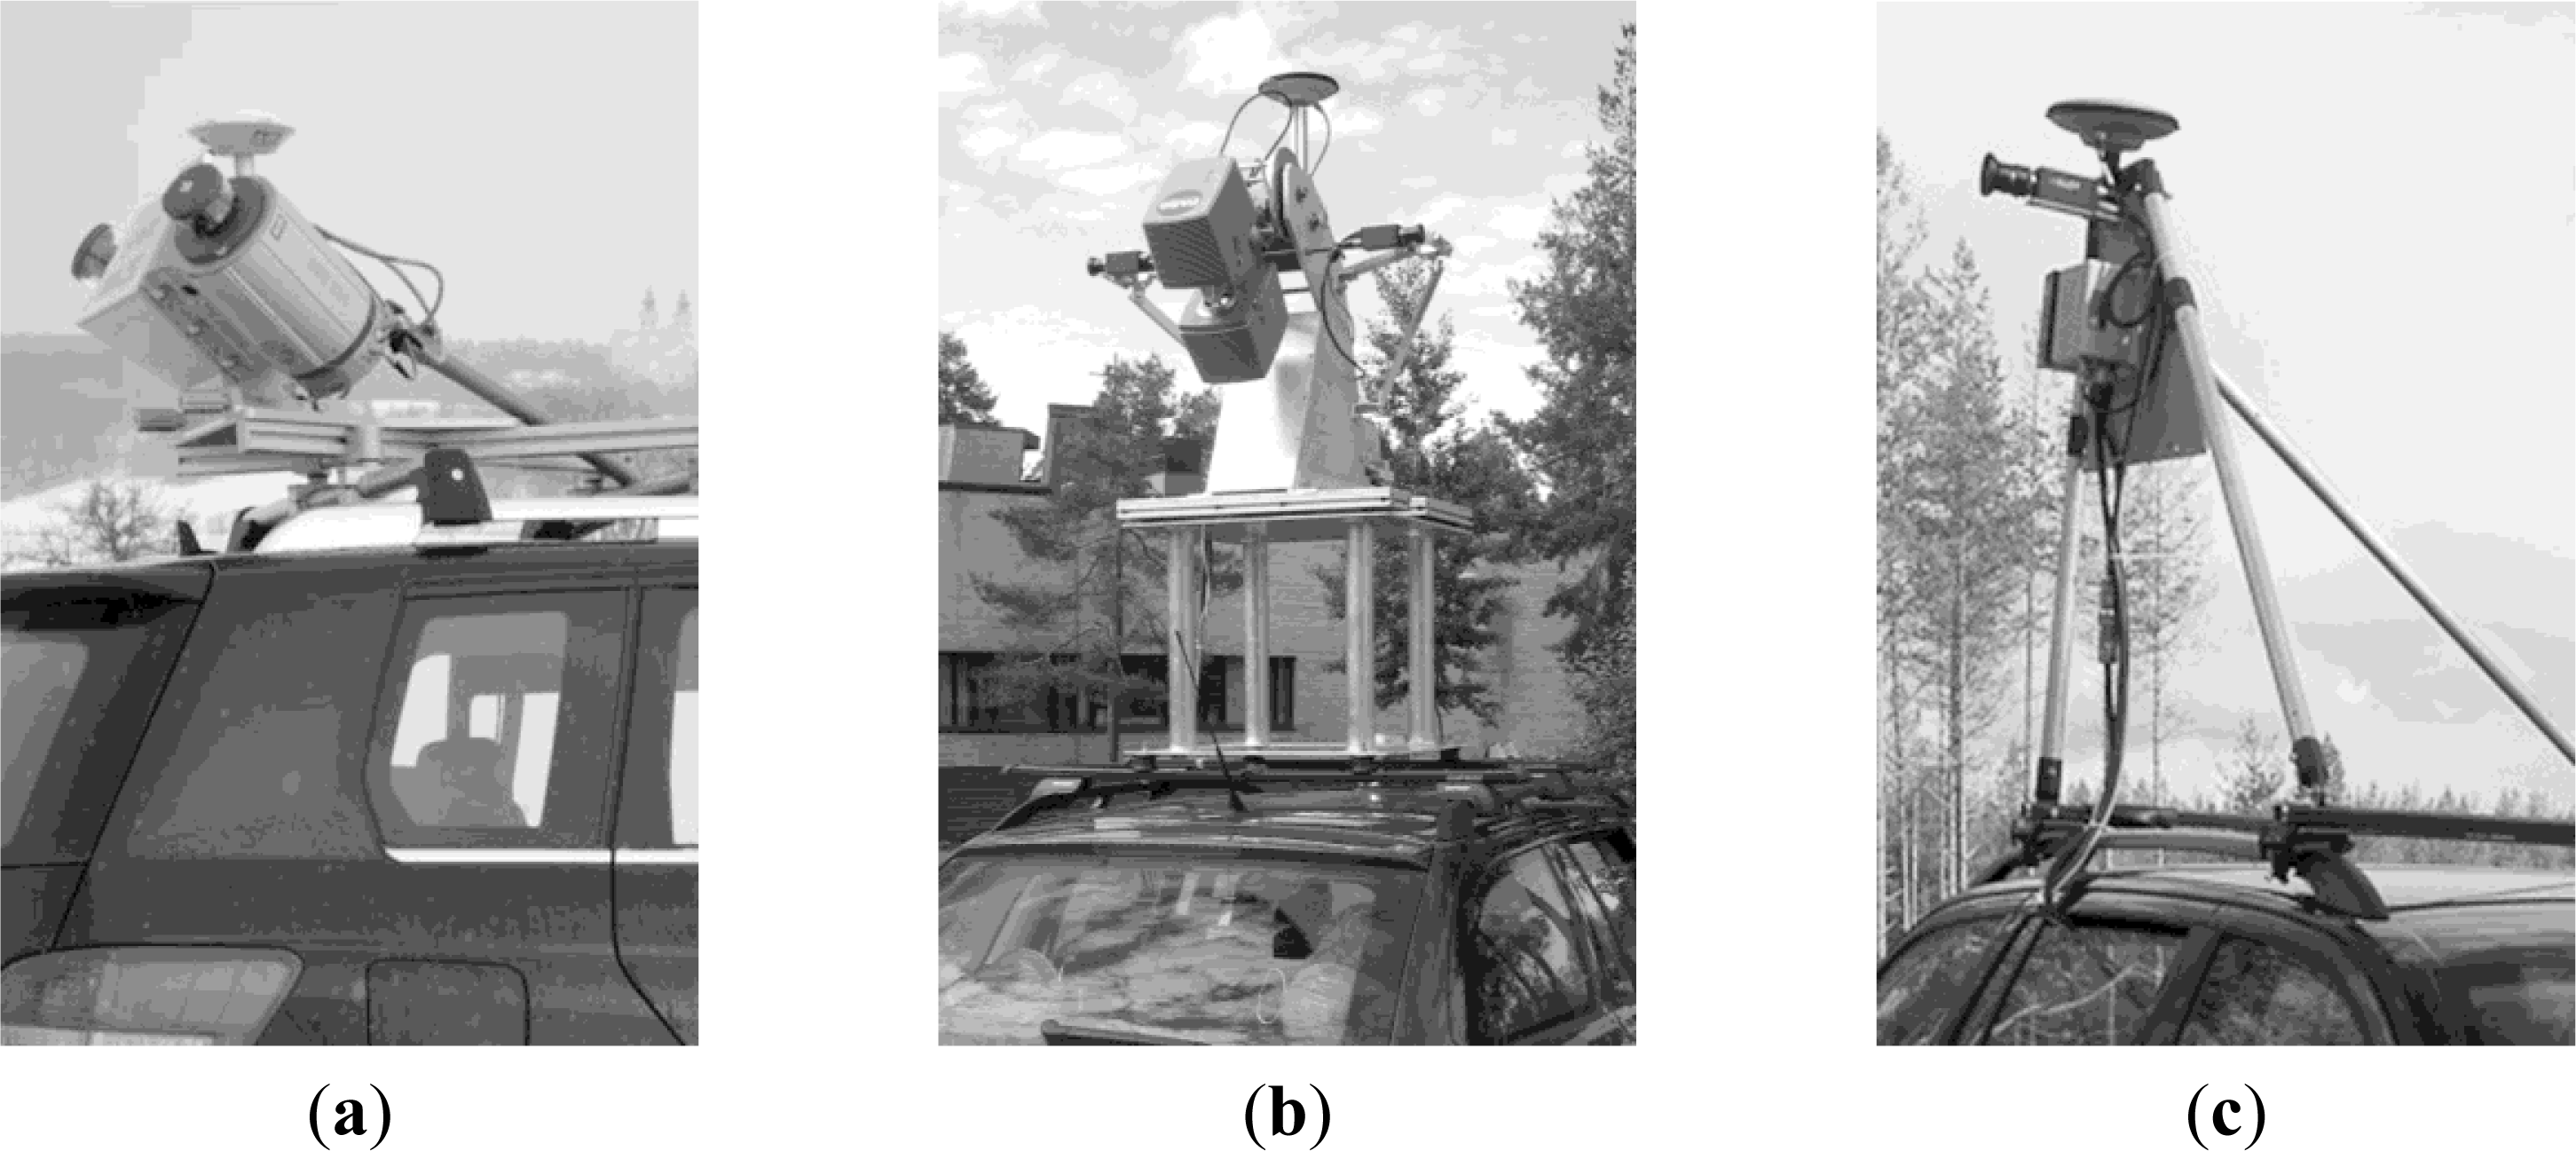
2.1. Mobile Laser Scanning Systems
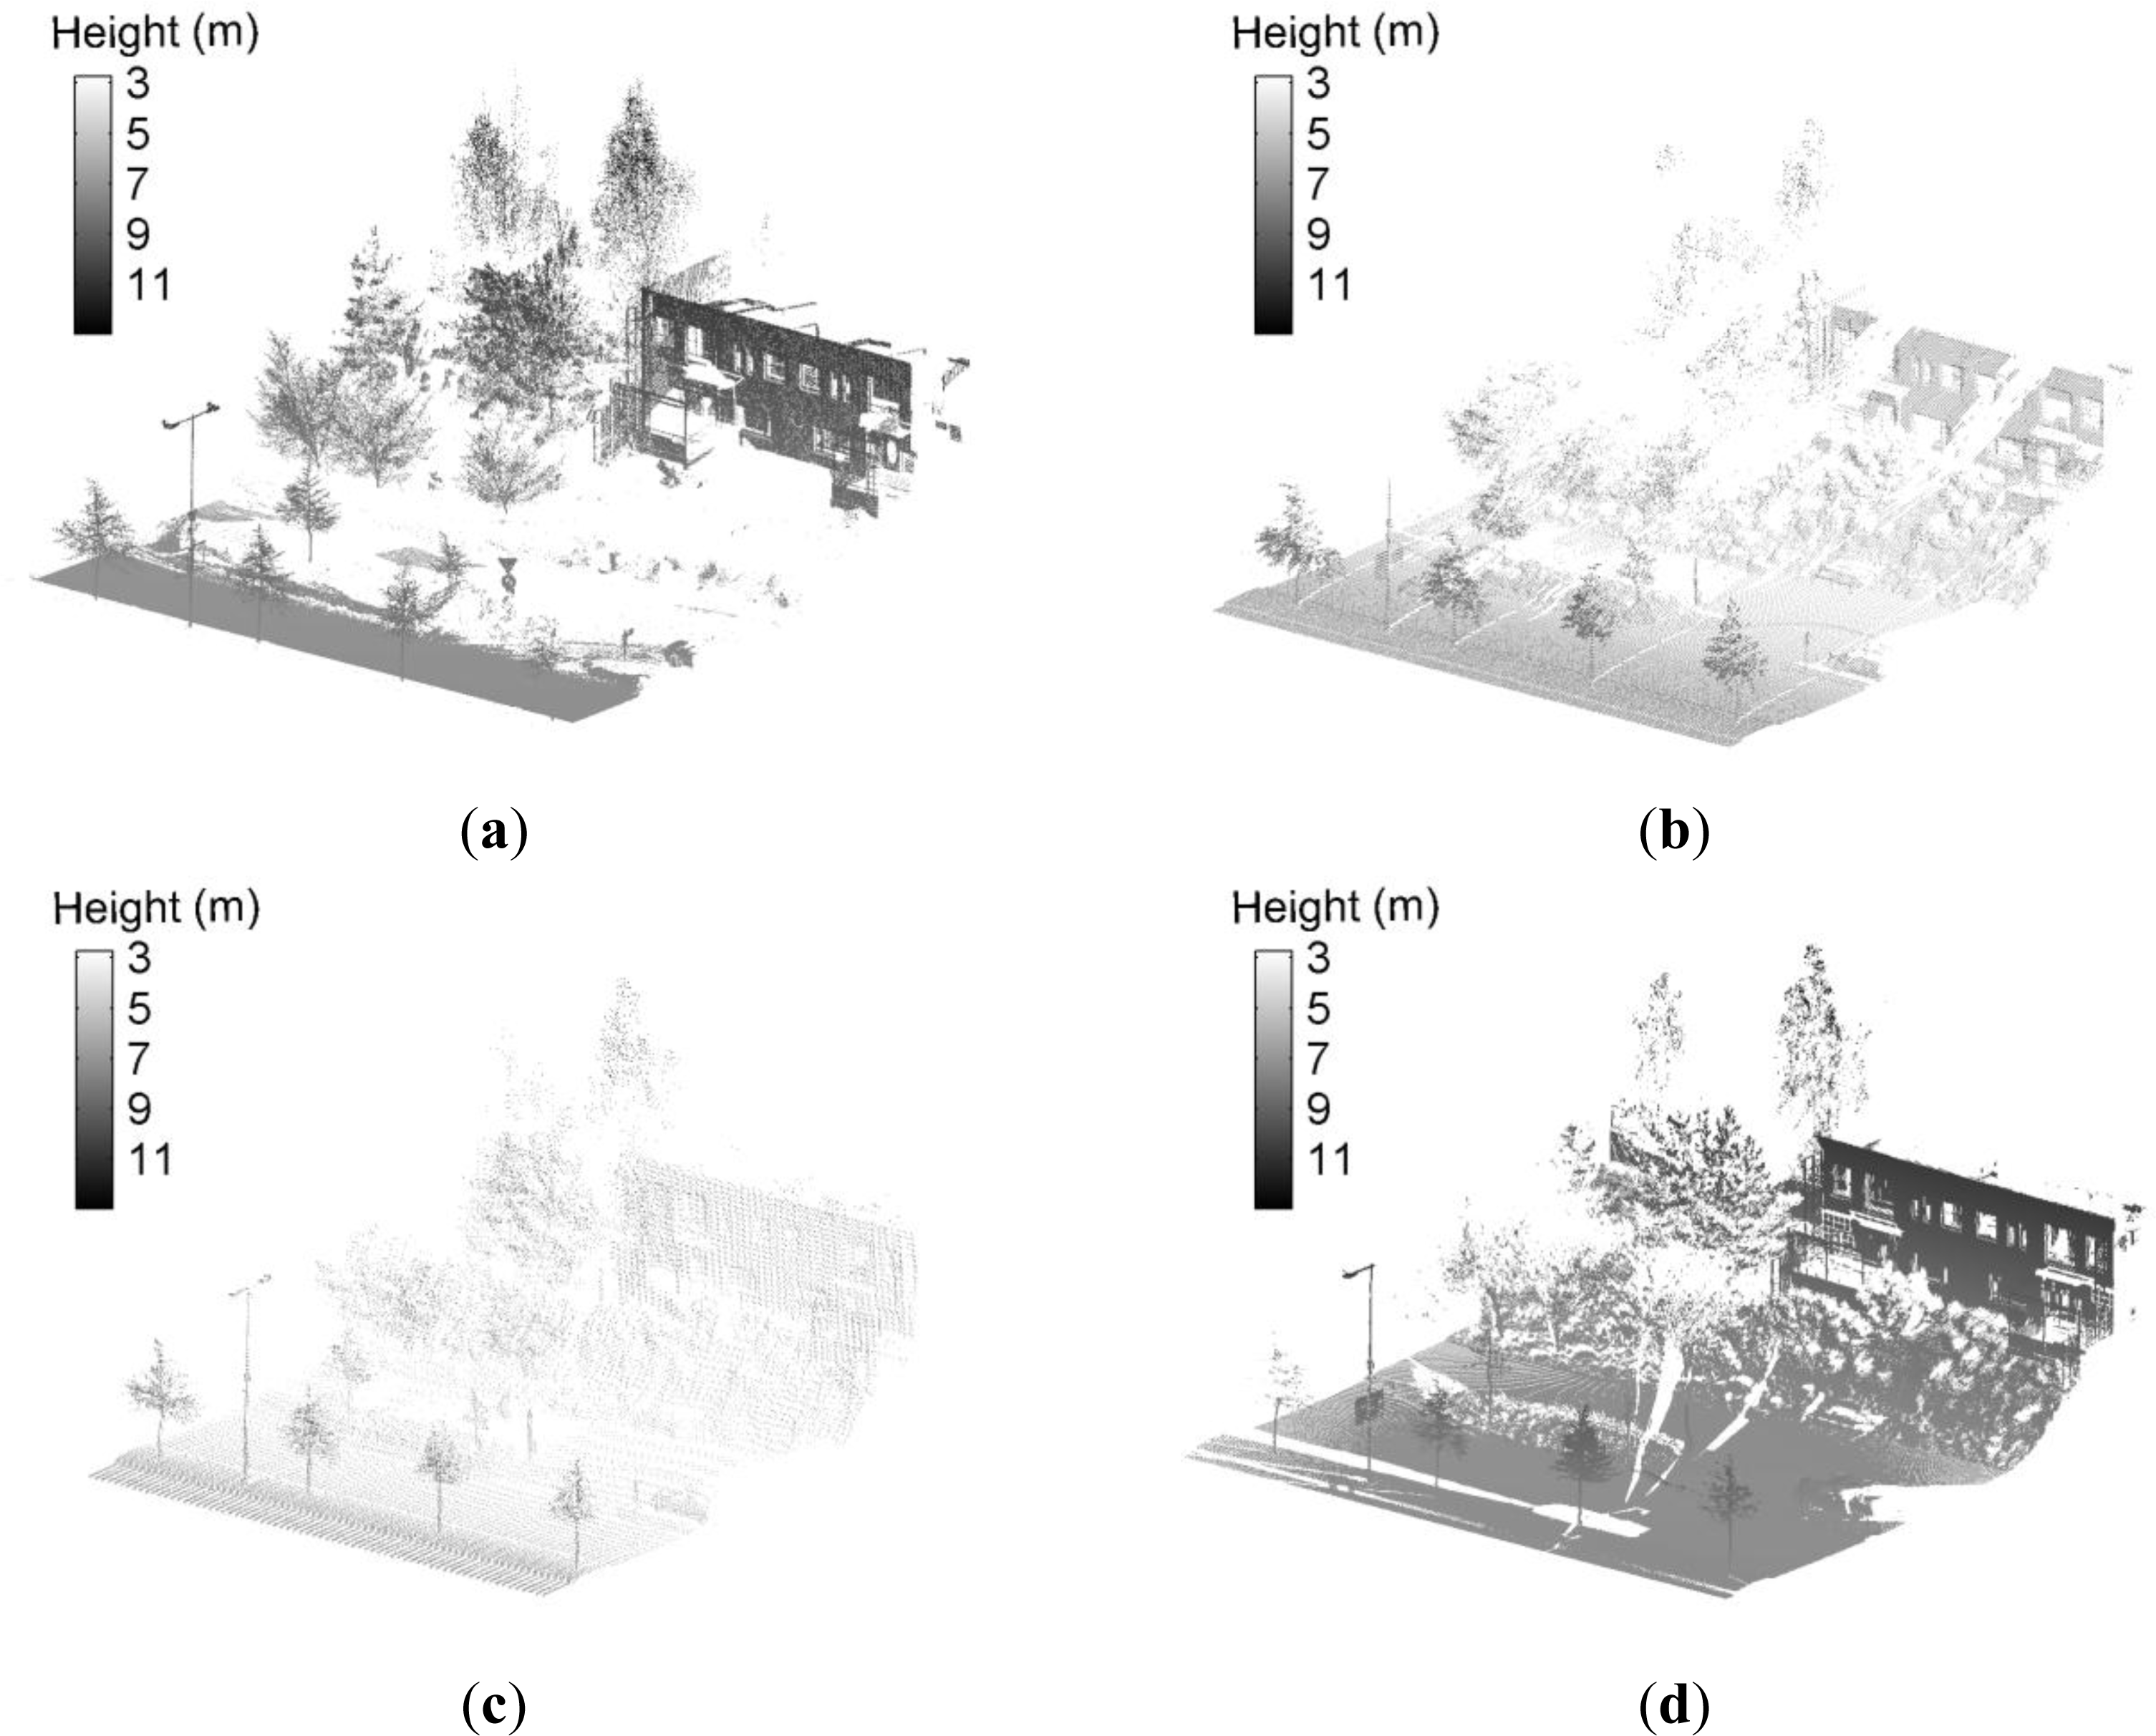
2.2. Test Site and Data Collection
2.3. Object Segmentation
3. Methodologies
3.1. Performance Analysis Plan
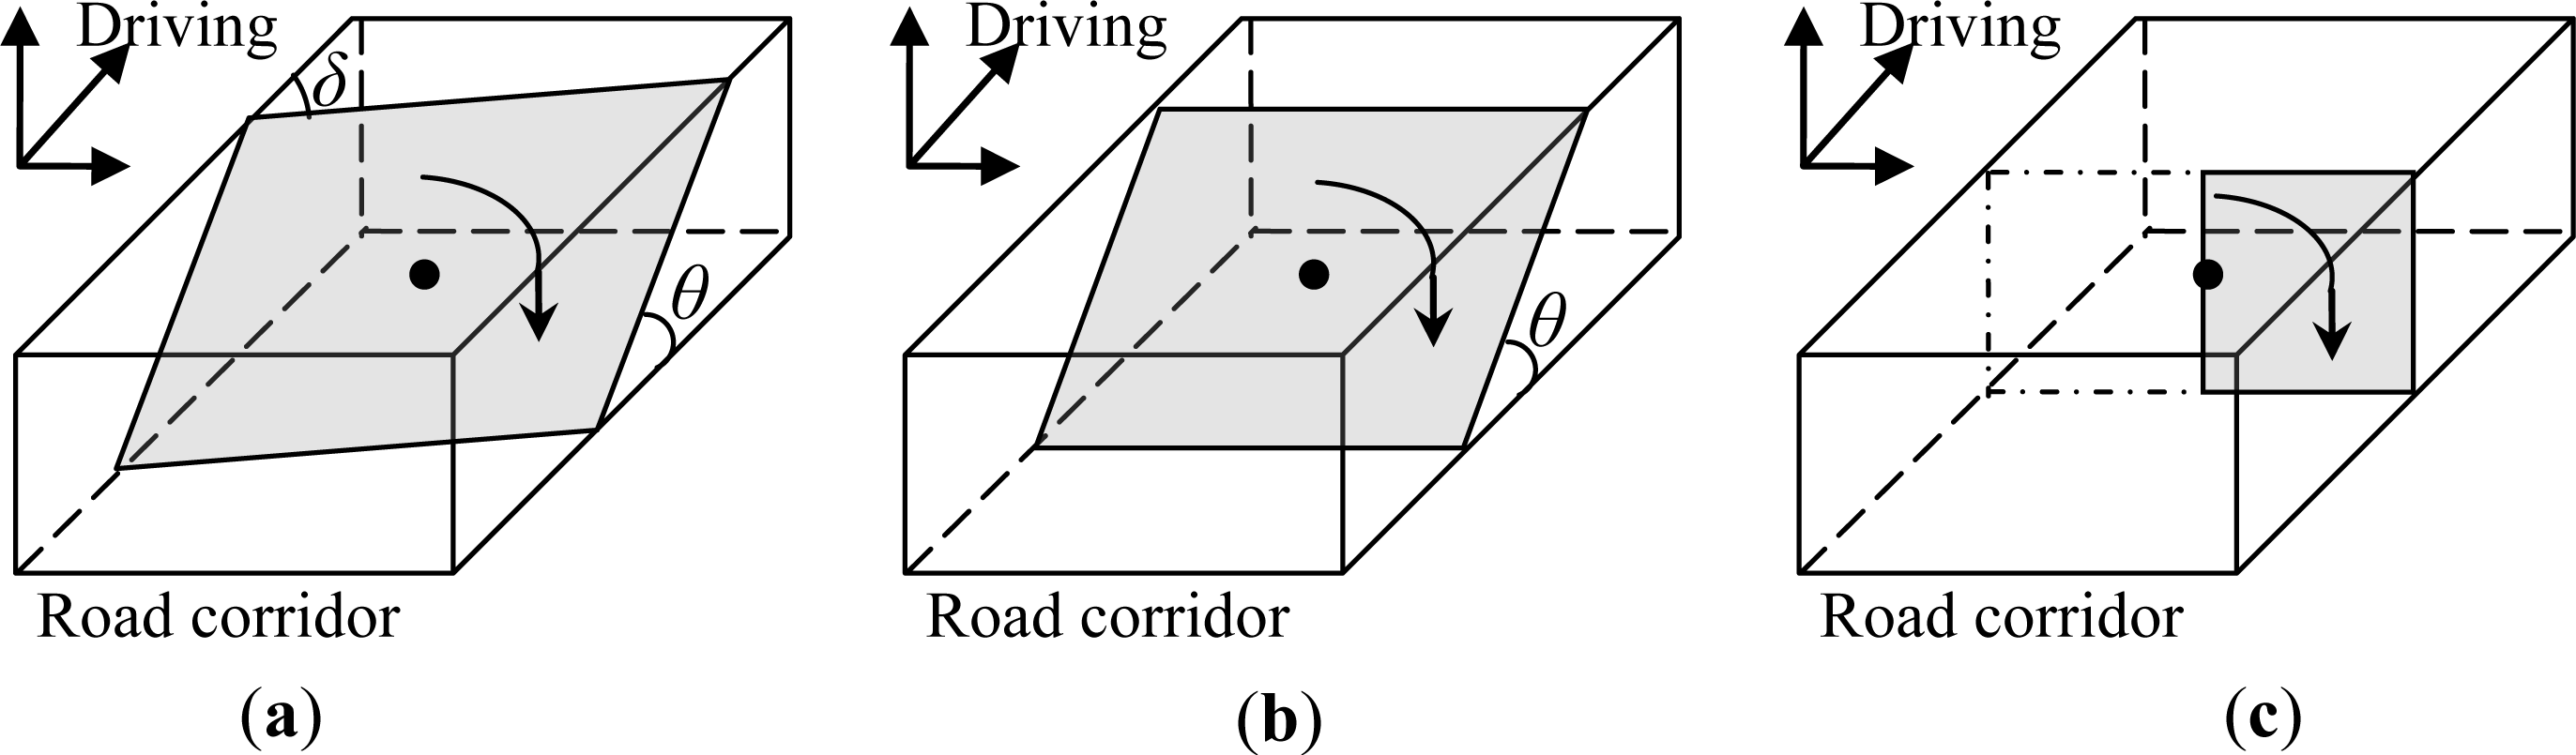
3.2. Scanning Geometry Analysis
3.3. Analysis of Sampling Density Impact
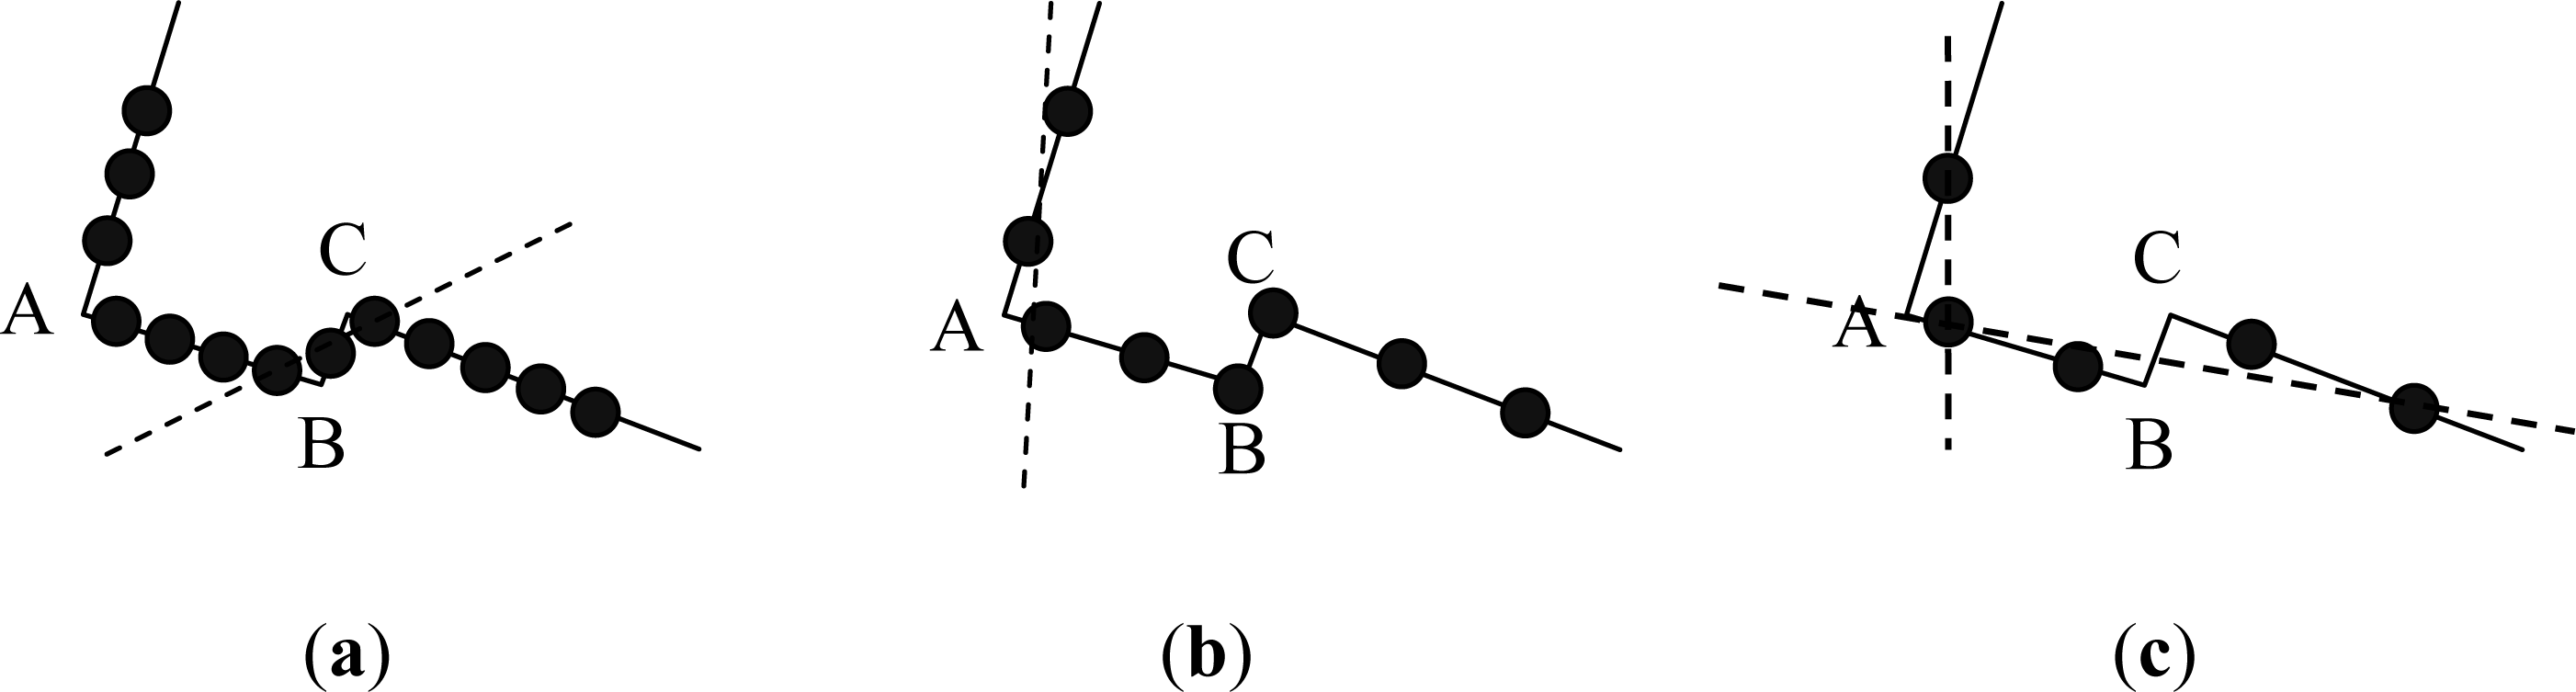
3.4. Geometrical Modeling of Targets
3.5. Performance Comparison
4. Results
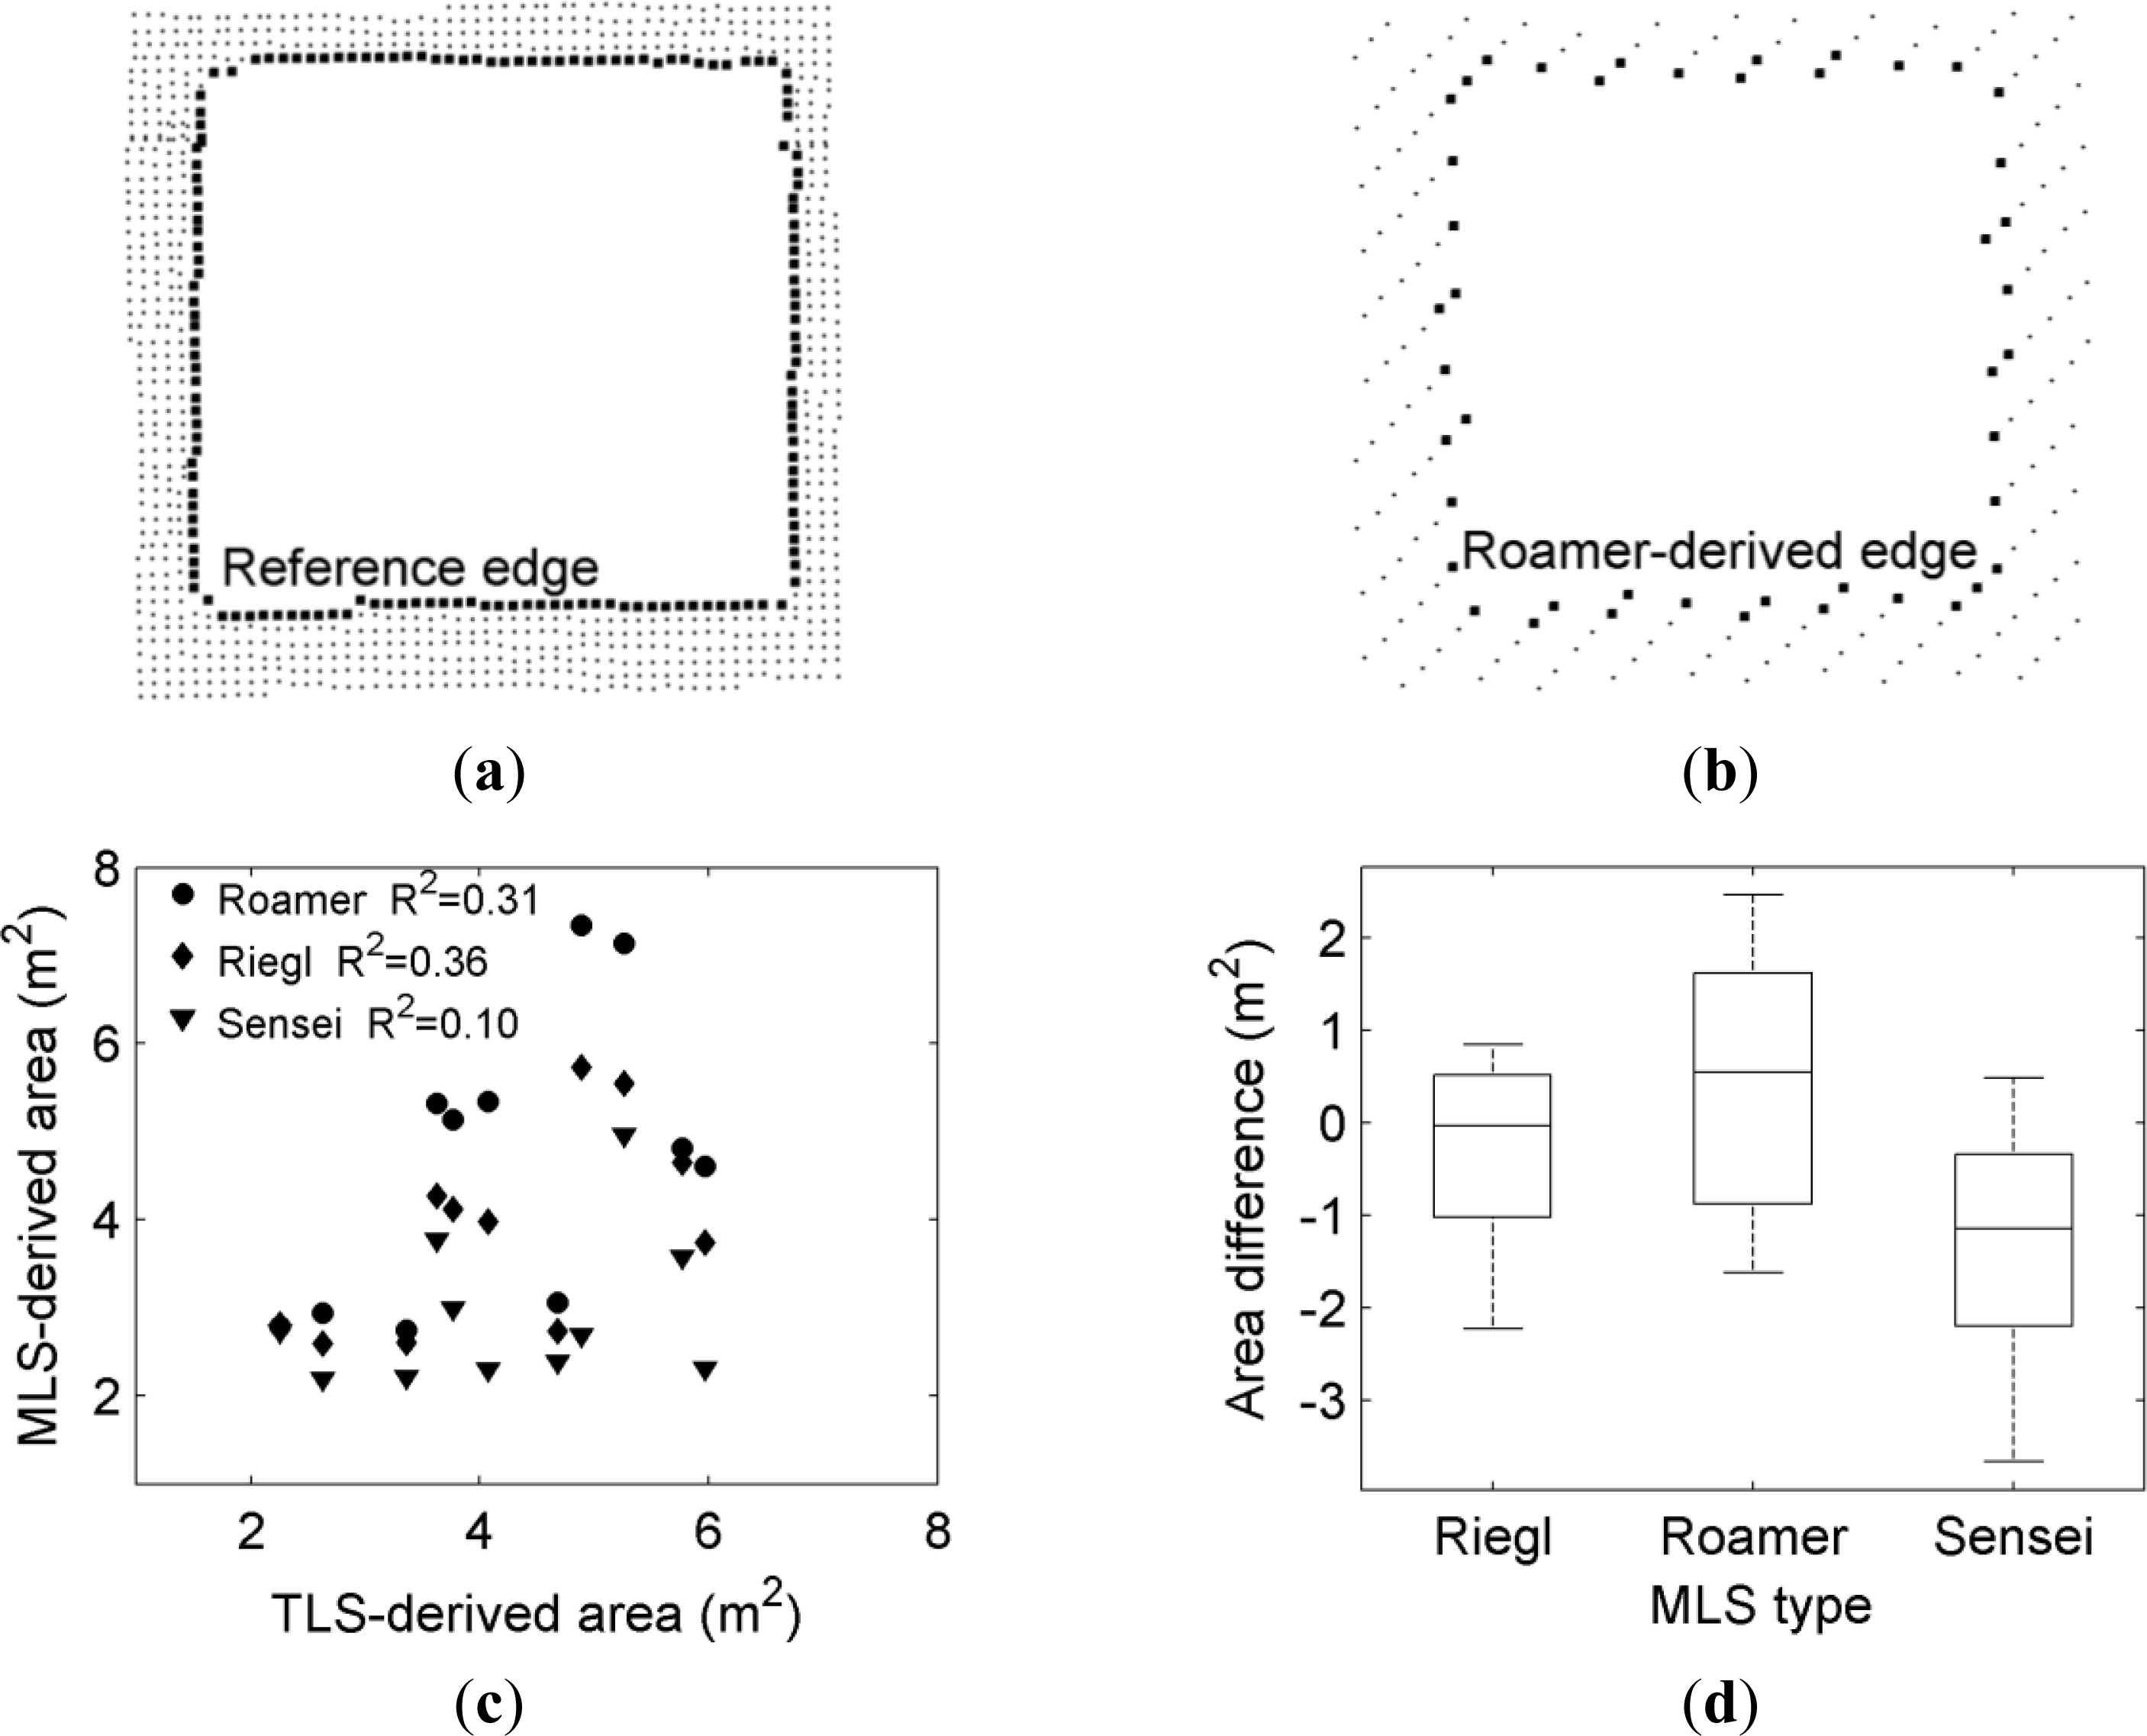
4.1. Window Area
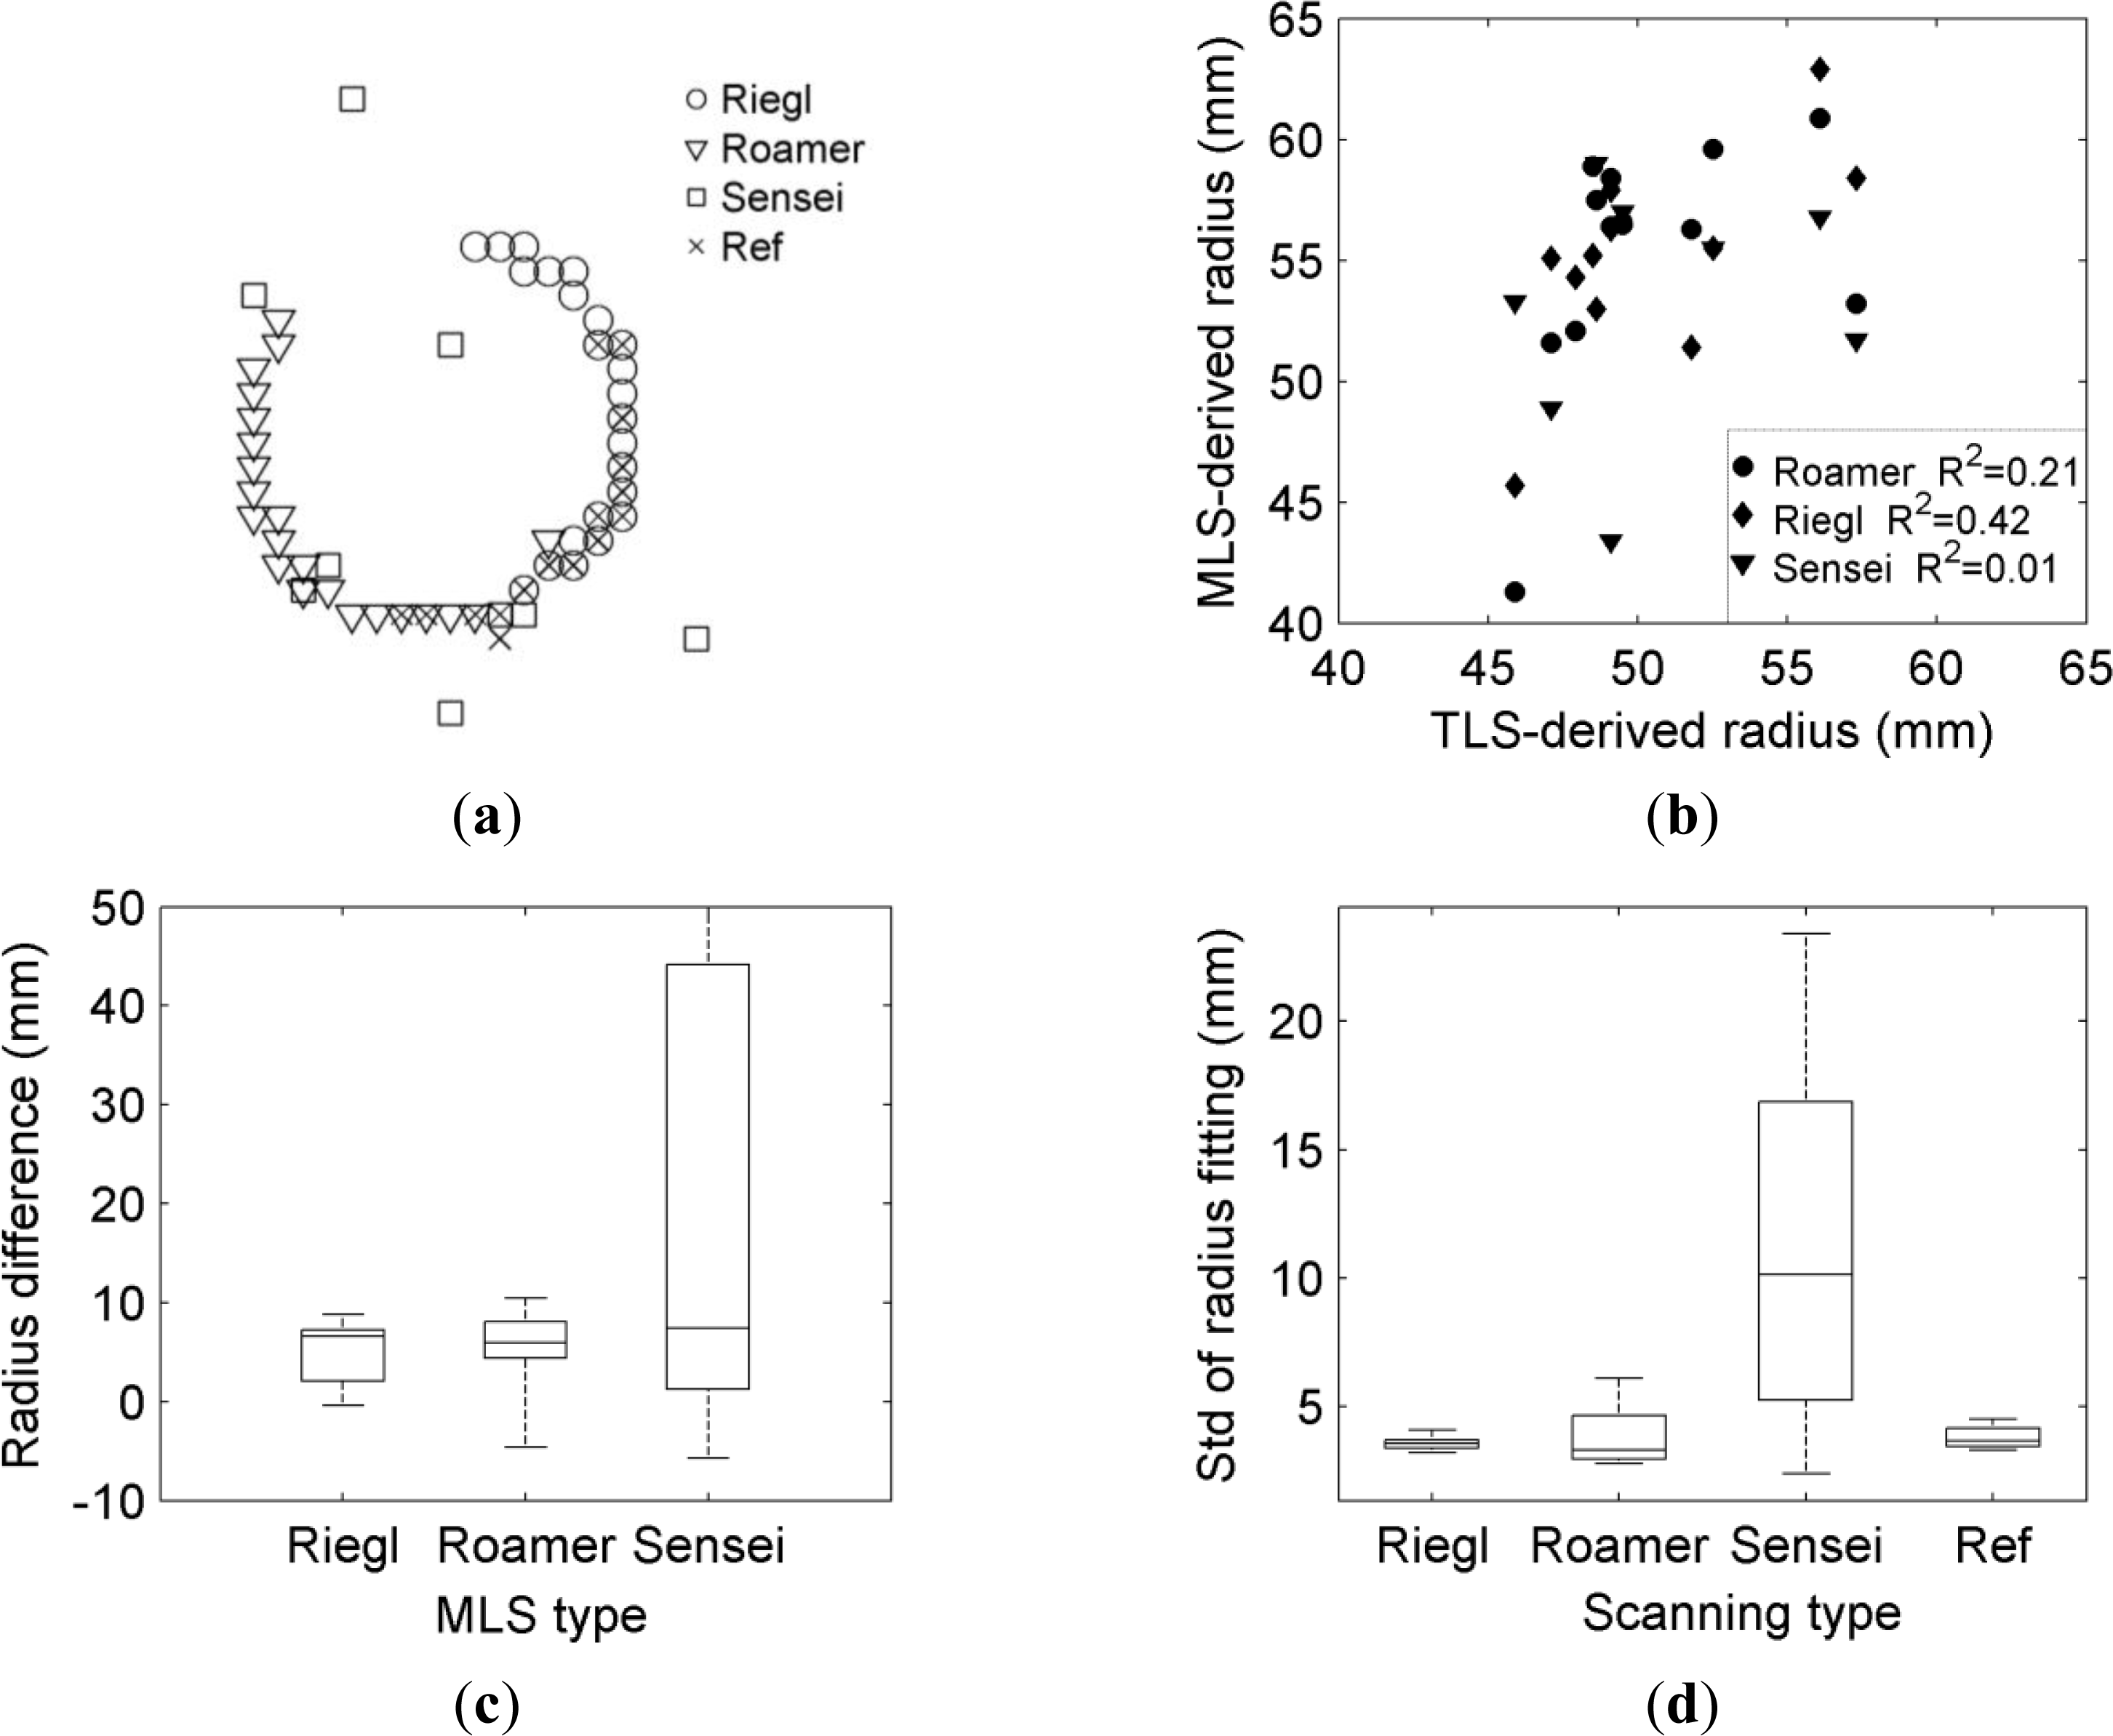
4.2. Pole Radius
5. Discussions and Suggestions
6. Conclusion
Acknowledgments
Conflict of Interest
References
- Graham, L. Mobile mapping systems overview. Photogramm. Eng. Remote Sensing 2010, 76, 222–228. [Google Scholar]
- Petrie, G. An introduction to the technology mobile mapping systems. Geoinformatics 2010, 13, 32–43. [Google Scholar]
- Zhao, H.; Shibasaki, R. A vehicle-borne urban 3-D acquisition system using single-row laser range scanners. IEEE Trans. Syst. Man Cybern. B 2003, 33, 658–666. [Google Scholar]
- Kukko, A.; Andrei, C.O.; Salminen, V.M.; Kaartinen, H.; Chen, Y.; Rönnholm, P.; Hyyppä, H.; Hyyppä, J.; Chen, R.; Haggrén, H.; et al. Road environment mapping system of the Finnish Geodetic Institute—FGI Roamer. Int. Arch. Photogramm. Remote Sens 2007, 36, 241–247. [Google Scholar]
- Jaakkola, A.; Hyyppä, J.; Kukko, A.; Yu, X.; Kaartinen, H.; Lehtomäki, M.; Lin, Y. A low-cost multi-sensoral mobile mapping system and its feasibility for tree measurements. ISPRS J. Photogramm 2010, 65, 514–522. [Google Scholar]
- Ussyshkin, V.; Boba, M. Performance Characterization of a Mobile LiDAR System: Expected and Unexpected Variables. Proceedings of ASPRS Annual Conference, Portland, OR, USA, 28 April–2 May 2008.
- Kremer, J.; Hunter, G. Performance of the StreetMapper mobile LiDAR mapping system in “real world” projects. Photogramm. Week 2007, 7, 215–225. [Google Scholar]
- Barber, D.; Mills, J.; Voysey, S.S. Geometric validation of a groud-based mobile laser scanning system. ISPRS J. Photogramm 2008, 63, 128–141. [Google Scholar]
- Haala, N.; Peter, M.; Kremer, J.; Hunter, G. Mobile LiDAR mapping for 3D point cloud collections in urban areas—A performance test. Int. Arch. Photogramm. Remote Sens. Spat. Inform. Sci 2008, 37, 1119–1124. [Google Scholar]
- Rutzinger, M.; Elberink, S.O.; Pu, S.; Vosselman, G. Automatic Extraction of Vertical Walls from Mobile and Airborne Laser Scanning Data. Proceedings of ISPRS Laser Scanning, Paris, France, 1–2 September 2009; pp. 361–372.
- Cahalane, C.; McElhinney, C.P.; McCarthy, T. Mobile Mapping System Performance—An Analysis of the Effect of Laser Scanner Configuration and Vehicle Velocity on Scan Profiles. Proceedings of European LiDAR Mapping Forum, The Hague, The Netherlands, 30 Novermber–1 December 2010.
- Glennie, C. Calibration and kinematic analysis of the Velodyne HDL-64E S2 Lidar sensor. Photogramm. Eng. Remote Sensing 2012, 78, 339–347. [Google Scholar]
- Glennie, C.; Lichti, D.D. Static calibration and analysis of the Velodyne HDL-64E S2 for high accuracy mobile scanning. Remote Sens 2010, 2, 1610–1624. [Google Scholar]
- Glennie, C.; Lichti, D.D. Temporal stability of the Velodyne HDL-64E S2 for high accuracy scanning applications. Remote Sens 2011, 3, 539–553. [Google Scholar]
- Yoo, H.J.; Goulette, F.; Senpauroca, J.; Lepere, G. Simulation based comparative analysis for the design of laser terrestrial mobile mapping systems. Boletim De Ciencias Geodesicas 2009, 15, 839–854. [Google Scholar]
- Glennie, C. Kinematic terrestrial light-detection and ranging system for scanning. Transp. Res. Rec 2009, 2105, 135–141. [Google Scholar]
- Wang, J.; Jin, F.X. Precision estimation of mobile laser scanning system. Surv. Rev 2010, 42, 270–278. [Google Scholar]
- Grejner-Brzezinska, D.A.; Li, R.; Haala, N.; Toth, C. From mobile mapping to telegeoinformatics Paradigm shift in geospatial data acquisition, processing, and management. Photogramm. Eng. Remote Sensing 2004, 70, 197–210. [Google Scholar]
- Zhao, H.; Shibasaki, R. Updating digital geographic database using vehicle-borne laser scanners and line camera. Photogramm. Eng. Remote Sensing 2005, 71, 415–424. [Google Scholar]
- Lin, Y.; Jaakkola, A.; Hyyppä, J.; Kaartinen, H. From TLS to VLS: Biomass estimation at individual tree level. Remote Sens 2010, 2, 1864–1879. [Google Scholar]
- Lin, Y.; Hyyppä, J.; Jaakkola, A. Combining mobile and static terrestrial laser scanners for investigation of individual crown attributes during foliation. Can. J. Remote Sens 2011, 37, 359–375. [Google Scholar]
- Rutzinger, M.; Pratihast, A.K.; Elberink, S.O.; Vosselman, G. Tree modelling from mobile laser scanning data-sets. Photogramm. Rec 2011, 26, 361–372. [Google Scholar]
- Lin, Y.; Hyyppä, J.; Jaakkola, A.; Holopainen, M. Characterization of mobile LiDAR data collected with multiple echoes per pulse from crowns during foliation. Scand. J. Forest Res 2012, 8, 298–311. [Google Scholar]
- Lin, Y.; Hyyppä, J.; Jaakkola, A.; Yu, X. Three-level frame and RD-schematic algorithm for automatic recognition of individual trees from MLS point clouds. Int. J. Remote Sens 2012, 33, 1701–1716. [Google Scholar]
- Lin, Y.; Hyyppä, J. Multiecho-recording mobile laser scanning for enhancing individual crown reconstruction. IEEE Trans. Geosci. Remote Sens 2012, 50, 4323–4332. [Google Scholar]
- Kodagoda, K.R.S.; Wijesoma, W.S.; Balasuriya, A.P. CuTE: Curb tracking and estimation. IEEE Trans. Control Syst. Techn 2006, 14, 951–957. [Google Scholar]
- Jaakkola, A.; Hyyppä, J.; Hyyppä, H.; Kukko, A. Retrieval algorithms for road surface modelling using laser-based mobile mapping. Sensors 2008, 8, 5238–5249. [Google Scholar]
- Brenner, C. Vehicle localization using landmarks obtained by a LiDAR mobile mapping system. Int. Arch. Photogramm. Remote Sens 2010, 38, 139–144. [Google Scholar]
- Yang, B.S.; Wei, Z.; Li, Q.Q.; Li, J. Automated extraction of street-scene objects from mobile Lidar point clouds. Int. J. Remote Sens 2012, 33, 5839–5861. [Google Scholar]
- Yang, B.S.; Fang, L.N.; Li, Q.Q.; Li, J. Automated extraction of road markings from mobile Lidar point clouds. Photogramm. Eng. Remote Sensing 2012, 78, 331–338. [Google Scholar]
- Kerstem, T.P.; Buyuksalih, G.; Baz, I.; Jacobsen, K. Documentation of Istanbul historic peninsula by kinematic terrestrial laser scanning. Photogramm. Rec 2009, 24, 122–138. [Google Scholar]
- Schwarzbach, F. Suitability of different LiDAR data sets for 3D mapping of the road environment. Photogramm. Eng. Remote Sensing 2009, 75, 117–127. [Google Scholar]
- Lin, Y.; Hyyppä, J. Geometry and intensity based culvert detection in mobile laser scanning point clouds. J. Appl. Remote Sens. 2010, 4. [Google Scholar] [CrossRef]
- Lehtomäki, M.; Jaakkola, A.; Hyyppä, J.; Kukko, A.; Kaartinen, H. Detection of vertical pole-like objects in a road environment using vehicle-based laser scanning data. Remote Sens 2010, 2, 331–336. [Google Scholar]
- Yang, B.; Fang, L.; Li, J. Semi-automated extraction and delineation of 3D roads of street scene from mobile laser scanning point clouds. ISPRS J. Photogramm 2013, 79, 80–93. [Google Scholar]
- Yang, B.; Wei, Z.; Li, Q.; Li, J. Semi-automated building façade footprint extraction from mobile Lidar point clouds. IEEE Geosci. Remote Sens. Lett 2013, 10, 766–770. [Google Scholar]
- Pu, S.; Rutzinger, M.; Vosselman, G.; Elberink, S.O. Recognizing basic structures from mobile laser scanning data for road inventory studies. ISPRS J. Photogramm 2011, 66, S28–S39. [Google Scholar]
- Lato, M.; Hutchinson, J.; Diederichs, M.; Ball, D.; Harrap, R. Engineering monitoring of rockfall hazards along transportation corridors: Using mobile terrestrial LiDAR. Nat. Hazards Earth Syst. Sci 2009, 9, 935–946. [Google Scholar]
- Ussyshkin, V. Mobile Laser Scanning Technology for Surveying Applications: From Data Collection to End-Products. Proceedings of FIG Working Group, Eilat, Israel, 3–8 May 2009.
- Kaartinen, H.; Hyyppä, J.; Kukko, A.; Jaakkola, A.; Hyyppä, H. Benchmarking the performance of mobile laser scanning systems using a permanent test field. Sensors 2012, 12, 12814–12835. [Google Scholar]
- Kukko, A.; Hyyppä, J. Small-footprint laser scanning simulator for system validation, error assessment and algorithm development. Photogramm. Eng. Remote Sensing 2009, 75, 1177–1189. [Google Scholar]
- Kukko, A.; Kaartinen, H.; Hyyppä, J.; Chen, Y. Multiplatform mobile laser scanning: Usability and performance. Sensors 2012, 12, 11712–11733. [Google Scholar]
- Hyyppä, J.; Jaakkola, A.; Hyyppä, H.; Kaartinen, H.; Kukko, A.; Holopainen, M.; Zhu, L.; Vastaranta, M.; Kaasalainen, S.; Krooks, A.; et al. Map Updating and Change Detection Using Vehicle-Based Laser Scanning. Proceedings of Joint Urban Remote Sensing Event (JURSE’09), Shanghai, China, 20–22 May 2009.
- Silván-Cárdenas, J.L.; Wang, L. A multi-resolution approach for filtering LiDAR altimetry data. ISPRS J. Photogramm 2006, 61, 11–22. [Google Scholar]
- Edelsbrunner, H.; Mücke, E. Three-dimensional alpha shapes. ACM Trans. Graph 1994, 13, 43–72. [Google Scholar]
- Edelsbrunner, H.; Kirkpatrick, D.G.; Seidel, R. On the shape of a set of points in the plane. IEEE Trans. Inform. Theory 1983, 29, 551–559. [Google Scholar]
- Fukunaga, K. Introduction to Statistical Pattern Recognition; Academic Press: San Diego, CA, USA, 1990. [Google Scholar]
- Björck, A. Numerical Methods for Least Squares Problems; SIAM: Philadelphia, PA, USA, 1996. [Google Scholar]


| Riegl | Roamer | Sensei | |
|---|---|---|---|
| Min range (m) | 1.5 | 0.6 | 0.3 |
| Max range (m) | 200 | 76 | 100 |
| Range for 10% reflectance (m) | 75 | 25 | 50 |
| Max sampling rate (points/second) | 600,000 | 120,000 | 38,000 |
| Ranging accuracy for 10% reflectance (cm) | 1 | 2 | 4 |
| Ground density at a same place (points/m2) | 4,000 | 500 | 30 |
© 2013 by the authors; licensee MDPI, Basel, Switzerland This article is an open access article distributed under the terms and conditions of the Creative Commons Attribution license (http://creativecommons.org/licenses/by/3.0/).
Share and Cite
Lin, Y.; Hyyppä, J.; Kaartinen, H.; Kukko, A. Performance Analysis of Mobile Laser Scanning Systems in Target Representation. Remote Sens. 2013, 5, 3140-3155. https://doi.org/10.3390/rs5073140
Lin Y, Hyyppä J, Kaartinen H, Kukko A. Performance Analysis of Mobile Laser Scanning Systems in Target Representation. Remote Sensing. 2013; 5(7):3140-3155. https://doi.org/10.3390/rs5073140
Chicago/Turabian StyleLin, Yi, Juha Hyyppä, Harri Kaartinen, and Antero Kukko. 2013. "Performance Analysis of Mobile Laser Scanning Systems in Target Representation" Remote Sensing 5, no. 7: 3140-3155. https://doi.org/10.3390/rs5073140