1. Introduction
Satellite remote sensing with repeated coverage is the most efficient method to monitor and study ocean environment, marine productivity, and oil spills/pollution. The ability of meteorological satellite remote sensing for monitoring clouds, fronts, and typhoons has been amply demonstrated. One of the first and most important applications of satellite observations of the cyclone is the estimation of associated intensity of cyclones with the temperature of the eye, cloud organization, and surrounding environment. For example, meteorological satellite image shows changes in cloud organization, the inner core of the cyclone, and rain bands. The synthetic aperture radar (SAR) images of wind-related ocean features, such as surface waves, rain cells, tropical cyclones, internal lee waves, and katabatic wind have been studied recently [
1]. The combined use of infrared, optical sensors and SAR can provide frequent high-resolution coverage of the typhoon evolution.
The western North Pacific is one of the areas where tropical cyclones strike most frequently throughout the world. Typhoons, in particular, wreak devastation along coastal areas through powerful winds and torrential rain and play a key role in influencing the upper layer marine ecosystem [
2], churning the ocean surface and causing the upper ocean to respond along the storm path [
3]. Because the land and sea surface environments heavily influence human lives, tracking and predicting the typhoon’s operation by extracting sea-surface information is crucial. With repeated coverage, satellite remote sensing has provided efficient monitoring and study of tropical cyclones [
4–
8]. Limited to providing visible (VIS) and infrared (IR) images, the geostationary satellites can only frequently provide information on the top of clouds from per hour to per 15 min in general, except through special requests. By contrast, microwave sensors can penetrate clouds, thus improving the detection of the internal cyclone structure. Microwave radiometers and scatterometers are limited to observing localized phenomena using lower spatial resolution (in average of 25 km resolution), however SAR can penetrate clouds to observe sea surface roughness with high resolution (for ScanSAR Wide mode with 100 m resolution) [
9]. In recent years, SAR has been used as a powerful tool to provide a new vision of the atmospheric phenomena, such as typhoons and convective cells, imprinted on the ocean surface [
10–
13].
Despite the high spatial resolution of SAR image, successively observing a typhoon is difficult because of the poor temporal resolution of SAR. The “eye” of a typhoon is a zone of weak winds that exists in the center of a swirling vortex. The weather is normally calm and free of clouds inside the eye. The eye zone, which is normally circular in shape, is the warmest at the upper cloud levels. Typically, it may range in size from 8 km to 200 km in diameter [
14]. The conventional definition of a typhoon eye is the cloudless area (VIS imagery) or the warmer area (IR imagery), where it is observed at the height of the tropopause. SAR images provide visual evidence of precipitation, boundary layer rolls, and typhoon eyes within these typhoons [
15]. The vertical wind shear, which acts to tilt the typhoon eye’s position, causes the upper and lower eyes’ location to be uncoordinated [
16–
18]. Thus, tracking the calm areas on the sea surface using SAR imagery may be more effective in detecting the typhoon eye on the ocean surface.
Conventionally, the typhoon eye observation is from weather satellite using IR or VIS wavelengths at cloud height about 13 km. However, because of the vertical wind shear tilt, the location of typhoon eye on the ocean surface may be quite different from that on the top of clouds. In general, the impact of typhoon on coastal communities is either near the land or on the ocean surface. Owing to its warm-core structure, the tropical cyclone’s strongest winds are, in fact, located in the lowermost troposphere, typically near the top of a shallow boundary layer 500–1,000 m deep. Therefore to extract typhoon information near the ocean surface is very important for the typhoon tracking operation and forecast.
Microwave sensors have improved the detection of internal cyclone structures, such as the location of the eye, because those wavelengths are sensed through high clouds that sometimes obscure the eye in IR and VIS images. However, the passive microwave sensors do not have enough high-resolution to estimate the size and structure of the typhoon eye area. Therefore, tracking the calm areas on the ocean surface from high-resolution SAR imagery (with 25–50 m resolution) or the warmest areas on the cloud top from thermal IR imagery (with 1–4 km resolution) may have a better detection and clear description of a typhoon’s eye. In addition, SAR has the day-and-night all weather capability to “see” through the clouds for the signature and footprint of typhoon on the ocean surface. The objective of this study is to compare the results observed using Envisat SAR imagery of typhoon eyes located near the ocean surface with those using IR imagery of the cloud top, especially from the multi-functional transport satellite (MTSAT) and Feng Yun (FY)-2. A recent study has reported that the horizontal distances between typhoon eyes on the cloud top from MTSAT, and on the ocean surface using Radatsat, are significantly large, ranging from 9 km to 22 km [
19] based on seven typhoon cases. This implies that the vertical wind shear profile might be much more complex than generally expected. In this continued study, the Envisat ASAR data have been used to compare with the MTSAT and FY-2 IR data for three completely different typhoon cases. For the purpose of demonstration,
Figure 1 shows a Radarsat SAR Image of Typhoon Saomai landed along the east coast of China on 10 August 2006 at 10:02 UTC with the eye right on the coastline. Typhoon Saomai had become a Category 5-equivalent super typhoon by 9 August and it made landfall in Zhejiang, China on 10 August, with maximum sustained winds of 59 m/s. The red and green dots represent the typhoon eye centers estimated from MTSAT and FY-2, respectively. As expected, the typhoon eye on the cloud top from MTSAT and FY-2 IR data was already inland while the eye on the ocean surface from SAR image was dragging behind on the coastline due to the blocking effect of island and land. Consequently, this study demonstrates that SAR could be a potential tool in monitoring typhoons over the ocean surface.
2. Multiple Sensors Data
In this study, all typhoon images collected by Radarsat and Envisat in conjunction with MTSAT and FY-2 with relatively strong typhoon eyes in the western Pacific Ocean from 2003 to 2011 have been examined. In addition, JTWC, CMA, and JMA’s archived best track data have been used to check the consistency of typhoon’s locations. Also, the Moderate Resolution Imaging Spectrometer (MODIS) has been viewing the entire Earth’s surface every 1 to 2 days, and its image, with 1.1 km spatial resolution collected during typhoon passage, has been used for comparison with SAR and IR data. The detailed image processing method is outlined in the next section for the case studies of typhoon eyes.
2.1. Infrared Images
The Multi-functional Transport Satellite (MTSAT) series fulfills a meteorological function for JMA. MTSAT is a geostationary meteorological satellite and provides imagery for the northern hemisphere. Notably, its coverage includes East Asia and the Western Pacific area. The orbit of MTSAT-1R satellite is 35,800 km above the equator at 140 degrees East longitude. The MTSAT-1R observation is available every hour in normal condition and half hour during severe weather. The MTSAT-1R meteorological sensor contains one visible and four infrared channels. The wavelength of visible channel is 0.55–0.90 μm and its resolution is 1 km at the sub-satellite point. The infrared channels include IR1 (10.3–11.3 μm), IR2 (11.5–12.5 μm), IR3 (6.5–7.0 μm), and IR4 (3.5–4.0 μm) and its resolution is 4 km. IR imagery can be examined day and night and indicates the severity of typhoons, such as revealing cold, high clouds that suggest severe convection [
9]. In this study, IR1 images were used for analyzing typhoon eyes at the cloud top.
China began its geostationary meteorological satellite Feng Yun-2 (FY-2) in 1980 [
20]. FY-n is the name of meteorological satellite series, including polar-orbiting meteorological satellites with odd numbers n and geostationary with even numbers n. FY-1A and FY-1B are experimental satellites carrying 5-channel Multichannel Visible Infrared Scanning Radiometers (MVISR-1). FY-1C and FY-1D are operational satellites carrying 10-channel Multichannel Visible Infrared Scanning Radiometers (MVISR-2) similar to channels of NOAA/AVHRR (Advanced Very High Resolution Radiometer) and CZCS (Coastal Zone Color Scanner).
FY-2A and FY-2B are also experimental satellites; however, they are operated for over eight and five years, respectively, and exceed the two-year design life. The 3-channel Visible and Infrared Spin Scan Radiometers (VISSR-1) are mounted on FY-2A and FY-2B. FY-2C and FY-2D are operational satellites carrying VISSR-2. The number of spectral channels of VISSR-2 is increased to five, and the infrared wave window 10.5–12.5 μm is split into two channels for the retrieval of Sea Surface Temperature (SST). FY-2E is a substitute satellite for FY-2C, carrying the VISSR-2. The FY-2 satellites are positioned at 105 degrees East longitude, and its data used in this study are operational products similar to MTSAT data with the resolution of 1 km for VIS channel and 4 km for IR channel.
2.2. SAR Images
Currently or recently existing SAR satellites orbiting in space are CSA’s (Canadian Space Agency) Radarsat-1 and Radarsat-2 (with additional beam and polarization capabilities), the ESA’s (European Space Agency) ERS-2 and Envisat, PALSAR (Japanese Aerospace Exploration Agency), TerraSAR-X (Germany’s Aerospace Research Center and Space Agency/DLR), CRS (Chinese Remote Sensing Satellites) and Cosmo Sky-Med (Italian Space Agency). Envisat launched in March 2002 is a C-Band SAR and its mission ended recently in April 2012. Envisat Advanced SAR (ASAR) images were used to examine the typhoons in the western North Pacific from 2005 to 2011. The ASAR product used in this study is a geo-referenced ground coordinate multi-look image and has a pixel size of 150 m × 150 m with nominal image coverage of 400 km.
In order to continue the Sino-European cooperation on the coastal zone surveillance, particularly to exploit ESA and China satellite data, a project of microwave remote sensing of China Seas and coastal zone, and a continuous project of monitoring marine environmental safety and protection have been proposed. The objective of this Dragon programme is to measure major marine-meteo parameters such as sea surface wind, wave and salinity, and to maintain marine environmental safety in the China and European seas by monitoring coastal algae blooms with the space borne microwave radar or SAR. All Envisat ASAR images with wide swath mode are provided by ESA for this typhoon eye observation study. Because SAR has the capability to penetrate the clouds, it provides a new method to study typhoons with high-resolution observations near the ocean surface.
3. Approach
The eyewall of a typhoon is a zone of super gradient wind and appears extremely bright in contrast to the eye zone of a typhoon in SAR images. Therefore, the typhoon eye can be delineated from a darker area surrounded by the eyewall using wavelet analysis [
21,
22]. Wavelet transform is analogous to the Fourier transform but is more localized both in frequency and time. A two dimensional wavelet transform is a highly efficient band-pass data filter, which can be used to separate various scales of processes [
23]. For effective identification and tracking of common features in a chosen image, such as typhoon eyes, a two dimensional Mexican hat wavelet transform is applied to extract features with corresponding spatial scales from the image and to filter out noise [
24,
25].
The Mexican hat wavelet is the second derivative of a Gaussian function, and the resulting transform is the Laplacian of a Gaussian smoothed function. Thus, zeros correspond to the inflection points of the original function. The contours of zero crossing indicate the edges in the pattern of the input function. To perform the wavelet transformation, first a suitable length scale value is chosen, which corresponds to the horizontal scale of the Gaussian function. Then an edge detection procedure is carried out to determine the pixel locations of significant differentials so that the feature of interest can be delineated from the background. However, in a noisy image, there is a tradeoff between (i) missing valid edges and (ii) over-detection: that is, detecting false edges induced by noise. Several thresholds are evaluated via trial and error and a final choice is selected based on observations and experiences [
26].
A typhoon eye is a quasi-circular zone of relatively weak winds that exists in the center of the swirling vortex of a typhoon. For the SAR imaging mechanism, a weak wind area with less surface roughness has relatively low radar backscatter compared to the adjacent eyewall. Thus, the typhoon eye can be delineated in a SAR image as the darker (less rough) area with relatively low radar backscatter, and its location pinpointed by using the wavelet analysis. A typhoon eye has also the warmest temperatures at the upper cloud levels. So, in an IR image, the warm area also can be delineated using wavelet analysis, and its position may be regarded as the typhoon’s eye observed in the upper cloud field.
Once the typhoon eyes have been extracted from the images, the central location of each image is calculated as the geometric center from each delineated eye contour. The center distance between the central locations of the typhoon eyes detected using SAR and IR images is then estimated. Because the typhoon eyes observed using SAR and IR data are located at different heights, to estimate the center distance, the distortion from satellite incidence angle of MTSAT must be evaluated. In estimating distance, a spheroid coordinate was used for higher accuracy. First, the relative positions have been defined among MTSAT (S), the nadir point of MTSAT (SE), and the projected point on the surface (P) of the observed typhoon eye at the cloud top in spheroid coordinates. The altitude of MTSAT from the earth surface is approximately 35,800 km. The angle between PSE and PS can be expressed by a simple geometric equation as shown in [
19]. Then, the distortion between the projected point and the nadir point of the typhoon eye at the cloud top from the satellite incident angle can be calculated. The height of the cloud top is estimated from the temperature difference of the cloud top with an average of 13 km. In summary, the estimated distortion distances of the eyes between the projected point and the nadir point at the cloud tops of all typhoons are found to be 4–5 km for MTSAT and 6–7 km for FY-2. However, the distortion of eye locations derived from two IR sensors are likely in the opposite sides of the nadir point of the typhoon eye since the typhoon eye is most likely located in between MTSAT (140 degrees E) and FY-2 (105 degrees E) satellites.
First, the center distance between the central locations of the typhoon eyes detected using SAR and IR images is estimated. Because IR imagery is taken every half an hour, the location of the eye in an IR image can then be linearly interpolated to the same time as that of a SAR image taken for comparison. The identical time locations of eyes of MTSAT (red dot), FY-2 (green dot), and SAR (blue dot) are plotted in the following figures. Therefore, the displacement of lower (SAR) and upper (IR) eye centers represents the vertical tilt of the typhoon’s eyewall shaft with increasing height.
4. Case Studies for Envisat SAR Images
A total of three cases of various typhoons with clearly identified eye in different years, locations, and condition have been examined to compare the typhoon eyes’ separation distance between Envisat SAR images, MTSAT and FY-2 IR data collected at the same time are described as follows. The typhoon location from the post-analysis for the best tracks of JTWC, CMA and JMA has also been checked for the calibration and comparison along with MODIS image.
4.1. Typhoon Megi in October 2010
Typhoon Megi formed as a tropical depression over the western Pacific Ocean on 13 October 2010. It quickly strengthened to a named storm, and three days after forming, had grown to a super typhoon. In general, rainfall roughly matches the storm track, especially in cases west and northwest of the Philippines. The Super-typhoon Megi unleashed heavy rainfall—more than 600 mm, as it tracked west across the Pacific between 13 October and 23 October 2010. Away from the storm track, areas of heavy rainfall appear east of Taiwan, where torrential rains led to deadly landslides. As the storm track indicates, Megi reached its greatest intensity immediately when it moved to east of the Philippines. The storm weakened slightly after 17 October, but remained powerful across the northern Philippines. For the purpose of demonstration,
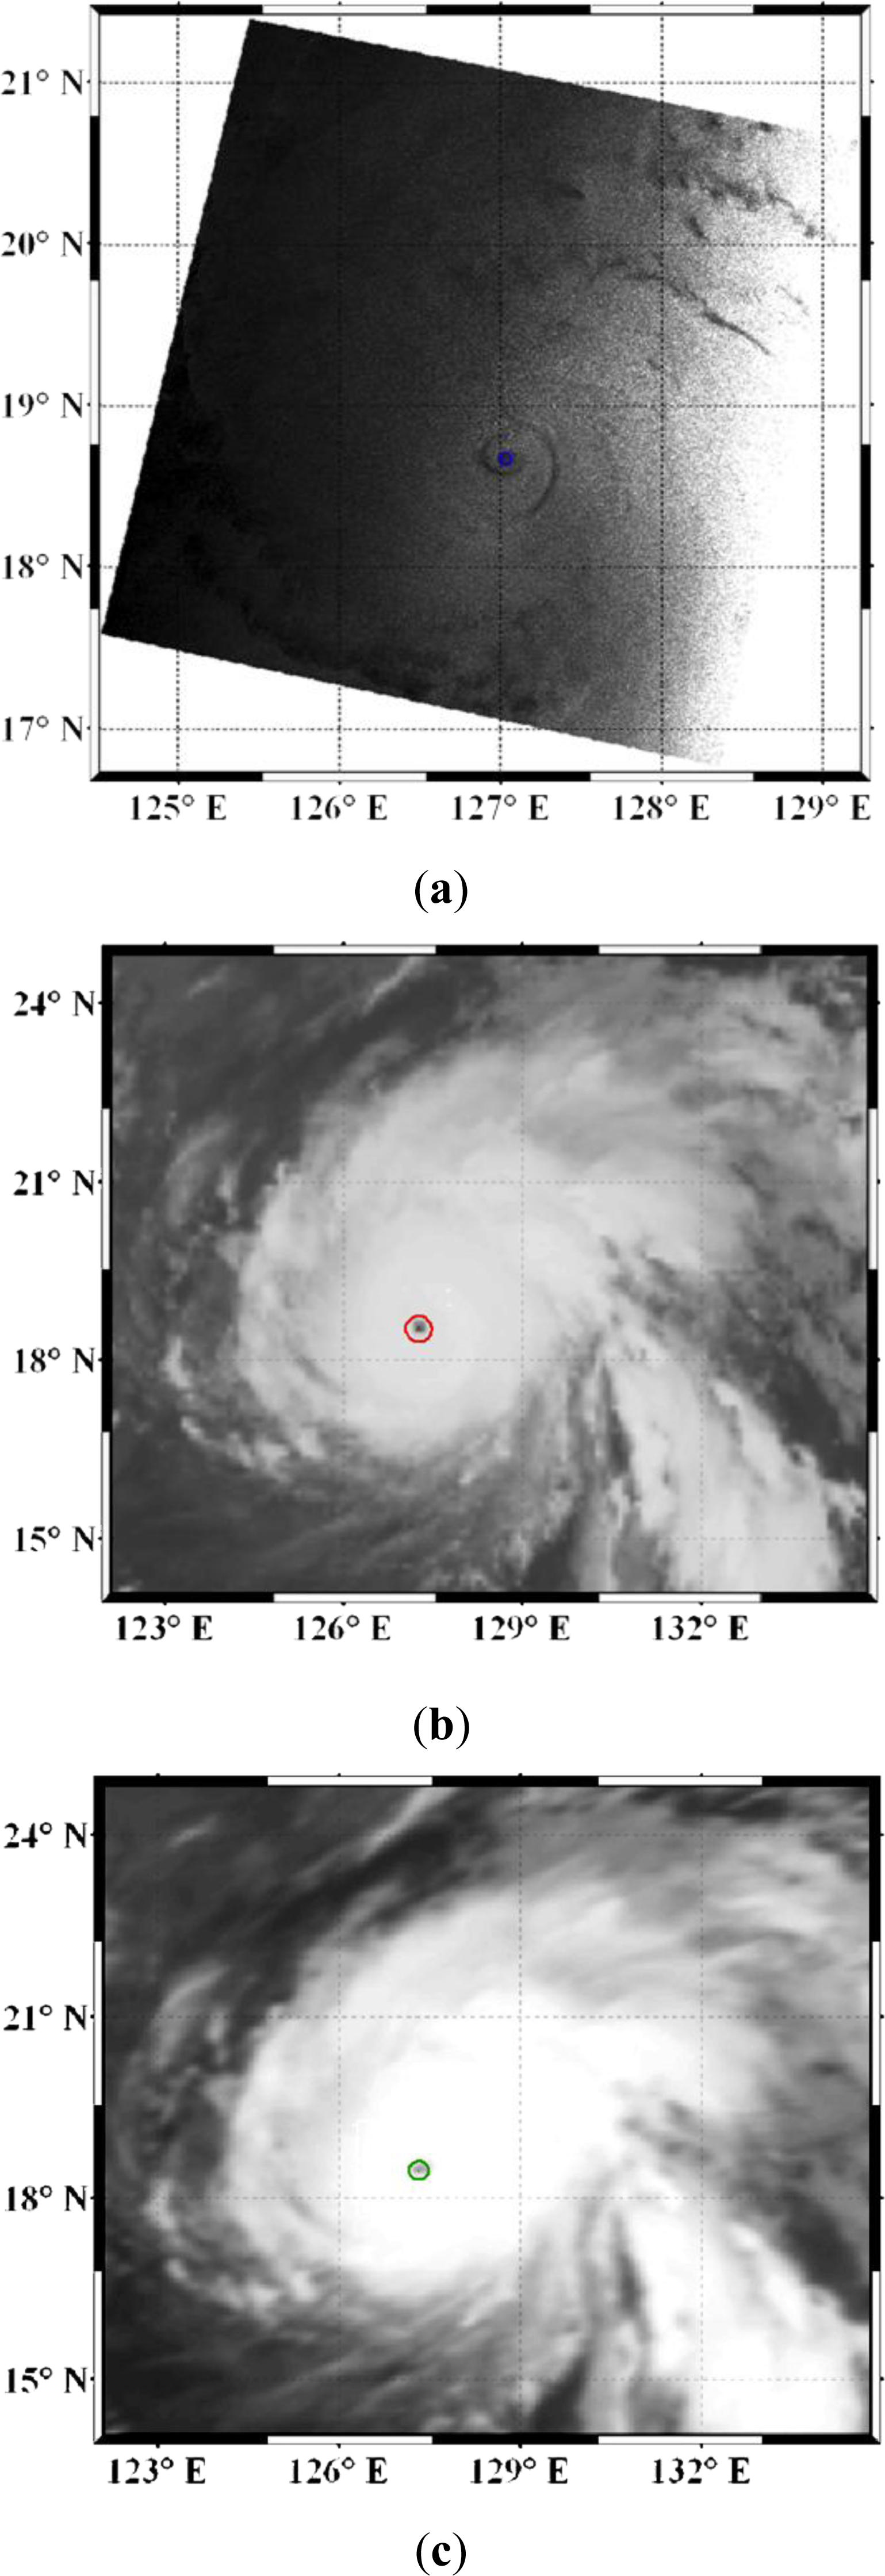
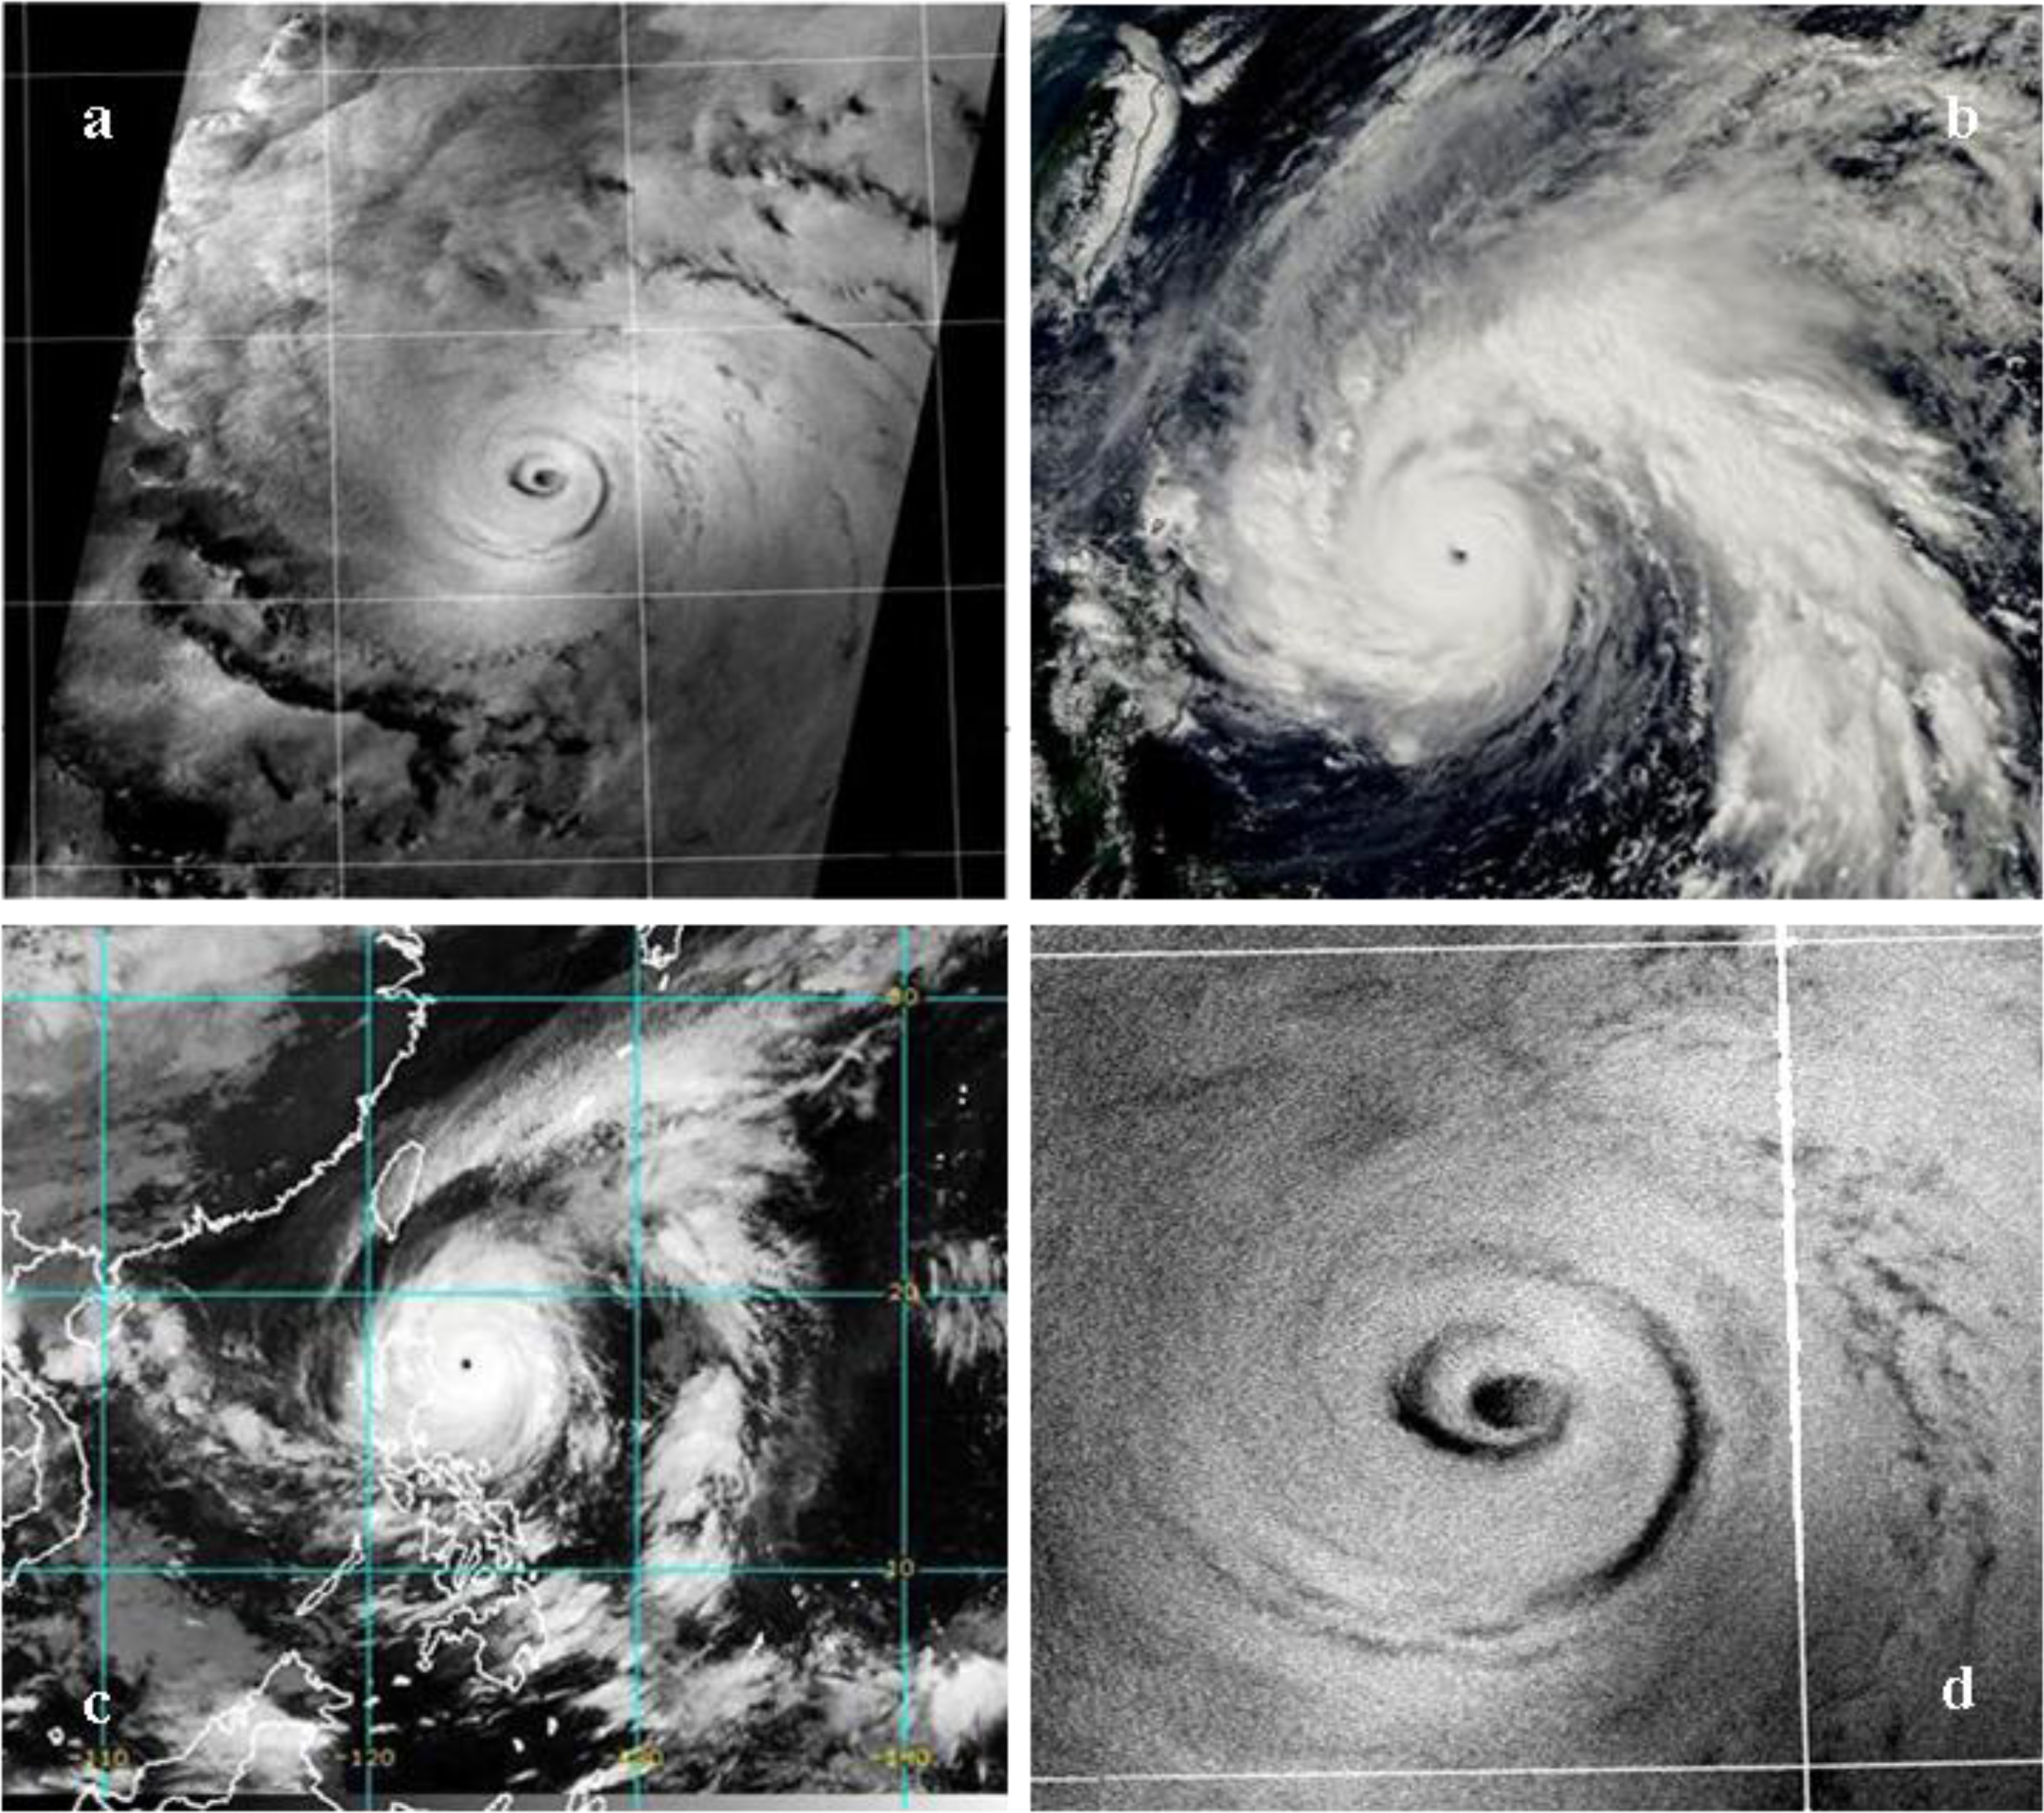
Figure 2(a,c,d) shows the satellite images of Typhoon Megi collected over the southeast of Taiwan on 17 October 2010 from MODIS, MTSAT, and Envisat, respectively. The typhoon eye, with minimum wind, as a dark circle, and the rain bands around the eye, also dark due to the damping effect on the ocean surface, can be easily detected in the zoom-in Envisat SAR image shown in
Figure 2(b). In MODIS and MTSAT IR image, the formation of a small eye (with warmer temperatures relative to the eyewall) and the expanded area of very cold cloud in bands around the eye indicate the increased intensity.
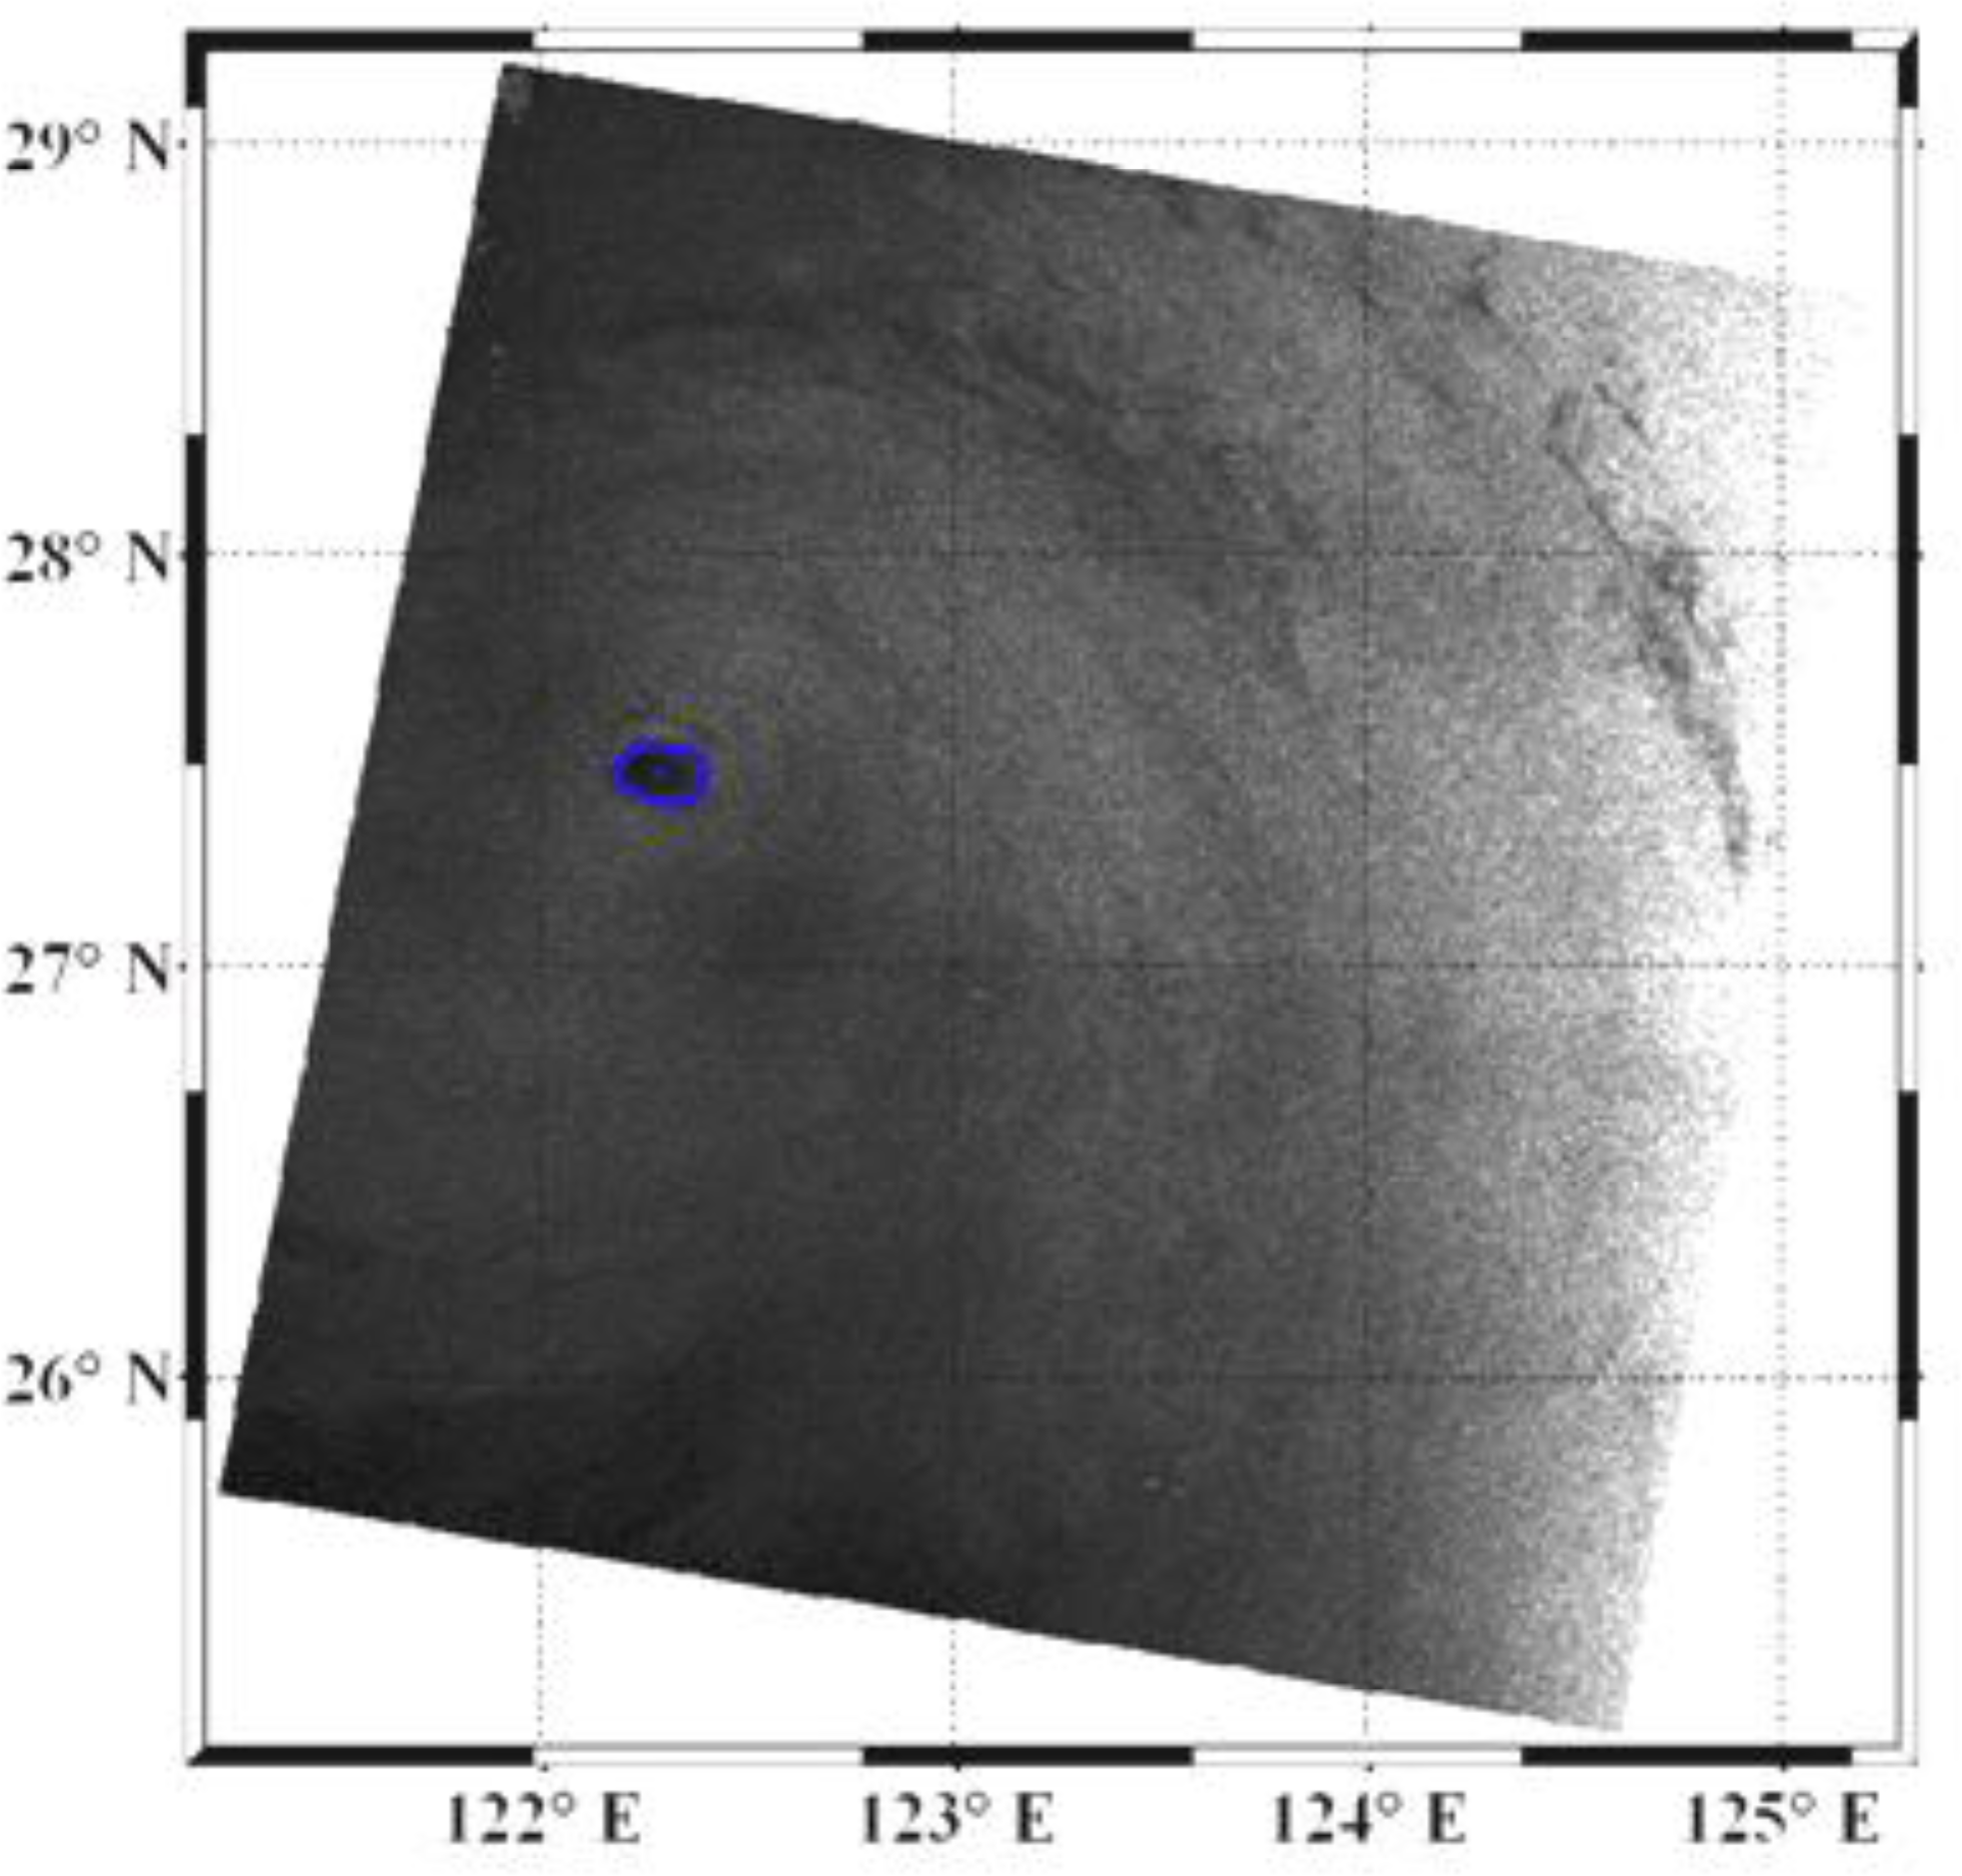
For reference,
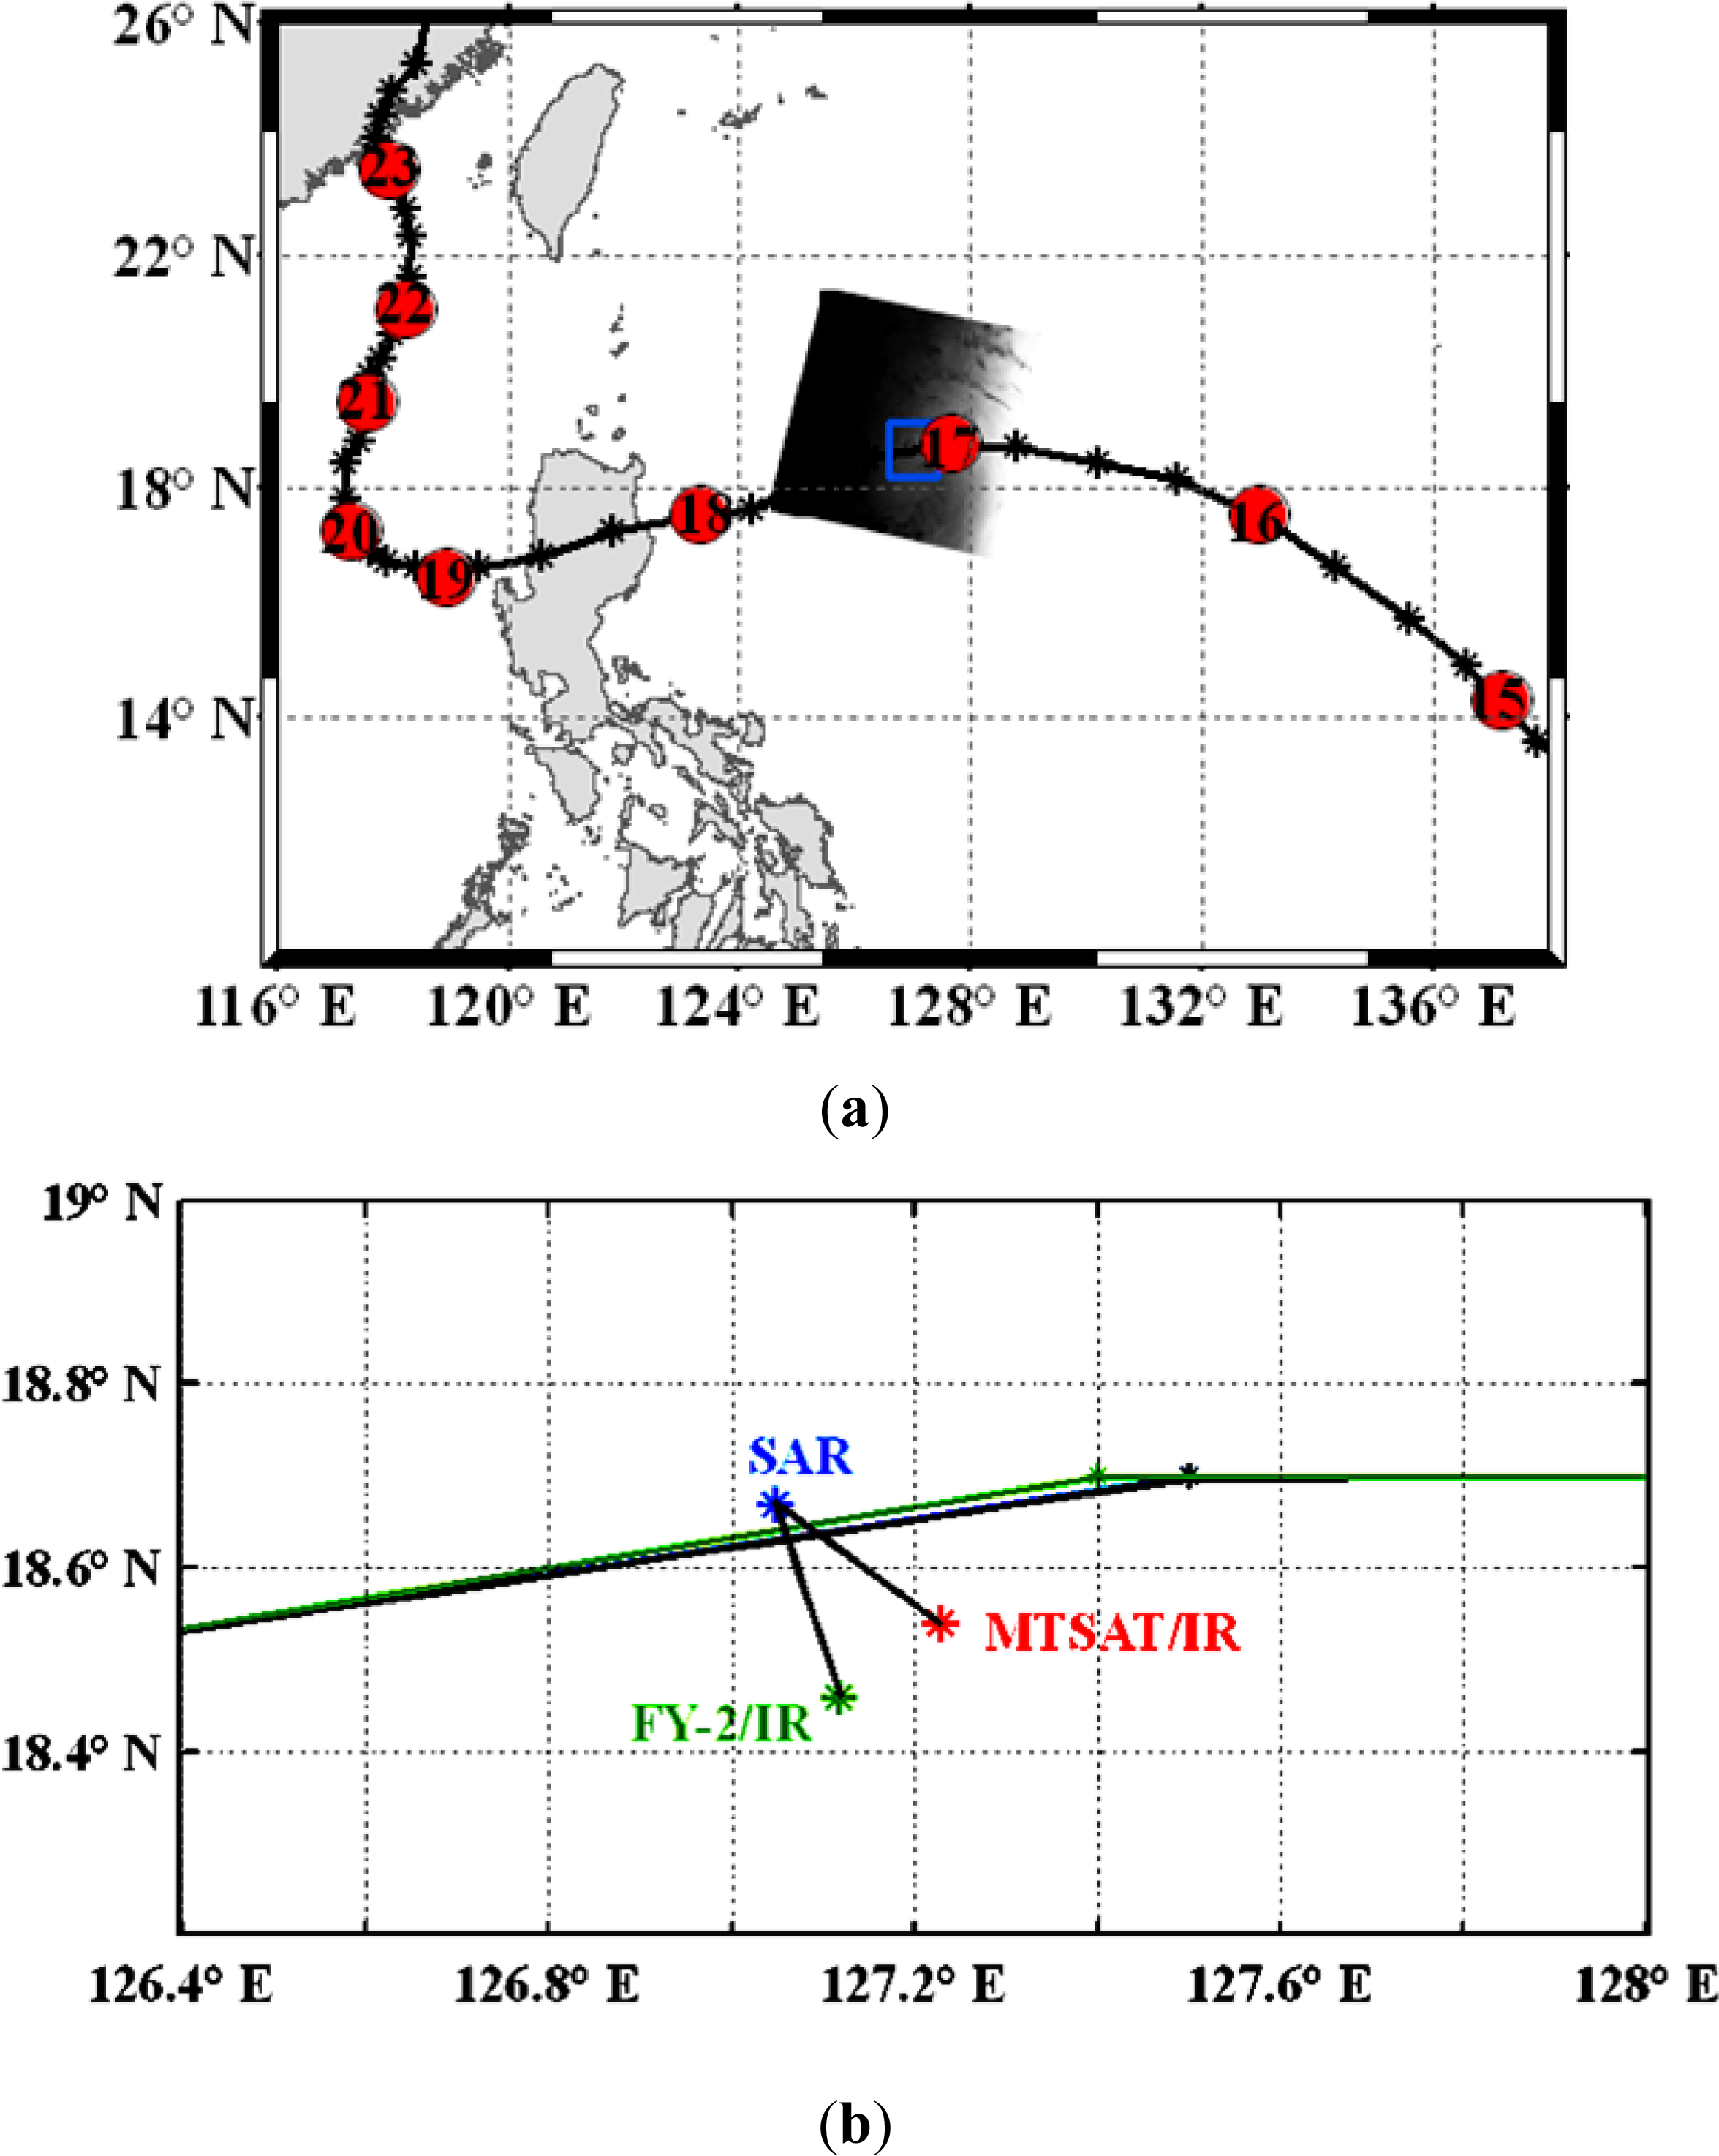
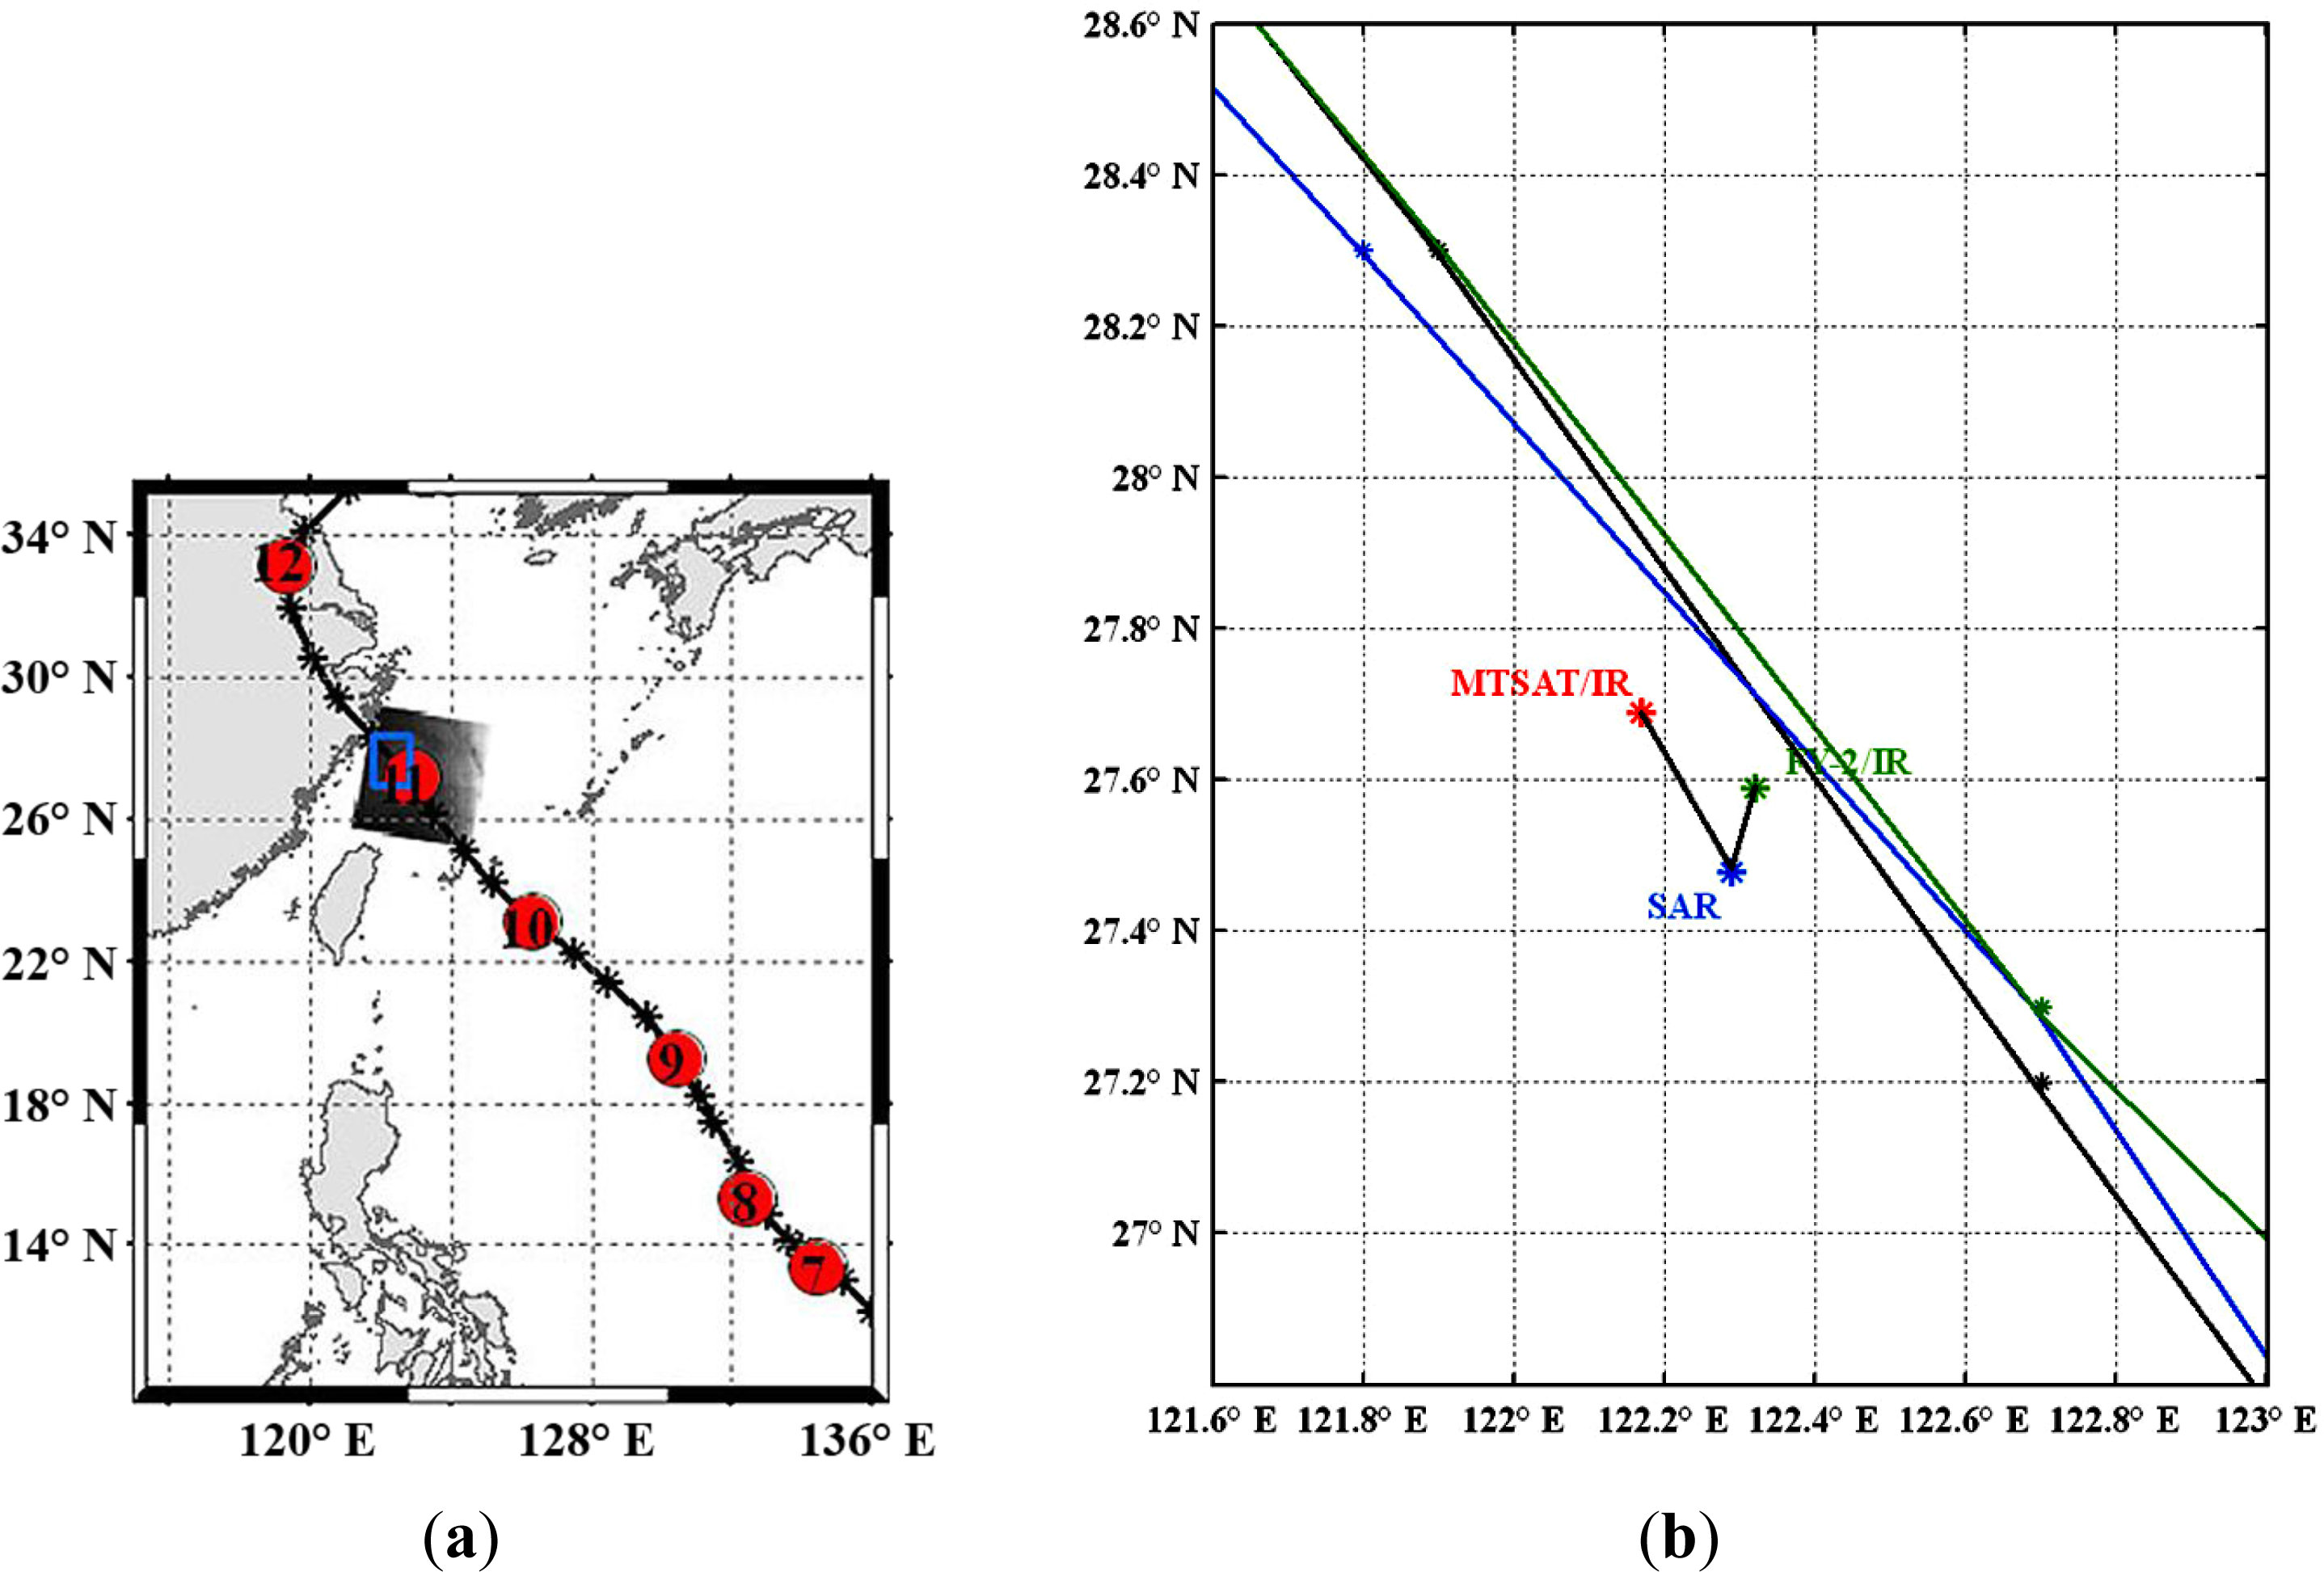
Figure 3(a–c) show the Envisat-1 SAR image collected at 0124 UTC, MTSAT and FY-2 IR images of typhoon Megi on 17 October 2010 with the eye boundaries delineated using wavelet analysis, respectively. The typhoon intensity was increased to 895 hPa, with a maximum wind speed of 72 m/s. The regional typhoon track map from 15 October to 23 October, and the extracted typhoon eyes’ center from SAR data, FY-2 and MTSAT IR images when Typhoon Megi was approaching Philippines on 17 October 2007 are shown in
Figure 4, respectively. The green line, blue line, and black line are the best tracks of typhoon from JTWC, CMA, and JMA, respectively. In the track map, the blue box is the approximate boundary of SAR subscene, and the red dots indicate the dates from 15 October to 23 October. The identical time locations of eyes from MTSAT (red dot), FY-2 (green dot), and SAR (blue dot) data are plotted in the following figures. The distance between eyes’ centers derived from SAR and IR images is around 23 to 24 km since both eyes derived from FY-2 and MTSAT agree with each other. It should be noted that the eye derived from SAR data is closer to all collided tracks of JTWC, CMA, and JMA than that from IR data.
4.2. Typhoon Talim in August 2005
Typhoon Talim was a building storm in the western Pacific several hundred kilometers south of Japan on 29 August 2005. As of 30 August, it started to gather up stronger winds and struck Taiwan on 2 September, and then continued across the Taiwan Strait to make landfall again on mainland China. The typhoon reached Category 3 strength with maximum sustained winds estimated at 54 m/s by the time it striked Taiwan.
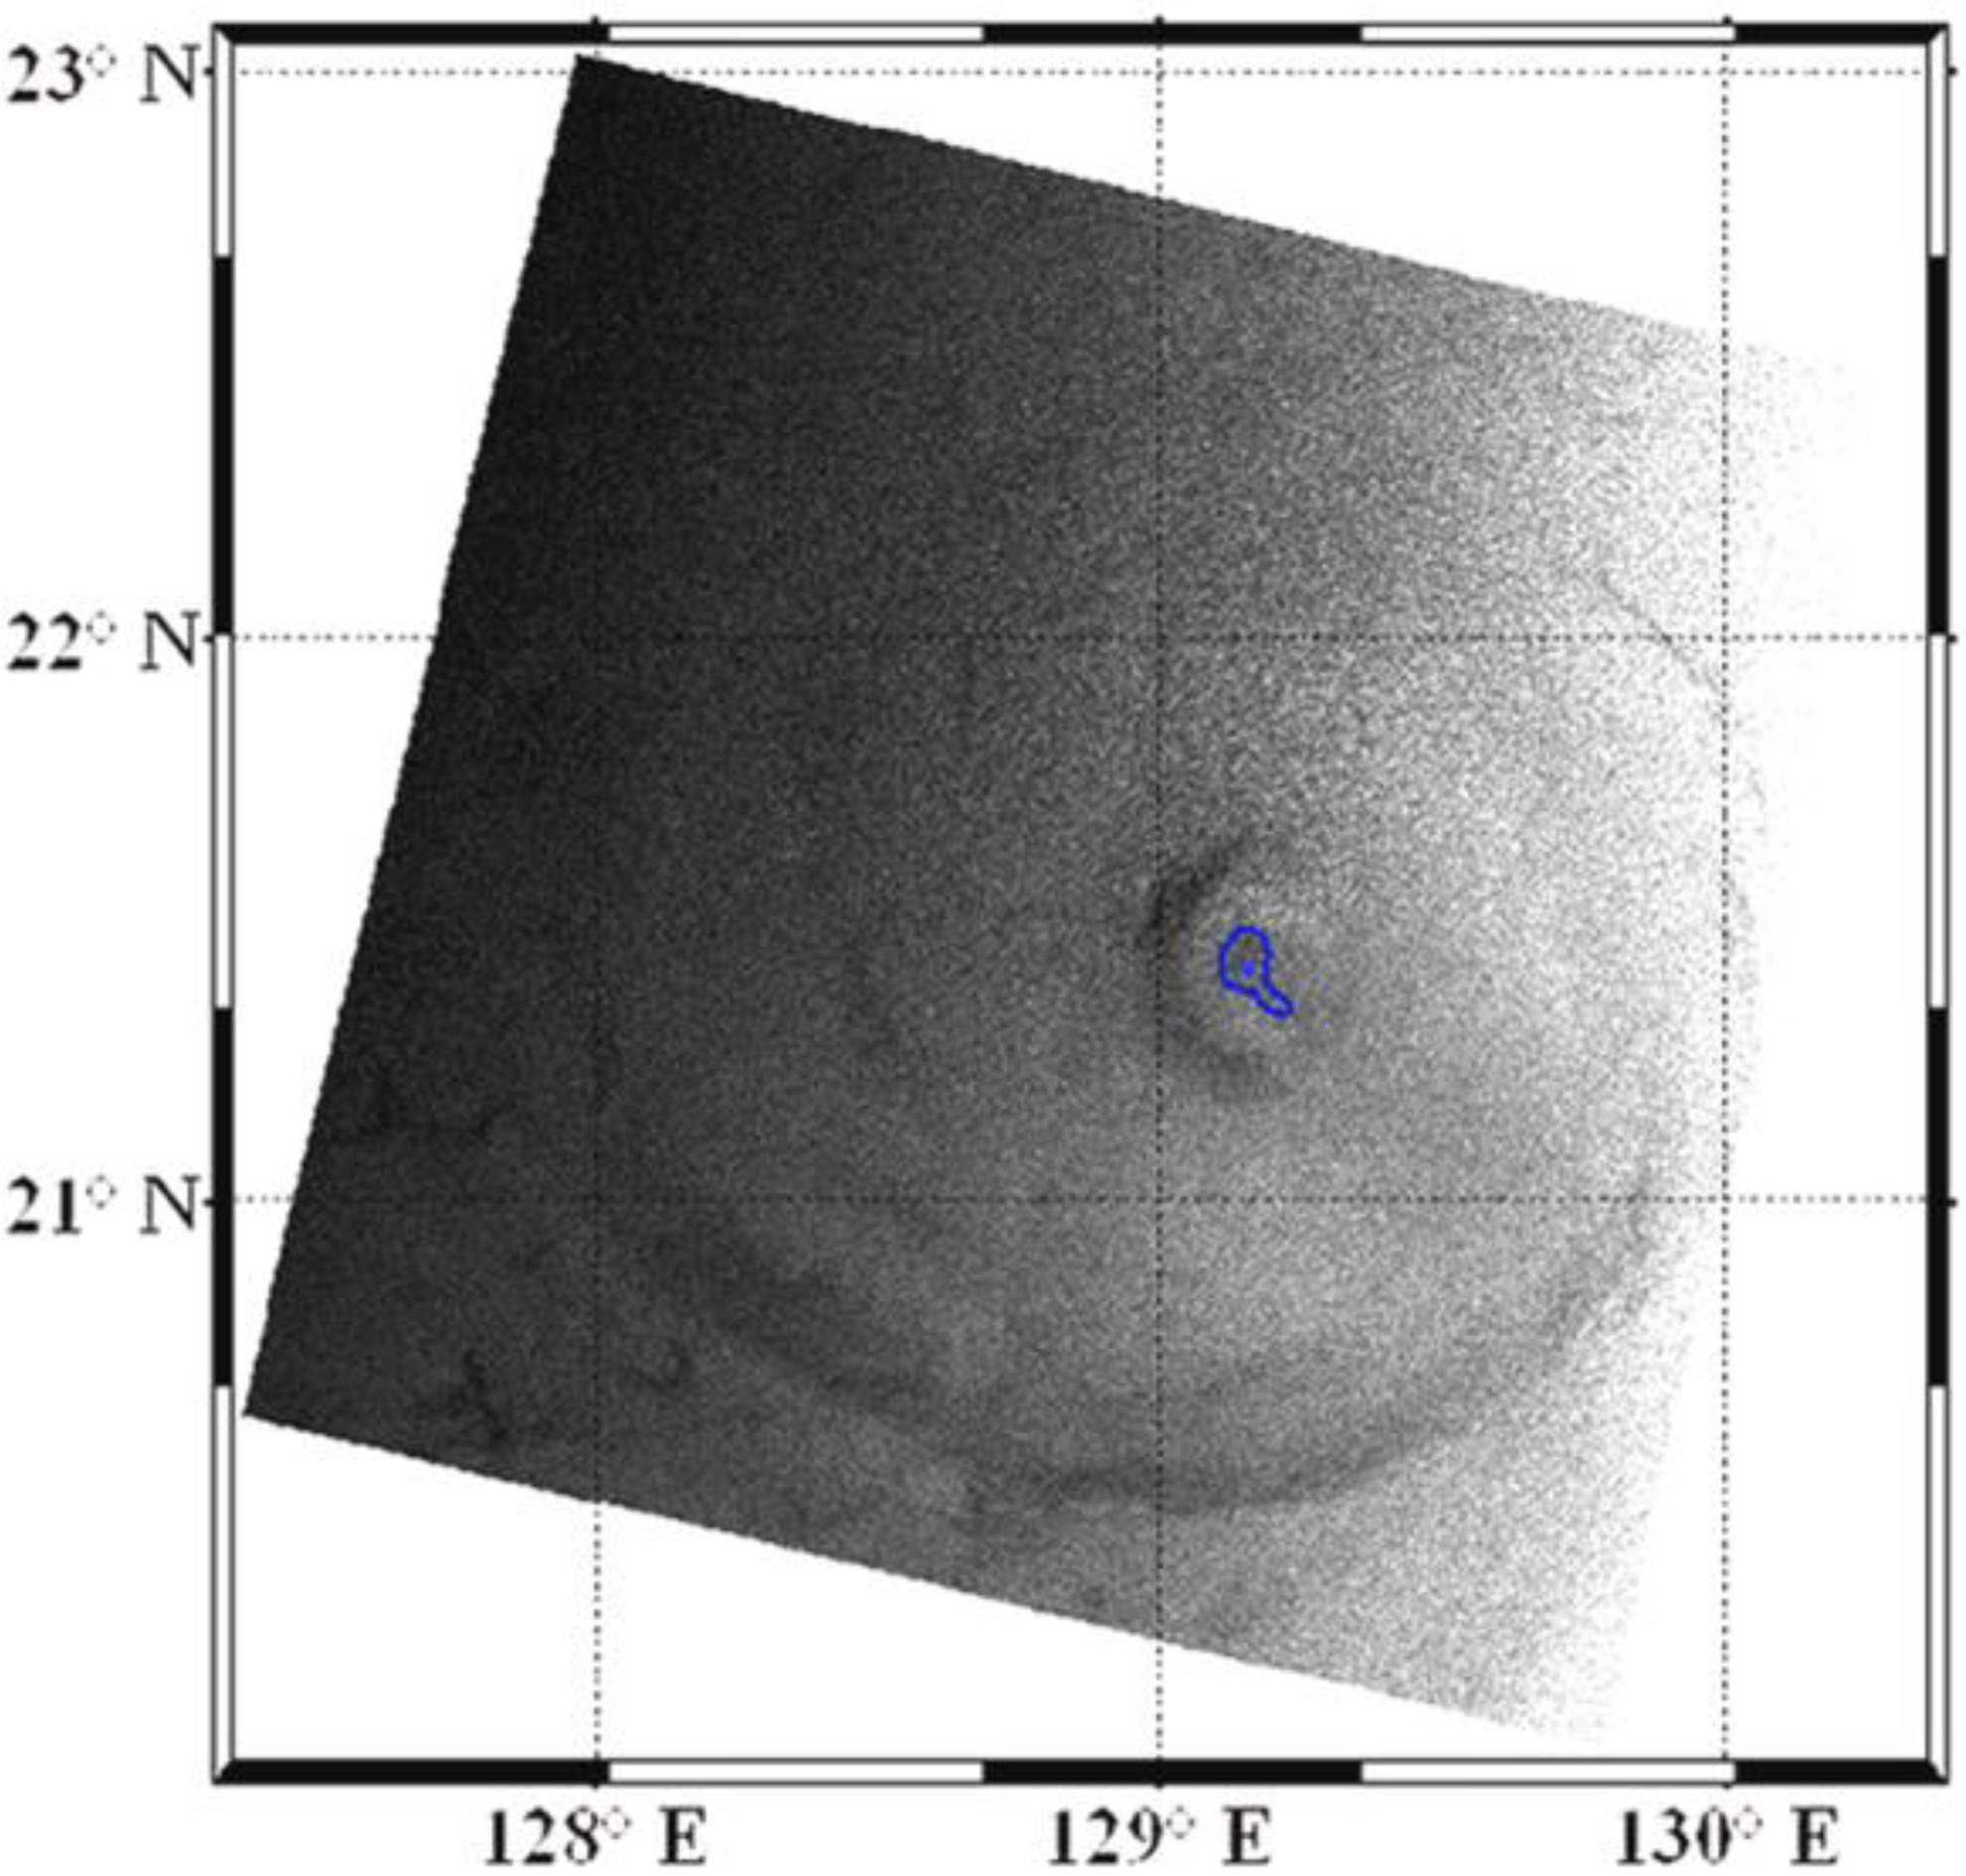
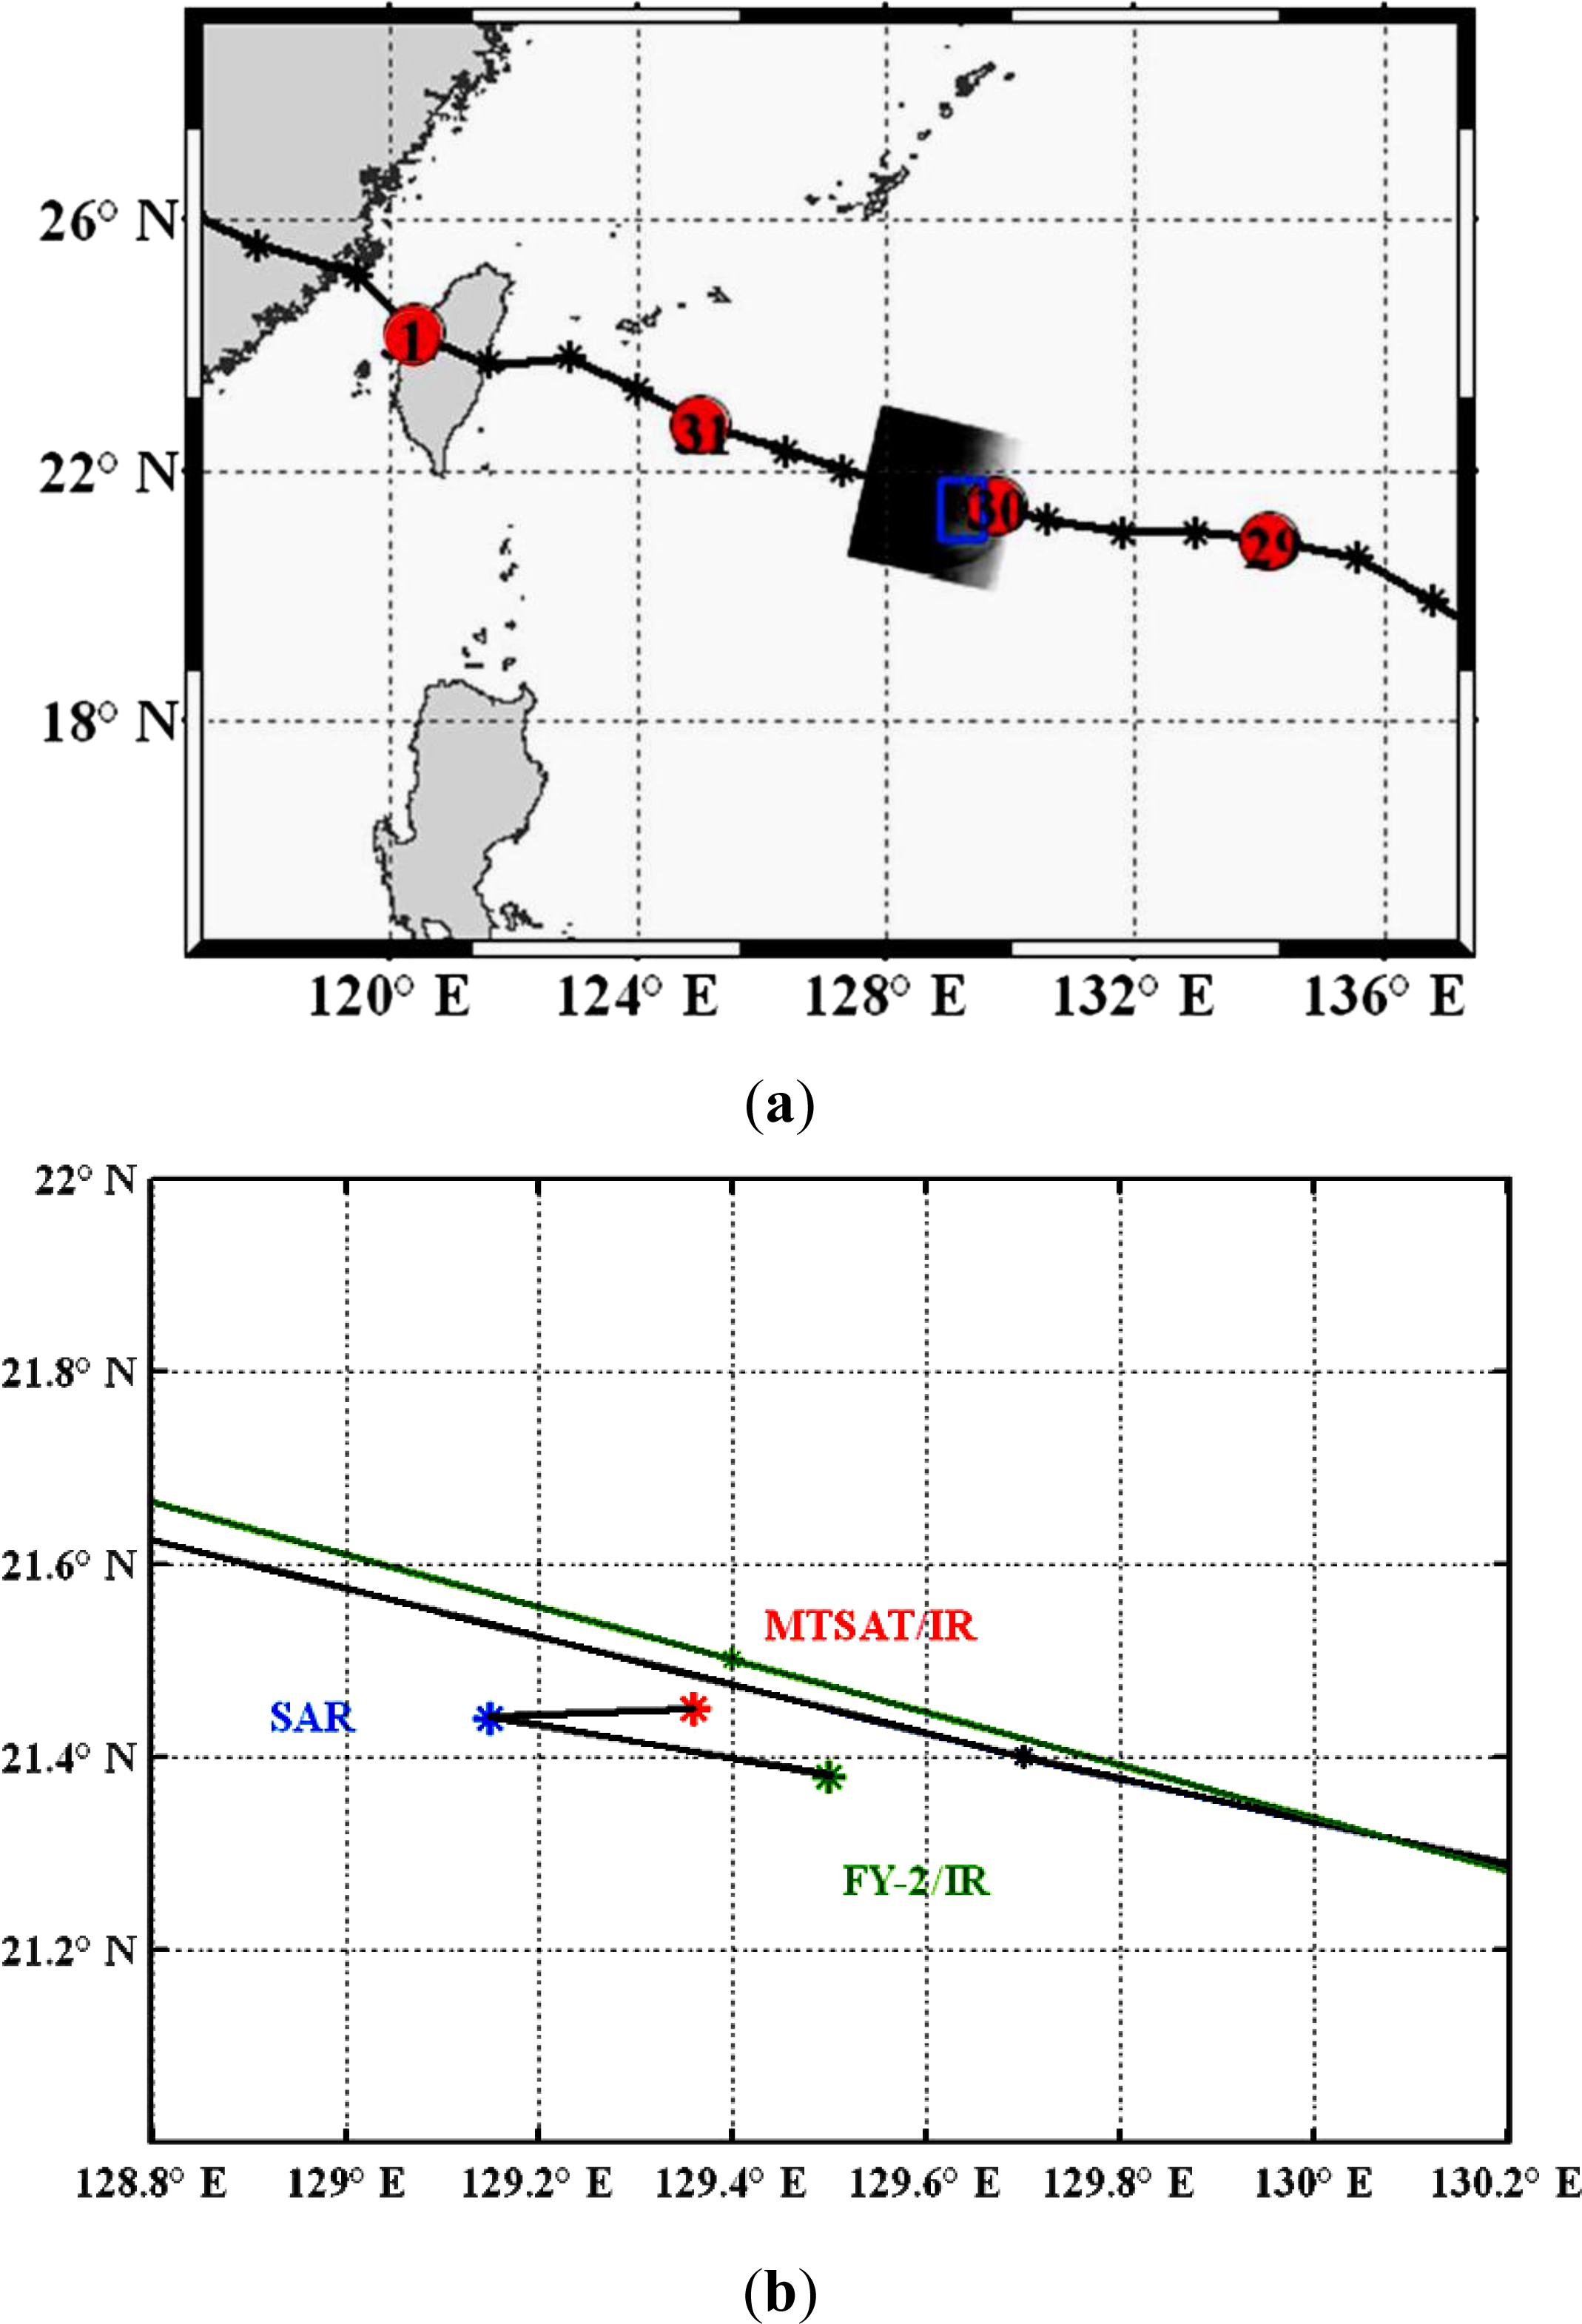
Figure 5 shows the Envisat SAR image collected at 0123 UTC with the eye boundaries delineated using wavelet analysis for Typhoon Talim on 30 August 2005. The typhoon intensity increased to 970 hPa, with a maximum wind speed of 35 m/s. It should be noted that the eyewall was not very clearly identified as a perfect circle since it was still building its strength as a Category 2 storm on 30 August. The regional typhoon track map from 29 August to 1 September, and the extracted typhoon eyes’ center from SAR data, FY-2 and MTSAT IR images when Typhoon Talim was approaching Taiwan on 30 August are shown in
Figure 6. Note that the eye center derived from SAR data is way ahead of that from IR images with large separation distances of 22 km for MTSAT and 37 km for FY-2, probably caused by its relatively weak storm intensity during formation with poorly defined eye location. These large distances between eyes may be also partially caused by the distortion error, especially for FY-2, since its position at 105 degree East Longitude is far from the typhoon eye’s projected location, around 129 degree E. If the projected distortion is corrected, the eye center distance between SAR and FY-2 is reduced to 30 km. The highly tilted vertical wind shear may be much complicated and drastic, especially during the formation period.
4.3. Typhoon Khanun in September 2005
As Typhoon Khanun moved towards China on 11 September, it was moving to the northwest at a speed of 25 km/h with winds gusting as high as 40 m/s. It was also bringing heavy rain and made landfall near Shanghai in eastern China on 11 September at 06:00 UTC. Then, Typhoon Khanun dissipated the next day, on 12 September. China’s eastern coast and Japan’s southern islands suffered strong winds, high waves and heavy rains as the storm passed.
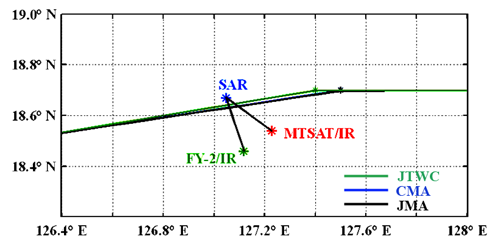
Figure 7 shows the Envisat SAR image collected at 0145 UTC with the eye boundaries delineated using wavelet analysis for Typhoon Khanun on 11 September 2005. Notice that the eyewall was clearly identifiable as a perfect circle since it was moving with full strength of a Category 4 intensity of 945 hPa with sustained winds of 50 m/s. The regional typhoon track map from 7 September to 12 September, and the extracted typhoon eyes’ center from SAR data, FY-2 and MTSAT IR images when Typhoon Khanun was passing through north of Taiwan on 11 September are shown in
Figure 8. Note that the eye center derived from SAR is dragging behind the eyes’ center derived from IR images with separate distances of 26 km for MTSAT and 13 km for FY-2 as expected in the open ocean, but is further away from all post-analysis tracks than that derived from IR images.
5. Issues and Discussion
The definition of typhoon eyes derived from SAR imagery is the smoother area near storm center with darker shading, representing lesser backscattering from radar relative to that underneath the adjacent eyewall. For IR data, the typhoon eye is the warm area with high brightness temperature. The general consensus is that a sensor for typhoon intensity studies should be one which measures the wind field directly. When there are no direct measurements of surface wind, the next best alternative is the high-resolution SAR imagery based on the surface roughness inferred from radar backscattering of capillary and short gravity waves on the ocean surface. Roughness increases with wind intensity, and the retrieval of wind speed requires a suitable geophysical model function. In a heavily precipitating area such as the hurricane eyewall, SAR images may contain artifacts owing to attenuation and surface splash; nevertheless, these images are well-suited to studies of the hurricane eye [
27] which is relatively calm and free of such effects, as demonstrated here.
Based on these case studies and observations, the tilted inner-core structure and associated vertical wind shear may be much more complex than expected. All these case studies of typhoon eye and comparisons of eye center distances using FY-2 and MTSAT IR images with Envisat SAR data are summarized in
Table 1 for reference. It is found the distances between the center locations of these typhoon eyes from SAR and IR data are quite significant from 9 to 26 km [
19] with a special case of 30 km for Typhoon Talim with relatively weak intensity. However, not all typhoons have large horizontal distance between eyes on the cloud top and on the ocean surface; such as Typhoon Kajiki case on 20 October 2007 having only a 9 km separation, which is in the uncertainty and error range [
19]. It is found that the typhoon eye derived from SAR always follow the typhoon tracks from the JTWC and JMA post-analysis very well, based on this study of three cases and the previous study of seven cases in [
19]. It is conceivable that these best tracks have used some other satellite data (e.g., MODIS, AMSR, TRMM,…) and even ship/buoy data over the ocean for post-analysis. As demonstrated here that SAR can be a powerful tool for typhoon tracking and prediction especially near the ocean surface.
The accuracy of this wavelet typhoon eye extraction method is only limited by the persistence of the features, the spatial resolution, and navigational accuracy of satellite data. The geometric accuracy of the MTSAT, FY-2, and SAR data are less than 1.97 km, 2 km, and 100 m, respectively [
28–
30]. Because the remapped SAR image has a pixel size of 150 m, there is no serious accuracy issue. However, the MTSAT and FY-2 IR image has a spatial resolution of 4 km; the derived eye may have a geo-location error of approximately 5 km due to sensor resolution [
19]. Because most of the eye contours are relatively axis-symmetric, the central location of the eye will not be shifted significantly using the wavelet detection method and the threshold technique to delineate eye contour. The distortion distance of these cases caused by the satellite incidence angle of MTSAT and FY-2 is approximately 4–7 km. For an average eye size of 50 km in diameter, the maximum error is estimated to be around 8 km (2 pixels). As the average size of the eye is usually much larger than the height of the typhoon, the slight shift of the typhoon eyewall shaft would be hard to detect by human eyes. Therefore, only high-resolution instrument and objective analysis could offer the true observations of typhoon eye. However, the accuracy of eye location from MTSAT IR data may be a concern as compared with that derived from MODIS/IR data with 10–16 km eye center separation [
19]. Also, the typhoon eye separation between FY-2 and MTSAT at the same time brings the concern on the navigation issues. Determining the distortion distance of typhoon eyes between the projected point and the nadir point at the cloud top from the satellite incident angle using MTSAT and FY-2 images has helped to justify the resolution and uncertainty of this study. More detailed comparison study between MTSAT, FY-2, and MODIS images is warranted to calibrate the accuracy of MTSAT and FY-2 data.
The large horizontal distance between typhoon eyes on the cloud top and on the ocean surface of these case studies are from 13 km to 30 km. This relatively large separation distance maybe an indicator of possible large vertical wind shear. This implies that the eyewall shaft is probably highly tilted and the vertical wind shear profile maybe much more complex than generally expected. Compared to the eye diameter of 50 km, the horizontal distance of typhoon eyes at various heights is insignificant; but compared to the average height of clouds at 13 km, the horizontal distance of 13–30 km seems significantly large. For a small island such as Taiwan, the 22 km found in the study that Typhoon Talim passed through in August 2005 could be the distance between two cities. As shown in the case of Typhoon Talim, the typhoon eye derived from IR data is lagging behind that derived from SAR data by 26 km in average. Then in this case, the typhoon could land on the coast almost an hour earlier than the prediction based on the IR data alone. Recent studies have reported on an objective technique for estimating the intensity of tropical cyclones from a sequence of satellite IR images as an indirect measurement of its maximum wind speed [
31,
32]. However, the results of eye location from both techniques are close and will not have too much effect on our final results of separation distance between eye centers from SAR and IR. Therefore in this study, due to the high spatial resolution of limited SAR images, the typhoon eyes are derived based on the wavelet analysis to track ocean features [
25].
Definitely, the high-resolution observation by SAR could be complementary to the IR observations from meteorological satellites over the ocean. As SAR data becomes increasingly abundant with computer working efficiency, it should be combined with other sensors, such as MTSAT, FY-2, and MODIS, for typhoon tracking in near real-time applications. It is certain high-resolution SAR could provide information to MTSAT for higher accuracy in prediction and model assimilation of typhoon tracking over the open ocean, such as in storm surges along coastal communities where typhoons have most serious impact. In addition, highly tilted and twisted vertical wind shear profiles must be considered in mesoscale typhoon models for more accurate prediction and more effective operation. Based on these case studies and observations, results from the ocean upwelling might be significant, especially when a typhoon is turning and staggering. Therefore, understanding typhoon behavior is important for typhoon intensity and track forecasts.
6. Conclusions
In this study, multi-sensor images of Envisat synthetic aperture radar (SAR), and multi-functional transport satellite (MTSAT) and Feng Yun (FY)-2 Chinese meteorological satellite infrared (IR) sensors were used to compare typhoon eye locations. The typhoon eyes were derived from both SAR (on the ocean surface) and IR (at the cloud-top level) images. In addition, the best track data from the Joint Typhoon Warning Center (JTWC), Chinese Meteorological Administration (CMA), and the Japan Meteorological Agency (JMA) are also checked for the calibration. It is found that the location of the typhoon eye on the ocean surface differs from that at the top of the clouds, and this is due to the vertical wind shear, which acts as an upright tilt. Therefore, from the large horizontal distance between typhoon eyes on the ocean surface and on the cloud top, it is implied that the associated vertical wind shear profile is considerably more complex than generally expected. Further study on the navigation issues between MODIS, MTSAT and FY-2 is underway, and will be reported in the near future. It has also been demonstrated that SAR can be a useful tool for typhoon monitoring studies over the ocean surface where field measurements are usually difficult to obtain.


