Evaluating the Effects of Shadow Detection on QuickBird Image Classification and Spectroradiometric Restoration

Abstract
: Shadows in high resolution imagery create significant problems for urban land cover classification and environmental application. We first investigated whether shadows were intrinsically different and hypothetically possible to separate from each other with ground spectral measurements. Both pixel-based and object-oriented methods were used to evaluate the effects of shadow detection on QuickBird image classification and spectroradiometric restoration. In each method, shadows were detected and separated either with or without histogram thresholding, and subsequently corrected with a k-nearest neighbor algorithm and a linear correlation correction. The results showed that shadows had distinct spectroradiometric characteristics, thus, could be detected with an optimal brightness threshold and further differentiated with a scene-based near infrared ratio. The pixel-based methods generally recognized more shadow areas and with statistically higher accuracy than the object-oriented methods. The effects of the prior shadow thresholding were not statistically significant. The accuracy of the final land cover classification, after accounting for the shadow detection and separation, was significantly higher for the pixel-based methods than for the object-oriented methods, although both achieved similar accuracy for the non-shadow classes. Both radiometric restoration algorithms significantly reduced shadow areas in the original satellite images.1. Introduction
Detailed and accurate land use and land cover information is essential to document the current state of urban environment, to evaluate what and where changes have been made on the landscape, and to examine the possible impacts on ecological processes and climate. It has been widely recognized for decades that satellite observations of the Earth’s surface can be used to map land use and land cover. However, until recently, satellite imagery has been limited in quantifying urban landscape patterns because of its low resolution in relation to the high spatial heterogeneity of urban land surfaces.
The availability of high spatial resolution satellite imagery (e.g., IKONOS, QuickBird, and WorldView-2) provides new opportunities for better resolving the spatial details of urban landscapes at fine scales. However, the analysis of these images also requires sophisticated digital image processing techniques to deal with new challenges such as the problem of shadows [1]. While shadows may provide geometric information of casting ground features, such as the shape and height of buildings, shadows often cause ambiguity in image interpretation. Extensive shadows, cast by elevated ground objects such as trees and buildings, regularly exist in high resolution images largely due to the narrow field of view of satellite sensors as well as the low solar elevation at the time of image acquisition. In urban areas, the problem of shadows is further aggravated by the dramatic changes in surface elevation over a short distance. As a result, a significant proportion of high spatial resolution imagery in urban areas can be affected by shadows; this creates great difficulty in directly applying imagery data to analyze urban land use and land cover [2].
Shadows in high resolution imagery often lead to the reduction or total loss of spectroradiometric information, on which the interpretation of land cover and the evaluation of ground condition depend [1]. Reduction or loss of spectroradiometric information could potentially lead to misclassification, inaccurate derivation of biophysical parameters, and erroneous interpretation [3–5]. Thus, shadows pose an enormous challenge for applying high resolution satellite imagery to urban land use and land cover classification, change detection, and environmental analysis. Shadowed areas have been traditionally left unclassified or simply classified as shadows [6]. However, the class of shadows is not informational and consequently, the real land cover beneath shadows remains unknown and a significant portion of land cover is lost in image classification and urban environment studies.
Resolving the shadow problem is two-fold: shadow detection and shadow removal. The former refers to the process of identifying pixels that are contaminated by shadows in remotely sensed imagery, whereas the latter is to restore the spectroradiometric information of those pixels to obtain a shadow-free image [1]. Thus, resolving shadows usually includes two stages in succession: shadow detection and removal in remotely sensed imagery and subsequently in the land use and land cover classification map. That is to say, shadows are often first identified in remotely sensed images and the spectroradiometric responses are restored for shadowed areas before image classification.
A number of studies have investigated the problems in the first stage, i.e., shadow detection and removal in either high resolution satellite imagery (e.g., [1,7,8]) or aerial photography (e.g., [9–14]). An invariant color space based non-linear transformation was proposed [7], while histogram thresholding was used [1,8] to discriminate shadows from non-shadow areas in QuickBird and IKONOS images. Similar approaches have also been used to detect shadows in aerial photography, such as invariant color space based transformations [9] and models [10,11], and histogram thresholding [12]. Additionally, three-dimensional models have been developed if the a priori knowledge of the sensor, the illumination, and the 3-D geometry of the scene are available [13,14].
To remove shadow areas in the original satellite imagery, several radiometric restoration methods were compared [7], including gamma correction, linear correlation correction [8], and histogram matching [1,10,13], and the authors found that the linear correlation correction method restituted pixel values of shadow areas better than the other two techniques. In [14], a different approach was presented for removing shadows with neighboring area intensity mapping based on histogram analysis. Multisource data fusion has also been used to simply replace shadow pixels in one image with non-shadow pixels of the same area from another image [1,15]. The application of multisource data fusion to high spatial resolution images, however, is very challenging because spatial misregistration among different sources of imagery data may lead to significant errors [1]. In addition, shadow free imagery data of the same area with the same spectroradiometric characteristics are not always available; the lack of ancillary data makes it difficult to apply this technique in practice.
Little research has been done on the second stage of shadow resolving, i.e., classification of detected shadow areas and evaluation of the effect of shadow detection on the accuracy of overall image classification. Three methods for land cover classification of shadow areas in an aerial photo were compared and the results showed that the classification achieved the best accuracy with the aid of data fusion if the ancillary data are available [12]. Considering most spectroradiometric restoration algorithms were not designed to optimize classification performance [16], a support vector machine approach was implemented to classify shadows before applying spectroradiometric restoration for shadow pixels in QuickBird and IKONOS imagery [17].
Most of these studies in the literature have conducted shadow detection at the pixel level. Pixel-based methods are generally limited in extracting meaningful objects of interest, thus, often produce inconsistent “salt-and-pepper” classification. In contrast, object-oriented methods arguably produce better classifications because of its capacity of subdividing images into individual homogeneous regions (i.e., image objects) at scales that are appropriate to the inherent landscape, and establishing the context information and topological network of these image objects for accurate classification [18].
Only a few studies have examined if object-oriented image analysis provides an effective way to improve shadow detection or classification. Shadows on impervious surfaces in a QuickBird image were classified based on class-related adjacency relations, i.e., relative border of shadow objects to other image objects [2]. A similar rule-based classification process, which also relied on the additional information provided by LiDAR data, was employed to detect shadows in an aerial photo [12]. Based on the segmentation of a panchromatic image and a measured radiance ratio between the shaded and sunlit areas, shadow areas were extracted from the QuickBird imagery [19].
This study proposes an alternative procedure to examine shadows in the high resolution QuickBird imagery of urban-suburban areas as well as in the derived land use and land cover classification with methods that do not require additional ancillary data for shadow restoration. We reversed the common order of the two-stage shadow resolving process to allow customized compensation for different types of shadows. That is to say, shadows were first detected and removed in land use and land cover classification with both the pixel-based and object-oriented methods, followed by the spectroradiometric restoration of shadow pixels in the original satellite imagery with the k-nearest neighbor and the linear correlation correction methods, and the information returned by the shadow detection and classification. The specific objectives included detecting shadows with and without histogram thresholding prior to image classification, separating different types of shadows based on the ground feature upon which shadows were cast, reclassifying shadowed areas into informational land cover types, and restoring spectroradiometric information for the pixels that were contaminated by shadows.
2. Methods
2.1. Study Area and Data Collection
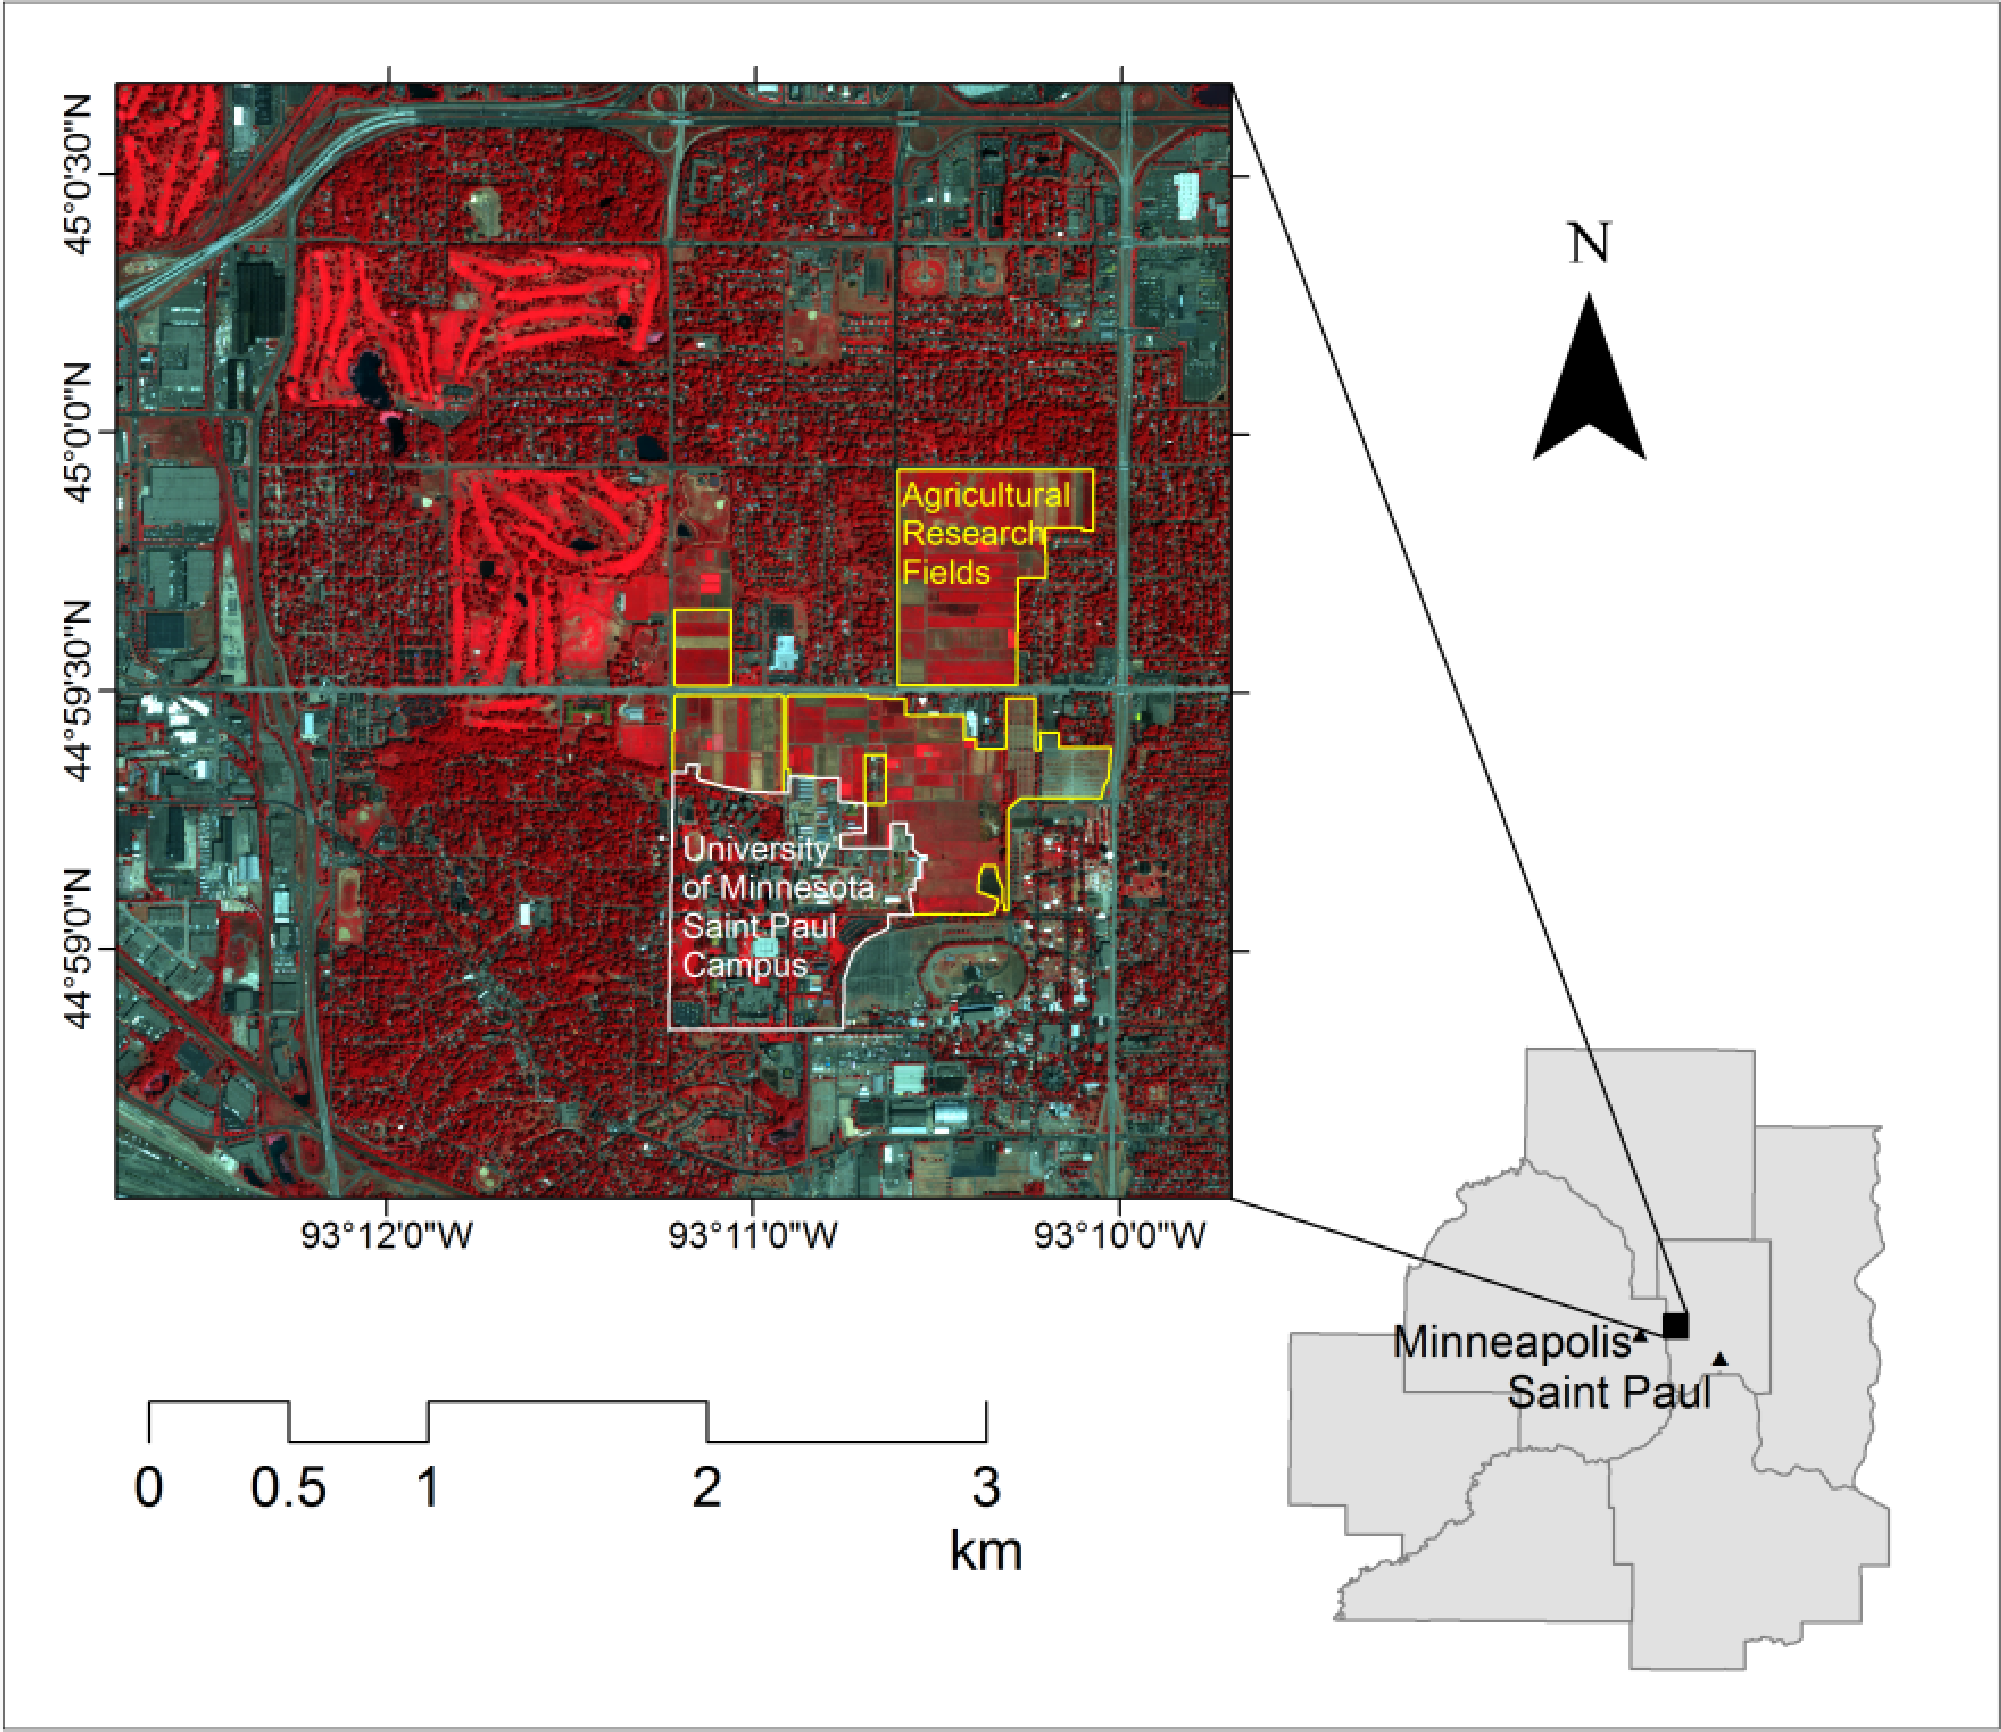
The study area is a suburban residential neighborhood (15.5 km2), located in Falcon Heights and Roseville, Minnesota, USA (Figure 1).
Land use and land cover of the study area is dominated by high-density residential development, but also includes commercial and institutional land development such as industrial buildings, parking lots, roadways, trees, and grass. The QuickBird multispectral imagery of the study area was acquired on 18 August 2003 under clear sky conditions. The sensor, with 11-bit radiometric resolution, has three visible bands (0.45–0.52, 0.52–0.60, and 0.63–0.69 μm) and one near infrared (NIR) band (0.76–0.90 μm). The spatial resolution of the image is 2.8 m, taken at a sun elevation angle of 54.5° and an off-nadir view angle of 12.1°. The image was geometrically rectified as described in [20]. Ramsey County color aerial orthophotography (spatial resolution, 0.15 m) collected on 8 April 2003 was used as ancillary data to aid in shadow detection and land cover classification.
In this study and for most of unban conditions, we were more interested in the land cover shaded by shadows (e.g., grass and impervious surfaces) than the land cover that casts the shadows (e.g., buildings and trees). Thus, shadowed surfaces were simply grouped into two types: shadows on grass (SOG) and shadows on impervious surfaces (SOI), regardless of being cast by buildings or by trees. SOG and SOI directly define the land cover beneath shadows and they do differ spectrally as found in the field measurements described below.
Spectral reflectances of SOG and SOI were measured with a 16-band multispectral radiometer (CROPSCAN MSR-16R, 0.46–1.72 μm) to investigate whether shadows were intrinsically different in terms of spectroradiometric properties and were hypothetically possible to separate from each other. The four multispectral bands of QuickBird data were simulated with the appropriate CROPSCAN bands as weighted averages [5]. The band widths of the spectroradiometer vary from 6.8 nm to 12 nm in the visible and from 11 nm to 13 nm in the near infrared. Thirty seven shadowed plots were selected in the study area, in which 19 were SOG plots and 18 were SOI plots. Each type of shadow (i.e., SOG and SOI) was further divided into shadows cast by buildings (7 for SOG and 8 for SOI) and shadows cast by trees (12 for SOG and 10 for SOI), respectively. Three random sampling areas were selected within each shadowed plot. Measurements were then averaged for each plot to estimate multispectral reflectance values for each type of shadow. All measurements were taken within one hour of the solar noon to minimize the effect of diurnal changes in solar elevation angle.
2.2. Shadow Detection and Removal in the Image Classification
Multi-stage pixel-based and object-oriented image classification methods were developed to classify land use and land cover. Shadow areas were either first detected by thresholding shadow pixels or image objects from non-shadow ones based on histogram analysis, or simply treated as one of the classes in the classification scheme. In both cases, shadows were separated into different types (i.e., SOG and SOI) based on the land cover shaded by shadows and subsequently removed by reclassifying them into corresponding informational classes, i.e., grass and impervious surfaces, respectively. The classification procedures applied to the non-shadow areas were similar with or without shadow thresholding for both the pixel-based and the object-oriented methods. Each method, however, classified the shadow areas differently.
Six land use and land cover types were identified for the study area: trees, grass, impervious surfaces, bare soil, crops, and water. Agricultural research fields of the University of Minnesota, located in the study area, were masked because the land use is not typical of those in urban-suburban environments (Figure 1). QuickBird imagery does not have a middle infrared band, which is useful for water classification. With the use of only near infrared and visible bands, it is hardly possible to distinguish water from shadows [14]. To reduce the spectral confusion between water and shadows, water in the QuickBird imagery was masked with the Ramsey County open water outlines, which were derived from 2003 aerial orthophotography utilizing stereo processing techniques.
2.2.1. Pixel-Based Methods
The pixel-based methods were implemented in the software of ERDAS Imagine (version 9.3). We chose the unsupervised ISODATA (Iterative Self-Organizing Data Analysis Technique) clustering algorithm over the supervised maximum likelihood because the imagery data of heterogeneous suburban landscape were not normally distributed, which violates the normality assumption. In addition, we found that the complex distribution of imagery data led to a large number of unclassified pixels in the supervised classification. In contrast, ISODATA does not rely on the normal probability distribution of the entire dataset and all pixels are clustered through a large number of merging and splitting iterations.
A. Without Shadow Thresholding
The commonly used ISODATA clustering algorithm was applied directly to the QuickBird imagery data. Thirty spectrally distinct clusters were identified through the iterative merging and splitting process. Each of these clusters was then examined and assigned to a meaningful information class (e.g., impervious surfaces, bare soil, trees, and grass). However, a number of spectral clusters were inevitably shadows. ISODATA clustering was applied again but only to these “shadow clusters” to separate shadows into two types: SOG and SOI. Lastly, SOG and SOI pixels were reclassified to information classes, i.e., grass and impervious surfaces, respectively.
B. With Shadow Thresholding
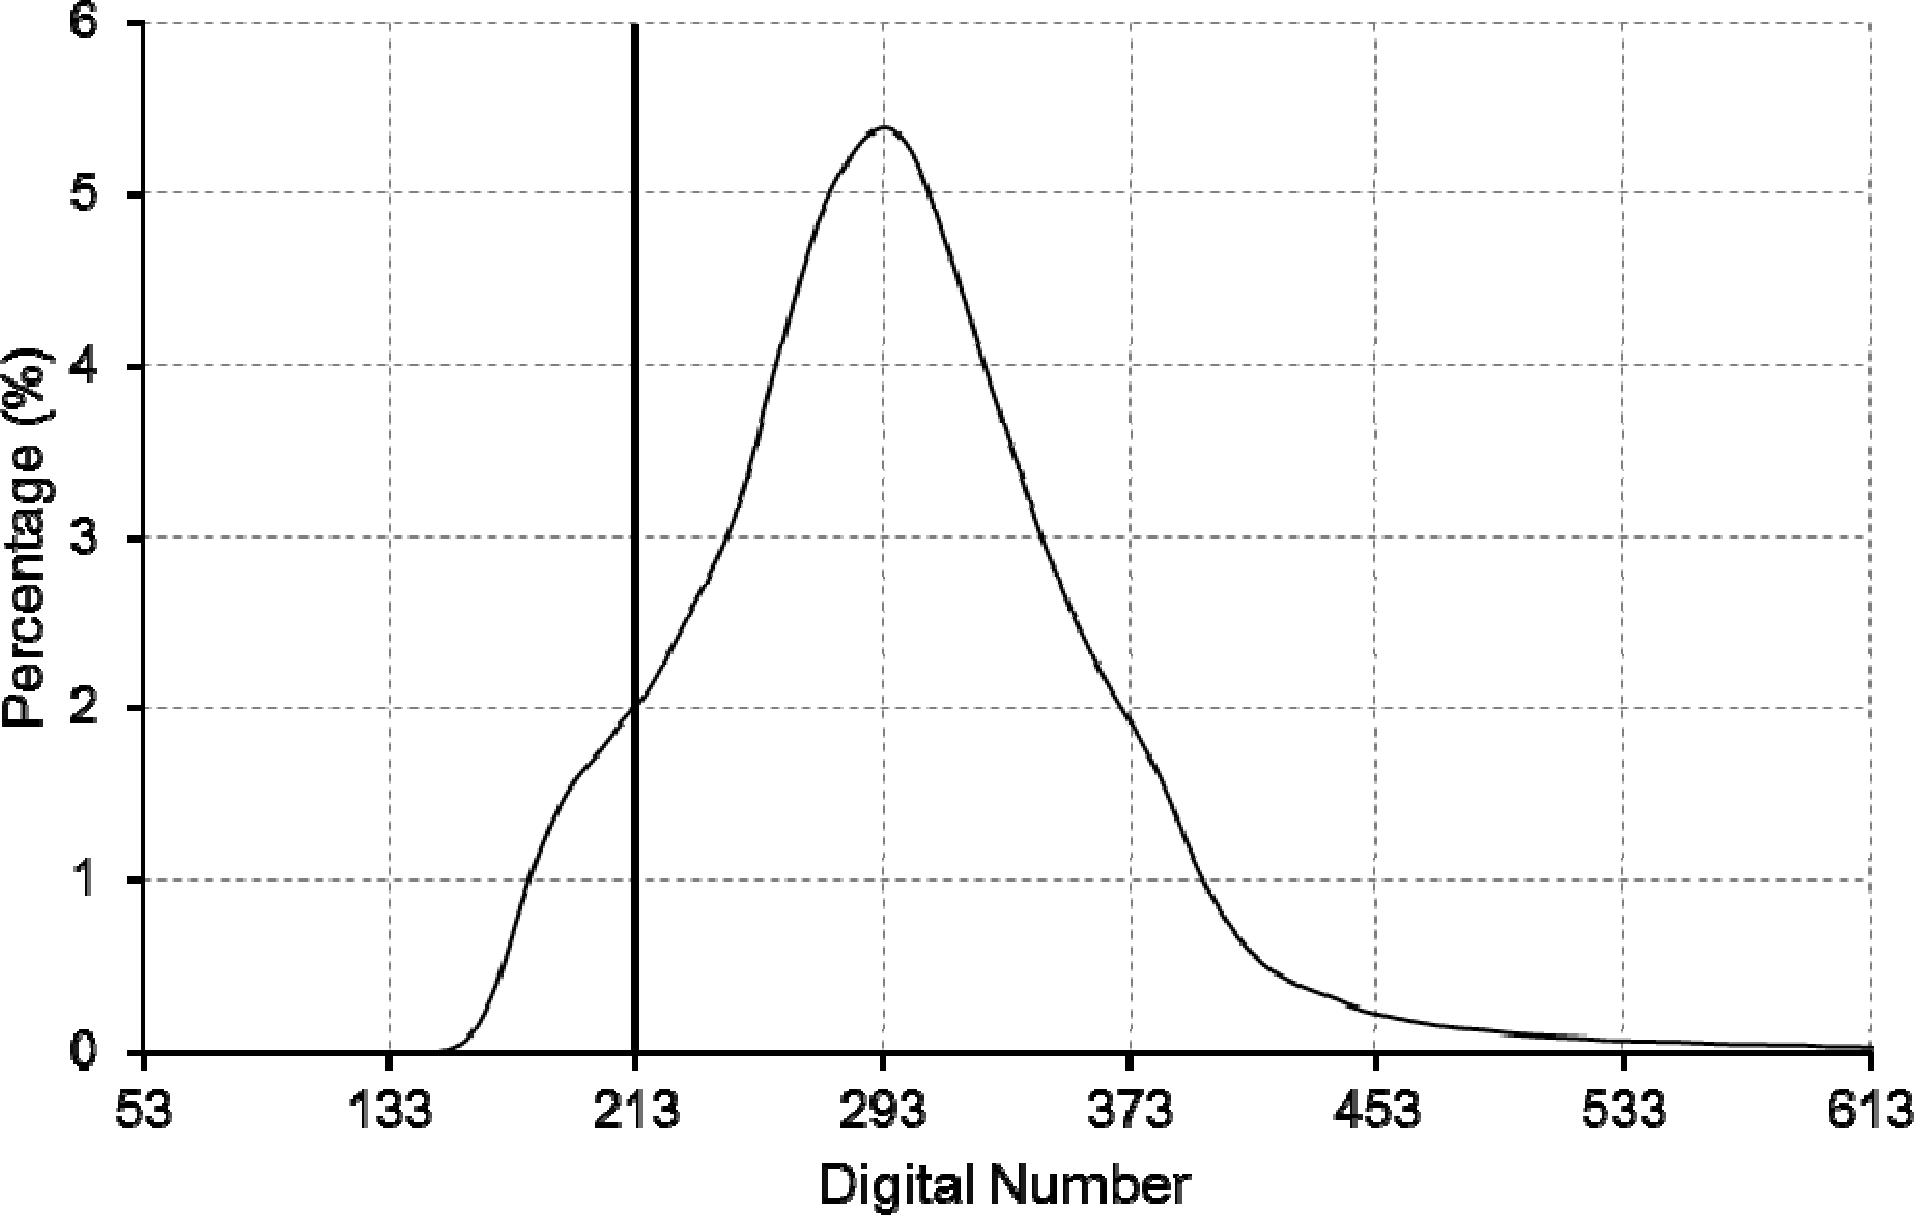
The first step in this method was to determine the threshold value for the separation of shadow pixels and non-shadow pixels. The optimal threshold was determined from the histogram of arithmetic image brightness value (BV(i,j)).
For the shadow areas, 65 shadow pixels were extracted from the QuickBird imagery to compare with field measurements and determine the spectroradiometric differences between SOG and SOI. Based on the comparison and the analysis, the ratio of the pixel value to the scene average for the NIR band (Qnir(i,j)) was used to distinguish SOG and SOI, and the threshold value of Qnir(i,j) was determined from the training samples.
2.2.2. Object-Based Methods
The object-based methods were implemented in Definiens Professional (version 5.0) which supports multiple image segmentation and classification procedures [21]. Two segmentation approaches were integrated to create image objects. The agricultural fields and water bodies were segmented with the chessboard segmentation, while the rest of the image area was segmented with the multi-resolution segmentation to generate locally homogeneous objects and to keep the global heterogeneity of the whole image.
Segmentation parameters are usually data and scene specific. Multiple segmentations with different parameters were tested until the result was satisfying at a very fine scale with the following parameters: scale, 22; color, 0.9 (shape, 0.1); and compactness, 0.5 (smoothness, 0.5). The desired objects of interest (i.e., shadows) have their own inherent scale. Scale determines the occurrence or non-occurrence of shadow objects. We selected the segmentation parameters based on the rule of thumb that optimal objects are as large as possible, yet small enough to be used as homogenous building blocks for the objects to be detected in the imagery [22]. Following the image segmentation, each of the objects was classified into one of the land cover classes with or without prior shadow thresholding, respectively.
A. Without Shadow Thresholding
The classification was conducted with fuzzy logic defined by the nearest neighbor classifier. For the high heterogeneous urban landscape, the use of nearest neighbor as classifier is advisable because a larger number of features would otherwise have to be used to separate different land use and land cover classes [21]. In particular, the nearest neighbor classifier does not rely on a continuous Gaussian distribution and is able to detect complexly shaped distributions in the feature space exactly. Fuzzy rule sets were automatically generated for each class including shadow classes (i.e., SOG and SOI) in the optimized multidimensional feature space. The degree of fuzzy membership of image objects to the specific class was computed from the hierarchy class description. An image object was assigned to the class whose evaluation returns the highest membership value. The SOG and SOI objects were further reclassified to information classes, i.e., grass and impervious surfaces, respectively.
Training of the nearest neighbor classifier was performed by manually selecting labeled samples, which are the representative image objects of individual classes. The number of samples varied with classes (e.g., 3 for SOG vs. 10 for impervious surfaces). However, overall only a few training samples were required since one sample object already covers many typical pixel samples and their variations.
B. With Shadow Thresholding
Fuzzy rule sets, defined by membership functions of object features, were developed to detect shadow and separate it into subclasses (i.e., SOG and SOI) while other land use and land cover classes were classified with the same nearest neighbor classifier as described above. Training samples were selected for all non-shadow classes.
Based on the knowledge of image content and the rationale similar to the pixel-based shadow thresholding, the brightness ( (k)) and the ratio of the object value to the scene average for the NIR band ( (k)) were calculated for each image object.
2.3. Shadow Detection and Restoration in the QuickBird Imagery
Two steps are essentially involved in detecting and removing shadows in the original QuickBird imagery: extracting shadow pixels in the satellite image and restoring the spectroradiometric information of the shadowed pixels. We extracted shadow pixels simply by overlaying the land cover maps containing SOG and SOI with the QuickBird imagery. Each of the four land cover maps generated in Section 2.2 was used separately in the overlay thus resulting in four multispectral shadow images whose pixels were potentially contaminated by shadows.
Two different methods were used to restore the spectroradiometric information of the detected shadowed pixels: the k-nearest neighbor algorithm [23] and the linear correlation correction algorithm [7]. Both were applied separately to each of the four spectral bands of the QuickBird imagery where shadow areas were identified by one of the four shadow detections.
2.3.1. k-Nearest Neighbor Algorithm
Because a particular shadow area is usually covered by the same land cover as its immediately adjacent surface, we chose k = 1 in the algorithm and simply assigned the digital number of the nearest neighbor to the shadow pixel. However, this nearest neighbor cannot be another shadow pixel and must have the same land cover as the shadow pixel. In other words, it was reasonably assumed that the surface texture of a shadow pixel was not radically different from its nearest non-shadow neighbor. Therefore, when implementing the algorithm, the neighborhood of the shadowed pixels was confined to one of two information classes, grass or impervious surfaces for SOG and SOI, respectively. Through this resampling process, the digital number of the closest pixel within the confined neighborhood was used to replace the original value of the corresponding shadow pixel.
2.3.2. Linear Correlation Correction
For comparison, the linear correlation correction method, referred to as the mean and variance transformation, was also employed to predict the uncontaminated values of shadow pixels according to the statistical characteristics of the corresponding non-shadow areas.
2.4. Accuracy Assessment of Shadow Detection, Image Classification, and Spectroradiometric Restoration
Assessment of thematic accuracy was performed separately for each of the four shadow detections and classifications. Ramsey County 2003 very high spatial resolution (0.15 m) color aerial orthophotography (spatial resolution, 0.15 m) was used as the reference image to assess the accuracy of shadow detection and removal in the classification. Google Earth 7.0 imagery and ground surveyed data of the study area were also used as ancillary data to aid in the evaluation of shadow detection and thematic accuracy.
A stratified random sampling method was used to generate the random points in ERDAS Imagine software (version 9.3). A total number of 300 random points were sampled, with at least 50 random points for each class, including SOG and SOI [24]. Although objects could be used as the sampling unit for the object-oriented classifications [25], no specific method for object sampling has been standardized in the literature. Thus, the accuracy assessment was conducted with the same set of random points in order to systematically compare the thematic accuracy of four different shadow detections and image classifications. Error matrices that describe the patterns of land use and land cover classes relative to the reference data were generated, from which the overall accuracy, user’s and producer’s accuracy, and Kappa statistics were derived.
The Z statistical test was used to determine whether the shadow detections and image classifications were significantly better than random chance [24]. Pairwise comparison of Z-scores, reflecting the difference of Kappa statistics between two methods, was further conducted to test whether one shadow detection method was significantly more accurate than another. The Z-scores of the non-shadow classifications and overall classifications after accounting for shadow detections were also calculated and compared for the same purpose.
The performance of the shadow detection and spectroradiometric restoration in the original QuickBird image was inspected by visual analysis. Shadow resolved images were compared with each other and with the original satellite imagery and the aerial orthophotography to evaluate the effectiveness of each shadow removal method. The comparison was also made to evaluate how each of the four different shadow detection methods affected the overall appearance of the QuickBird imagery and the success of spectroradiometric restoration.
3. Results
3.1. Shadow Spectral Characteristics
The brightness histogram of the QuickBird satellite imagery did not show a typical bimodal distribution as reported in the previous studies of aerial photography which has higher spatial resolution [12]. But clearly, the shadow areas mainly contributed to the lower part of the histogram that did not follow the bell-shaped curve (Figure 2). A threshold value of 213 was selected graphically for separating shadow and non-shadow areas based on the interpretation of the brightness histogram. We examined the histogram of object brightness based on the image segmentation, however, did not find an obvious threshold value between shadow and non-shadow objects.
For the shadow pixels, the analysis indicated that different types of shadow (i.e., SOG and SOI) had distinct spectroradiometric characteristics even though both had an overall low brightness (Table 1). Welch’s t-test showed that the spectral reflectances of SOG and SOI were significantly different in QuickBird’s four spectral bands. It was found from the field measurements that the spectral reflectances of SOG and SOI largely depended on the spectral characteristics of the object (either grass or impervious surfaces) upon which shadows were cast.
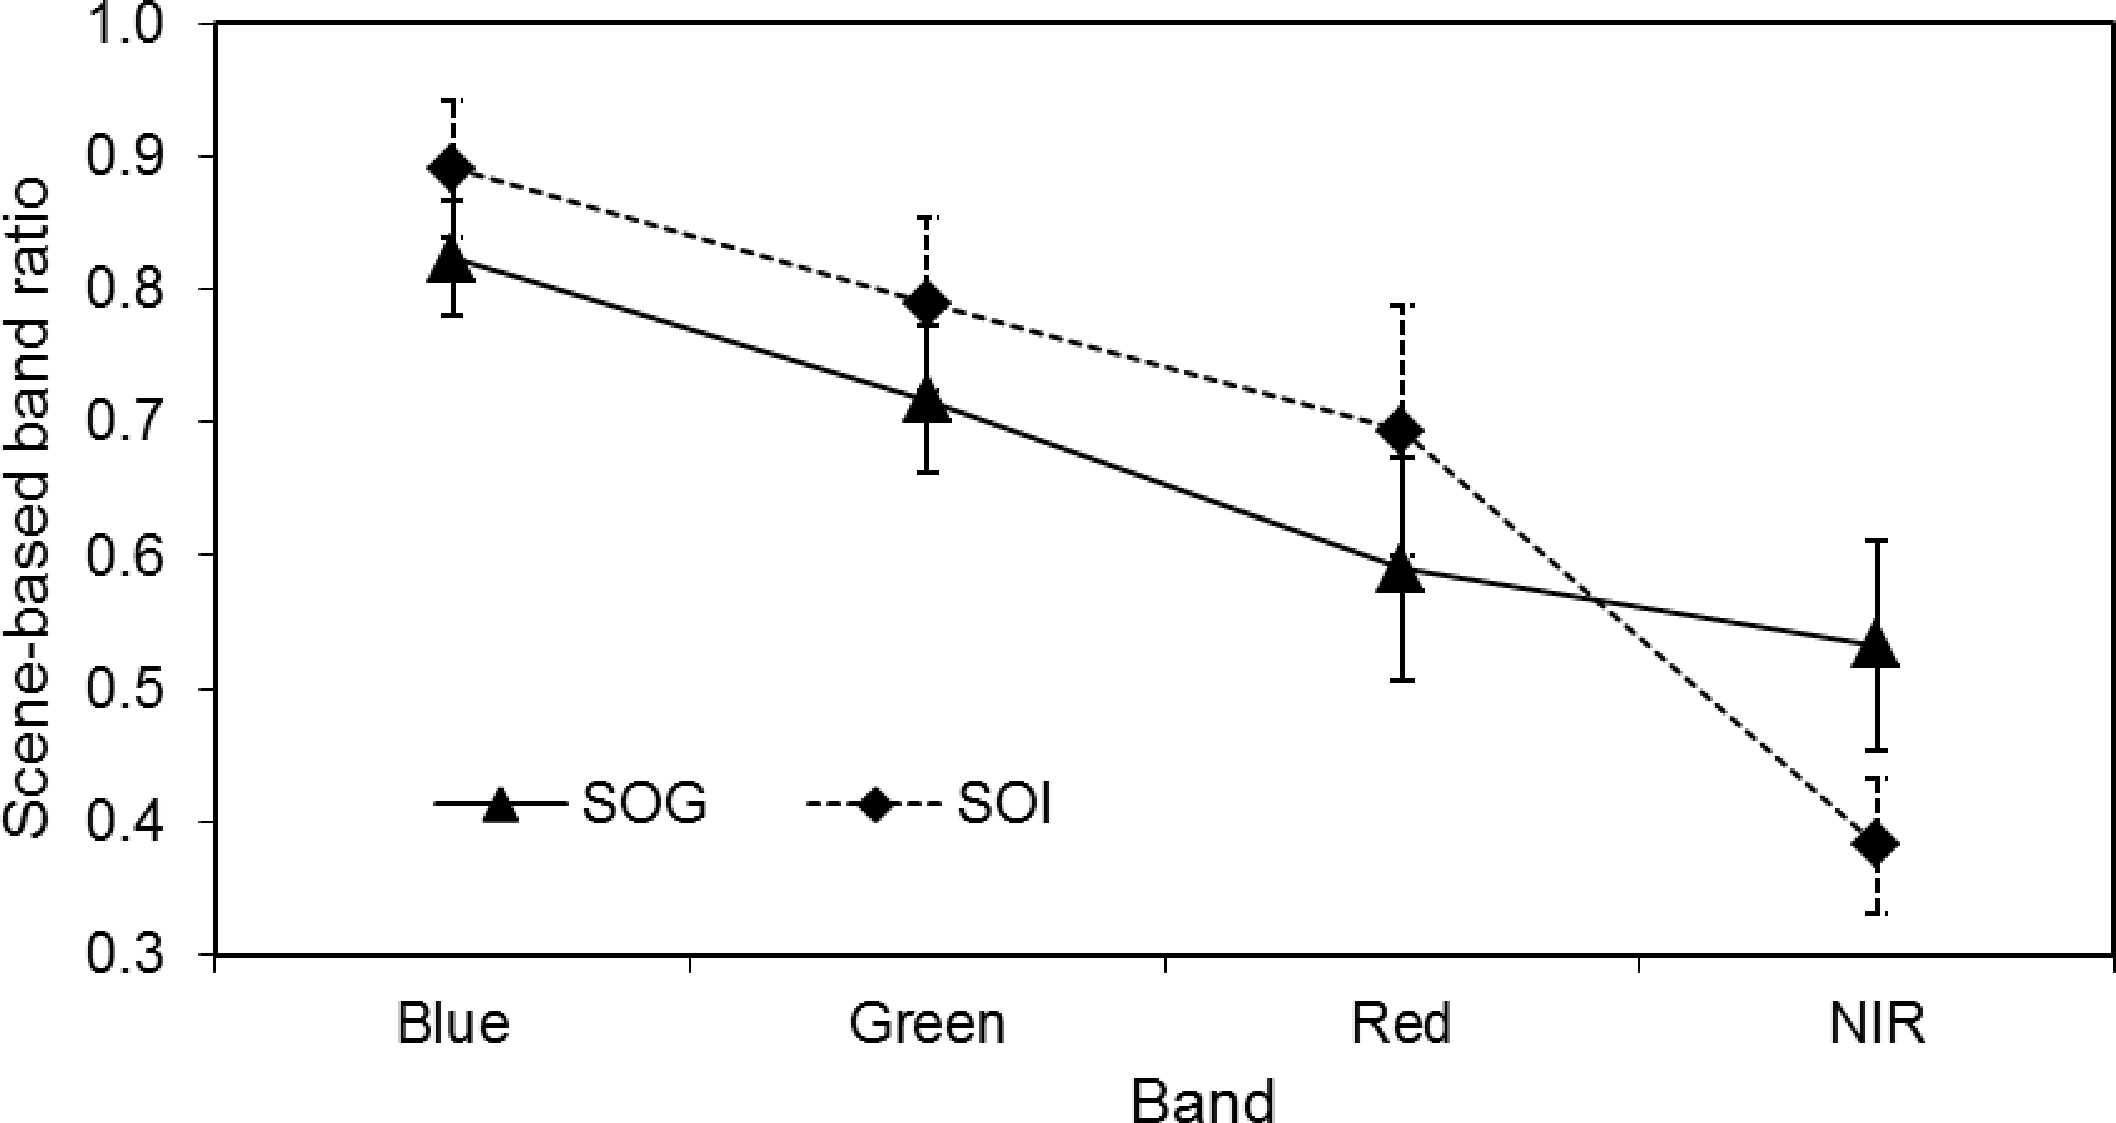
The ratios of the pixel value to the scene average for the three visible bands of SOI were consistently higher than those of SOG (Figure 3). Average Qnir(i,j) of SOI, however, was lower than that of SOG. Furthermore, NIR was the only band that the variability (one standard deviation) of the average ratio did not cause overlap between SOG and SOI. Therefore, Qnir(i,j) was used as a fuzzy feature in separating SOG and SOI, and a threshold value of 0.435 was determined from the training samples.
3.2. Shadow Detection and Classification
The results showed that shadows (i.e., the sum of SOG and SOI) accounted for 6.9%–9.1% of total land cover in the QuickBird imagery (Table 2). The exact proportions of the identified shadow areas depended on whether the detection was carried out at the pixel or object level and whether a prior shadow thresholding was applied. The pixel-based methods generally detected more shadow areas than their object-based counterparts. The prior thresholding augmented shadow areas in the pixel-based method but lessened shadow areas in the object-oriented method. With the shadow thresholding, the pixel-based ISODATA detected the most shadow areas (9.1%) among the four methods, while the object-oriented method detected the least shadow areas (6.9%). Shadows detected by the other two methods without shadow thresholding had similar area coverage although the pixel-based method detected a slightly higher proportion (7.7% vs. 7.4% with the object-oriented method).
The detected shadow areas varied from 5.9% to 7.0% for SOG and 1.0%–2.1% for SOI. All four methods detected more SOG than SOI. The proportions of SOG and SOI followed the same overall patterns as the total shadow areas. The pixel-based method identified slightly more SOG and SOI if the prior shadow thresholding was not applied. With the prior shadow thresholding, however, the proportions of SOG and SOI detected with the pixel-based method were much higher than those with the object-oriented method. The pixel-based method identified the highest proportions of SOG and SOI (7.0% and 2.1%, respectively) while the object-oriented method identified the lowest proportions (5.9% and 1.0%, respectively).
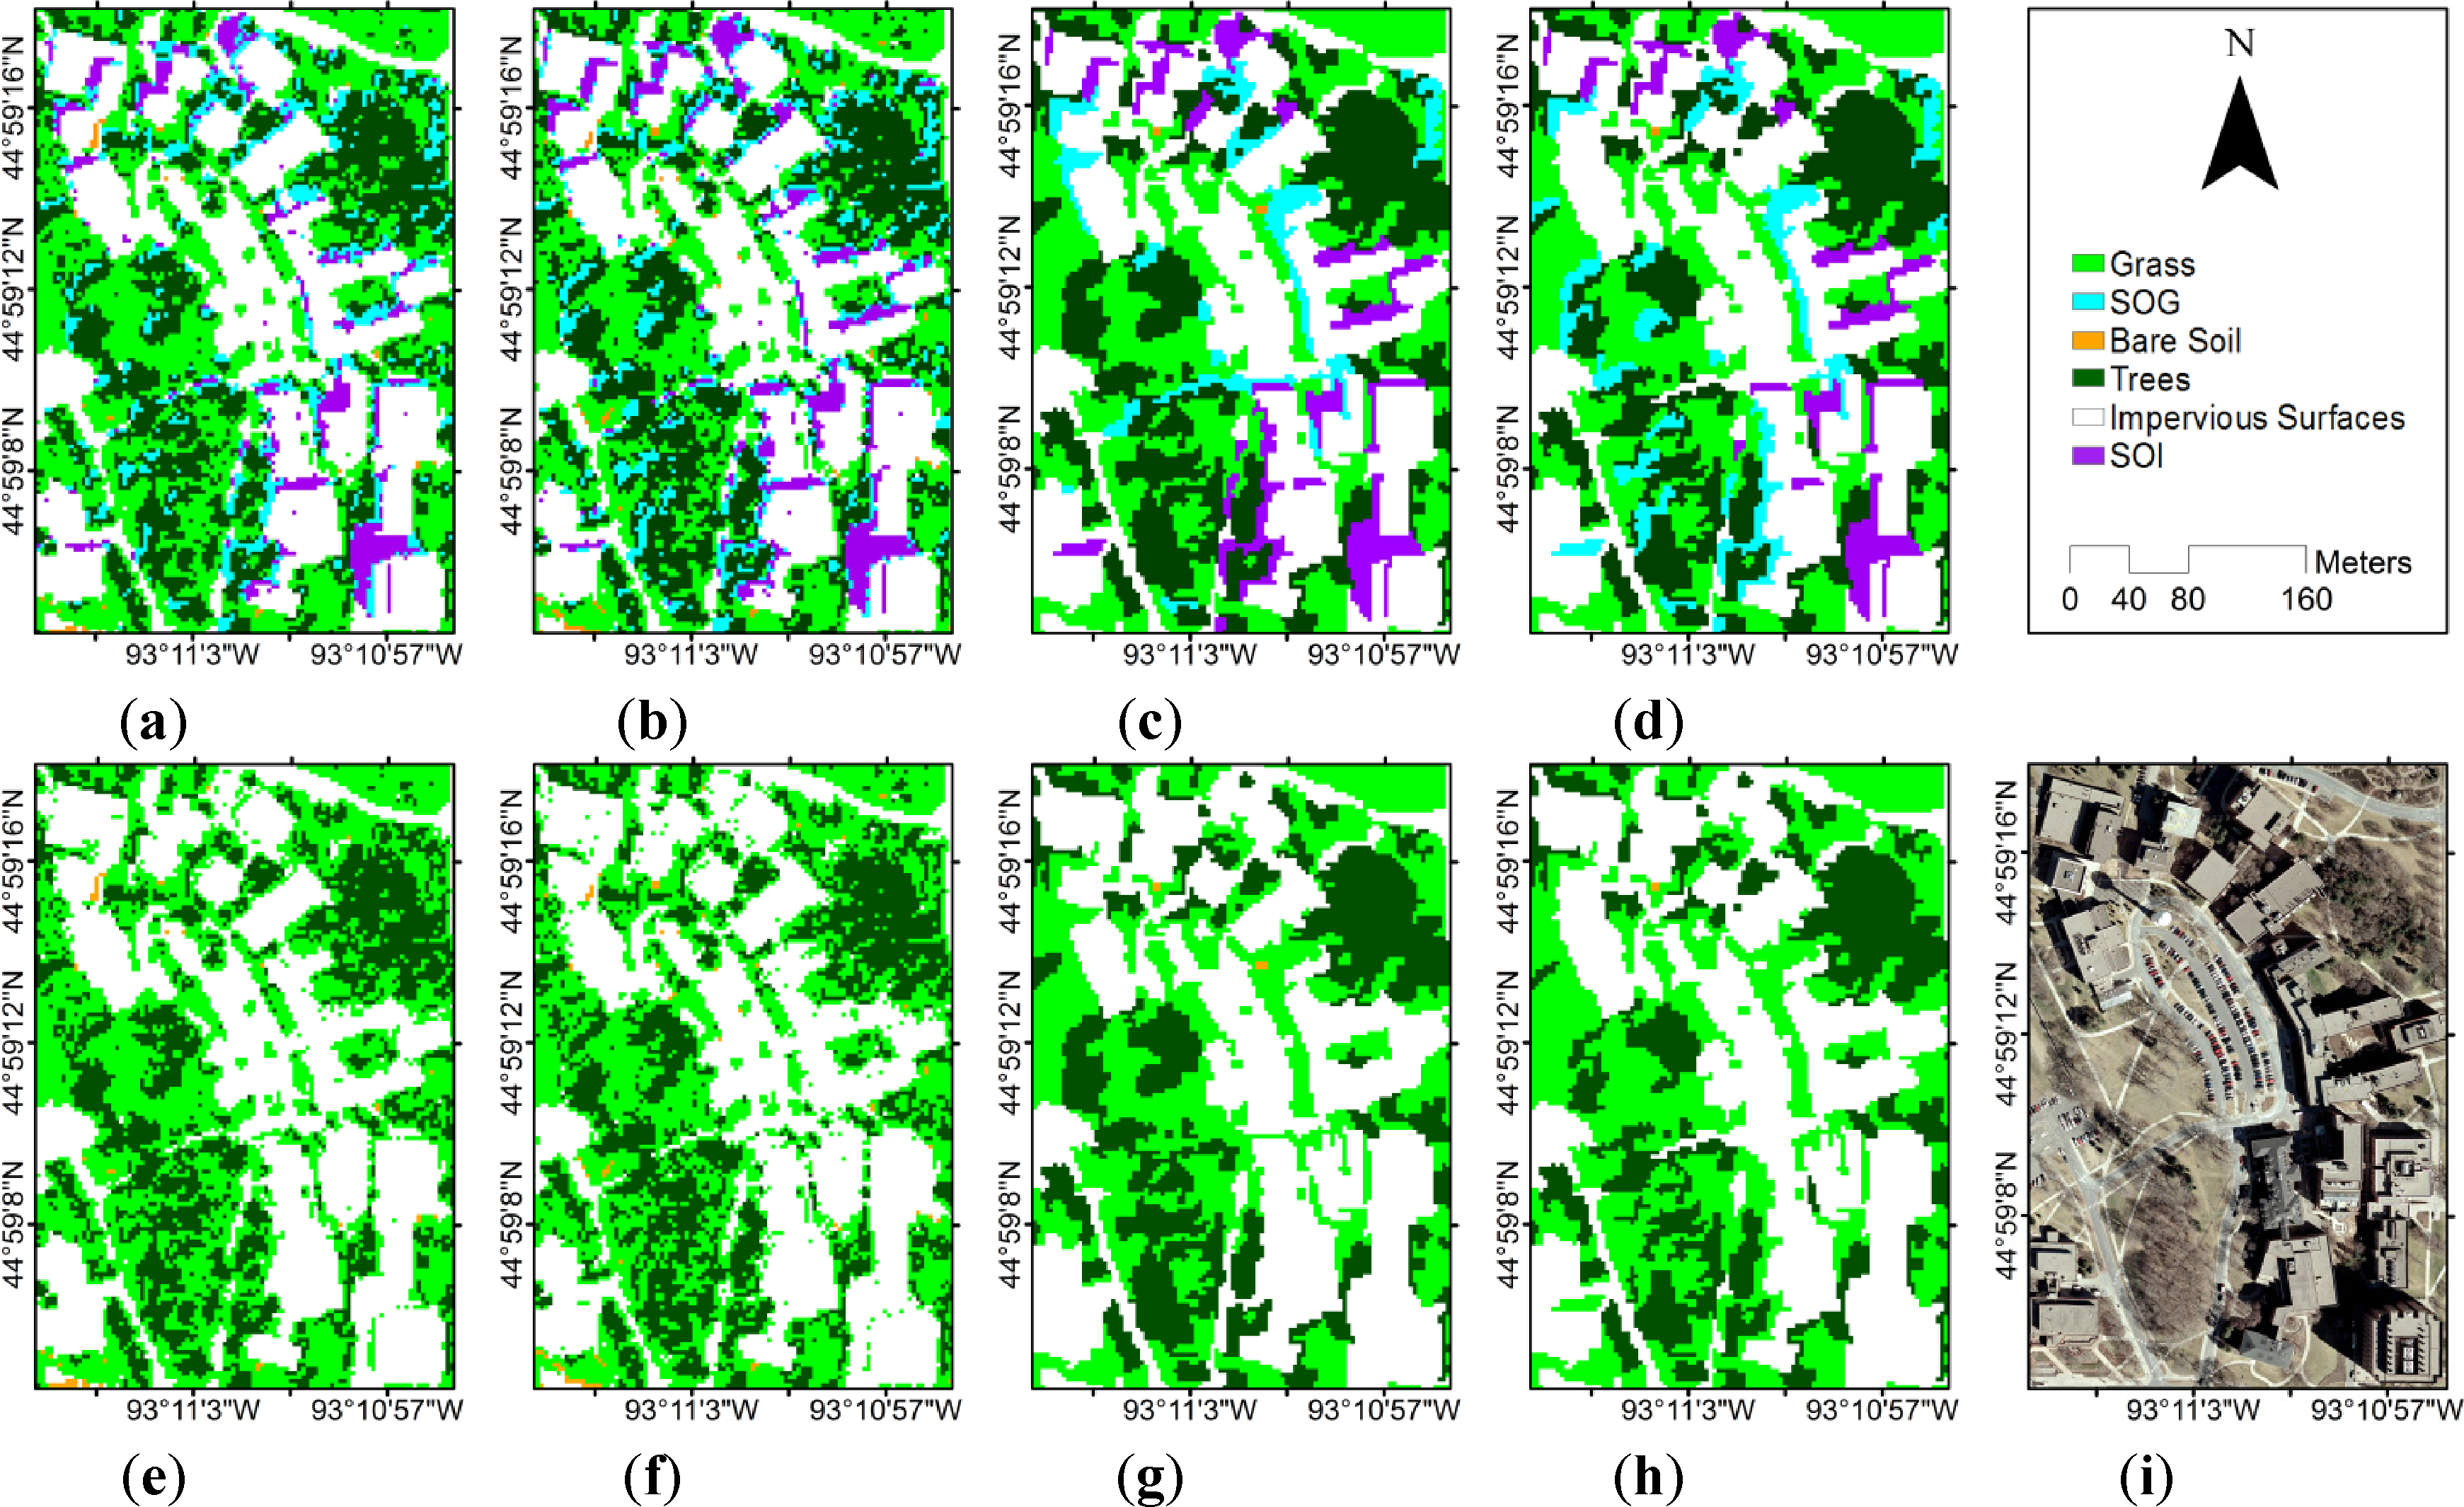
Figure 4 shows a portion of the University of Minnesota Saint Paul Campus, located in the study area, where shadows were detected and separated in the image classification. Most of the isolated pixels that were identified as SOG or SOI with the pixel-based methods were detected as non-shadow by the object-oriented methods. In other words, many isolated shadows were not able to be detected with the object-oriented methods. The figure also shows the final land use and land cover classification when all shadow areas were reclassified to information classes. By reclassifying shadows to corresponding information classes, 6.9%–9.1% of land cover was recovered in the final classification.
3.3. Image Classification before and after Shadow Removal
Depending on the shadow detection and image classification methods, the percentages of grass, trees, impervious surfaces, and bare soil for the non-shadow areas were 27.4%–31.9%, 21.6%–23.5%, 30.6%–34.9%, and 0.4%–0.5%, respectively (Table 2). Compared with the pixel-based methods, more areas were classified as impervious surfaces and fewer areas were classified as grass with the object-oriented methods, with and without the prior shadow thresholding. The object-oriented methods classified 33.6%–34.9% and 27.4%–27.8% of the land as impervious surfaces and grass, respectively; the pixel-based methods classified only 30.6%–30.7% of the land as impervious surfaces but 29.5%–31.9% of the land as grass. The object-oriented method also classified more tree areas than the pixel-based method without the prior shadow thresholding (23.5% vs. 21.6%), but classified the same tree coverage with the prior shadow thresholding (22.5%). The amount of bare soil was insignificant and relatively constant with different methods.
After SOG and SOI were removed, the proportions of grass areas and impervious surfaces increased as anticipated, by 5.9%–7.0% and 1.0%–2.1%, respectively. The increases were larger for the classifications derived from the pixel-based methods than those from the object-oriented methods. As a result, the differences of the grass areas between the pixel-based and object-oriented methods increased further in the final classifications. On average, the pixel-based methods classified 3.7% more land as grass than the object-oriented methods. After removing shadows, the proportions of impervious surfaces with the pixel-based methods were closer to, but were still less than those with the object-oriented methods (by 3.0%) due to the relatively small area coverage of SOI.
The results also indicated that the pixel-based and object-oriented methods without the prior shadow thresholding had very different effects on the final land cover classification, although both detected similar amount of shadows. The largest grass areas (38%) and smallest tree areas (21.6%) were classified with the pixel-based method while the smallest grass areas (33.4%) and the largest tree areas (23.5%) were classified with the object-oriented method. The pixel-based method also resulted in the smallest impervious surfaces (32.3%) while the object-oriented method produced the second largest impervious surfaces (35%).
The prior shadow thresholding slightly increased the classification of impervious surfaces for both the pixel-based and the object-oriented methods. However, the effects of the prior shadow thresholding on the classification of grass and trees were inconsistent between the two methods. It decreased grass areas and slightly increased tree areas in the pixel-based method but slightly increased grass areas and decreased tree areas in the object-oriented method.
3.4. Thematic Accuracy of Shadow Detection and Image Classification
The overall accuracy of shadow detection and Kappa statistics of the pixel-based methods (86.7%–89.4% and 0.75–0.79, respectively) were much higher than those of the object-oriented methods (60.7%–68.5% and 0.35–0.47, respectively) (Table 3).
The pairwise Z-score test indicated that the differences between the pixel-based and the object-oriented shadow detections, with and without the prior shadow thresholding, were statistically significant (Table 4). The prior shadow thresholding increased the overall accuracy of shadow detection in the pixel-based methods but decreased the overall accuracy in the object-oriented methods. The change of accuracy, however, was not statistically significant according to the pairwise Z-score test.
For each method with or without shadow thresholding, SOG was detected with high producer’s accuracy (73.1%–95.5%) while SOI was detected with high user’s accuracy (81.3%–95.2%) (Table 5). After accounting for chance agreement, however, SOI was identified more accurately than SOG with higher Kappa statistics (0.80–0.98). In particular, the object-oriented methods achieved much higher accuracy for SOI than that for SOG (Kappa statistics: 0.97–0.98 for SOI vs. 0.52–0.53 for SOG), although the overall shadow detection accuracy of the object-oriented methods was not as satisfactory as that of the pixel-based methods.
For the non-shadow land cover classes, it appeared that all methods achieved high and comparable overall accuracy (91.6%–93.5%) and Kappa statistics (0.88–0.91) with statically significant Z values (Table 3). The pixel-based method without the prior shadow thresholding achieved the highest Kappa statistics for grass, trees, and impervious surfaces (Table 5). This method also produced the best producer’s and user’s accuracy for grass and tree classes, and the best users’ accuracy for impervious surfaces. The object-oriented method with the prior shadow thresholding achieved the highest producers’ accuracy for impervious surfaces. Bare soil was generally classified more accurately with the object-oriented methods.
In contrast to shadow detection, the prior shadow thresholding slightly decreased the overall accuracy of non-shadow classification in the pixel-based methods, but slightly increased the overall accuracy of non-shadow classification in the object-oriented methods. However, there was no statistically significant change of accuracy.
After accounting for the accuracy of shadow detection and separation, the overall accuracy and Kappa statistics of the final image classification were higher for the pixel-based methods (91.2%–92.2% and 0.89–0.91, respectively) than for the object-oriented methods (85.2%–85.5% and 0.81–0.82, respectively) (Table 3). The pairwise Z-score test indicated that the differences between the pixel-based and the object-oriented methods, with and without the prior shadow thresholding, were statistically significant (Table 4). The effect of the prior shadow thresholding on the overall accuracy of the final image classification was minimal and not statistically significant for both the pixel-based methods and the object-oriented methods.
3.5. Spectroradiometric Restoration of Shadow Areas
Compared with the k-nearest neighbor algorithm, the linear correlation correction method needed more input parameters (i.e., the means and standard deviations of different shadow and non-shadow areas) corresponding to each of the four shadow detections. Overall, both the k-nearest neighbor algorithm and the linear correlation correction generated visually appealing images, but it was difficult to assess the radiometric accuracy of shadow restoration. The visual contrast of the shadow resolved images increased slightly because the low brightness of shadow pixels had been replaced with higher digital numbers. When comparing with the original QuickBird imagery, it appeared that most shadowed areas were either removed or significantly reduced. However, imagery corrected with the k-nearest neighbor algorithm apparently had smoother transitions from adjusted shadow areas to non-shadow areas. A large amount of “salt and pepper” speckles revealed clearly in the imagery when the linear correlation correction was applied, particularly to the shadows detected at the pixel level since most of the isolated SOG and SOI pixels were not identified at the object level.
4. Discussion
The shadows were extensive in the QuickBird imagery, but the signals recorded in shadow areas were still relatively weak. The success of separating SOG and SOI can be attributed to the high radiometric resolution of the imagery data and the intrinsic radiometric differences of the two shadow types. The large dynamic range (11 bits) potentially makes the detection and separation of shadows much easier than would be the case with low radiometric resolutions (e.g., 8 bits) [1].
As described earlier, we concentrated our effort on the shadow detection and removal with information derived from the image itself and by not using other data sources, e.g., LiDAR data. However, ancillary LiDAR data may be useful to aid in shadow detection if the data are acquired at the same time as the satellite imagery and spatial misregistration is carefully avoided. For example, LiDAR data could be used to separate ground shadows (e.g., shadows on grass) and non-ground shadows (e.g., shadows on building and trees). The latter can be further differentiated with the same method used in this study for separating SOI from SOG.
Shadows were detected with reasonable accuracy with both the pixel-based and object-oriented methods. In particular, SOI was detected more accurately than SOG, probably due to the less varied spectral characteristics of SOI compared with those of SOG [5]. We found that the spectral reflectance of SOG changed with the objects that cast shadows, especially in the NIR band, while that of SOI remained largely unchanged. This result is different from an early study that achieved better accuracy for SOG than SOI when applying the object-oriented approach to an aerial photography [12].
It should be cautioned, however, that independent assessment of the accuracy of shadow detection and particularly shadow removal, beyond visual analysis, is difficult to achieve [17]. Shadows that existed on the day of acquisition will not exist again unless imaging conditions are identical. Most likely, the reference image for validating the performance of shadow detection and removal such as the aerial photography used in this study was acquired under different sun-view illumination geometry. The ground surveyed data, even collected on the same date when the satellite image was acquired cannot be used to verify estimated pixel values for shadowed areas because the ground was covered by shadows at the time of data collection. If possible, the ground data should be collected immediately before or after image acquisition; otherwise ground features and shadows could have changed.
Among the four methods used in this study, the ones with the prior shadow thresholding and separation usually improved the efficiency of shadow detection and classification processes. The prior shadow thresholding, however, had varied effects on the amount of shadows being detected and the accuracy of detection. With the prior thresholding, the pixel-based method detected more shadow areas and with higher overall accuracy while the object-oriented method detected fewer shadow areas and with lower overall accuracy, although the changes of accuracy were not statistically significant. The differences could be caused by the fact that the same optimal threshold determined from the histogram of pixel brightness was applied to both the pixel and object level shadow thresholding. The object level shadow thresholding remains to be investigated. The statistical continuity of histogram distribution needs to be further analyzed to reduce the possible subjectivity in determining the threshold value for separating shadows from non-shadow areas.
5. Conclusions
We presented a comparison study of both pixel-based and object-oriented methods for detecting and removing shadows in the land cover classification and in the original QuickBird imagery of a suburban area. The methods were further divided by whether a prior shadow histogram thresholding and separation was used. The spectroradiometric numbers of the identified shadow areas corresponding to different shadow detection methods were subsequently corrected with the k-nearest neighbor algorithm and the linear correlation correction method, respectively.
The results indicated that different types of shadows (i.e., shadows on grass and shadows on impervious surfaces) had distinct spectroradiometric characteristics, which largely depended on the object upon which shadows were cast, even though they all had an overall low brightness. Based on this finding, shadows in the QuickBird imagery were detected with an optimal brightness threshold, and a scene-based near infrared ratio was developed to further differentiate different types of shadows.
It was found that shadows accounted for 6.9%–9.1% of total land cover in the QuickBird imagery. But the exact proportion of shadows and the accuracy of detection depended on whether shadows were identified at the pixel or object level and whether the prior shadow thresholding was applied. Without the prior shadow thresholding, the pixel-based and object-oriented methods recognized similar amount of shadow areas (7.4%–7.7%) although the former achieved higher overall accuracy (86.7% vs. 68.5%). With the prior thresholding, more shadow areas (9.1%) were detected with the pixel-based method and with higher overall accuracy (89.4%) while fewer shadow areas (6.9%) were detected with the object-oriented method and with lower overall accuracy (60.7%). Whereas the pixel-based methods were significantly more accurate than the object-oriented methods, the accuracy differences resulted from the prior thresholding were not statistically significant.
The different performance of shadow detections had substantial effects on image classification and spectroradiometric restoration. After accounting for the accuracy of shadow detection and separation, the overall accuracy of the final land cover classification was significantly higher for the pixel-based methods (91.2%–92.2%) than for the object-oriented methods (85.2%–85.5%), although both achieved similar overall accuracy for the non-shadow classes (91.6%–93.5%). In other words, the accuracy of the final land cover classification was largely dependent upon shadow detection and separation, instead of the classification of non-shadow classes.
The results showed that corrected shadow areas changed smoothly to non-shadow areas in the shadow free imagery produced with the k-nearest neighbor algorithm. The imagery with the linear correlation correction, however, displayed a large amount of “salt and pepper” speckles, particularly if the shadows were detected at the pixel level. Quantitative approaches involving ground measurement of shadow areas immediately before or after image acquisition remain to be developed to further assess the radiometric accuracy of shadow restoration.
Acknowledgments
This research was funded by a grant from the University of Minnesota, the Initiative for Renewable Energy and the Environment, and by the Intramural Research Grants from the California State University, Fullerton. We greatly appreciate the constructive suggestions of the editors and four anonymous reviewers.
Conflict of Interest
The authors declare no conflict of interest.
References
- Dare, P.M. Shadow analysis in high-resolution satellite imagery of urban areas. Photogramm. Eng. Remote Sens 2005, 71, 169–177. [Google Scholar]
- Yuan, F.; Bauer, M.E. Mapping Impervious Surface Area Using High Resolution Imagery: A Comparison of Object-Oriented Classification to Per-Pixel Classification. Proceedings of ASPRS 2006 Annual Conference, Reno, NV, USA, 1–5 May 2006; 3, pp. 1667–1674.
- Susaki, J. Segmentation of shadowed buildings in dense urban areas from aerial photographs. Remote Sens 2012, 4, 911–933. [Google Scholar]
- Leblon, B.; Gallant, L.; Granberg, H. Effects of shadowing types on ground-measured visible and near-infrared shadow reflectances. Remote Sens. Environ 1996, 58, 322–328. [Google Scholar]
- Wu, J.; Bauer, M.E. Estimating net primary production of turfgrass in an urban-suburban landscape with QuickBird imagery. Remote Sens 2012, 4, 849–866. [Google Scholar]
- Shackelford, A.K.; Davis, C.H. A combined fuzzy pixel-based and object-based approach for classification of high-resolution multispectral data over urban areas. IEEE Trans. Geosci. Remote Sens 2003, 41, 2354–2363. [Google Scholar]
- Sarabandi, P.; Yamazaki, F.; Matsuoka, M.; Kiremidjian, K. Shadow Detection and Radiometric Restoration in Satellite High Resolution Images. Proceedings of 2004 IEEE International Geoscience and Remote Sensing Symposium (IGARSS ’04), Anchorage, AK, USA, 20–24 September 2004; 6, pp. 3744–3747.
- Chen, Y.; Wen, D.; Jing, L.; Shi, P. Shadow information recovery in urban areas from very high resolution satellite imagery. Int. J. Remote Sens 2007, 28, 3249–3254. [Google Scholar]
- Salvador, E.; Cavallaro, A.; Ebrahimi, T. Shadow Identification and Classification Using Invariant Color Models. Proceedings of 2001 IEEE International Conference on Acoustics, Speech, and Signal Processing (ICASSP ’01), Salt Lake City, UT, USA, 7–11 May 2001; 3, pp. 1545–1548.
- Tsai, V.U.D. A comparative study on shadow compensation of color aerial images in invariant color models. IEEE Trans. Geosci. Remote Sens 2006, 44, 1661–1671. [Google Scholar]
- Chung, K.-L.; Lin, Y.-R.; Huang, Y.-H. Efficient shadow detection of color aerial images based on successive thresholding scheme. IEEE Trans. Geosci. Remote Sens 2009, 47, 671–682. [Google Scholar]
- Zhou, W.; Huang, G.; Troy, A.; Cadenasso, M.L. Object-based land cover classification of shaded areas in high spatial resolution imagery of urban areas: A comparison study. Remote Sens. Environ 2009, 113, 1769–1777. [Google Scholar]
- Rau, J.Y.; Chen, N.Y.; Chen, L.C. True orthophoto generation of built-up areas using multi-view images. Photogramm. Eng. Remote Sens 2002, 68, 581–588. [Google Scholar]
- Li, Y.; Gong, P.; Sasagawa, T. Integrated shadow removal based on photogrammetry and image analysis. Int. J. Remote Sens 2005, 26, 3911–3929. [Google Scholar]
- Yuan, F. Land-cover change and environmental impact analysis in the Greater Mankato area of Minnesota using remote sensing and GIS modeling. Int. J. Remote Sens 2008, 29, 1169–1184. [Google Scholar]
- Kasetkasem, T.; Varshney, P.K. An optimum land cover mapping algorithm in the presence of shadow. IEEE J. Sel. Top. Signal Process 2011, 5, 592–605. [Google Scholar]
- Lorenzi, L.; Melgani, F.; Mercier, G. A complete processing chain for shadow detection and reconstruction in VHR images. IEEE Trans. Geosci. Remote Sens 2012, 50, 3440–3452. [Google Scholar]
- Benz, U.C.; Hofmann, P.; Willhauck, G.; Lingenfelder, L.; Heynen, M. Multi-resolution, object-oriented fuzzy analysis of remote sensing data for GIS-ready information. ISPRS J. Photogramm. Remote Sens 2004, 58, 239–258. [Google Scholar]
- Liu, W.; Yamazaki, F. Object-based shadow extraction and correction of high-resolution optical satellite images. IEEE J. Sel. Top. Appl. Earth Obs. Remote Sens 2012, 5, 1296–1302. [Google Scholar]
- Wu, J.; Wang, D.; Bauer, M.E. Image-based atmospheric correction of QuickBird imagery of Minnesota cropland. Remote Sens. Environ 2005, 99, 315–325. [Google Scholar]
- Definiens. Definiens Professional 5 Reference Book; Definiens AG: Munich, Germany, 2006. [Google Scholar]
- Baatz, M.; Schäpe, A. Multiresolution Segmentation—An Optimization Approach for High Quality Multi-Scale Image Segmentation. In Angewandte Geographische Informations-Verarbeitung XII; Strobl, J., Blaschke, T., Greisebener, G., Eds.; Wichmann Verlag: Karlsruhe, Germany, 2000; pp. 12–23. [Google Scholar]
- Duda, R.O.; Hart, P.E. Pattern Classification and Scene Analysis, 1st ed.; Wiley: New York, NY, USA, 1973. [Google Scholar]
- Congalton, R.G.; Green, K. Assessing the Accuracy of Remotely Sensed Data: Principles and Practices, 2nd ed.; CRC/Taylor and Francis: Boca Raton, FL, USA, 2009. [Google Scholar]
- Radoux, J.; Bogaert, P.; Fasbender, D.; Defourny, P. Thematic accuracy assessment of geographic object-based image classification. Int. J. Geogr. Inf. Sci 2011, 25, 895–911. [Google Scholar]


| Band | Blue | Green | Red | NIR |
|---|---|---|---|---|
| (%) | −7.58 | −8.57 | −13.47 | 23.93 |
| d.f. | 19 | 20 | 19 | 34 |
| t* | −6.57 | −4.96 | −6.69 | 7.59 |
a refers to the reflectance differences between shadows on grass (SOG) and shadows on impervious surfaces (SOI). d.f. is the degree of freedom.t* indicates that is significant at the 0.001 probability level.
| Classification | Class | Before Shadow Removal | After Shadow Removal | ||
|---|---|---|---|---|---|
| Pixel-based | Without Thresholding | Shadow | SOG | 6.1 | 0 |
| SOI | 1.6 | 0 | |||
| Grass | 31.9 | 38.0 | |||
| Non-shadow | Trees | 21.6 | 21.6 | ||
| Impervious | 30.7 | 32.3 | |||
| Bare Soil | 0.5 | 0.5 | |||
| With Thresholding | Shadow | SOG | 7.0 | 0 | |
| SOI | 2.1 | 0 | |||
| Grass | 29.5 | 36.5 | |||
| Non-shadow | Trees | 22.5 | 22.5 | ||
| Impervious | 30.6 | 32.7 | |||
| Bare Soil | 0.5 | 0.5 | |||
| Object-oriented | Without Thresholding | Shadow | SOG | 6.0 | 0 |
| SOI | 1.4 | 0 | |||
| Grass | 27.4 | 33.4 | |||
| Non-shadow | Trees | 23.5 | 23.5 | ||
| Impervious | 33.6 | 35.0 | |||
| Bare Soil | 0.5 | 0.5 | |||
| With Thresholding | Shadow | SOG | 5.9 | 0 | |
| SOI | 1.0 | 0 | |||
| Grass | 27.8 | 33.7 | |||
| Non-shadow | Trees | 22.5 | 22.5 | ||
| Impervious | 34.9 | 35.9 | |||
| Bare Soil | 0.4 | 0.4 | |||
aSOG and SOI refer to shadows on grass and shadows on impervious surfaces, respectively.
| Pixel-Based | Object-Oriented | ||||
|---|---|---|---|---|---|
| Without Thresholding | With Thresholding | Without Thresholding | With Thresholding | ||
| Shadow Detection | OA (%) | 86.7 | 89.4 | 68.5 | 60.7 |
| K̂ | 0.75 | 0.79 | 0.47 | 0.35 | |
| Z* | 8.1 | 8.5 | 4.6 | 3.4 | |
| Non-shadow Classification | OA (%) | 93.5 | 91.6 | 92.1 | 92.9 |
| K̂ | 0.91 | 0.88 | 0.89 | 0.90 | |
| Z* | 32.3 | 31.2 | 31.2 | 35.2 | |
| Overall Classification | OA (%) | 92.2 | 91.2 | 85.2 | 85.5 |
| K̂ | 0.91 | 0.89 | 0.81 | 0.82 | |
| Z* | 38.6 | 37.7 | 29.8 | 30.3 | |
aOA is the overall accuracy (%).Z* indicates that Kappa statistic. (K̂) is significant at the 0.001 probability level.
| Pixel-Based | Object-Oriented | ||||
|---|---|---|---|---|---|
| Without Thresholding | With Thresholding | Without Thresholding | With Thresholding | ||
| Pixel-based | Without Thresholding | - | 0.60 | 2.78 ++ | 2.51 ++ |
| With Thresholding | 0.31 | - | 2.22 + | 1.95 + | |
| Object-oriented | Without Thresholding | 2.04 + | 2.33 ++ | - | 0.26 |
| With Thresholding | 2.87 ++ | 3.16 ++ | 0.83 | - | |
+Indicates that the difference between two methods is significant at the 0.05 probability level.++Indicates that the difference is significant at the 0.01 probability level.
| Classification | Class | PA (%) | UA (%) | K̂ | ||
|---|---|---|---|---|---|---|
| Pixel-based | Without Thresholding | Shadow | SOG | 94.7 | 75.0 | 0.73 |
| SOI | 80.8 | 91.3 | 0.90 | |||
| Grass | 96.2 | 98.0 | 0.97 | |||
| Non-shadow | Trees | 97.5 | 95.1 | 0.94 | ||
| Impervious | 89.2 | 98.3 | 0.98 | |||
| Bare Soil | 94.6 | 81.8 | 0.80 | |||
| With Thresholding | Shadow | SOG | 95.5 | 80.8 | 0.79 | |
| SOI | 81.3 | 81.3 | 0.80 | |||
| Grass | 91.1 | 92.7 | 0.91 | |||
| Non-shadow | Trees | 96.4 | 91.4 | 0.89 | ||
| Impervious | 90.2 | 97.4 | 0.96 | |||
| Bare Soil | 80.0 | 88.9 | 0.88 | |||
| Object-oriented | Without Thresholding | Shadow | SOG | 73.9 | 56.7 | 0.52 |
| SOI | 64.5 | 95.2 | 0.98 | |||
| Grass | 90.9 | 86.2 | 0.83 | |||
| Non-shadow | Trees | 92.4 | 89.7 | 0.86 | ||
| Impervious | 93.8 | 92.6 | 0.89 | |||
| Bare Soil | 86.7 | 92.9 | 0.98 | |||
| With Thresholding | Shadow | SOG | 73.1 | 57.6 | 0.53 | |
| SOI | 50.0 | 93.8 | 0.97 | |||
| Grass | 94.7 | 90.0 | 0.87 | |||
| Non-shadow | Trees | 91.7 | 90.2 | 0.87 | ||
| Impervious | 97.6 | 92.1 | 0.89 | |||
| Bare Soil | 92.9 | 92.9 | 0.97 | |||
aSOG and SOI refer to shadows on grass and shadows on impervious surfaces, respectively.
© 2013 by the authors; licensee MDPI, Basel, Switzerland This article is an open access article distributed under the terms and conditions of the Creative Commons Attribution license ( http://creativecommons.org/licenses/by/3.0/).
Share and Cite
Wu, J.; Bauer, M.E. Evaluating the Effects of Shadow Detection on QuickBird Image Classification and Spectroradiometric Restoration. Remote Sens. 2013, 5, 4450-4469. https://doi.org/10.3390/rs5094450
Wu J, Bauer ME. Evaluating the Effects of Shadow Detection on QuickBird Image Classification and Spectroradiometric Restoration. Remote Sensing. 2013; 5(9):4450-4469. https://doi.org/10.3390/rs5094450
Chicago/Turabian StyleWu, Jindong, and Marvin E. Bauer. 2013. "Evaluating the Effects of Shadow Detection on QuickBird Image Classification and Spectroradiometric Restoration" Remote Sensing 5, no. 9: 4450-4469. https://doi.org/10.3390/rs5094450