Geo-Correction of High-Resolution Imagery Using Fast Template Matching on a GPU in Emergency Mapping Contexts

Abstract
: The increasing availability of satellite imagery acquired by existing and new sensors allows a wide variety of new applications that depend on the use of diverse spectral and spatial resolution data sets. One of the pre-conditions for the use of hybrid image data sets is a consistent geo-correction capacity. We demonstrate how a novel fast template matching approach implemented on a graphics processing unit (GPU) allows us to accurately and rapidly geo-correct imagery in an automated way. The key difference with existing geo-correction approaches, which do not use a GPU, is the possibility to match large source image segments (8,192 by 8,192 pixels) with relatively large templates (512 by 512 pixels) significantly faster. Our approach is sufficiently robust to allow for the use of various reference data sources. The need for accelerated processing is relevant in our application context, which relates to mapping activities in the European Copernicus emergency management service. Our new method is demonstrated over an area northwest of Valencia (Spain) for a large forest fire event in July 2012. We use the Disaster Monitoring Constellation’s (DMC) DEIMOS-1 and RapidEye imagery for the delineation of burnt scar extent. Automated geo-correction of each full resolution image set takes approximately one minute. The reference templates are taken from the TerraColor data set and the Spanish national ortho-imagery database, through the use of dedicated web map services. Geo-correction results are compared to the vector sets derived in the Copernicus emergency service activation request.1. Introduction
The use of satellite imagery in post-disaster mapping contexts is a relatively new remote sensing discipline [1–3]. In Europe, a certain maturity in this domain has been reached with the introduction, in 2012, of an operational emergency management service (EMS) as part of the Copernicus program (previously known as Global Monitoring for Environment and Security (GMES)). The rush-mode service component of EMS aims to provide post-event impact delineation and grading map products at the request of users who are active in the response and recovery phases of disaster management, typically European civil protection authorities. Timely provision of these post-event analysis products is a key requirement. The digital map products are primarily aimed at direct map dissemination and integration into the geographic information system (GIS) environment of the requestor, in order to integrate the impact information with existing reference information and situation reports. Geometric and thematic accuracy are, therefore, additional quality parameters that determine the fitness for the purposes of service output and, ultimately, the satisfaction of the end user with the service. A description of the service set-up, the modus operandi and access to publicly releasable map products can be found in [4].
One of the key characteristics of the EMS rush mode service is the need to be able to process diverse types of satellite sensor imagery. This is facilitated by the data supply mechanism set up under the Copernicus Data Access Portfolio which is implemented by the European Space Agency (ESA-DAP) [5], which enables the tasking of different sensors grouped by resolution class and sensor type (optical or synthetic aperture radar (SAR)). Tasking of the most suitable resolution class is guided by the map scale requested by the service user, the event at hand (e.g., forest fires will normally use optical sensors, whereas for flood events, SAR acquisitions are prioritized) and the feasibility to acquire the earliest acquisition after the request was made (e.g., taking orbit characteristics and, for optical sensors, weather forecasts into account). Where needed, recent satellite archive imagery may be ordered to establish the reference situation. In Europe, however, the EMS service increasingly benefits from access to high resolution ortho-imagery available in the national mapping and cadastral agencies. Access to these, and other reference data sets, is facilitated under an agreement between Eurogeographics, the membership association of the European cadastre, land registry and national mapping authorities, and the European Environment Agency, acting as the Copernicus in situ coordinator.
Methodologically, impact delineation and grading is based on the comparison between one pre- and, one or more, post-event image sets. The related processing steps are geared to prepare the image sets for optimal use in (semi-)automated and manual interpretation of the radiometric and spatial image artifacts that are the result of the event impact. For forest fire, the impact interpretation is primarily based on the strong spectral differences between healthy vegetation and (partially) burnt vegetation, where needed, differentiated by pre-event vegetation type (forest, shrubs, grass, heather) [6]. For floods, the detection of the inundated areas may be based on a combination of radiometric differences (e.g., a drop in the backscattering coefficient in SAR the pre- and post-image pair) and changes in spatial patterns (e.g., the disappearance of edge and point features in the inundated landscape) [7]. The suitability of the use of different sensors to carry out the pre- and post-image comparison depends on the possibility of generating similar event-specific thematic information layers, at the spatial resolution that is compatible with the required map scale. For forest fires, the normalized difference vegetation index (NDVI), is often suitable, requiring sensors with a combination of visible (usually red) and near-infrared spectral bands. Most optical satellite sensors, therefore, qualify. Combining SAR images for flood delineation is more subtle, though, as important land use classes in inundated areas (e.g., urban areas, forest and partially inundated crop land) have distinct angular, polarimetric and microwave frequency-dependent scattering behavior. This effectively constrains the use of pre- and post-event SAR image pairs in such cases.
A common requirement for the use of satellite sensor imagery is the ability to correctly geo-register pre- and post-event image sets, whether they are from the same sensor or from different platforms. Geo-registration quality must adhere to the technical requirements of the resulting map product, i.e., to the tolerable measurement error that is determined by the map scale. In practice, users have stated that the timeliness and thematic accuracy of the post-event map is more important than an exact geometric accuracy, especially if the map products are provided in the context of an evolving event, e.g., fires that are not yet under control or ongoing floods. In fact, since the time lapse between map request and the delivery of the map product can be significant (typically between 16 and 48 hours), the geometric representation of the event impact in the map may no longer correspond to the actual situation. Geometric accuracy is more important if the map product is used to describe the end-state of the event impact. Finally, the reference data situation across geographical areas (e.g., European countries) is diverse, i.e., access to detailed digital terrain models and ground control points is highly variable under the time constraints for rush mode mapping. A simpler approach, based on template matching, is preferable to a full-fledged ortho-rectification approach, also because the latter is a computationally expensive, time-consuming processing step.
In the next section, we describe a template matching approach to geo-correction of imagery from diverse sensors platforms. We introduce the use of graphical processor units (GPU), which drastically speed up the computational processing required in template matching, leading to a robust application framework for image-to-image and image-to-reference co-registration. In Section 3, we introduce the data sets that we have used in this study for a large forest fire event near Valencia, Spain, in July 2012. The subsequent section describes the results of the geo-referencing steps carried out on the test data sets, discussing computational performance and resulting geo-location accuracies. In the concluding section, we summarize the study results and outline some ideas for future work.
2. Methodology
2.1. Geo-Correction Requirement
Modern Earth observation satellite sensors are designed to provide imagery with a relatively high positional accuracy. For instance, the recently launched very high resolution Pleiades 1A and 1B sensors boost an image location accuracy, without the use of ground control points, of 3 m (CE90). Even though this is only 6-times the nominal, at-nadir, image pixel spacing of 0.50 m, correction with ground control points is required to bring this accuracy within a 1 pixel accuracy, which would be required for consistent mapping at scales 1:2,000–1:5,000, which is feasible with this image quality. Legacy satellite sensors have positional accuracies in the 100–1,000 m range, but a number of operational and historical sensors exist for which positional accuracy can vary significantly [8].
Ground control point (GCP) selection for use in image geo-referencing is required to provide an external positional reference coordinate that allows the internal geometry of the image to be matched with the real terrain coordinates for the area that is imaged by the sensor [9,10]. Traditionally, one or more GCPs are identified in a visual interpretation step, identifying the pixel location in the image at which a known geographical position is located. Typically, a GCP is selected for a well delineated, high contrast object, with a discrete geometry (e.g., a corner) that is recognizable in the image. An alternative to manual GCP selection is the use of template matching, which is based on locating a known reference image in the newly acquired sensor image [11]. The number of GCPs required depends on the distortions that need to be corrected in the imagery. If only a translation is required, a single GCP suffices. For an affine transformation, 4 GCPs are needed.
Most template matching techniques are based on some form of local convolution computation approach, where the localized maximum corresponds to the best fit, i.e., the matched location. For instance, the open source OpenCV computer vision software package contains a matchTemplate routine, which can use (normalized) squared difference or cross-correlation coefficients as the matching metrics [12]. Since convolution is a computationally expensive operation when applied in the spatial domain, both the matching templates must be kept small and the local search area in the image limited. Template matching is a feature of various commercial image processing software tools, as well (e.g., ERDAS Imagine, PCI Geomatics, [13]). The new Landsat-8 ground segment applies a template matching routine to the sensor imagery, combining very precise ephemeris data with the matching of a small 64 by 64 pixel template selected from local and global reference layers [14].
In [8], we presented a novel approach using very fast large template matching applied to full resolution images and large templates. This approach was developed on the basis of previous work [15] and deploys the phase correlation image alignment method, which is based on the Fourier Shift Theorem (see [10] for a comprehensive review). The key advantage of correlation approaches based on Fourier transforms is that the convolution of two images in the spatial domain can be calculated as a multiplication of the image transform in the frequency domain. Since computer implementations of Fourier transforms are highly optimized [16], a considerable speed up can be expected. In the next section, we describe a number of optimization steps that allows us to scale up this technique in order to apply it in the fast mapping workflow that is required in emergency mapping contexts.
2.2. General Introduction to GPU Computing
A key difference with existing methods is the implementation of our method on a graphics processing unit (GPU). A GPU is the specialized chip design that allows rapid manipulation and alteration of memory to accelerate the creation of images in a frame buffer intended for output to a display. General-purpose computation on GPU (GPGPU) is a growing technique to enhance the computational power of parallel programs by exploiting the GPU multiple processing cores for general purpose scientific computations. Dedicated GPGPU devices, like NVIDIA’s Tesla C1060 cards, which we use in our work, are less concerned with the preparation of computer graphics outputs. They can be programmed to solve a large range of massively parallel computational problems, including image processing solutions.
The most popular programming model to take advantage of GPU-accelerated computing is the NVIDIA proprietary language, CUDA (Compute Unified Device Architecture), which is made accessible via a variety of standard programming languages (e.g., C/C++, Java). In the last few years, many algorithm libraries (Fast Fourier Transforms (FFT), Basic Linear Algebra Subprograms (BLAS), Linear Algebra PACKAge (LAPACK), etc.) have been ported to this architecture [17], as well as language wrappers, making it easier to program such devices [18] and speeding up development and integration. OpenCL (open computer language) provides an open alternative to CUDA, though it includes only a subset of the libraries that are required in our work.
The number of applications of GPU parallel techniques to image processing is growing, in particular, in the medical imaging domain (e.g., [19,20]). Some recent work describes GPU use in airborne sensor data processing [21–25]. However, not many have yet been deeply explored for satellite remote sensing applications [26], especially for algorithms that go beyond those provided in the CUDA example code library. Our initial focus has been on the implementation of the geo-correction procedure, because it is the fundamental pre-processing step precedent to any further processing, which needs to be presented in a geographically consistent analysis context, for instance, the change detection functionality that is required in the emergency mapping context.
2.3. Fast Template Matching
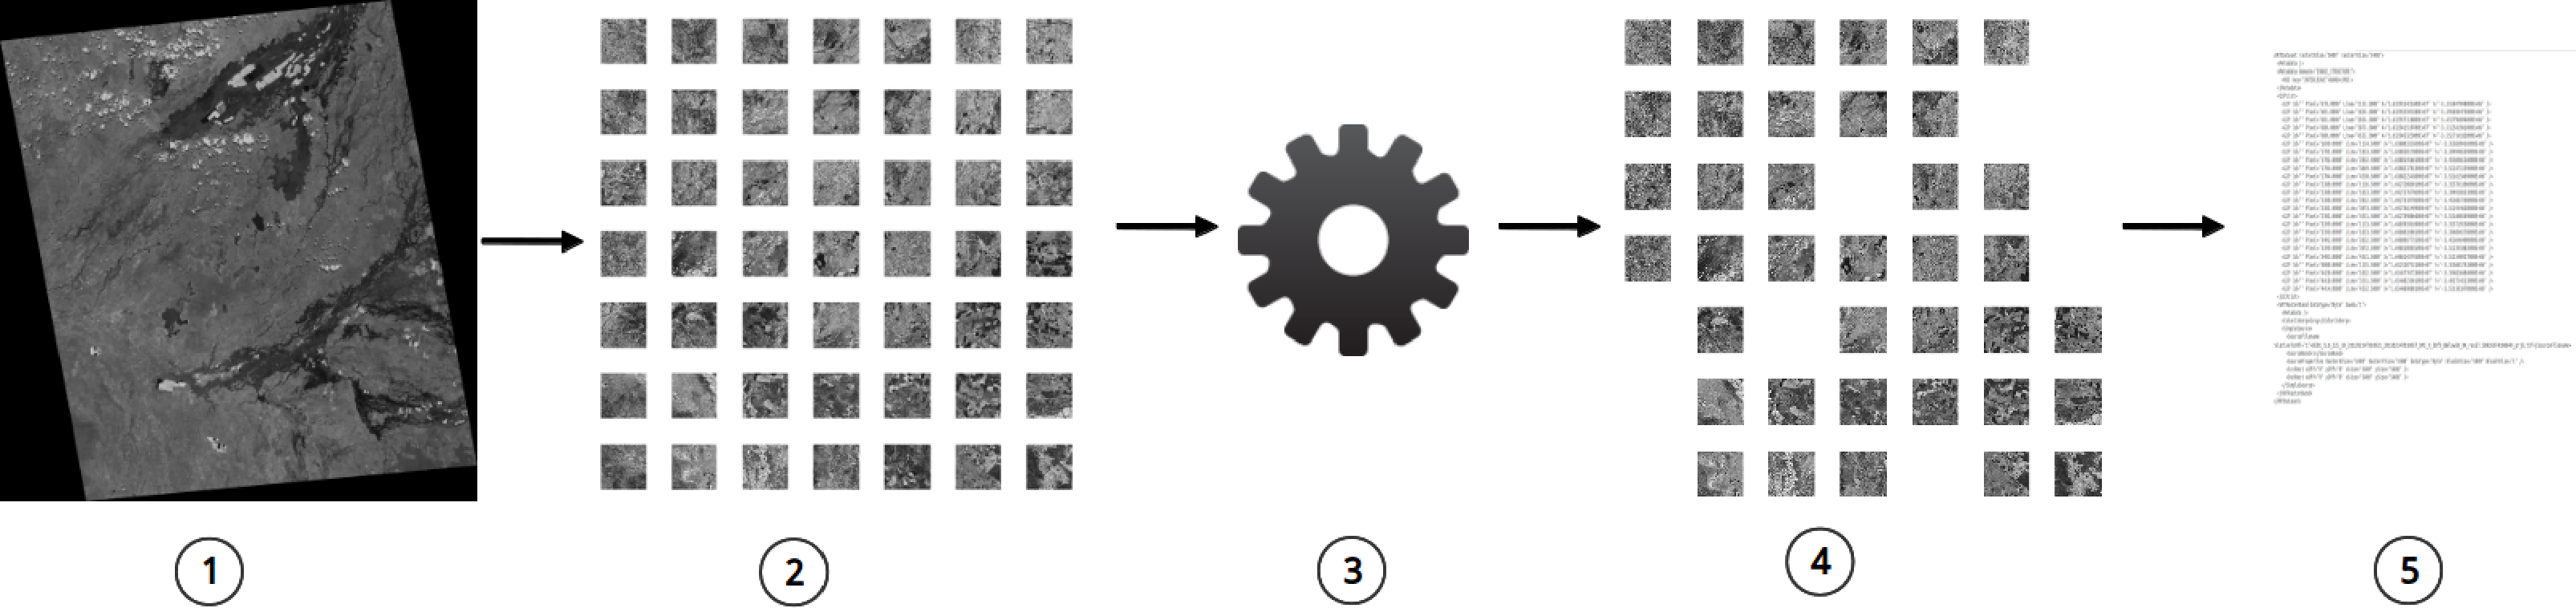
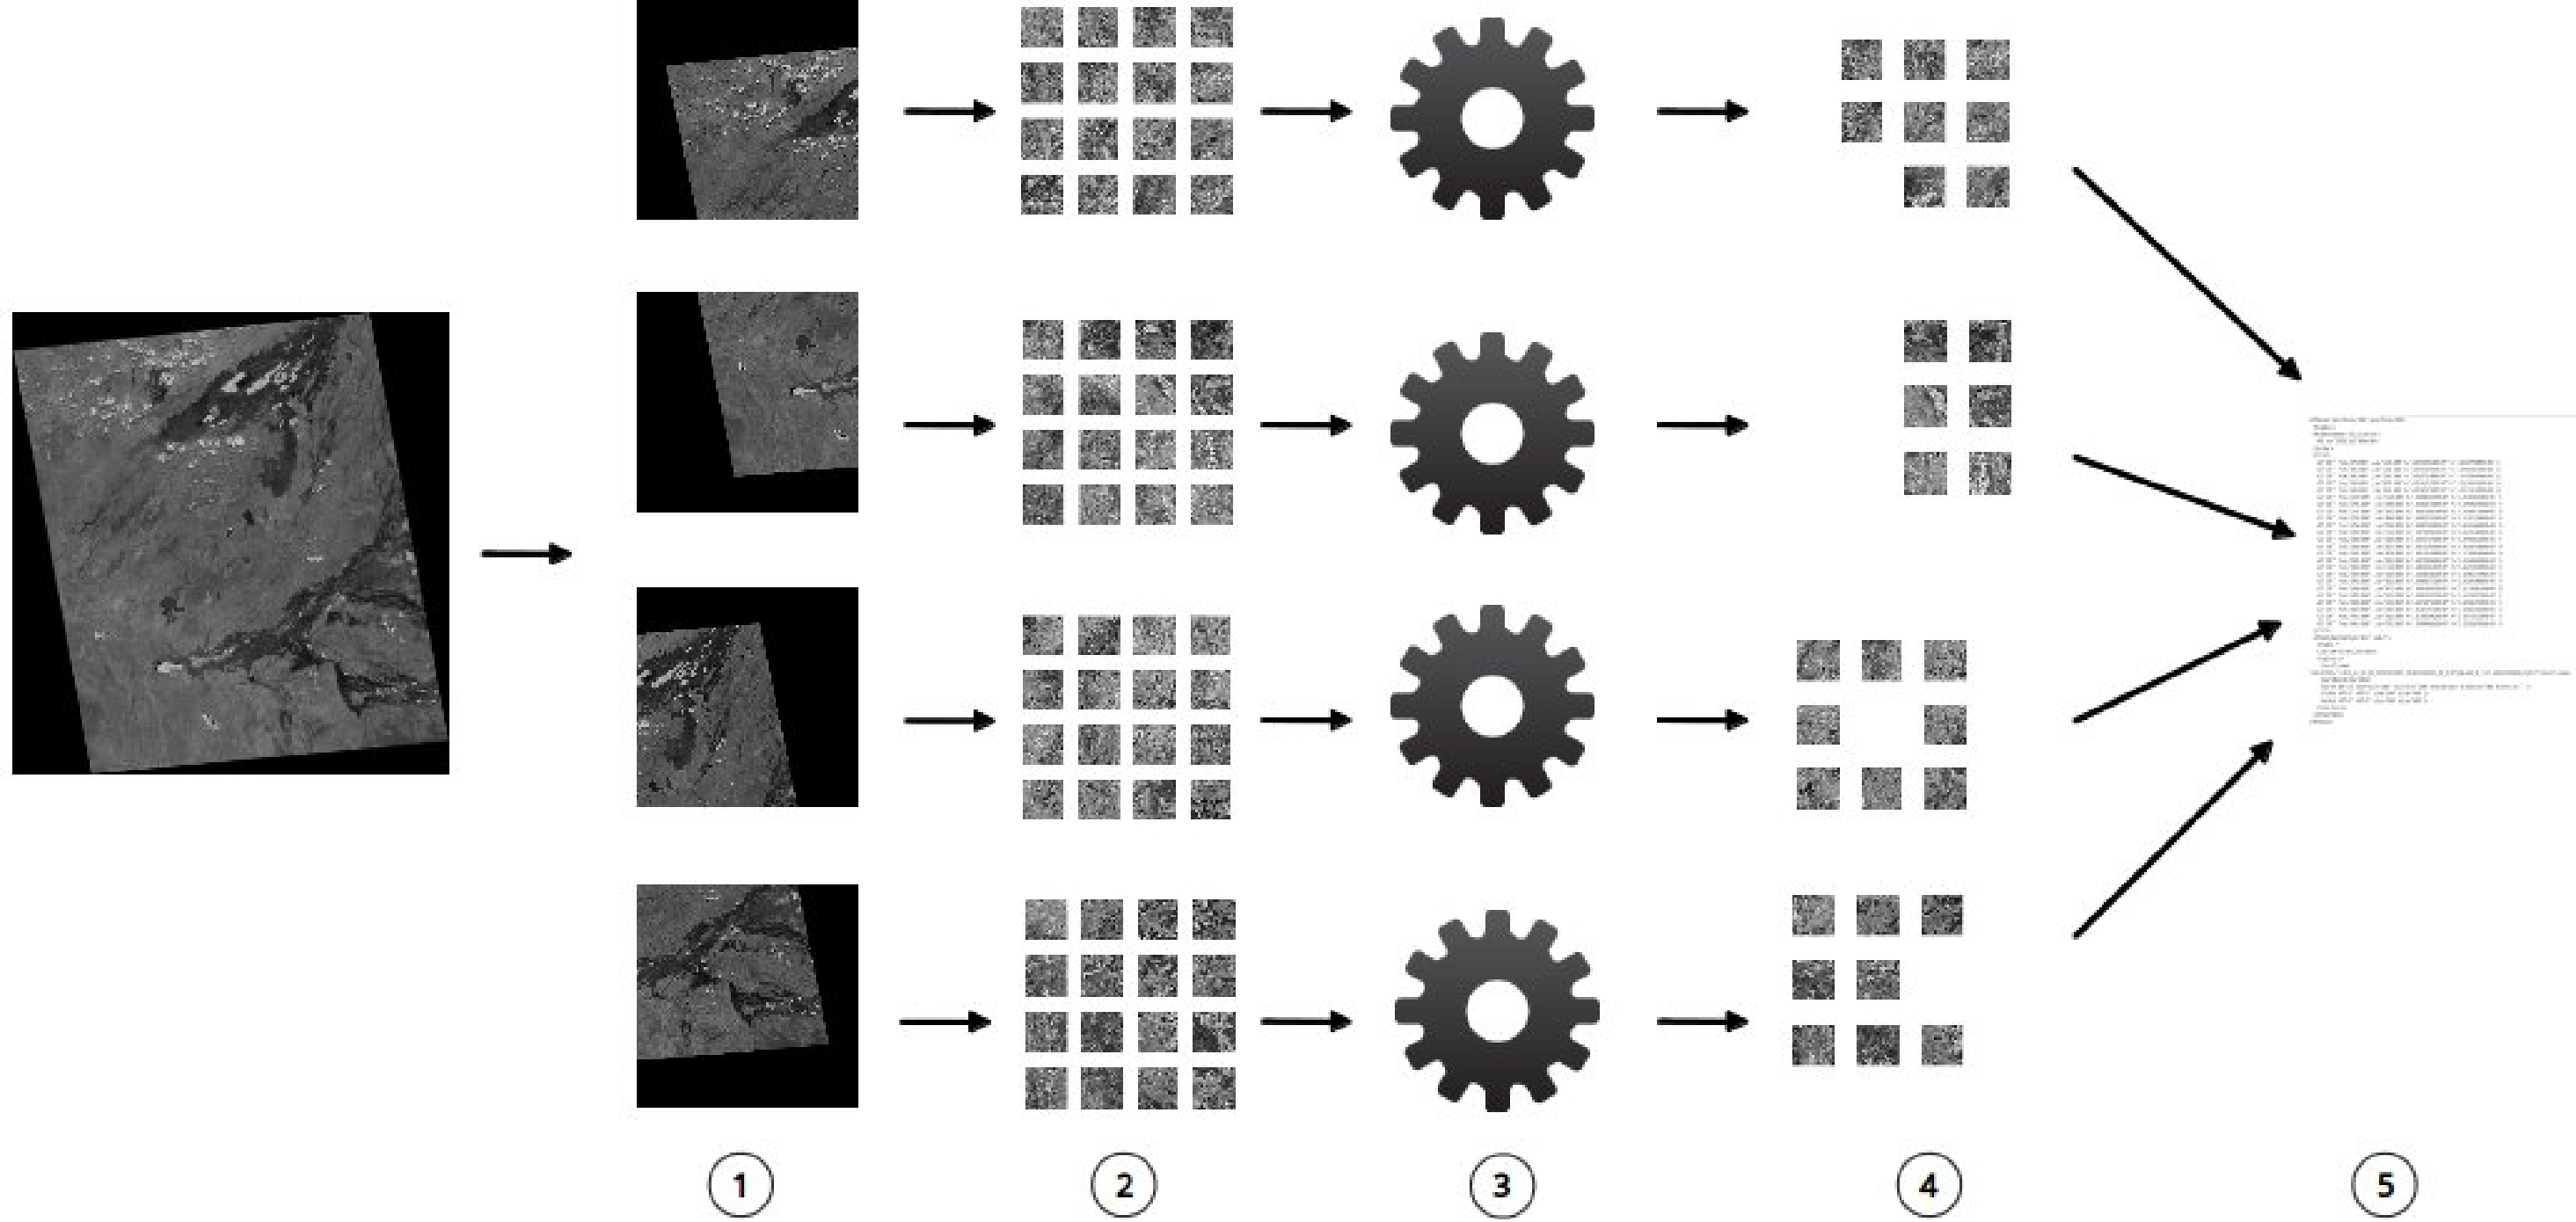
The general workflow of the method implementation is sketched in Figure 1, which is subdivided in 5 steps. In the first step, we prepare the input image source. It has to be in a metric projection, typically the one matching the reference template source. In practice, we use either the Universal Transverse Mercator (UTM) or the national grid coordinate reference system of the country in which the image is located. From the metadata of the (re-projected) source image, we read the image bounds, image dimensions and the pixel spacing. If the image dimensions are larger than a size threshold that depends on the GPU on-board memory capacity, we can proceed in two ways: (a) select a subset of the imagery that encloses the area of interest and that has dimensions below or at the size threshold (Figure 1) or (b) split the source image into multiple parts (Figure 2), each of which is below or at the size threshold. In Figure 2, we illustrate this with a split into 4 quarters. The image size limit for a single GPU run on a Tesla card is 8,192 by 8,192 pixels, due to the size of the on-board memory (4 Gb).
In emergency contexts, the first approach is most common, as the areas of interest are usually well within the source image bounds. In case the native geolocation accuracy of the image is variable and of low quality [8], resampling the source image to a lower resolution may be considered. The correction resulting from the template matching at this lower resolution can then be applied to the full resolution source image, after which a full resolution match can be applied to find the final correction. Alternatively, if a priori knowledge on the geo-location error is available, the template matching may be applied to smaller regions of interest selected as subsets from the source image. The use of significantly smaller, full resolution sub-imagery will allow for a significant speed-up, both for CPU-and GPU-based approaches.
In Step 2, we select templates inside the source image bounds. In our set-up, we select templates in a regular grid layout across the image, with n by n (n ≥ 3) tiles at a fixed spacing. In other scenarios, ancillary data layers may be used to fine-tune the template selections, e.g., a digital terrain model or a land use database to avoid selections that are potentially difficult to match, for instance, in accentuated terrain or feature-poor natural vegetation. Templates are selected at the grid locations and for a pre-determined template size. The template source is a reference image with the same pixel spacing as the source image. Depending on the scenario, the reference source is either an existing reference image, for instance, when the same area is imaged multiple times, or, as in our case, an existing on-line geo-referenced image, for which selections can be made via a web map (tile) service (WM(T)S). The latter is useful in emergency contexts, where the exact location and extent of the event impact and, therefore, the source image and template selection are not fixed a priori. When using a WMS, a single service call can be made to select the exact template resolution and extent. A WMTS serves fixed resolution imagery in small tiles. Therefore, a number of service calls need to be made to select several adjacent tiles, after which the template needs to be re-sampled from the tile mosaic. The open source Geospatial Data Abstraction Library (GDAL) software allows programmatic WMS- or WMTS-based selections using service profiles.
In our procedure, we write template tiles to disk, after which we configure a GPU run configuration file that executes the matching process on the GPU (Step 3). In principle, we could simply use pointers, either to the subset locations of the reference image or the WM(T)S service addresses. The matching routine is essentially a loop that matches each template against the source image. This is done in two steps. First, we compute the phase correlation of the source image and each template. This is done in the frequency domain, as a multiplication of the Fast Fourier Transforms (FFT) for both images. In the second step, we find the maximum of the correlation in the spatial domain, which is derived as the inverse FFT of the previous convolution. The maximum is located at the center point where the template best matches the source image. The loop ends after all templates have been convolved. An essential point in the workflow is that all templates are matched in a single GPU run. This is a deliberate optimization choice, as we apply the FFT to the entire image only once and, then, convolve with each template consecutively.
In Step 4, we need to automatically filter out mismatched templates. Note that the best match that was found in the previous step is not necessarily the right location. A template match will always result in a maximum value. However, if a template is outside the bounds of the image (e.g., in the dark edges around the re-projected source image) or the quality of the source image does not allow a direct match (e.g., due to local cloud cover), the matched location does not correspond to the correct geo-position. We use a simple criterion that consists of computing the deviation of the expected template location from the regular reference grid position it has in the template selection. If the offset between the template matching position in the source image and the template’s original coordinates is larger than half the grid spacing, then the filter discards this template as a mismatch. As an extra measure, we plot the matched template positions to easily identify mismatches and inspect the correlation values for the template set. Values for mismatched templates are usually much lower than those for well-matched templates.
In step 5, the filtered match offsets are stored as ground control points in GDAL’s virtual file (VRT) format. Finally, the source image is warped to the corrected geo-location by using the derived VRT file. We normally use a single polynomial (i.e., an affine transformation) to correct the imagery.
The method is essentially the same for the split image approach (Figure 2). Each quarter is matched in a separate GPU run. The filtered matching results are then re-combined in a single VRT file for use in the warping operation, which is applied to the input image.
3. Data
3.1. Satellite Data
We demonstrate the use of the method for a set of multispectral DEIMOS-1 and RapidEye image frames over a large forest fire site near Alcublas (Valencia province, Spain, centered at 39.810°N, 0.688°W). The fire burned around 19,400 ha of woodland, shrub-land and agricultural cultivations in a five-day period, starting on 29 June 2012. The Copernicus emergency mapping service (EMS) was activated on 3 July.
The Spanish DEIMOS-1 satellite sensor, which is part of the Disaster Monitoring Constellation [27], provides multi-spectral images (green, red and near-infrared bands) at 22-m spatial resolution. The RapidEye sensors provide multi-spectral images (green, red, red-edge and near-infrared bands) at 6.5-m spatial resolution. After the request was received, the sensor operators were asked to check archive holdings for reference imagery and to task new image acquisition over the impact area. The result of the archive search and tasking is listed in Table 1.
3.2. Reference Data
DEIMOS-1 image size is convenient to geo-reference in a single GPU run, as explained above. Furthermore, the sensor resolution is similar to the TerraColor reference layer [28], which is derived from Landsat Thematic Mapper imagery. We use an internal Web Map Server (WMS) that hosts this global layer, which has a spatial resolution of 15 m. For a seven by seven regularly spaced grid covering the DEIMOS image extent, we create reference tiles of 512 by 512 pixels at 22-m resolution via a direct call to the WMS server. In the GPU template matching routine, we only need a single band, for which we have chosen the red band from both the DEIMOS-1 source image and the TerraColor reference tiles.
For the RapidEye geo-correction, we use the following procedure. An ortho-image mosaic is compiled at a 6.5-m resolution from the Spanish Web Map Tile Server (WMTS) at the Instituto Geográfico Nacional (IGN) Spain [29], covering the extent of the RapidEye imagery. The RapidEye scene is cut into four equal-sized quarters, each of which is well below the threshold size of 8,192 by 8,192 pixels. For each quarter scene, we set up a regular grid of five by five reference images, which we cut out as 512 by 512 subsets from the ortho-image mosaic. Furthermore, in this case, we select the red image band for use in the matching procedure.
In order to check the quality of the geo-correction operations, we select a set of three by three tiles around the fire impact area. These tiles are different from the sets used in the original matching operations. We run the template matching on the geo-rectified imagery and calculate the residual displacement from it. As an additional, qualitative test, we compare the burnt area in the geo-rectified imagery against the vector outline of the fire extent, which was created for the EMS request. The EMS technical contractor uses a conventional image processing workflow to ortho-rectify the RapidEye imagery in Table 1, using rational polynomial coefficients that are in the imagery’s metadata, and the SRTM digital elevation model. The ortho-rectified imagery is then used in a visual interpretation exercise to manually delineate the fire extent and to grade the fire severity. The current specification requires the contractor to deliver the first delineation product three hours after the satellite data has been received. The EMS standard outputs are available on the portal [4].
4. Results and Discussion
4.1. Matching Results of the DEIMOS-1 Image, Using the TerraColor WMS
A graphical impression of the automatic template matching routine on the DEIMOS-1 images is shown in Figure 3. The images in the background are the pre- (left) and post-event (right) source images warped with the ground control points derived from the matched templates. Note that not all the templates from the input grid are matched; for instance, several tiles at the image borders that have no or few pixels in common with the source image. In the post-event image, also, an inner grid tile remains unmatched. This is, in fact, in the area more affected by the fire: the phase-correlation computation does not find the correct match between the template and the source image because the fire has significantly changed the local patterns.
Table 2 shows geo-correction run parameter and timings for the seven by seven grid of the TerraColor templates, using an NVIDIA Tesla C1060 card. In the third column, we list the computation timings for the complete template matching routine running on the GPU, which are essentially equal for both DEIMOS-1 images. This timing includes the memory allocation step, the transfer of the data from the CPU host to the GPU, the actual phase-correlation routine using the CUDA Fast Fourier Transform (cuFFT) library and the transfer back to the CPU.
In order to gain further insight into the computational speed of the method, we compare the run times of the template matching part of the algorithm in Table 3. We compare to the OpenCV matchTemplate routine, which has only recently been released as a GPU accelerated version gpuMatchTemplate, as well. For both, we use the normalized correlation coefficient metric, as it is the most robust of the six possible metrics that can be used. For the test, we use the post-DEIMOS image, from which a 4,096 by 4,096 subset is selected around the center of the fire impact area. For this area, we match a four by four grid of templates, with a size of 128 by 128, 256 by 256 and 512 by 512 pixels, respectively. For each template match, the run time is given in milliseconds (ms).
The tests are run on a workstation with a dual quadcore X5470 CPU (running at 3.33 GHz with 16 Gb of RAM and the Linux 2.6.32 64-bit operating system) which hosts a Tesla C1060 card (with 240 processing cores, running at 1.3 GHz with 4 Gb on-board RAM). The CUDA driver version is 4.2. We use a compute grid-block dimension of 16 by 16.
The performance figures in Table 3 clearly demonstrate the superior performance of the GPU accelerated routines. Our cuFFT-based method is a factor of 20–27 faster than the CPU-based OpenCV matchTemplate routine. It is also a factor of 1.7 faster than the new OpenCV gpuMatchTemplate implementation. Both OpenCV template matching routines are implemented with the use of Discrete Fourier Transforms, which are part of the OpenCV library. The CUDA cuFFT implementation is a highly optimized implementation, which explains the performance gain. The performance for the variable template sizes is relatively constant for the GPU implementations. Note that the NVIDIA C1060 (Fermi architecture) GPU used in our study is already superseded by much faster cards. The recently released NVIDIA Kepler K20X (Kepler architecture) GPU is a factor of five faster than the C1060 card.
The displacement of the source images is significant (Table 2, fourth and fifth column). The pre-event DEIMOS-1 source image is particularly mislocated, requiring a correction of several kilometers in both the easting and northings. While the post-event DEIMOS-1 image is much closer to the true location, it still needs a correction of several hundreds of meters, i.e., about 14 pixels in the eastings and five in the northings.
4.2. Matching Results of the RapidEye Images, Using the IGN Ortho-Image Reference
For the RapidEye imagery, we apply the template matching to four equally-sized quarter scenes (see Figure 2). We run our routine four times in sequence and merge the matched templates locations to a single consolidated VRT file. The total run time in Table 2 is the average for the four runs, i.e., for each quarter. Total run time is, therefore, on the order of 89 seconds. However, we have ported the split approach to a small cluster with four GPUs, bringing the processing time back to 29.3 s. The difference is timing compared to the timing of the sequential runs is due to overhead in the split and merge approach and synchronization between GPUs.
The location corrections for the RapidEye images are in the order of 70–170 m in eastings and northings, corresponding to 10–30 pixels.
4.3. Uncertainties, Errors and Accuracies
Note that we have not included the timing for template selection in either the DEIMOS-1 or RapidEye tests. This timing is variable, especially in the DEIMOS-1 case, where selection speed depends on the response time of the WMS. However, for the template grids we have used in our tests, the time to select the template never exceeds 60 s. Currently, we run template selection separately from the GPU template matching routine. We first write WMS or reference image templates to disk, after which we load them in the separate GPU run. One optimization step would be to compile the templates directly in the GPU run, saving a further 10–20 s overall.
The residual RMSE (Table 2, last column) for the DEIMOS-1 correction is calculated from a separate template matching operation using 20-m resolution IGN ortho-image templates. This RMSE of around two pixels is still somewhat large, which is likely due to two factors: (1) The TerraColor reference imagery is only an approximate “ortho-reference”. In fact, it is composed of Landsat archive imagery, which has only been corrected against a coarse global reference. The IGN ortho-imagery reveals this, especially because (2) the terrain in the study area is rather hilly. Furthermore, the DEIMOS-1 imagery has a cross-track angle of around 14 degree and is, therefore, not truly vertical looking. This is even more pronounced in the pre-event image, due to the large offset in the image location. Only a full ortho-rectification step, which we have not included in our method, would lead to a better geometrical accuracy.
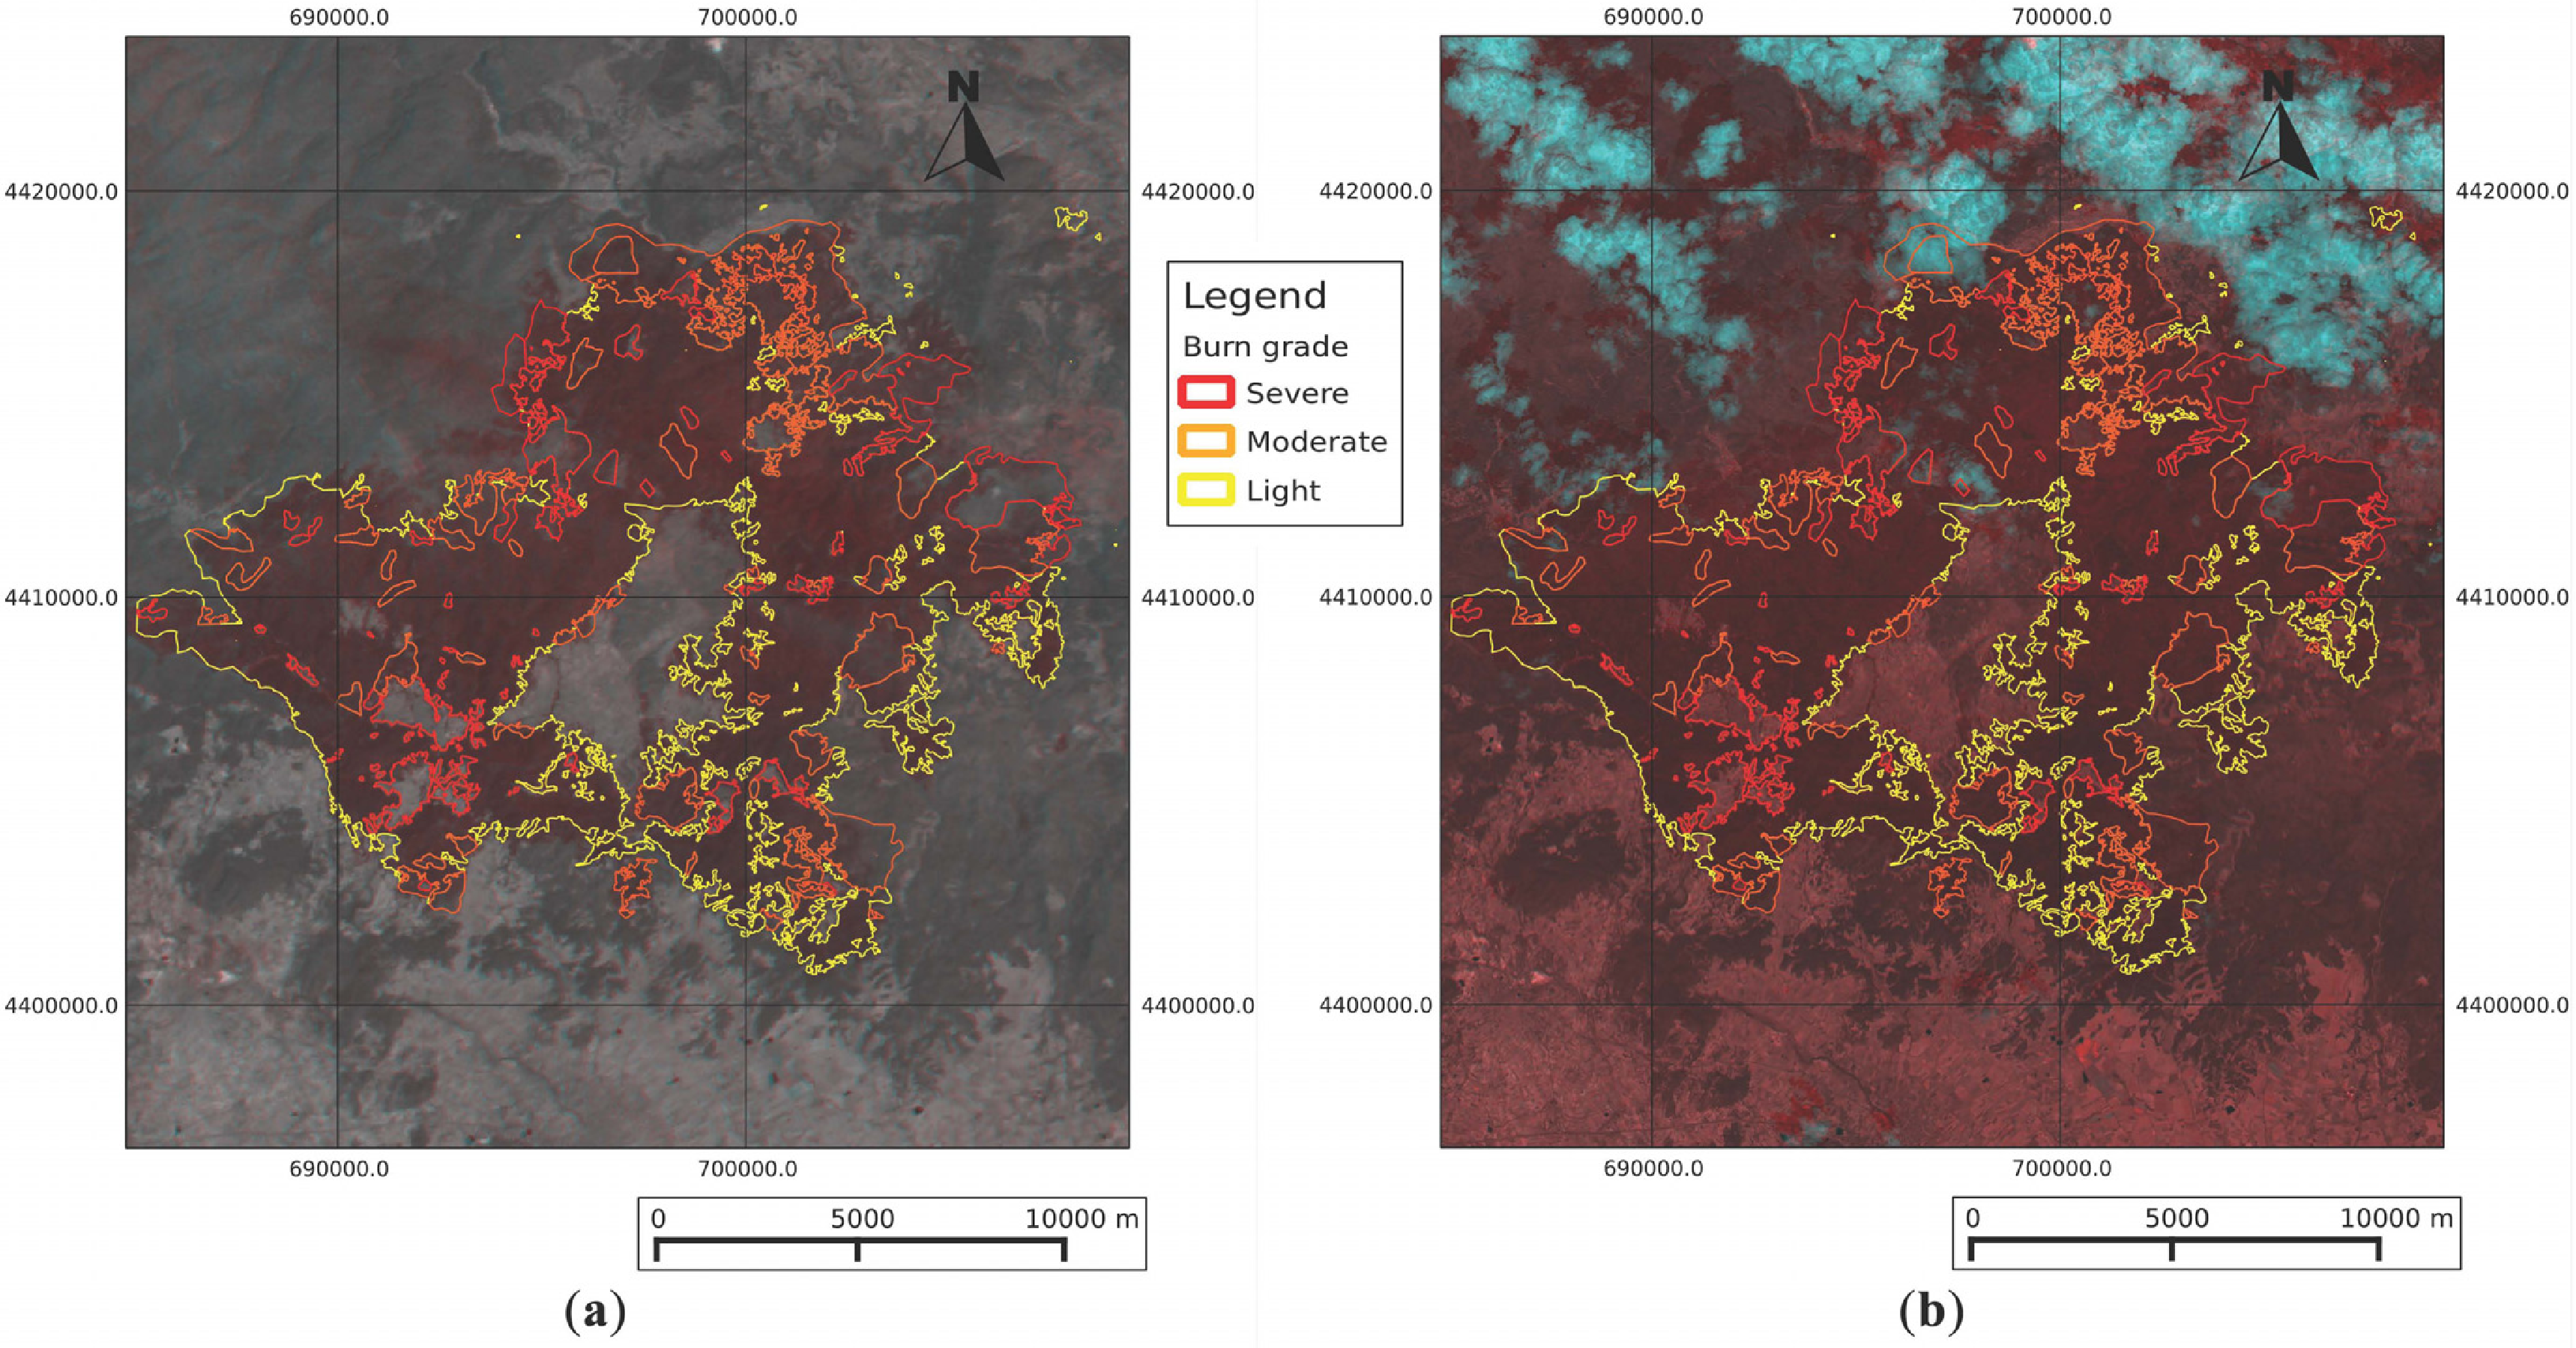
For the RapidEye sets, the RMSE is very close to the one pixel threshold that we consider acceptable for a fast mapping product. The fact that RapidEye is a near vertical looking sensor contributes to the good result. In Figure 4, we display the geo-corrected pre- and post-event DEIMOS-1 and RapidEye sets together with the vector outline of the graded fire extent derived from the EMS activation. The overall co-location of the data sets is very good, especially at the display scale (1:75,000). Upon closer inspection, the residual misregistration of the DEIMOS-1 imagery is visible, whereas the RapidEye set shows consistent co-registration, even at scales 1:25,000. Given that the whole geo-correction procedure takes on the order of five minutes for the pre- and post-event sets, leading to an overall co-registration error on the order of one pixel (for RapidEye data), we consider this to be a rather satisfying result.
As a final test of our method, we have used a recent Landsat-8 image (3 May 2013), which covers our study area. The template match was run as a control operation in this case, confirming that the residual error in the geolocation is less than one pixel. Thus, Landsat-8 is one of the first satellite sensors that may be used in emergency mapping contexts without the need for an elaborate geo-correction approach, and, vice versa, as a source of reference templates for consistent geo-correction of other sensor sets.
5. Conclusions
We have demonstrated the extended use of a fast template matching procedure using a GPU for image geo-correction in a practical emergency mapping context. The main advantage over conventional methods running on CPUs is the significant time gain in performance. A comparison to the OpenCV CPU-based matchTemplate routine shows that our method is a factor of 20–27 faster, depending on template size. Another advantage is the straightforward implementation, requiring, at most, a segmentation of the full resolution imagery, if it is larger than 8,192 by 8,192 pixels. The slightly slower GPU-enhanced OpenCV gpuMatchTemplate routine can be used as an alternative, as it is even easier to program. A grid of five by five full-resolution image templates is typically matched within one minute, including template selection. A third key advantage is the ability to use relatively large matching templates of, at least, 256 by 256 pixels. This typically leads to a more robust matching performance, especially if image quality is not optimal (e.g., cloud cover, low contrast). Even though the template matching can be run completely automatically, including a post-correction quality assessment, we recommend that the matching results are inspected for mismatches that are not filtered out in the automated method. Our method does not incorporate a full ortho-rectification approach, but yields geo-location accuracies of approximately one pixel for near-vertical looking RapidEye imagery and two pixels for off-nadir looking DEIMOS-1 imagery.
The combination of robustness and speed is the key advantage of our method and will facilitate much faster map product generation in emergency workflows and similar near-real-time thematic application workflows. We have discussed several paths to further speed the optimization of the geo-correction workflow. This can be as simple as upgrading to a faster GPU, implementing parallelization on a multi-GPU configuration or applying smart re- and sub-sampling based on prior information.
We believe that our method is particularly relevant for a range of existing and planned satellite imaging sensors. The European Sentinel-2 sensor will produce vast streams of new imagery starting in 2015. High throughput geo-correction of these streams is a pre-requisite for their successful integration in new agricultural monitoring practices [30]. Similar to the needs in emergency mapping, these applications require fast classification and change detection methods, which can be facilitated by chaining the geo-correction procedure with other GPU accelerated workflows. The role of high quality reference ortho-imagery and vector data sets, especially those that are increasingly released in the public domain, is especially relevant in this context.
Acknowledgments
The imagery used in this study has been provided under the Copernicus satellite data provision mechanism managed by the European Space Agency [5]. The vector data used in Figure 4 are © 2012 of the European Commission.
Conflict of Interest
The authors declare no conflict of interest.
References
- Voigt, S.; Kemper, T.; Riedlinger, T.; Kiefl, R.; Scholte, K.; Mehl, H. Satellite image analysis for disaster and crisis-management support. IEEE Trans. Geosci. Remote Sens 2011, 45, 1520–1528. [Google Scholar]
- Kerle, N. Satellite-based damage mapping following the 2006 Indonesia earthquake—How accurate was it? Int. J. Appl. Earth Obs. Geoinf 2010, 12, 466–476. [Google Scholar]
- Pesaresi, M.; Gerhardinger, A.; Haag, F. Rapid damage assessment of built-up structures using VHR satellite data in tsunami-affected areas. Int. J. Remote Sens 2007, 28, 3013–3036. [Google Scholar]
- Copernicus Emergency Management Service portal. Available online: http://emergency.copernicus.eu/mapping (accessed on 15 July 2013).
- GMES Component Data. Available online: http://gmesdata.esa.int/web/gsc/dap_document (accessed on 15 July 2013).
- White, J.D.; Ryan, K.C.; Key, C.C.; Running, S.W. Remote sensing of forest fire severity and vegetation recovery. Int. J. Wildland Fire 2006, 6, 125–136. [Google Scholar]
- Boyle, S.J.; Tsanis, I.K.; Kanaroglou, P.S. Developing geographic information system for land use impact assessment in flooding condition. J. Water Res. Plan. Manag 1998, 124, 89–98. [Google Scholar]
- Lemoine, G.; Syryczynski, J.; Giovalli, M. Geo-Location Correction Of CBERS 2b Imagery Using Fast Template Matching On A GPU. Proceedings of IEEE International Geoscience and Remote Sensing Symposium, Munich, Germany, 22–27 July 2012.
- Nakano, K.; Chikatsu, H. Camera-variant calibration and sensor modeling for practical photogrammetry in archeological sites. Remote Sens 2011, 3, 554–569. [Google Scholar]
- Fonseca, L.M.G.; Manjunath, B.S. Registration techniques for multisensor remotely sensed imagery. J. Phot. Eng. Remote Sens 1996, 62, 1049–1056. [Google Scholar]
- Sarvaiya, J.N.; Patnaik, S.; Bombaywala, S. Image Registration by Template Matching Using Normalized Cross-Correlation. Proceedings of International Conference on Advanced Computing, Control, and Telecommunication Technologies, Trivandrum, India, 28–29 December 2009.
- OpenCV Template Matching. Available online: http://docs.opencv.org/doc/tutorials/imgproc/histograms/template_matching/template_matching.html (accessed on 15 July 2013).
- Spacemetric. Available online: http://www.spacemetric.com/ (accessed on 15 July 2013).
- LDCM CAL/VAL Algorithm Description Document. Available online: http://landsat.usgs.gov/documents/LDCM_CVT_ADD.pdf (accessed on 15 July 2013).
- Lemoine, G.; Bielski, C.; Syryczyński, J. Fast surface height determination using multi-angular WorldView-2 orthoready urban scenes. IEEE J. Sel. Top. Appl. Remote Sens 2012, 5, 80–88. [Google Scholar]
- Frigo, M.; Johnson, S.G. The design and implementation of FFTW3. Proc. IEEE 2005, 93, 216–231. [Google Scholar]
- NVIDIA CUDA Libraries. Available online: http://developer.nvidia.com/technologies/libraries (accessed on 15 July 2013).
- Thrust Library. Available online: http://thrust.github.com/ (accessed on 15 July 2013).
- Jeong, H.; Cho, N.H.; Jung, U.; Lee, C.; Kim, J.Y.; Kim, J. Ultra-fast displaying spectral domain optical doppler tomography system using a graphics processing unit. Sensors 2012, 12, 6920–6929. [Google Scholar]
- Shams, R.; Sadeghi, P.; Kennedy, R.; Hartley, R. A survey of medical image registration on multicore and the GPU. IEEE Signal Proc. Mag 2010, 2, 50–60. [Google Scholar]
- Reguera-Salgado, J.; Calvino-Cancela, M.; Martin-Herrero, J. GPU geocorrection for airborne pushbroom imagers. IEEE Trans. Geosci. Remote Sens 2012, 50, 4409–4419. [Google Scholar]
- Reguera-Salgado, J.; Martin-Herrero, J. High PERFORMANCE GCP-Based Particle Swarm Optimization of Orthorectification of Airborne Pushbroom Imagery. Proceedings of IEEE International Geoscience and Remote Sensing Symposium, Munich, Germany, 22–27 July 2012.
- Reguera-Salgado, J.; Martin-Herrero, J. Real Time Orthorectification of High Resolution Airborne Pushbroom Imagery. Proceedings of SPIE Conference High Performance Computing, Prague, Czech Republic, 19–20 September 2011.
- Opsahl, T.; Haavardsholm, T.; Winjum, I. Real-time georeferencing for an airborne hyperspectral imaging system. Proc. SPIE 2011, 8048. [Google Scholar] [CrossRef]
- Gonzalez, C.; Sanchez, S.; Paz, A.; Resano, J.; Mozos, D.; Plaza, A. Use of FPGA or GPU-based architectures for remotely sensed hyperspectral image processing. VLSI J 2013, 46, 89–103. [Google Scholar]
- Tejaswi, K.P.; Rao, D.S.; Nair, T.; Prasad, A.V.V. GPU accelerated automated feature extraction from satellite images. Int. J. Distributed Parallel Syst 2013, 4, 1–15. [Google Scholar]
- The DMC Consortium. Available online: http://www.dmcii.com/?page_id=7073 (accessed on 15 July 2013).
- TerraColor® Landsat Satellite Images of Earth by Earthstar Geographics. Available online: http://www.terracolor.net/ (accessed on 15 July 2013).
- Centro de Descargas del CNIG. Available online: http://centrodedescargas.cnig.es/CentroDescargas/index.jsp (accessed on 15 July 2013).
- Rembold, F.; Atzberger, C.; Savin, I.; Rojas, O. Using low resolution satellite imagery for yield prediction and yield anomaly detection. Remote Sens 2013, 5, 1704–1733. [Google Scholar]


| Image Name | Acquisition | Info | Resolution [m] | Image Dimension | Cross-Track Angle [degree] |
|---|---|---|---|---|---|
| Pre RapidEye | 29 May 2012 | Pre-event | 6.5 | 13,288 × 9,412 | 3.5 |
| Pre DEIMOS | 26 June 2012 | Pre-event | 22.0 | 4,950 × 5,339 | 14.3 |
| Post DEIMOS | 2 July 2012 | During event | 22.8 | 5,285 × 5,510 | 14.5 |
| Post RapidEye | 5 July 2012 | After event | 6.5 | 13,481 × 9,698 | 3.1 |
| Image Name | Size [Mb] | Run Time [s] | Dx [m] | Dy [m] | RMSE [pixel] |
|---|---|---|---|---|---|
| Pre DEIMOS | 26.3 | 12.6 | 12,729 | 6,068 | 2.24 |
| Post DEIMOS | 37.8 | 12.9 | 285 | 91 | 1.58 |
| Pre RapidEye | 249.1 | 22.1 | □170 | 69 | 0.74 |
| Post RapidEye | 261.6 | 22.4 | □125 | 102 | 1.09 |
| Template Size | |||
|---|---|---|---|
| Method | 128 by 128 | 256 by 256 | 512 by 512 |
| cuFFT | 238 | 240 | 250 |
| gpuMatchTemplate | 430 | 430 | 420 |
| matchTemplate | 4,670 | 6,190 | 6,810 |
© 2013 by the authors; licensee MDPI, Basel, Switzerland This article is an open access article distributed under the terms and conditions of the Creative Commons Attribution license ( http://creativecommons.org/licenses/by/3.0/).
Share and Cite
Lemoine, G.; Giovalli, M. Geo-Correction of High-Resolution Imagery Using Fast Template Matching on a GPU in Emergency Mapping Contexts. Remote Sens. 2013, 5, 4488-4502. https://doi.org/10.3390/rs5094488
Lemoine G, Giovalli M. Geo-Correction of High-Resolution Imagery Using Fast Template Matching on a GPU in Emergency Mapping Contexts. Remote Sensing. 2013; 5(9):4488-4502. https://doi.org/10.3390/rs5094488
Chicago/Turabian StyleLemoine, Guido, and Martina Giovalli. 2013. "Geo-Correction of High-Resolution Imagery Using Fast Template Matching on a GPU in Emergency Mapping Contexts" Remote Sensing 5, no. 9: 4488-4502. https://doi.org/10.3390/rs5094488