Temporal Behavior of Lake Size-Distribution in a Thawing Permafrost Landscape in Northwestern Siberia


Abstract
:1. Introduction
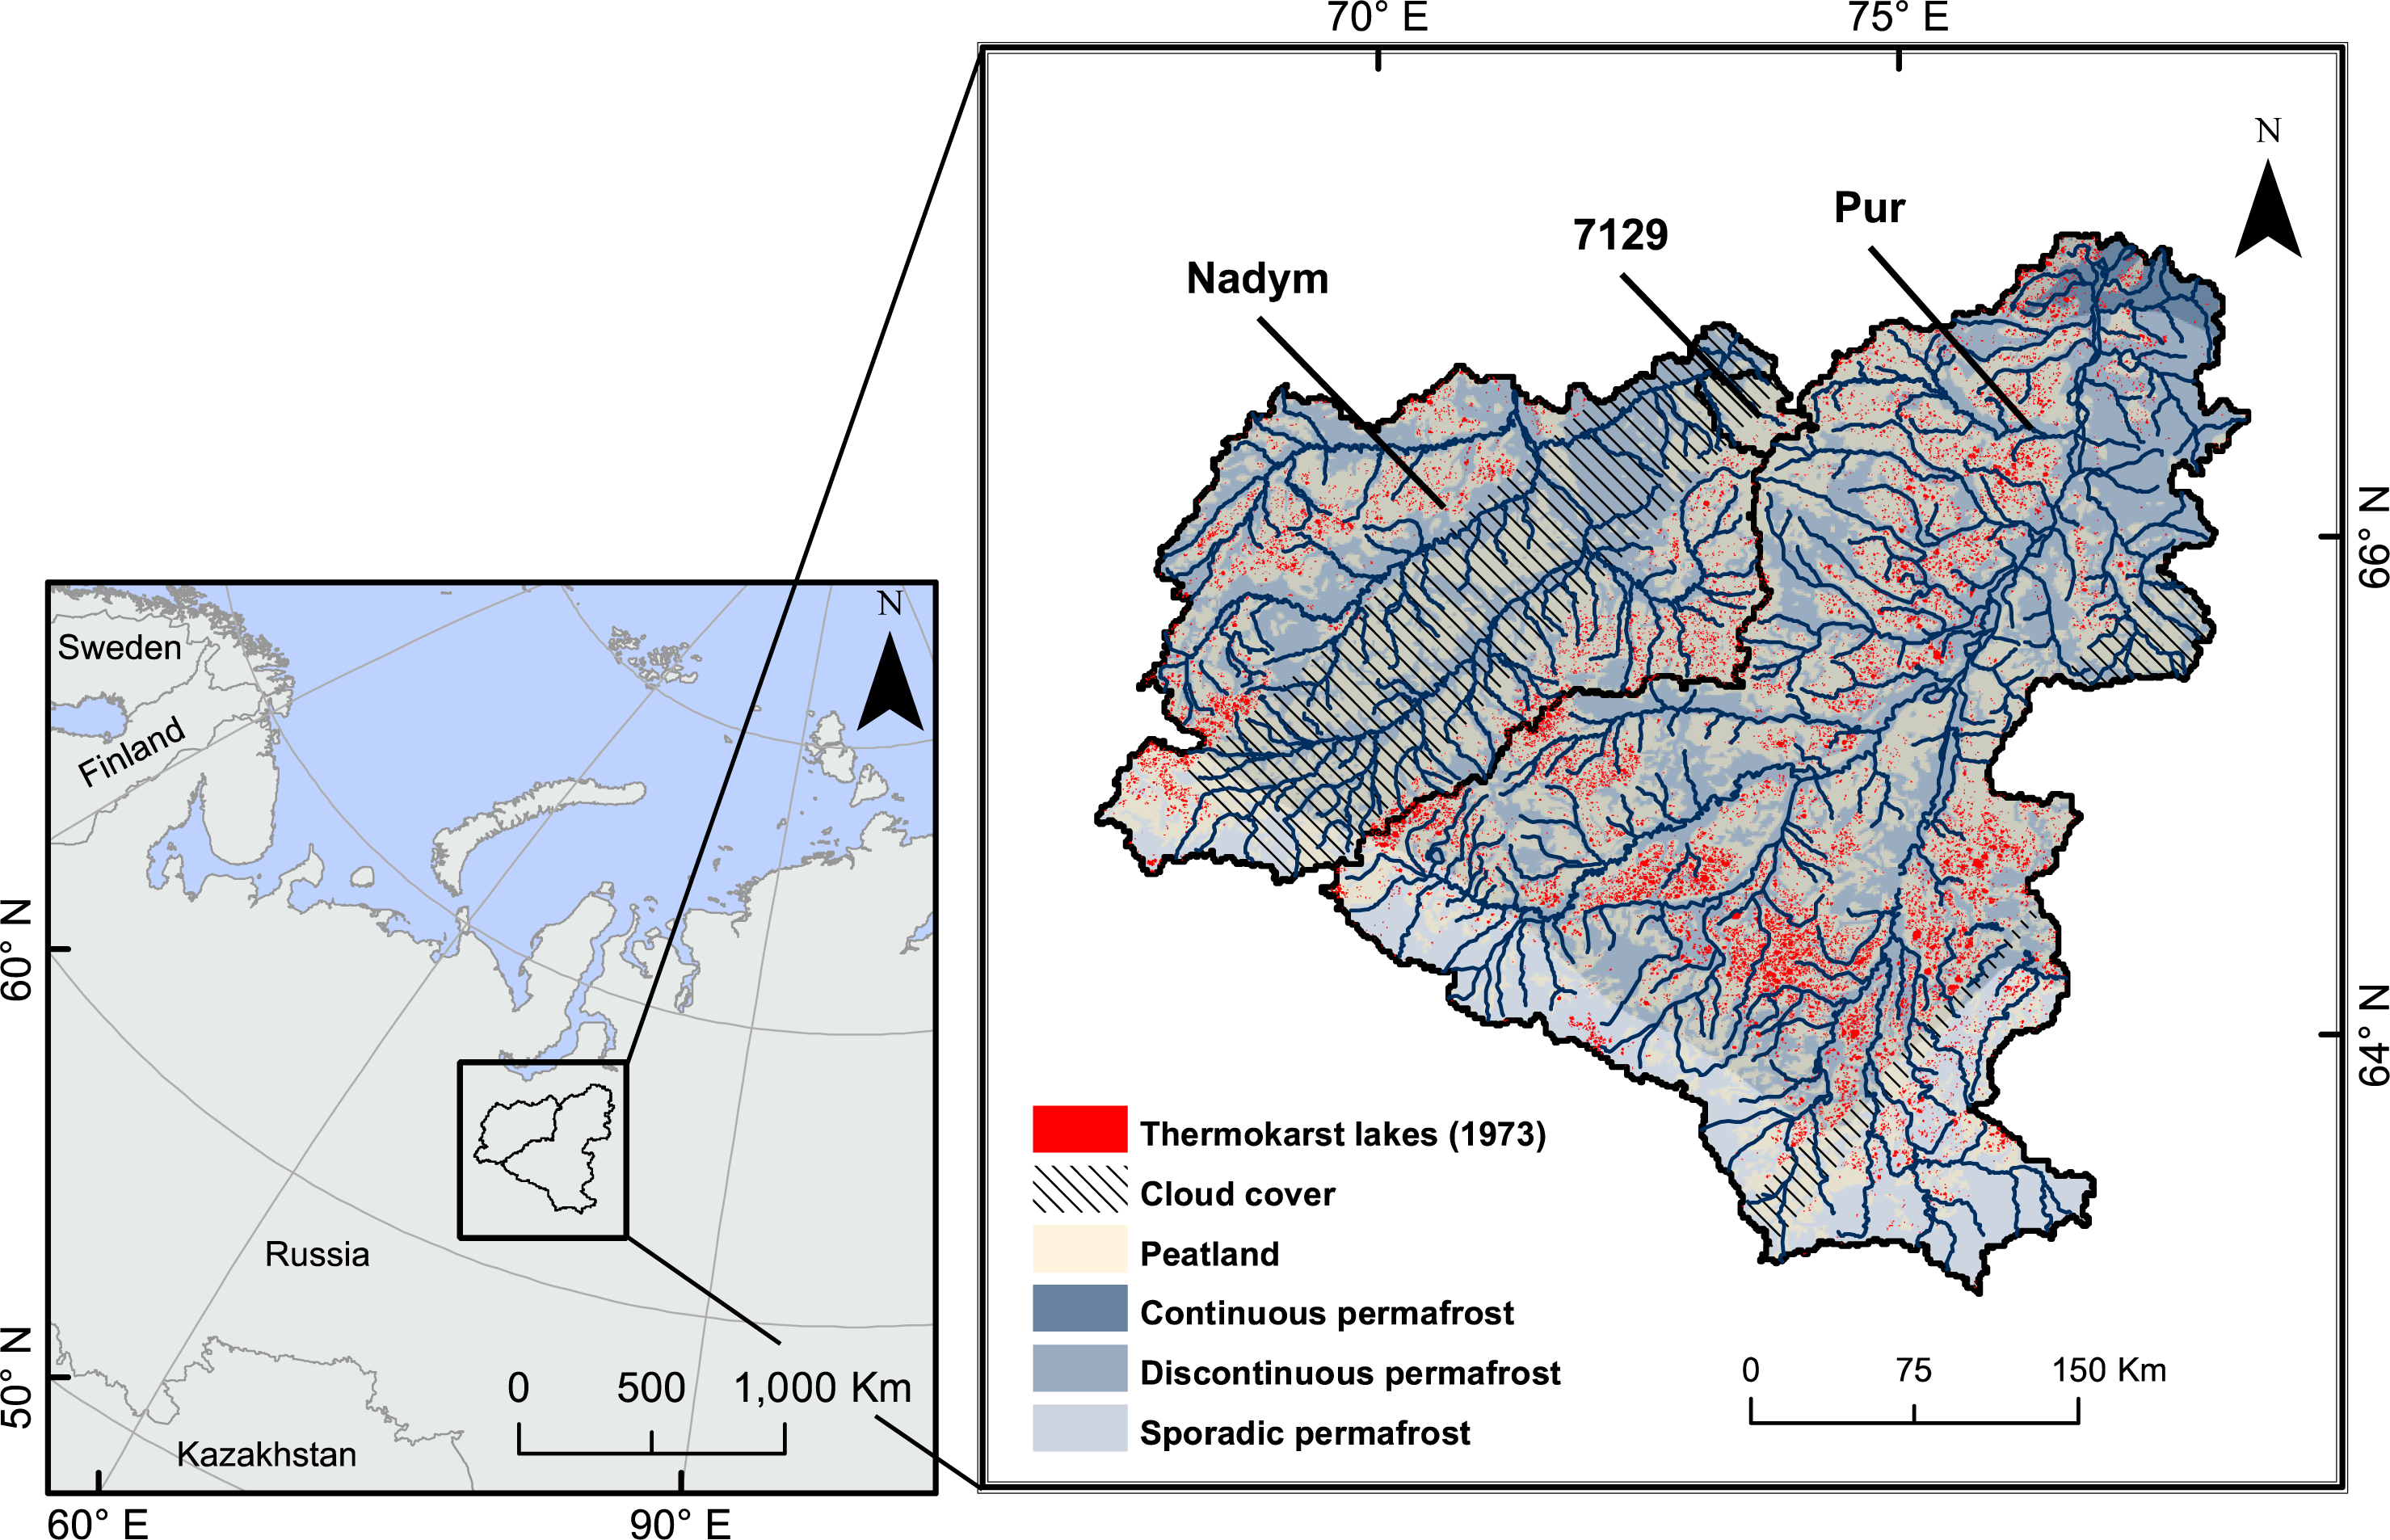
2. Study Area
3. Material and Methods
3.1. Imagery and Lake Classification
3.2. Post-Processing of Classification Results
3.3. Sensitivity Analysis Regarding Water Body Classification
4. Results and Discussion
4.1. Changes to Thermokarst Lake Abundance and Surface Area
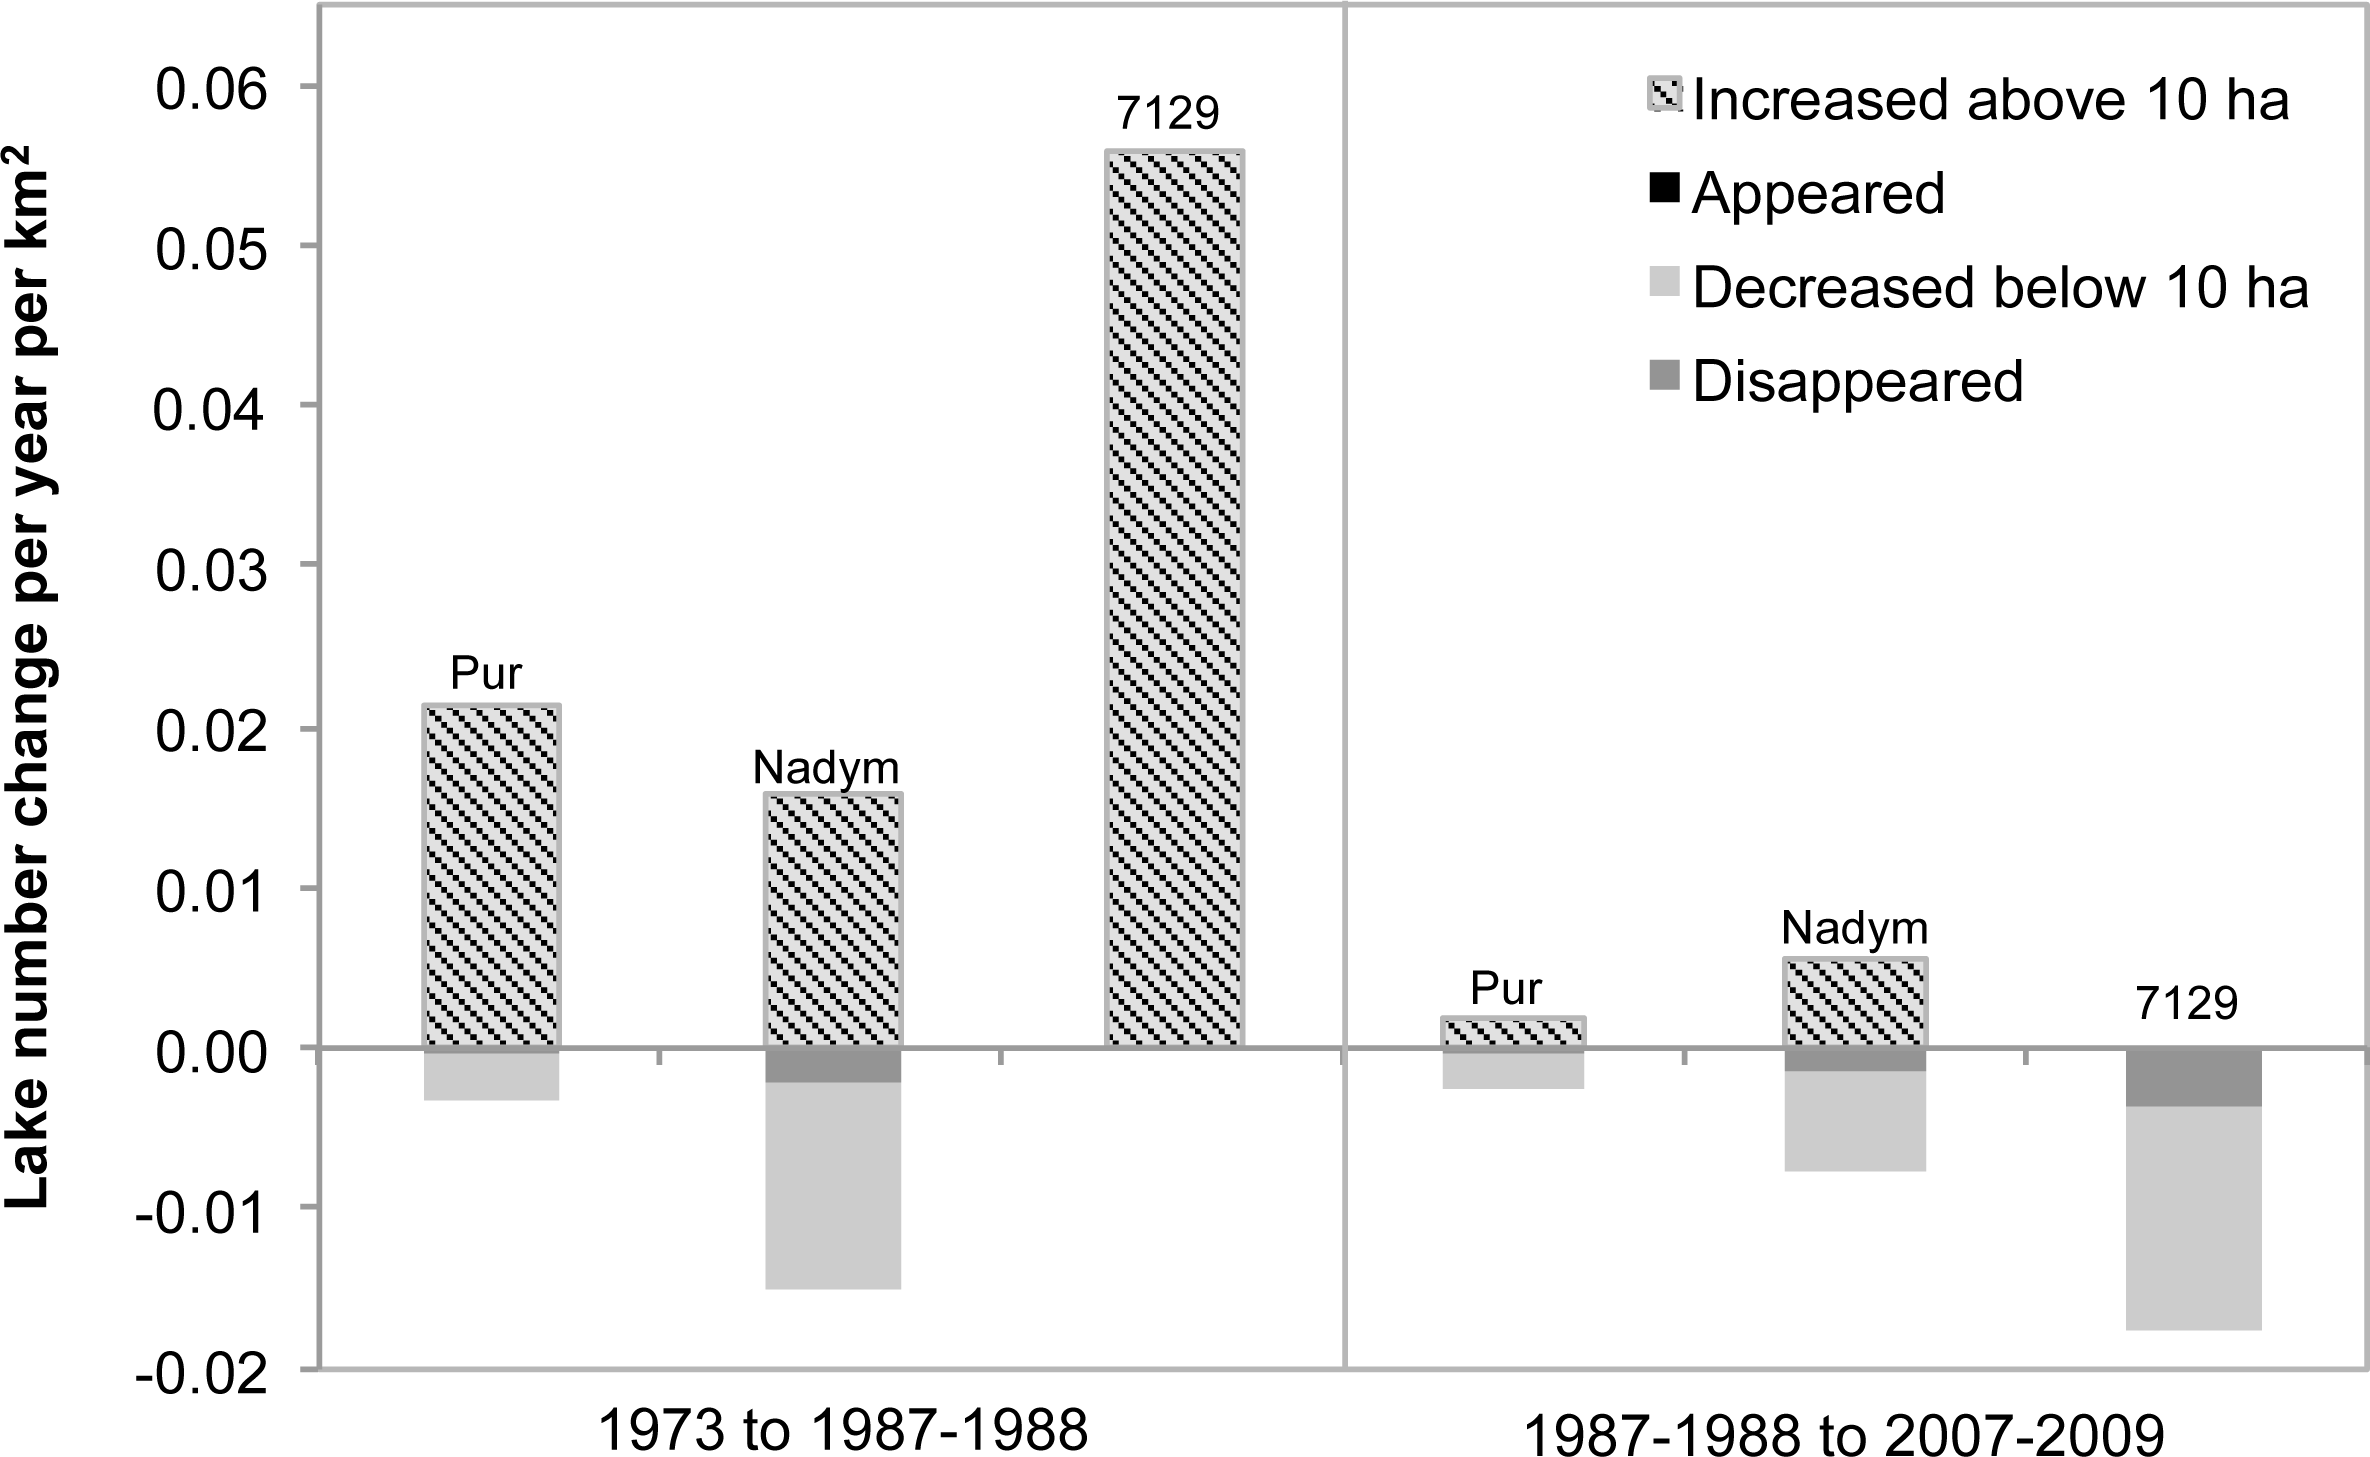
4.2. Characterization and Rate of Thermokarst Lake Change
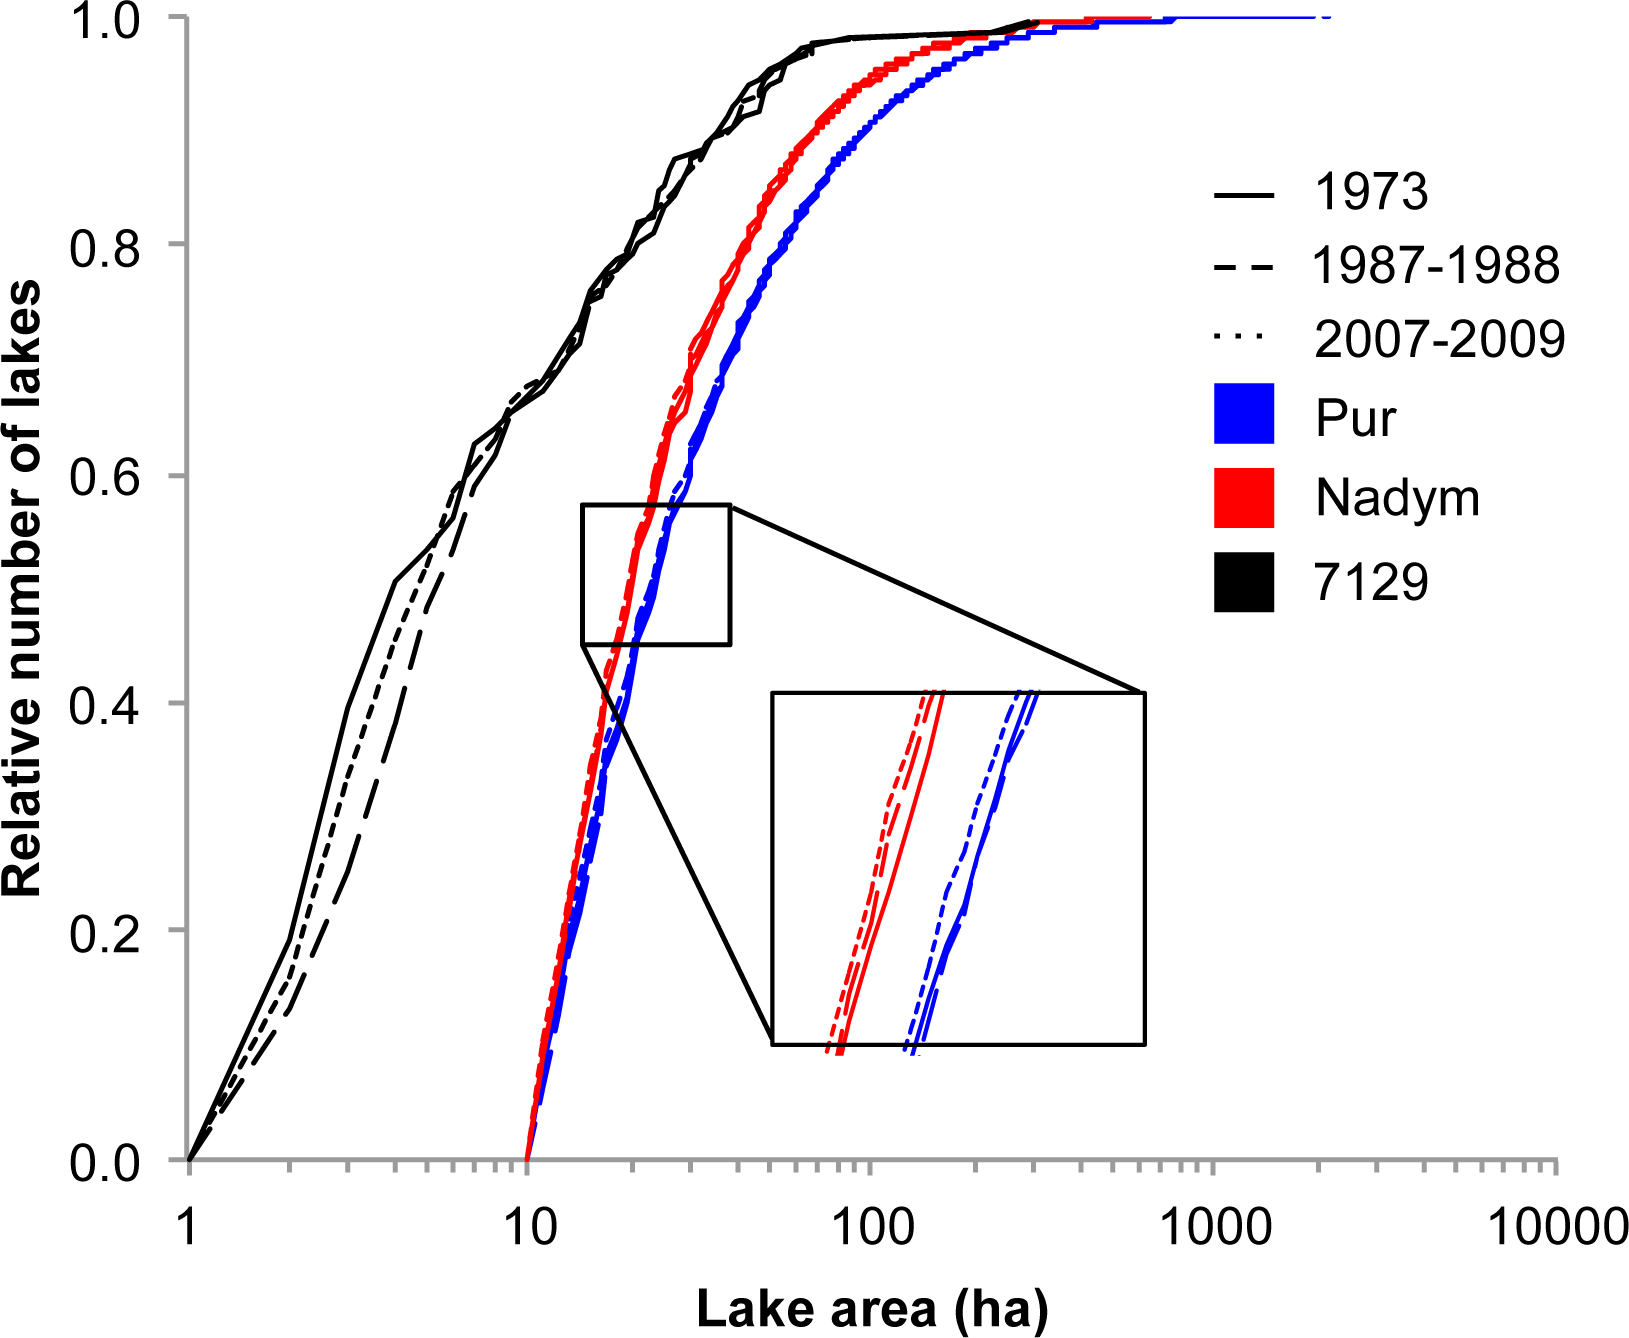
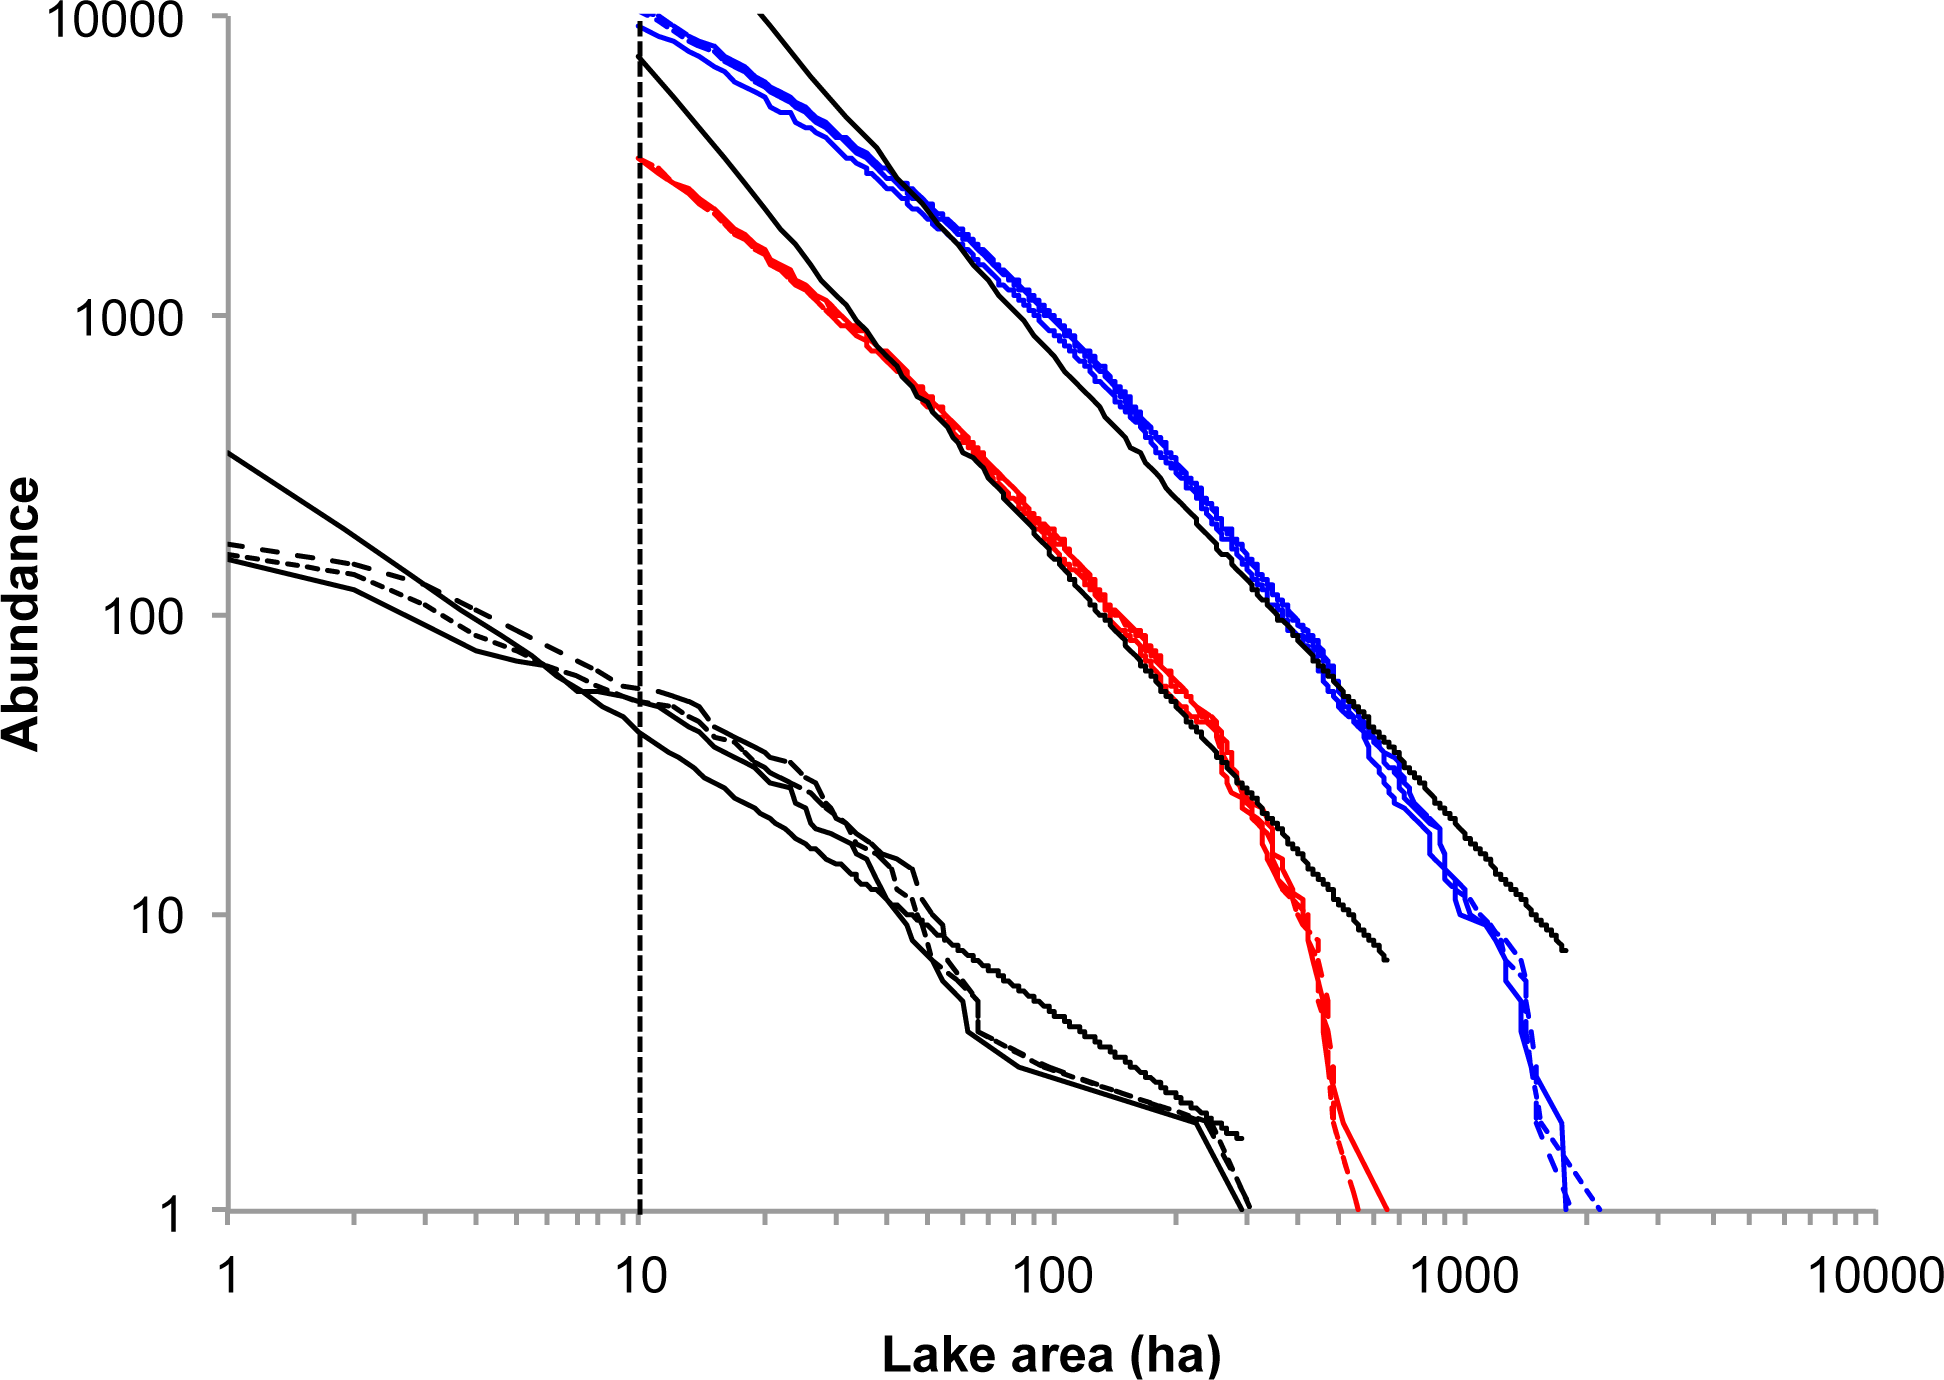
4.3. Size-Distribution of Thermokarst Lakes
4.4. Sensitivity Analysis of Water Body Classification
5. Conclusions
Acknowledgments
Conflicts of Interest
References
- Francis, J.S.; White, D.M.; Cassano, J.J.; Gutowski, W.J., Jr.; Hinzamn, L.D.; Holland, M.M.; Steele, M.A.; Vörösmarty, C.J. An Arctic hydrological system in transition: Feedbacks and impacts on terrestrial, marine, and human life. J. Geophys. Res 2009, 114. [Google Scholar] [CrossRef]
- Serreze, M.C.; Walsh, J.E.; Chapin, F.S., III; Osterkamp, T.; Dyurgerov, M.; Romanovsky, V.; Oechel, W.C.; Morison, J.; Zhang, T.; Barry, G. Observational evidence of recent change in the northern high-latitude environment. Clim. Chang 2000, 46, 159–207. [Google Scholar]
- Romaovsky, V.E.; Smith, S.L.; Christiansen, H.H. Permafrost thermal state in the polar northern hemisphere during the International Polar Year 2007–2009: A synthesis. Permafr. Periglac. Process 2010, 21, 106–116. [Google Scholar]
- Ye, B.; Yang, D.; Zhang, Z.; Kane, D.L. Variation of hydrological regime with permafrost coverage over Lena Basin in Siberia. J. Geophys. Res 2009, 114. [Google Scholar] [CrossRef]
- Frampton, A.; Painter, S.; Lyon, S.W.; Destouni, G. Non-isothermal, three-phase simulations of near-surface flows in a model permafrost system under seasonal variability and climate change. J. Hydrol 2011, 403, 352–359. [Google Scholar]
- Frampton, A.; Painter, S.; Destouni, G. Permafrost degradation and subsurface flow changes caused by surface warming trends. Hydrogeol. J 2013, 21, 271–280. [Google Scholar]
- Lyon, S.W.; Destouni, G.; Giesler, R.; Humborg, C.; Mörth, M.; Seibert, J.; Karlsson, J.; Troch, P.A. Estimation of permafrost thawing rates in a sub-Arctic catchment using recession flow analysis. Hydrol. Earth Syst. Sci 2009, 13, 595–604. [Google Scholar]
- Lyon, S.W.; Destouni, G. Changes in catchment-scale recession flow properties in response to permafrost thawing in the Yukon River Basin. J. Climatol 2010, 30, 2138–2145. [Google Scholar]
- Kane, D.L. The impact of Arctic hydrologic perturbations on Arctic ecosystems induced by climate change, in global change and arctic terrestrial ecosystems. Ecol. Stud 1997, 124, 63–81. [Google Scholar]
- Yang, D.; Kane, D.L.; Hinzman, L.D.; Zhang, X.; Zhang, T.; Ye, H. Siberian Lena river hydrologic regime and recent change. J. Geophys. Res 2002, 107. [Google Scholar] [CrossRef]
- Yoshikawa, K.; Hinzman, L.D. Shrinking thermokarst ponds and groundwater dynamics in discontinuous permafrost near Council, Alaska. Permaf. Periglac 2003, 14, 151–160. [Google Scholar]
- Sjöberg, Y.; Frampton, A.; Lyon, S.W. Using streamflow characteristics to eplore permafrost thawing in northern Swedish catchments. Hydrogeol. J 2013, 21, 121–131. [Google Scholar]
- Karlsson, J.M.; Lyon, S.W.; Destouni, G. Thermokarst lake, hydrological flow and water balance indicators of permafrost change in Western Siberia. J. Hydrol 2012, 464–465, 459–466. [Google Scholar]
- Bosson, E.; Selroos, J.-O.; Stigsson, M.; Gustafsson, L.-G.; Destouni, G. Exchange and pathways of deep and shallow groundwater in different climate and permafrost conditions using the Forsmark site, Sweden as an example catchment. Hydrogeol. J 2013, 21, 225–237. [Google Scholar]
- Frey, K.E.; McClelland, J.W. Impacts of permafrost degradation on Arctic river biogeochemistry. Hydrol. Process 2009, 23, 169–182. [Google Scholar]
- Rowland, J.C.; Jones, C.E.; Altmann, G.; Bryan, R.; Crosby, B.T.; Geernaert, G.L.; Hinzman, L.D.; Kane, D.L.; Lawrence, D.M.; Mancino, A.; et al. Arctic landscapes in transition: Responses to thawing permafrost. EOS 2010, 91, 229–230. [Google Scholar]
- Roach, J.K.; Griffith, B.; Verbyla, D. Landscape influences on climate-related lake shrinkage at high latitudes. Glob. Chang. Biol 2013, 19, 2276–2284. [Google Scholar]
- Cvetkovic, V.; Carstens, C.; Selroos, J.-O.; Destouni, G. Water and solute transport along hydrological pathways. Water Resour. Res 2012, 48. [Google Scholar] [CrossRef]
- Lyon, S.W.; Destouni, G.; Giesler, R.; Humborg, C.; Mörth, M. The relationship between subsurface hydrology and dissolved carbon fluxes for a sub-arctic catchment. Hydrol. Earth Syst. Sci 2010, 14, 941–950. [Google Scholar] [Green Version]
- Jantze, E.J.; Lyon, S.W.; Destouni, G. Subsurface release and transport of dissolved carbon in a discontinuous permafrost region. Hydrol. Earth Syst. Sci 2013, 10, 189–220. [Google Scholar]
- Frohn, R.C.; Hinkel, K.M.; Eisner, W.R. Satellite remote sensing classification of thaw lake and drained thaw lake basins on the North Slope of Alaska. Remote Sens. Environ 2005, 97, 116–126. [Google Scholar]
- Hinkel, K.M.; Jones, B.M.; Eisner, W.R.; Coumo, C.J.; Beck, R.A.; Frohn, R. Methods to assess natural and anthropogenic thaw lake drainage on the western Arctic coastal plain of northern Alaska. J. Geophys. Res 2007, 112. [Google Scholar] [CrossRef]
- Marsh, P.; Russell, M.; Pohl, S.; Haywood, H.; Onclin, C. Changes in thaw lake drainage in the Western Canadian Arctic from 1950 to 2000. Hydrol. Process 2009, 23, 145–158. [Google Scholar]
- Smith, L.C.; Sheng, Y.; MacDonald, G.M.; Hinzman, L.D. Disappearing arctic lakes. Science 2005, 308, 1429–1429. [Google Scholar]
- Riordan, B.; Verbyla, D.; McGuire, D. Shrinking ponds in subarctic Alaska based on 1950–2002 remotely sensed images. J. Geophys. Res 2006, 111. [Google Scholar] [CrossRef]
- Carroll, M.L.; Townshend, J.R.G.; DiMiceli, C.M.; Loboda, T.; Sohlberg, R.A. Shrinking lakes of the Arctic: Spatial relationships and trajectory of change. Geophys. Res. Lett 2011, 38. [Google Scholar] [CrossRef]
- Jones, B.M.; Grosse, G.; Arp, C.D.; Jones, M.C.; Walter Anthony, K.M.; Romanovsky, V.E. Modern thermokarst lake dynamics in the continuous permafrost zone, northern Seward Peninsula, Alaska. J. Geophys. Res 2011, 116. [Google Scholar] [CrossRef]
- Plug, L.J.; Walls, C.; Scott, B.M. Tundra lake changes from 1978 to 2001 on the Tuktoyaktuk Peninsula, western Canadian Arctic. Geophys. Res. Lett 2008, 35. [Google Scholar] [CrossRef]
- Roach, J.; Griffith, B.; Verbyla, D.; Jones, J. Mechanisms influencing changes in lake area in Alaskan boreal forest. Glob. Chang. Biol 2011, 17, 2567–2583. [Google Scholar]
- Tranvik, L.J.; Downing, J.A.; Cotner, J.B.; Loiselle, S.A.; Striegl, R.G.; Ballatore, T.J.; Dillon, P.; Knoll, L.B.; Kutser, T.; Larsen, S.; et al. Lakes and reservoirs as regulators of carbon cycling and climate. Limnol. Oceanogr 2009, 54, 2298–2314. [Google Scholar]
- Sjöberg, Y.; Hugelius, G.; Kuhry, P. Thermokarst lake morphometry and erosion features in two peat plateau areas of northeast European Russia. Permafr. Periglac 2012, 1, 75–81. [Google Scholar]
- An, V.V.; Devyatkin, V.N. The influence of climatic, geodynamic and anthropogenic factors on permafrost conditions in Western Siberia. Proceedings of the Seventh International Conference on Permafrost, Yellowknife, Canada, 23–27 June 1998; 55.
- Brown, J.; Ferrians, O.J., Jr.; Heginbottom, J.A.; Melnikov, E.S. Circum-Arctic Map of Permafrost and Ground-Ice Conditions, Version 2; National Snow and Ice Data Center: Boulder, CO, USA, 2002. [Google Scholar]
- Frey, K.E.; Smith, L.C. How well do we know northern land cover? Comparison of four global vegetation and wetland products with a new ground-truth database for West Siberia. Glob. Chang. Biol 2007, 21. [Google Scholar] [CrossRef]
- Sheng, Y.; Smith, L.C.; MacDonald, G.M.; Kremenetski, K.V.; Frey, K.E.; Velichko, A.A.; Lee, M.; Beilman, D.W.; Dubinin, P. A high-resolution GIS-based inventory of the west Siberian peat carbon pool. Glob. Chang. Biol 2004, 18. [Google Scholar] [CrossRef]
- Smith, L.C.; Beilman, D.W.; Kremenetski, K.V.; Sheng, Y.; MacDonald, G.M.; Lammers, R.B.; Shiklomanov, A.I.; Lapshina, E.D. Influence of permafrost on water storage in West Siberian peatlands revealed from a new database of soil properties. Permafr. Periglac 2012, 23, 69–79. [Google Scholar]
- Smith, L.C.; Pavelsky, T.M.; MacDonald, G.M.; Shiklomanov, A.I.; Lammers, R.B. Rising minimum daily flows in northern Eurasian rivers: A growing influence of groundwater in the high-latitude hydrologic cycle. J. Geophys. Res 2007, 112. [Google Scholar] [CrossRef]
- Romanovsky, V.E.; Drozdov, D.S.; Oberman, N.G.; Malkova, G.V.; Kholodov, A.L.; Marchenko, S.S.; Moskalenko, N.G.; Sergeev, D.O.; Ukraintseva, N.G.; Abramov, A.A.; et al. Thermal state of permafrost in Russia. Permafr. Periglac 2010, 21, 136–155. [Google Scholar]
- Melnikov, E.S.; Leibman, M.O.; Moskalenko, N.G.; Vasiliev, A.A. Active-layer monitoring in the cryolithozone of West Siberia. Polar Geogr 2004, 28, 267–285. [Google Scholar]
- United States Geological Survey (USGS) Global Visualization Viewer. 2013. Available online: http://glovis.usgs.gov (accessed on 4 January 2014).
- Mather, P.M. Computer Processing of Remotely Sensed Images: An Introduction, 3rd ed.; John Wiley & Sons Ltd: West Sussex, UK, 2004; p. 324. [Google Scholar]
- Roger, R.E. Principal Components transform with simple, automatic noise adjustment. Int. J. Remote Sens 1996, 17, 2719–2727. [Google Scholar]
- Muster, S.; Heim, B.; Abnizova, A.; Boike, J. Water body distributions across scales: A remote sensing based comparison of three Arctic tundra wetlands. Remote Sens 2013, 5, 1498–1523. [Google Scholar]
- Morgenstern, A.; Grosse, G.; Schirmeister, L. Genetic, morphological, and statistical characterization of lakes in the permafrost-dominated Lena Delta. Proceedings of the 9th International Conference on Permafrost, Fairbanks, Alaska, 29 June–3 July 2008; Kane, D.L., Hinkel, K.M., Eds.; Institute of Northern Enginering, University of Alaska Fairbanks: Fairbanks AK, USA, 2008; pp. 1239–1244. [Google Scholar]
- Grosse, G.; Romanovsky, V.; Walter, K.; Morgenstern, A.; Lantuit, H.; Zimov, S. Distribution of thermokarst lakes and ponds at three yedoma sites in Siberia. Proceedings of the Ninth International Conference on Permafrost, Fairbanks, AK, USA, 29 June–3 July 2008; pp. 551–556.
- Digital Chart of the World. 1992. Available online: http://diva-gis.org (accessed on 4 January 2014).
- Sheng, Y. West Siberian Lowland Peatland GIS Data Collection; National Snow and Ice Data Center: Boulder, CO, USA, 2004. Available online: http://nsidc.org/data/arcss131.html (accessed on 4 January 2014).
- Kumpula, T.; Forbes, B.B.; Stammler, F.; Meschtyb, N. Dynamics of a coupled system: Multi-resolution remote sensing in assessing social-ecological responses during 25 years of gas field development in arctic Russia. Remote Sens 2012, 4, 875–881. [Google Scholar]
- Zakharova, E.A.; Kouraev, A.V.; Biancamaria, S.; Kolmakova, M.V.; Mognard, N.; Zemtsov, V.A.; Kirpotin, S.N.; Decharme, B. Snow cover and spring flood flow in the northern part of western Siberia (the Poluy, Nadym, Pur and Taz Rivers). J. Hydrometeorol 2011, 12, 1498–1511. [Google Scholar]
- Seekell, D.A.; Pace, M.L.; Tranvik, L.J.; Verporter, C. A fractal-based approach to lake size-distributions. Geophys. Res. Lett 2013, 40, 517–521. [Google Scholar]
- McDonald, C.P.; Rover, J.A.; Stets, E.G.; Striegl, R.G. The regional abundance and size distribution of lakes and reservoirs in the United States and implications for estimates of global lake extent. Limnol. Oceanogr 2012, 57, 597–606. [Google Scholar]
Appendix


| Product | Path/Row | Date | CC (%) | Threshold | Min/Max | |
|---|---|---|---|---|---|---|
| 1973 | ||||||
| LM 1 MSS | 166/15 | 27 June 1973 | 10 | 10 | ||
| LM 1 MSS | 166/16 | 27 June 1973 | 10 | 10 | ||
| LM 1 MSS | 169/15 | 23 August 1973 | 0 | 7 | ||
| LM 1 MSS | 169/16 | 12 June 1973 | 0 | 10 | ||
| LM 1 MSS | 170/13 | 24 August 1973 | 0 | 15 | ||
| LM 1 MSS | 170/14 | 24 August 1973 | 0 | 17 | 15/19 | |
| LM 1 MSS | 170/15 | 24 August 1973 | 0 | 8 | ||
| LM 1 MSS | 170/16 | 24 August 1973 | 0 | 10 | ||
| LM 1 MSS | 173/16 | 16 June 1973 | 10 | 20 | ||
| LM 1 MSS | 174/14 | 17 June 1973 | 10 | 25 | ||
| LM 1 MSS | 174/15 | 10 August 1973 | 10 | 10 | ||
| 1987–1988 | ||||||
| LT 5 TM | 155/16 | 25 August 1987 | 0 | 0.025 | ||
| LT 5 TM | 156/13 | 17 Sepember1987 | 0 | 0.07 | ||
| LT 5 TM | 156/14 | 17 September 1987 | 0 | 0.03 | ||
| LT 5 TM | 156/15 | 17 September 1987 | 0 | 0.025 | ||
| LT 5 TM | 156/16 | 17 September 1987 | 0 | 0.025 | ||
| LT 5 TM | 157/15 | 23 August 1987 | 0 | 0.025 | ||
| LT 5 TM | 158/14 | 27 June 1987 | 0 | 15 | 13/17 | |
| LT 4 TM | 158/16 | 7 July 1988 | 0 | 0.025 | ||
| LT 5 TM | 159/13 | 21 August 1987 | 0 | 0.025 | ||
| LT 5 TM | 159/14 | 21 August 1987 | 0 | 11 | ||
| LT 5 TM | 159/15 | 4 July 1987 | 0 | 0.025 | ||
| LT 5 TM | 159/16 | 21 August 1987 | 0 | 0.025 | ||
| LT 5 TM | 160/14 | 13 September 1987 | 0 | 0.07 | ||
| LT 5 TM | 160/15 | 13 September 1987 | 0 | 0.025 | ||
| 2007–2009 | ||||||
| LT 5 TM | 155/14 | 15 July 2007 | 0 | 0.025 | ||
| LT 5 TM | 155/15 | 15 July 2007 | 0 | 0.025 | ||
| LT 5 TM | 155/16 | 21 August 2009 | 0 | 0.025 | ||
| LT 5 TM | 157/13 | 18 July 2009 | 0 | 0.025 | ||
| LT 5 TM | 157/14 | 18 July 2009 | 0 | 0.025 | ||
| LT 5 TM | 157/15 | 13 July 2007 | 0 | 16 | ||
| LT 5 TM | 157/16 | 13 July 2007 | 0 | 0.025 | ||
| LT 5 TM | 158/13 | 26 August 2009 | 0 | 0.025 | ||
| LT 5 TM | 158/14 | 25 July 2009 | 0 | 0.025 | 0.022/0.028 | |
| LT 5 TM | 158/15 | 25 July 2009 | 0 | 0.025 | ||
| LT 5 TM | 158/16 | 25 July 2009 | 0 | 0.025 | ||
| LT 5 TM | 159/14 | 1 August 2009 | 0 | 0.03 | ||
| LT 5 TM | 159/16 | 16 July 2009 | 0 | 0.025 | ||
| LT 5 TM | 160/14 | 4 September 2007 | 0 | 0.03 | ||
| LT 5 TM | 160/15 | 19 August 2007 | 0 | 0.03 | ||
© 2014 by the authors; licensee MDPI, Basel, Switzerland This article is an open access article distributed under the terms and conditions of the Creative Commons Attribution license ( http://creativecommons.org/licenses/by/3.0/).
Share and Cite
Karlsson, J.M.; Lyon, S.W.; Destouni, G. Temporal Behavior of Lake Size-Distribution in a Thawing Permafrost Landscape in Northwestern Siberia. Remote Sens. 2014, 6, 621-636. https://doi.org/10.3390/rs6010621
Karlsson JM, Lyon SW, Destouni G. Temporal Behavior of Lake Size-Distribution in a Thawing Permafrost Landscape in Northwestern Siberia. Remote Sensing. 2014; 6(1):621-636. https://doi.org/10.3390/rs6010621
Chicago/Turabian StyleKarlsson, Johanna Mård, Steve W. Lyon, and Georgia Destouni. 2014. "Temporal Behavior of Lake Size-Distribution in a Thawing Permafrost Landscape in Northwestern Siberia" Remote Sensing 6, no. 1: 621-636. https://doi.org/10.3390/rs6010621