Article

The Inylchek Glacier in Kyrgyzstan, Central Asia: Insight on Surface Kinematics from Optical Remote Sensing Imagery

1
Department of Geography and Environmental Science, School of Archaeology Geography and Environmental Science, The University of Reading, Reading RG6 6AB, UK
2
Department of Surveying and Geomatics Engineering, University of Tehran, Tehran 14395-515, Iran
3
Helmholtz Center Potsdam, GFZ German Research Center for Geosciences, Potsdam 14473, Germany
*
Author to whom correspondence should be addressed.
Remote Sens. 2014, 6(1), 841-856; https://doi.org/10.3390/rs6010841
Submission received: 12 December 2013 / Revised: 3 January 2014 / Accepted: 7 January 2014 / Published: 14 January 2014

Abstract

:
Mountain chains of Central Asia host a large number of glaciated areas that provide critical water supplies to the semi-arid populated foothills and lowlands of this region. Spatio-temporal variations of glacier flows are a key indicator of the impact of climate change on water resources as the glaciers react sensitively to climate. Satellite remote sensing using optical imagery is an efficient method for studying ice-velocity fields on mountain glaciers. In this study, temporal and spatial changes in surface velocity associated with the Inylchek glacier in Kyrgyzstan are investigated. We present a detailed map for the kinematics of the Inylchek glacier obtained by cross-correlation analysis of Landsat images, acquired between 2000 and 2011, and a set of ASTER images covering the time period between 2001 and 2007. Our results indicate a high-velocity region in the elevated part of the glacier, moving up to a rate of about 0.5 m/day. Time series analysis of optical data reveals some annual variations in the mean surface velocity of the Inylchek during 2000–2011. In particular, our findings suggest an opposite trend between periods of the northward glacial flow in Proletarskyi and Zvezdochka glacier, and the rate of westward motion observed for the main stream of the Inylchek.

Graphical Abstract

1. Introduction

The glaciated mountains of Central Asia represent one of the greatest concentrations of permanent snow and ice in the mid-latitudes of the Northern Hemisphere. The Tien Shan Mountains (approximately 40°–45°N; 67°–95°E) host some of the largest non-polar glaciers in the world [1]. Mountain glaciers are the only renewable fresh water resource in Central Asia, dominated in part by large deserts and arid lowlands with very low precipitation and extremely dry climates [2]. Glacier inventories of the former USSR and China, compiled for the Tien Shan Mountains using data from the 1950s–1970s, contained just under 16.000 glaciers with a total area of about 15.400 km2 and a total volume of 1,048 km3 at that time. These glaciers are a vital source of fresh water, feeding into the densely populated foothills with a mean annual precipitation of 200–600 mm. Local, predominantly agricultural, economies rely on the glacier-fed river systems in this region for irrigation [2,3].
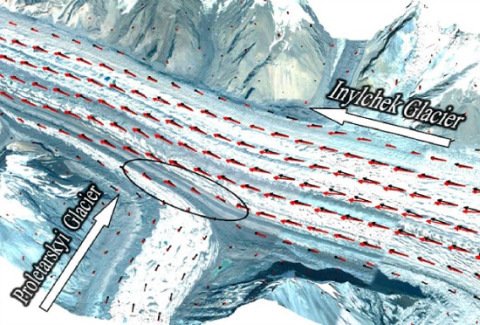
The Inylchek glacier in Kyrgyzstan (Figure 1) that is located in Central Tien Shan is the largest glacier of this mountain system with 61 km of length and an area of 567.20 km2. Its melt water provides 54% of the average annual discharge of the Kumarik River [4]. Glacier lake outburst floods (GLOFs) are reportedly widespread in the high mountains of Central Asia [5]. In recent years, the increasing numbers of glacial lakes have posed a serious threat to the livelihood of people in this area [6]. Inylchek contains the largest glacial lake of Central Asia, Lake Merzbacher, located at the conjunction point of northern and southern Inylchek [7]. This lake is the result of an ice dam which prevents the northern Inylchek drainage water from direct runoff into the valley [1]. Every year a glacier lake outburst flood occurs at Lake Merzbacher, frequently causing heavy damage to infrastructure in the downstream areas. Because of the importance of this glacier for securing freshwater resources in the region and its highly hazardous potential, the institute of Helmholtz Center Potsdam, GFZ German Research Centre for Geosciences in Germany, in cooperation with the CAIAG (Central Asian Institute for Applied Geosciences) in Bishkek, Kyrgyzstan, has established a High Mountain Observatory at the Inylchek glacier (station implementation started in 2009) with the goal of long-term monitoring of glacial dynamics and the resulting water balance under the conditions of ongoing climate change. It is hoped that a better understanding of these processes will also contribute to the development of early warning approaches for reducing the impact of the annual outburst flood in this area [79].
Despite the importance of the glacier conditions for water supply of the downstream regions, regular glacier mass balance and other ground-based glaciological measurements were discontinued both in the Tien Shan and the neighbouring Pamir Mountains in the 1990s due to the economic changes which were a result of the breakdown of the former USSR [2]. Previous studies on glacial dynamics in this area have shown an overall reduction of the surface area of the glaciers since the beginning of systematic observations in the mid 1950s. The highest rates of surface reduction have been observed in the northern Tien Shan where glaciated areas have been reduced by 30%–40% during the second half of the 20th century. The rates of deglaciation were slower further east and south [2]. The recent gravimetric measurements of global glacier mass balance revealed a negative mass budget for the entire Tien Shan of −5 ± 6 gigatons per year (Gt·a−1) for the period of 2003 to 2010 [10,11]. Gardner et al. (2013) estimated a mass loss of −7.5 ± 3.4 Gt·a−1 by altimetric measurements of Ice, Cloud, and land Elevation Satellite (ICESat), for the time period of 2003 to 2009 [12]. In this context, valuable information about the mass balance and physical condition of glaciers can be achieved by measuring the surface velocity of glaciers. For these reasons, remote sensing techniques were used widely for assessing the state of glaciation in the Tien Shan Mountains (e.g., [1315]). For instance, it has been demonstrated by Span and Kuhn (2003) that a correlation exists between changes in glacier surface speed and fluctuation of glacier mass balance [16]. In a more recent study, Heid and Kääb (2012) investigated this correlation over a large number of glaciers worldwide, and reported that the glaciers with negative mass balance have decreased their velocity over the last decades [17].
Such approaches are especially valuable for the Inylchek glacier since it is located in a very remote area with an average elevation of 4,000 m a.s.l. Performing ground-based in-situ measurement of glacier surface velocity in this area is very costly and extremely time-consuming and can only be conducted at selected accessible spots. Remote sensing measurement using optical imagery represents a valuable method to study and assess the kinematics of this type of glaciers for large areas in a spatially continuous way.
The use of space-borne Synthetic Aperture Radar (SAR) imagery for glacier surface velocity measurement has the advantage that it is based on an active sensor which is not affected by cloud coverage or solar illumination [18]. However, application of SAR imagery for interferometric analysis over fast flowing glaciers such as the Inylchek is not generally feasible, except for SAR data acquired with a short temporal baseline (e.g., Tandem mission), due to the sensitivity of InSAR to fast deformation. Interferometric measurements are also hampered by the presence of steep mountains, which result in image distortions such as foreshortening, layover or shadowing effects [19]. Therefore, cross-correlation analysis of repeated optical images is a method which is used in most of the studies that have investigated glacier surface velocities on a regional scale [15,1921]. Global coverage, fairly high spatial and temporal resolution and low cost of ASTER images provide the opportunity to investigate the dynamics and kinematics of mountain glaciers [21]. In comparison with whiskbroom sensors, the use of images such as ASTER acquired by pushbroom sensors allows the derivation of reliable results, as inherent problems related to the effect of attitude variations and inaccurate DEMs can be solved by using raw image metadata. Landsat scenes also make this type of imagery a viable option among other alternatives for large-scale and long-term monitoring of remote glacial systems due to their extensive global coverage, sufficient spatial and temporal resolution and free-of-charge availability. Landsat data has been extensively used in the past three decades to study the kinematics and dynamics of several glaciers from Antarctic regions to mid-latitude mountain glaciers [13,17,2022].
In this study, we use several Landsat and ASTER images acquired over the Inylchek glacier in the past decade to evaluate the temporal and spatial pattern of its surface velocity field and its variations during this period. Velocity changes along cross profiles in the main flow direction of southern Inylchek and northward tributaries of glacier are investigated. Variations in mean surface velocities along a 28 km longitudinal profile are also studied using Landsat images. We also give a reason for the observed acceleration in mean surface velocity of southern Inylchek during 2009–2010 time period.
This paper is arranged as follows. Section 2 presents the characteristics of images and the methodology used for precise co-registration and correlation analysis of the images. In Section 3 we present the results and investigate the annual variations in surface velocities of different parts of the glacier along transverse and longitudinal profiles. Finally, in Sections 4 and 5 we discuss the obtained results and conclude the paper with a summary of our findings in this research.

2. Data and Methodology

2.1. ASTER Imagery

ASTER’s spectral and geometric characteristics include three bands in VNIR (Visible Near Infra-Red) range with 15 m resolution, six bands in SWIR (Short Wave Infra-Red) with 30 m resolution, five bands in TIR (Thermal Infra-Red) with 90 m resolution, and a 15 m resolution NIR along-track stereo-band looking back 27.6° from nadir. In this study we used the VNIR band, 3N, due to the high contrast between features in this frequency band, which facilitates both co-registration and cross-correlation analysis of images.
By using optical imagery for the kinematic analysis of the glaciers, the accuracy of the results greatly depends on several factors including the ground resolution of the images and the ability to precisely co-register consecutive images [23]. Performing precise image to image co-registration is a very critical step to obtain an accurate and reliable displacement field [21]. Moreover, the difference in viewing angle of ASTER images is a source of limitation for precise co-registration of raw images. To overcome this limitation an efficient method proposed by Leprince et al. (2007), is applied to precisely orthorectify and co-register consecutive ASTER images [24]. Following the standard procedure described in detail in [21,24], a digital elevation model is used as the global ground truth for orthorectification of ASTER imagery, because the images are not globally georeferenced. A common problem for both radar-based and optical-based DEMs is the existence of large gaps and voids, in particular over mountainous terrains. Smaller gaps can be interpolated using the original data but larger gaps and void areas should be interpolated using other data sources, such as topographic maps. The accuracy of DEMs provided by Shuttle Radar Topography Mission (SRTM) has been evaluated among different studies [2528]. For example, absolute horizontal, absolute vertical and relative vertical error of SRTM DEMs for the Eurasia continent have estimated to be 8.8, 6.2 & 8.7 m respectively [25]. In general the accuracy of DEMs strongly depends on terrain aspect, slope, surface characteristics, etc. [29]. DEM uncertainties will affect all images obtained from the same path and row in the same way. In this study the high rate of displacement during certain time periods leads to a small relative error of less than 5 percent. Therefore, the errors in velocities aroused by DEM uncertainties could be ignored. In this study we used the best available DEM, a 90 m spatial resolution DEM, provided by SRTM. The large voids of this DEM were patched with data from topographic maps and other resources, freely available from Jonathan de Ferranti ( http://www.viewfinderpanoramas.org).
For orthorectification of the first image in our dataset, we selected nine tie points on stable features between the ASTER raw image of 27 February 2001 and a hill-shaded representation of the DEM. Selected tie points are locally optimized using sub-pixel correlation and converted into ground control points (GCP) for precise orthorectification. In our analysis we reached an average mis-registration of about 50 cm with a standard deviation of 14 m between the ASTER raw image and the hill-shaded DEM. Following this procedure, other ASTER raw images were successively orthorectified and co-registered relative to the previous ortho-image (See Table 1). The average mis-registration of less than 3 cm and a standard deviation below 3.5 m (∼1/4 pixel size) was reached for most of the pairs. In general, for glaciological studies, this is an acceptable accuracy because the glacier displacements over the time period of about one year exceed this amount.
To derive accurate and confident velocity field we then used a cross-correlation algorithm in the frequency domain, which relies on Fourier shift theorem [24]. The relative displacement between two well co-registered images can be retrieved from the phase difference of their Fourier transforms, as follows:
If i1(x,y) and i2(x,y) are two consecutive images that differ only by a displacement of (Δxy), we have
I 2 ( ω x , ω y ) = I 1 ( ω x , ω y ) e j ( ω x Δ x + ω y Δ y )
where I1 and I2 denote the Fourier transform of images and (ωx,ωy) are the frequency variables in column and row. Normalized cross-spectrum of the images is expressed by [24]
C i 1 i 2 = I 1 ( ω x , ω y ) I 2 * ( ω x , ω y ) | I 1 ( ω x , ω y ) I 2 * ( ω x , ω y ) | = e j ( ω x Δ x + ω y Δ y )
where * denotes the complex conjugate. According to cross-spectrum characteristics, relative displacement can thus be recovered by either estimation of the linear phase of the images’ cross-spectrum [30], or determination of the exact location of the correlation peak [31]. In this study we used a combined method, developed by Leprince et al. (2007), using the COSI-Corr module. Horizontal displacement in pixel-wise scale was obtained by measuring cross-correlation for a 64 × 64 window as the initial correlation search window and sub-pixel accuracy was achieved using a 32 × 32 sliding window as the final correlation window. Final ground resolution of 60 m was obtained by a sliding step of 4 pixels for the correlation window. This process results in two correlation maps, representing horizontal ground displacement in E/W and N/S directions, and a Signal-to-Noise Ratio (SNR) for each measurement, representing the confidence of the results.

2.2. Landsat Imagery

Several studies have been carried out on the dynamics of the Inylchek glacier by using remote sensing and in situ measurements [1,8,32]. These studies, however, have been mostly limited to glacier activity near the Lake Merzbacher. So far, only a few studies have been focused on deriving kinematics pattern for the eastern part of the Inylchek. Here we used Landsat images, which cover a larger area compared to the ASTER images, in order to obtain a full displacement map of the northern and southern branches of the glacier. The area covered by one Landsat scene is about 9 times larger than that of an ASTER scene (60 km by 60 km for an ASTER image, 183 km by 170 km for a Landsat image). The images which are analyzed in this study are listed in Table 1. Suitable Landsat pairs were selected among more than 70 images acquired over the period 2000 to 2011. Many parameters have been considered for selection of suitable pairs. In particular, the existence of strip lines in images, Scan Line Corrector (SLC)-failure in Landsat7, presence of cloud and the similarity of scenes with regard to snow cover and solar illumination are considered. It must be noted that, in contrast to the ASTER raw images, all Landsat images are accessible in orthorectified and georeferenced format.
Similar to the ASTER images, the co-registration of the Landsat images is a key step to measure glacier surface velocity fields which strongly affects the accuracy of the obtained velocities [24,33]. For this purpose, we used an automated precise registration and orthorectification package, called AROP, to obtain a set of precisely co-registered images [34]. Using this package we achieved co-registered pairs, matching in geographic extent, spatial resolution, and projection. Over 300 tie points between images of each pair were generated with an RMSE less than 0.4 pixel size for each pair. Finally, correlation maps in sub-pixel accuracy were obtained by applying cross-correlation for a 64 × 64 window as the initial correlation search window and 32 × 32 sliding window as the final correlation window. Final ground resolution of 60 m was obtained by a sliding step of 2 pixels for the correlation window.

3. Results

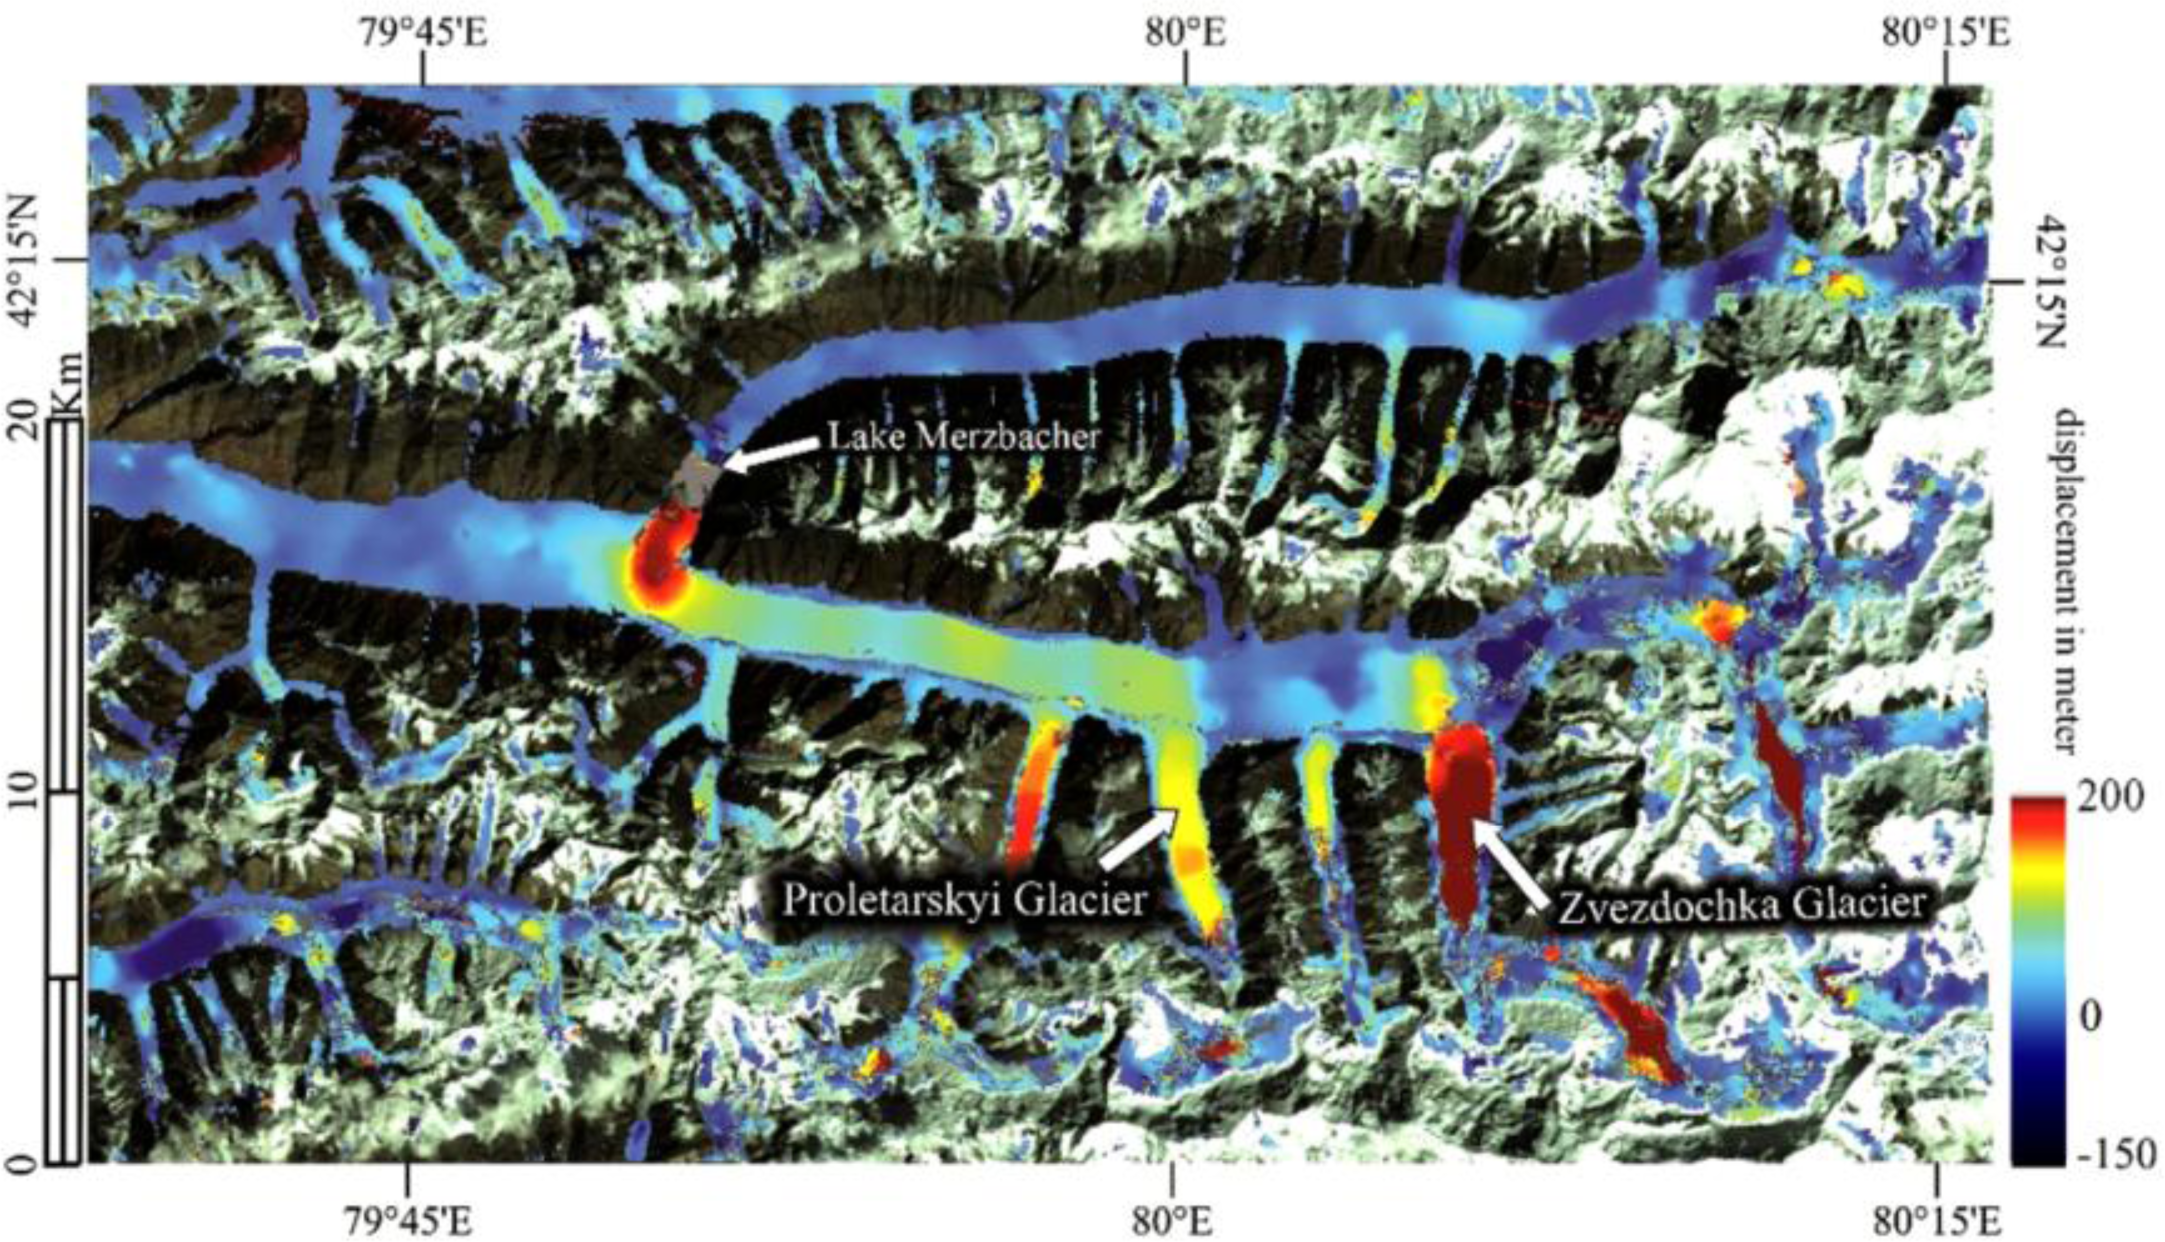
Figure 2 illustrates an example of the N/S component of the displacement field obtained by sub-pixel correlation between two Landsat images acquired in August 2006 and August 2007 over the Inylchek glacier. For better visualization, slope masking has been applied using the SRTM digital elevation model, and the displacement map has been overlaid on a Landsat image. In this case the slope of all glaciated regions is lower than 20°. The displacement map in Figure 2 shows well the main characteristics of glacier flow dynamics in N/S direction. An interesting fast movement toward the north is revealed at the ablation zone of the glacier which is called Zvezdochka glacier, where the surface velocity reaches the maximum observed speed of around 0.5 m per day (See Part I in Figure 3). It has to be mentioned that this part of the glacier was not investigated in previous studies, for example, Mayer et al. (2008) and Häusler et al. (2011). The results show that there is no significant displacement in northern Inylchek even near the Lake Merzbacher. Considering that the calving processes were recorded at the location of southern Inylchek ice dam in previous studies [1,8], it can therefore be assumed that the main source of water for the Lake Merzbacher is the southern Inylchek drainage into the lake.
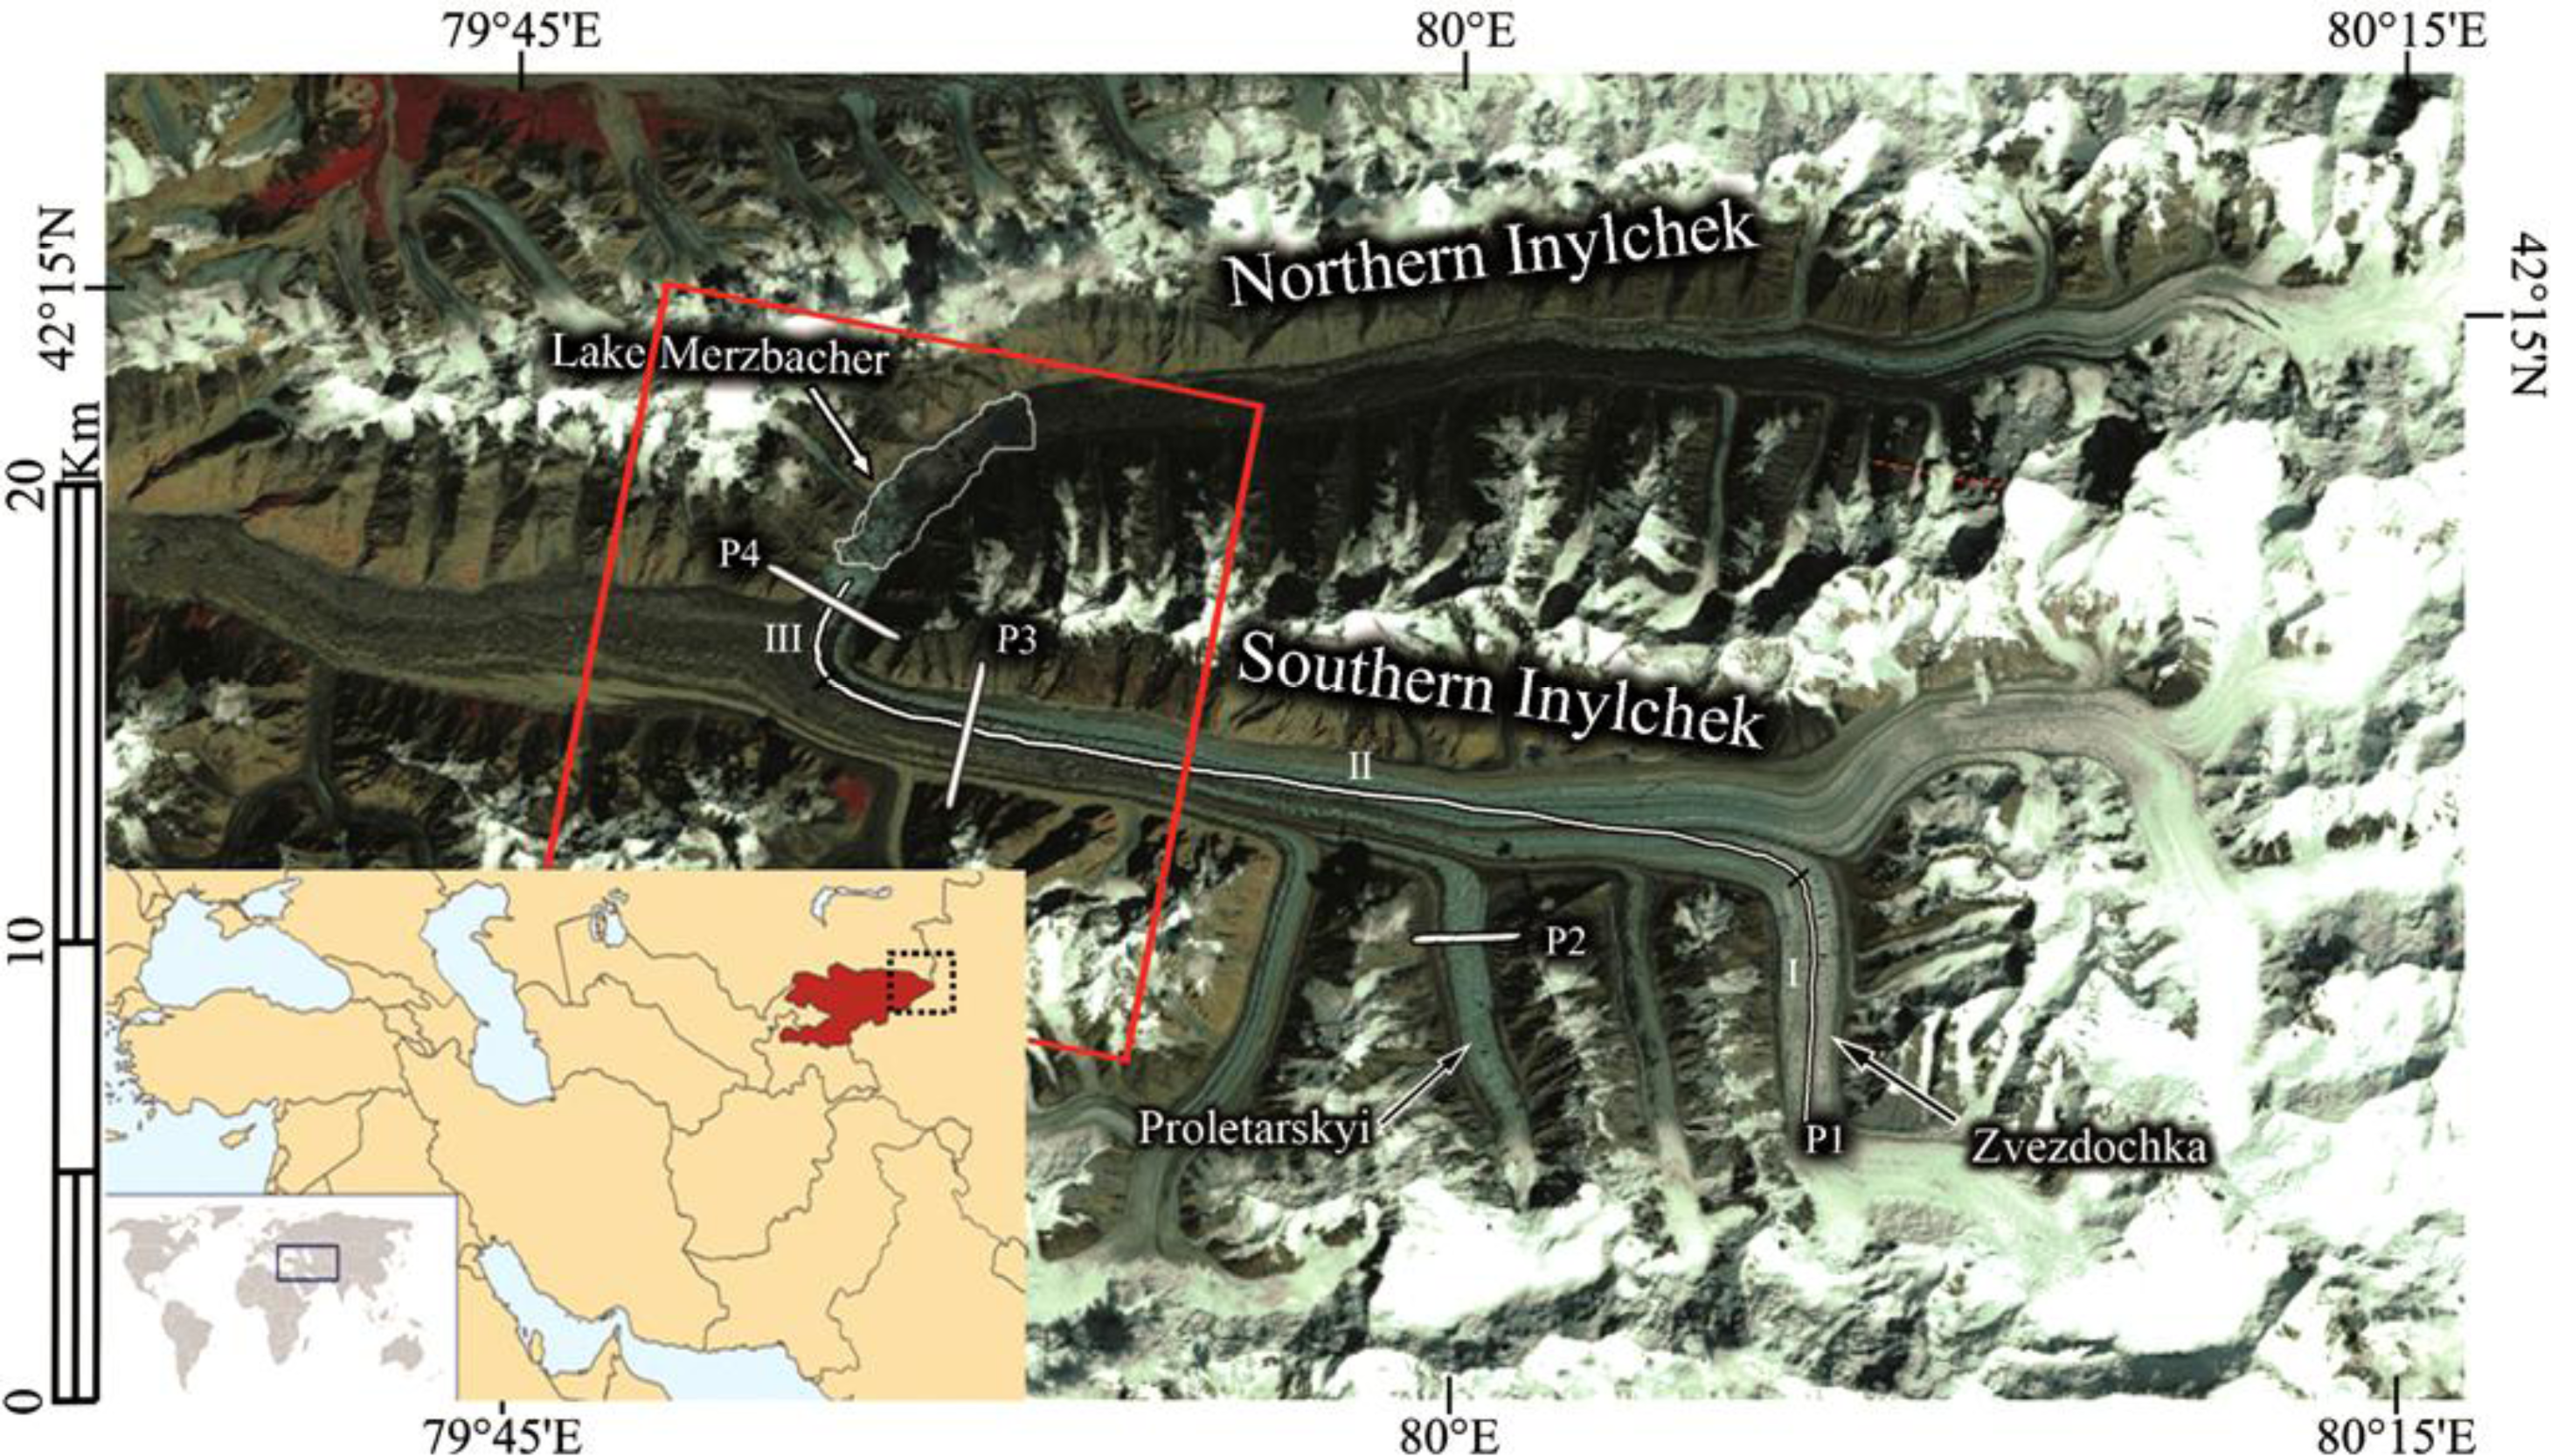
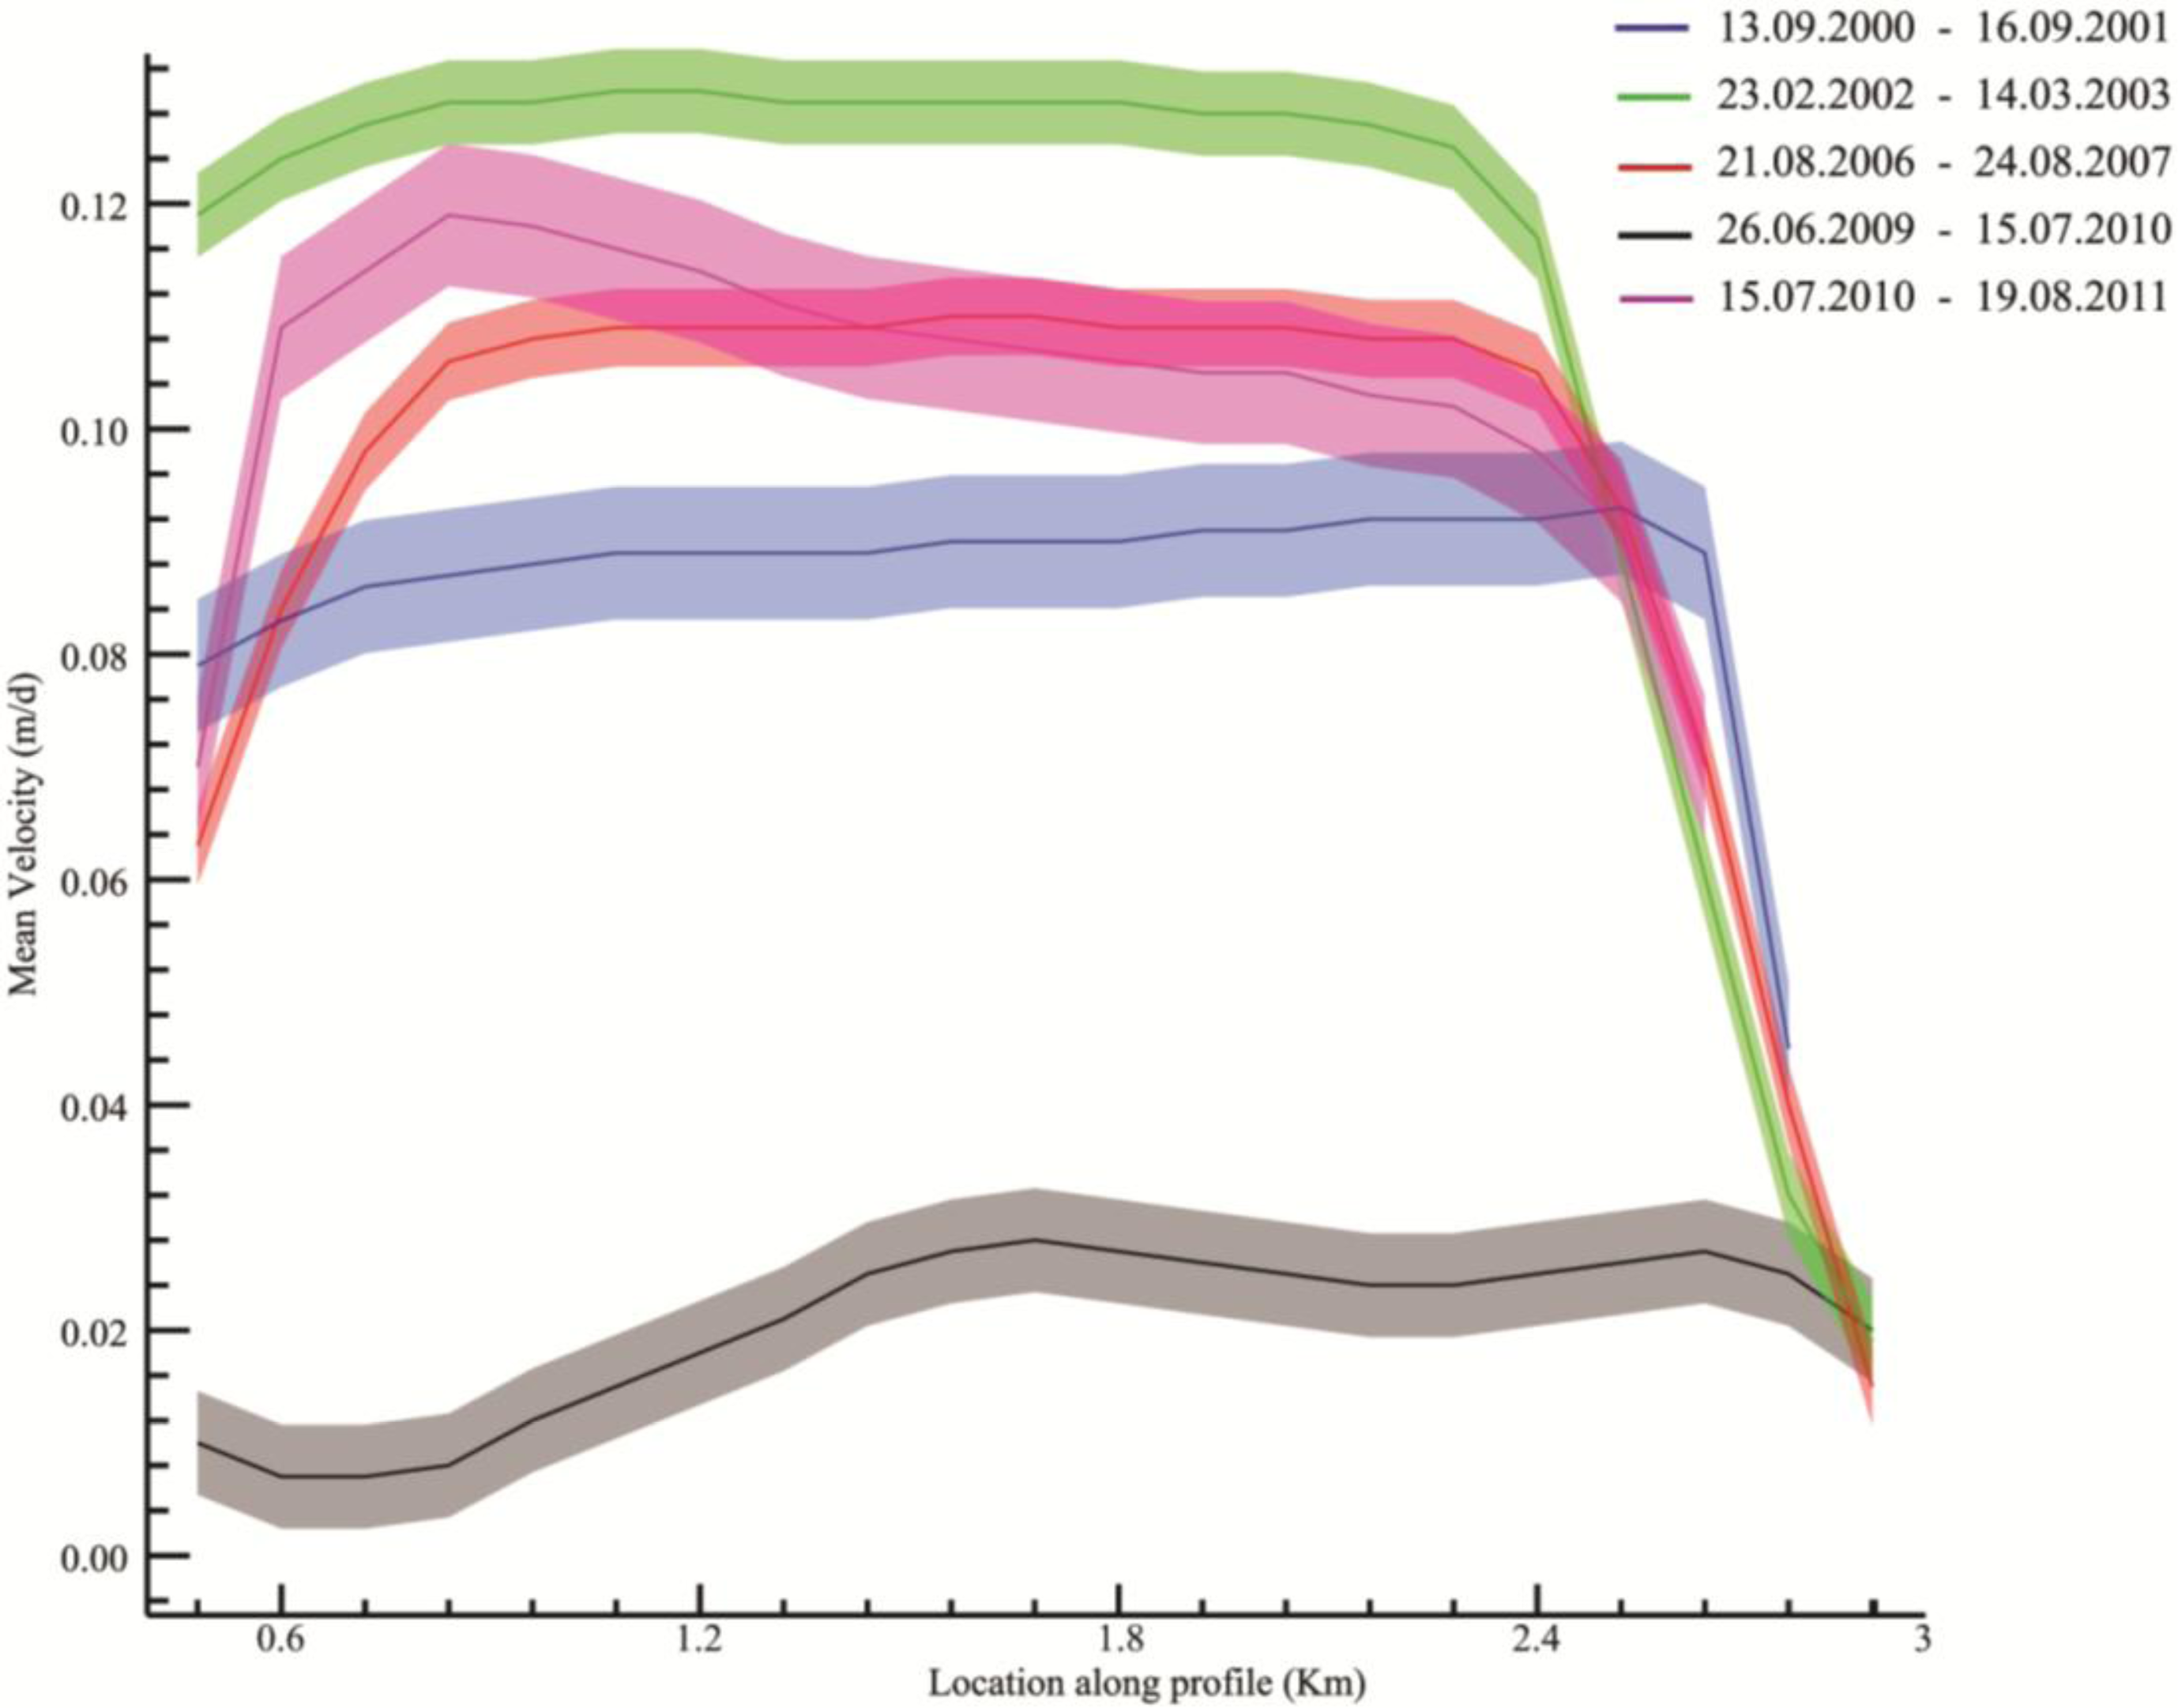
To investigate the surface velocity variations during the time span covered in this study, we firstly focused on absolute displacements along a longitudinal profile of 28 km (P1 in Figure 1) obtained from Landsat images. Based on our observations along profile P1 in Figure 1, we analysed the mean surface velocities in three parts; velocities in the high elevated tributary of the glacier, called Zvezdochka glacier (Part I), velocities along the main trunk of southern Inylchek (Part II), and surface velocities right before the glacier drainage into the Lake Merzbacher (Part III).
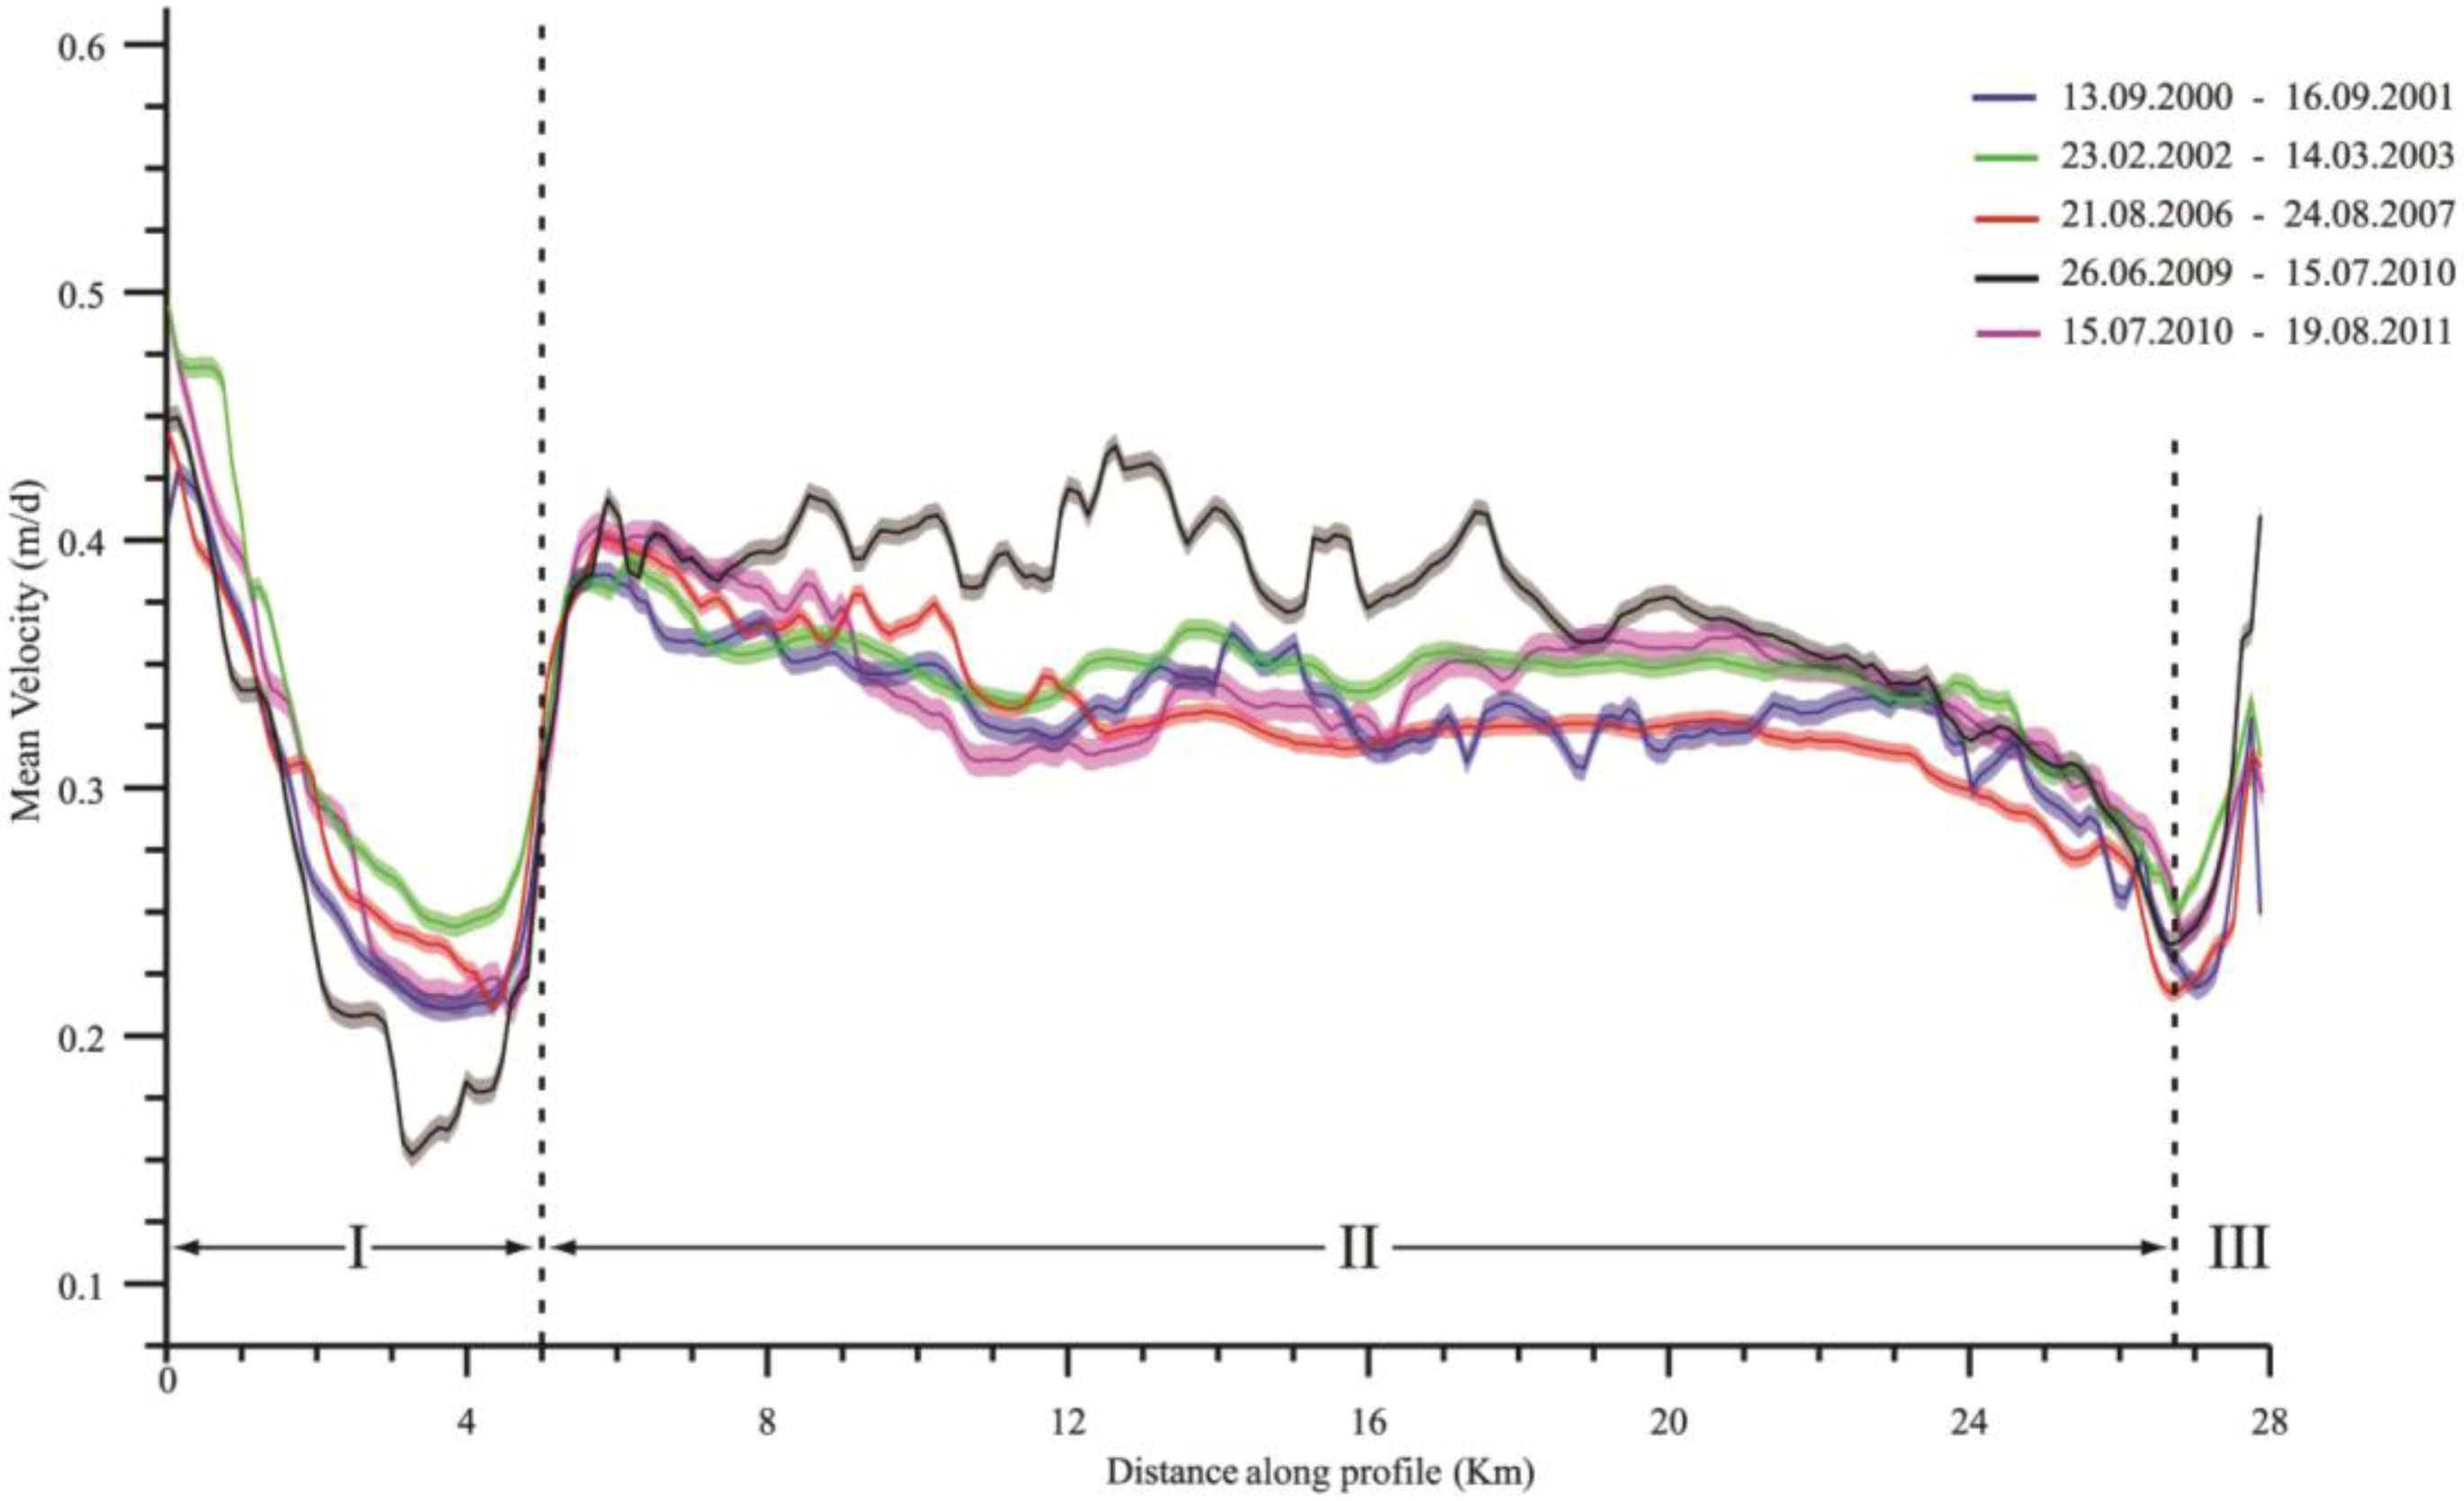
Variations of the mean surface velocities along profile P1 at different time periods obtained from the Landsat data are illustrated in Figure 3. As shown in this figure, the highest mean surface velocity is occurring at the most elevated part of the profile (Part I). The glacier flows northward in this part and its velocity sharply decreases along the profile. It is interesting to note that a quick change in velocity is happening between Part I and Part II, at kilometre 5 of the profile. The surface velocities towards the west slowly decrease downstream along Part II, as it can be expected for a parallel ice flow in the ablation zone. This part of the profile shows some fluctuations in the mean surface velocities with decreasing trend, which terminates before the glacier turns toward the lake (Part III). A significant acceleration is observed in Part III of the profile, reaching to above 40 cm/day during 2009–2010 time period, which is in line with the glacier drainage and glacier calving into the Lake Merzbacher.
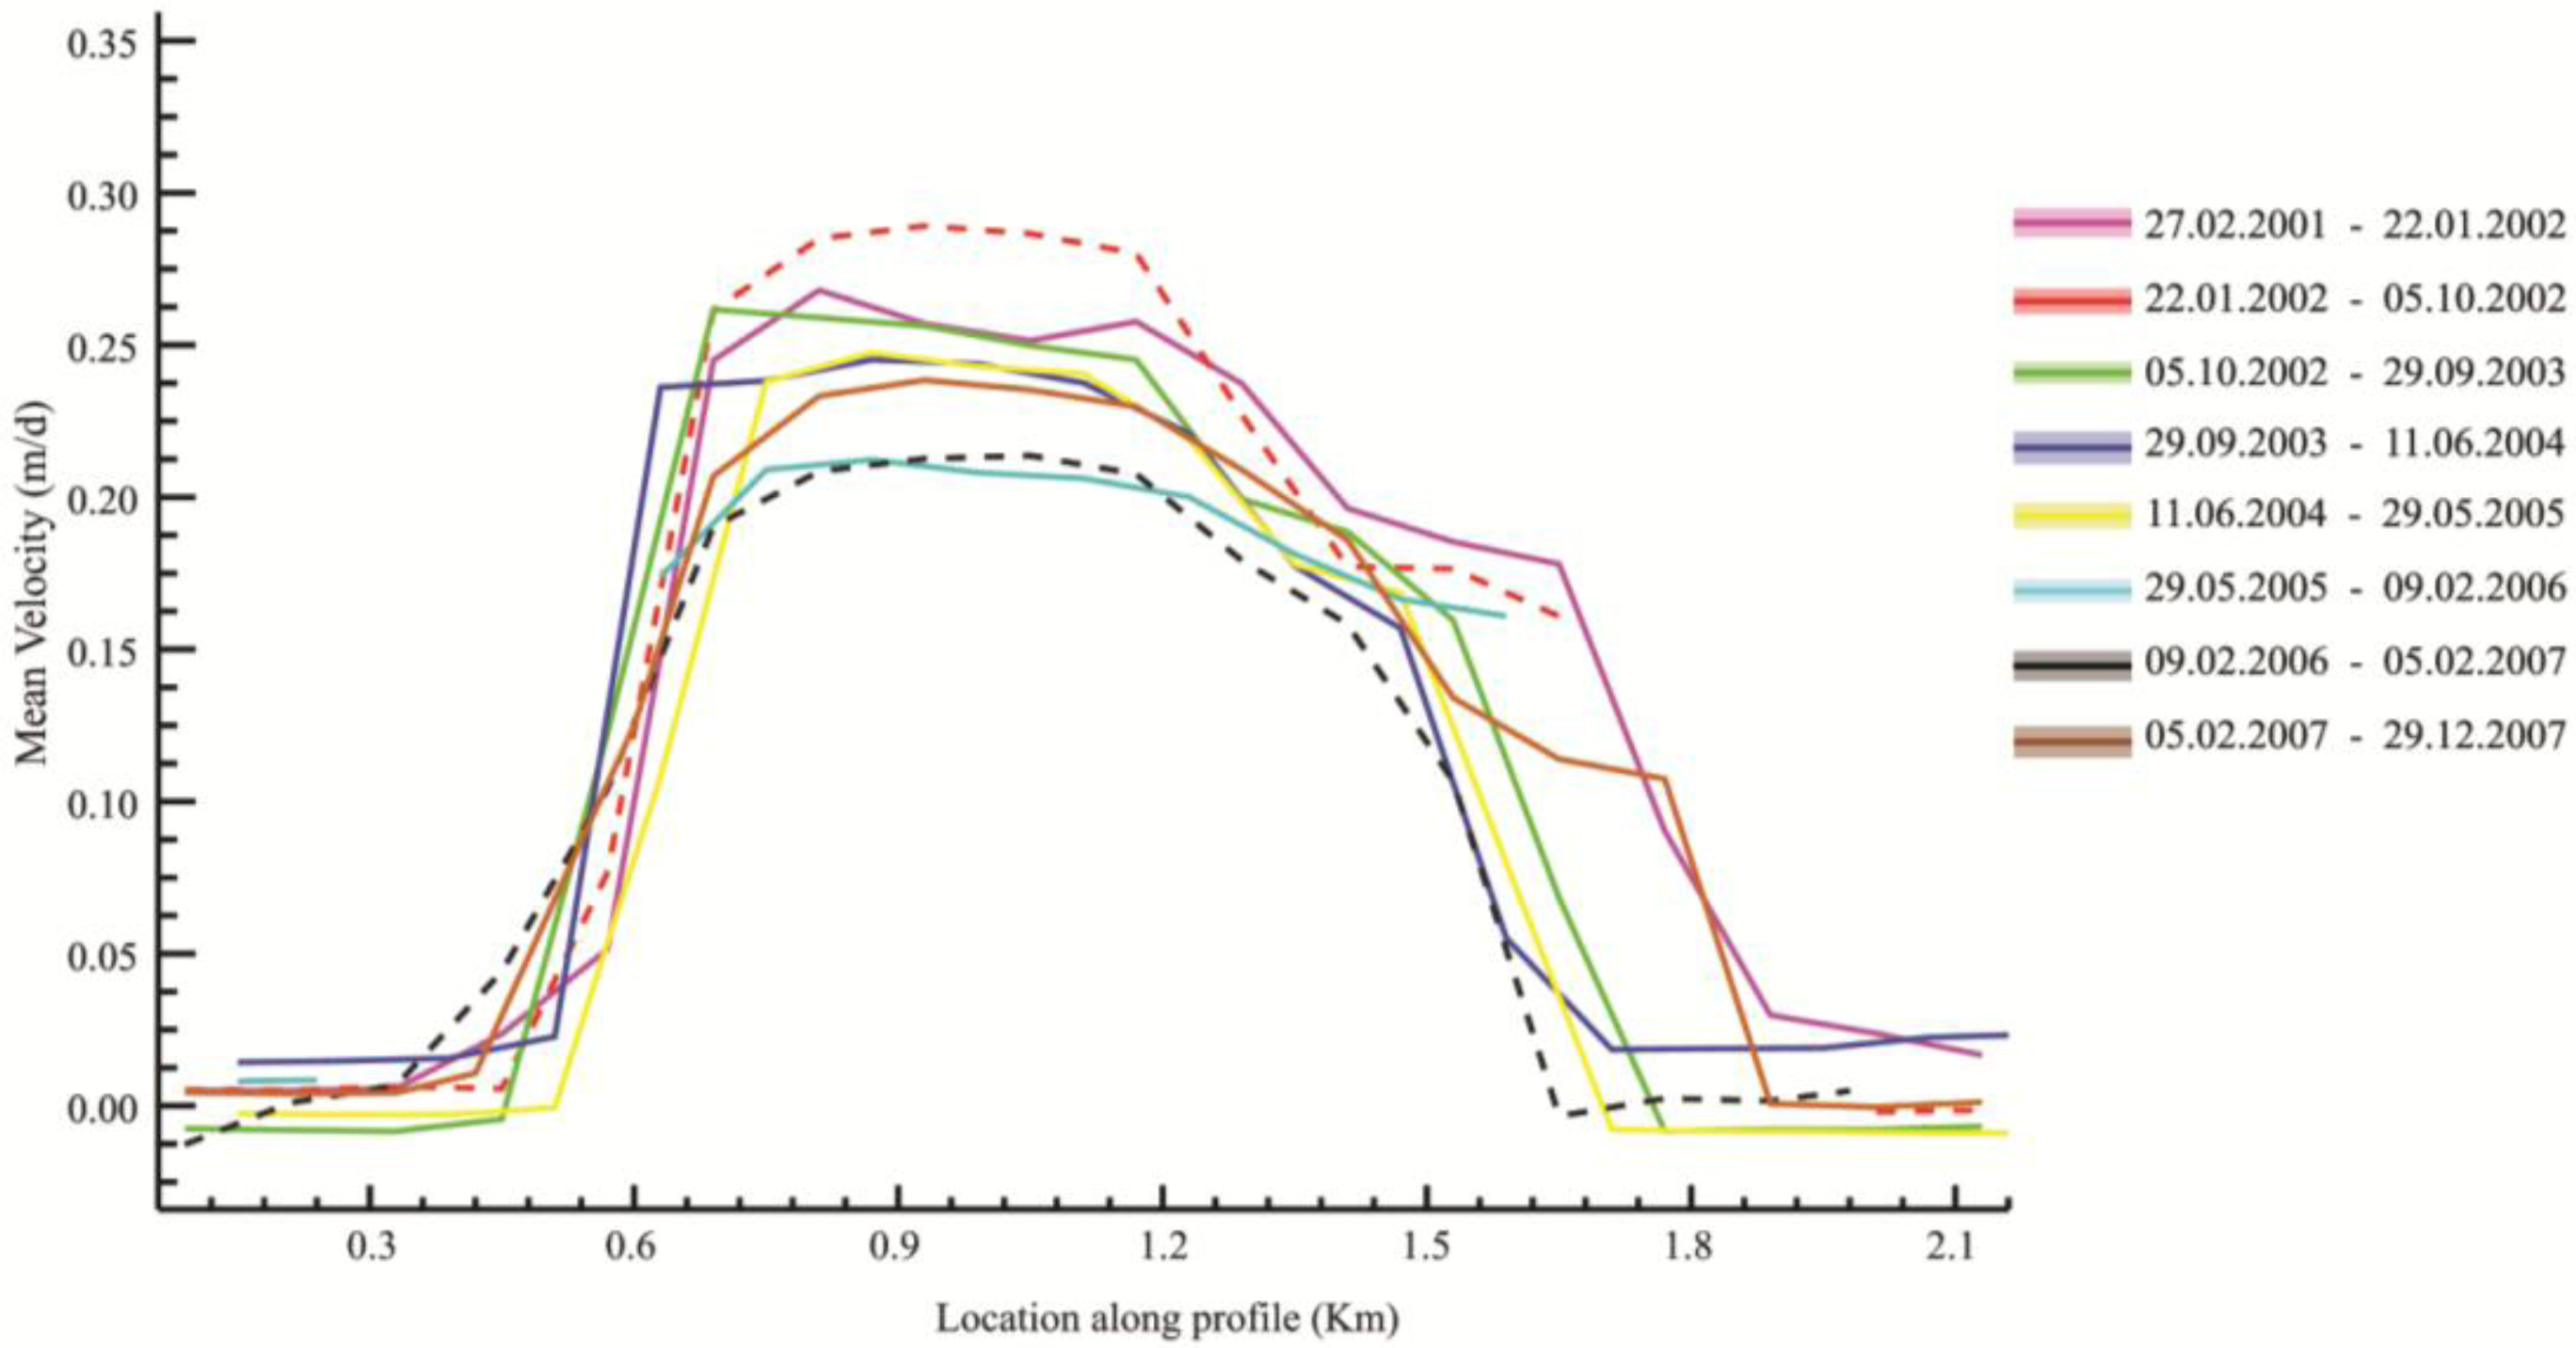
For the ASTER images we focused on surface velocity variations in the ice dam region because the ASTER images do not cover the whole glacier. Temporal variations in the mean surface velocities during the time period between 2001 and 2007 were investigated along two transverse profiles of P3 and P4 as indicated in Figure 1 using the ASTER dataset. According to [35], if X and Y are two independent components of correlation noise in E/W and N/S direction following a normal distribution with standard deviation σ, then the noise in absolute displacements given by X 2 + Y 2 follows a Rayleigh distribution with mean μ = σ π / 2. In other words, an overestimation by a value close to μ (∼4.5 m for ASTER pairs) may bias the observations. Hence, it is more appropriate to compare surface velocities in the N/S and E/W directions separately. Based on the flow characteristics of the glacier flow, the velocity variations toward the west are measured in profile P3, whereas for profile P4 velocity variations towards the north are investigated.
As shown in Figures 4 and 5, the highest mean velocities in both profiles are observed for the image pair 22 January 2002–5 October 2002 (red dashed line in both figures), exceeding 35 cm/d toward the west at the location of P3 and approximately 30 cm/d in the north direction along the profile P4. The glacier also experiences its minimum surface velocities during the 9 February 2006 to 5 February 2007 time period (black dashed line in both figures), with a mean daily velocity of about 27 cm/d toward the west in profile P3 and less than 22 cm/d in the north direction along the profile P4.
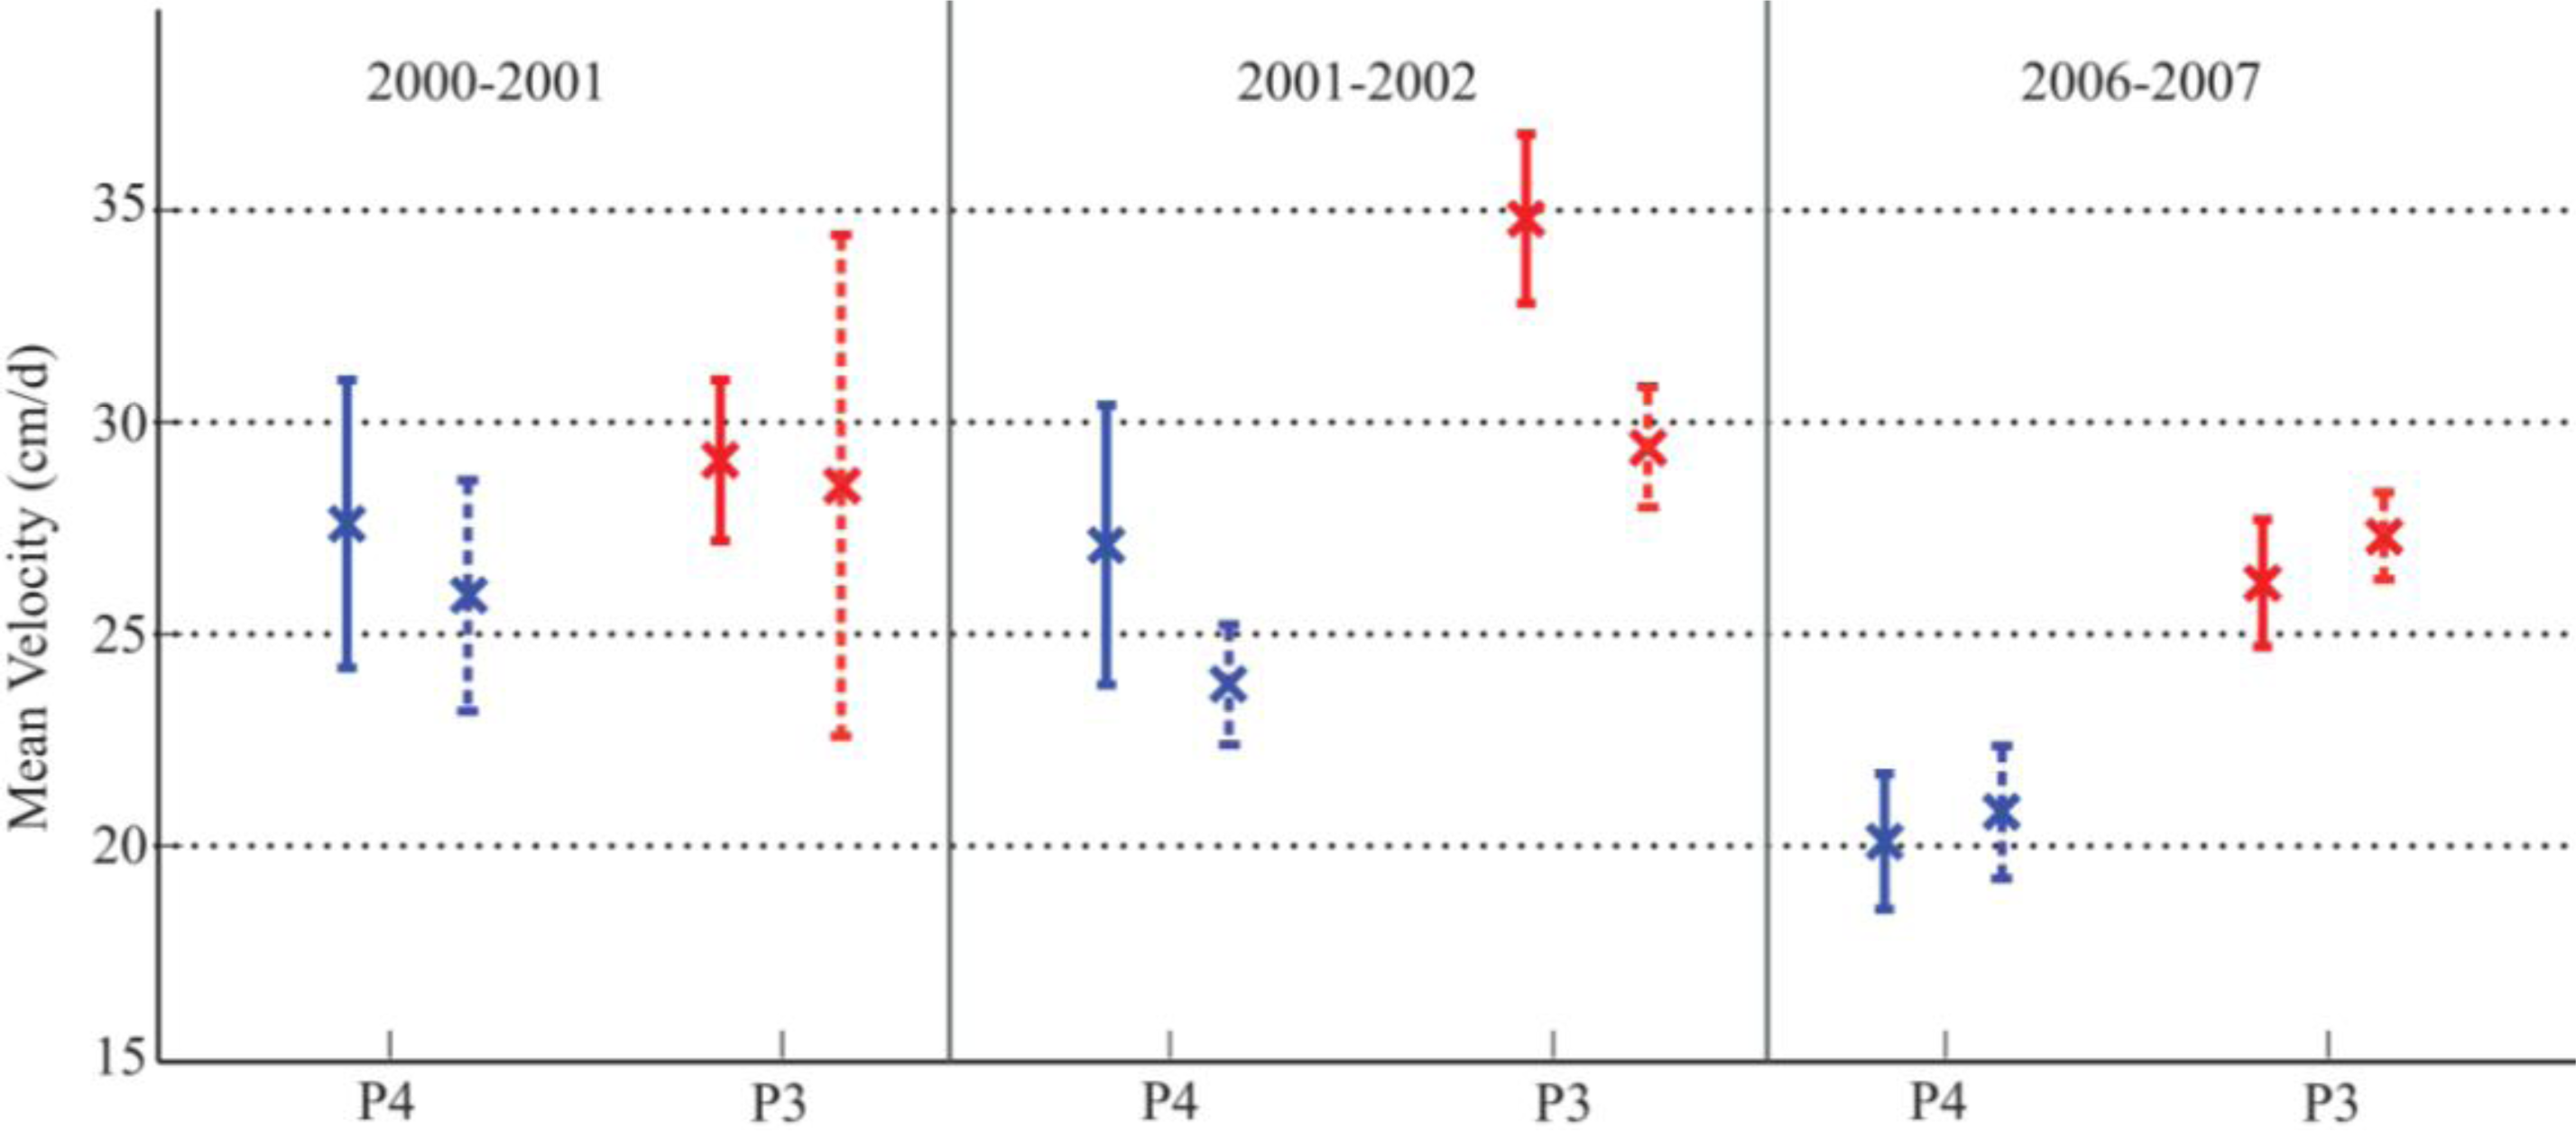
4. Discussion

One of the practical ways to confirm the accuracy of the velocity measurements is to compare the velocities obtained from different types of data over the overlapped time period. For this to be achieved, we compared the velocities obtained over the periods September 2000 to March 2003 and February 2006 to August 2007, in location of profiles P3 and P4. We compared the daily velocities, averaged across the middle part of these two transverse profiles, to evaluate the consistency of Landsat and ASTER results. Velocities obtained by ASTER pairs of February 2001–January 2002, January 2002–October 2002 and February 2006–February 2007 were compared to velocities measured using Landsat pairs of September 2000–September 2001, February 2002–March 2003 and August 2006–August 2007 respectively. The results, as shown in Figure 6, indicate that the differences between the measured velocities are not of significant magnitude. Even though the differences are not great, it is still important to understand the reason behind it. These differences can be explained by the different time periods which are covered by each satellite data. As it was expected, the highest differences emerged over the 2001–2002 time period, where the ASTER data covered less than nine months of 2002 and the Landsat images covered the time period February 2002 to March 2003. The selected ASTER pair did not cover the cold months of 2002, and therefore its mean velocity was higher than obtained by Landsat data over this period of time.
The first striking result to emerge from Figure 3 is that, in spite of the high rate of displacements at the beginning of profile P1, the Zvezdochka glacier (Part I of profile P1) is not the main feeding tributary for southern Inylchek. The high gradient of changes in velocities at this part indicates that a small amount of ice flows into the main stream of Inylchek from Zvezdochka glacier. This finding is comparable to what was stated by Erten et al. (2009) & Erten (2013), on the displacement pattern of Inylchek obtained by processing of SAR images [32,36]. In those studies it was shown that the ice flow in southern Inylchek was blocking the northward tributary of Zvezdochka, However, they did not investigate the flow pattern of the glacier over a long period of time and also other incoming tributaries were not investigated.
Another striking feature of Figure 3 is the sharp decrease of velocities for Part I of profile P1 (Zvezdochka glacier) during the 2009–2010 time-period, as compared to other time intervals. In contrast, Part II which covers the main stream of the glacier, shows a completely opposite behaviour, with an increase in velocities during the 2009–2010 period. This may have been caused by a lot of reasons. For instance, a positive mass balance may lead to an increase in ice flux under equilibrium conditions, and thus may increase horizontal displacement [16,17]. However, there may be other parameters affecting the displacement field of a glacier. To better analyze the complex pattern observed above, we investigated the displacements in a northward tributary of the glacier, called Proletarskyi glacier (Figure 1), along a transverse profile. Figure 7, obtained from analysis of velocity variations along profile P2, shows a considerable decrease in the flow of Proletarskyi glacier towards the north during the 2009–2010 time period, which corresponds very well with the observations for the Zvezdochka glacier during the same time period (Figure 4).
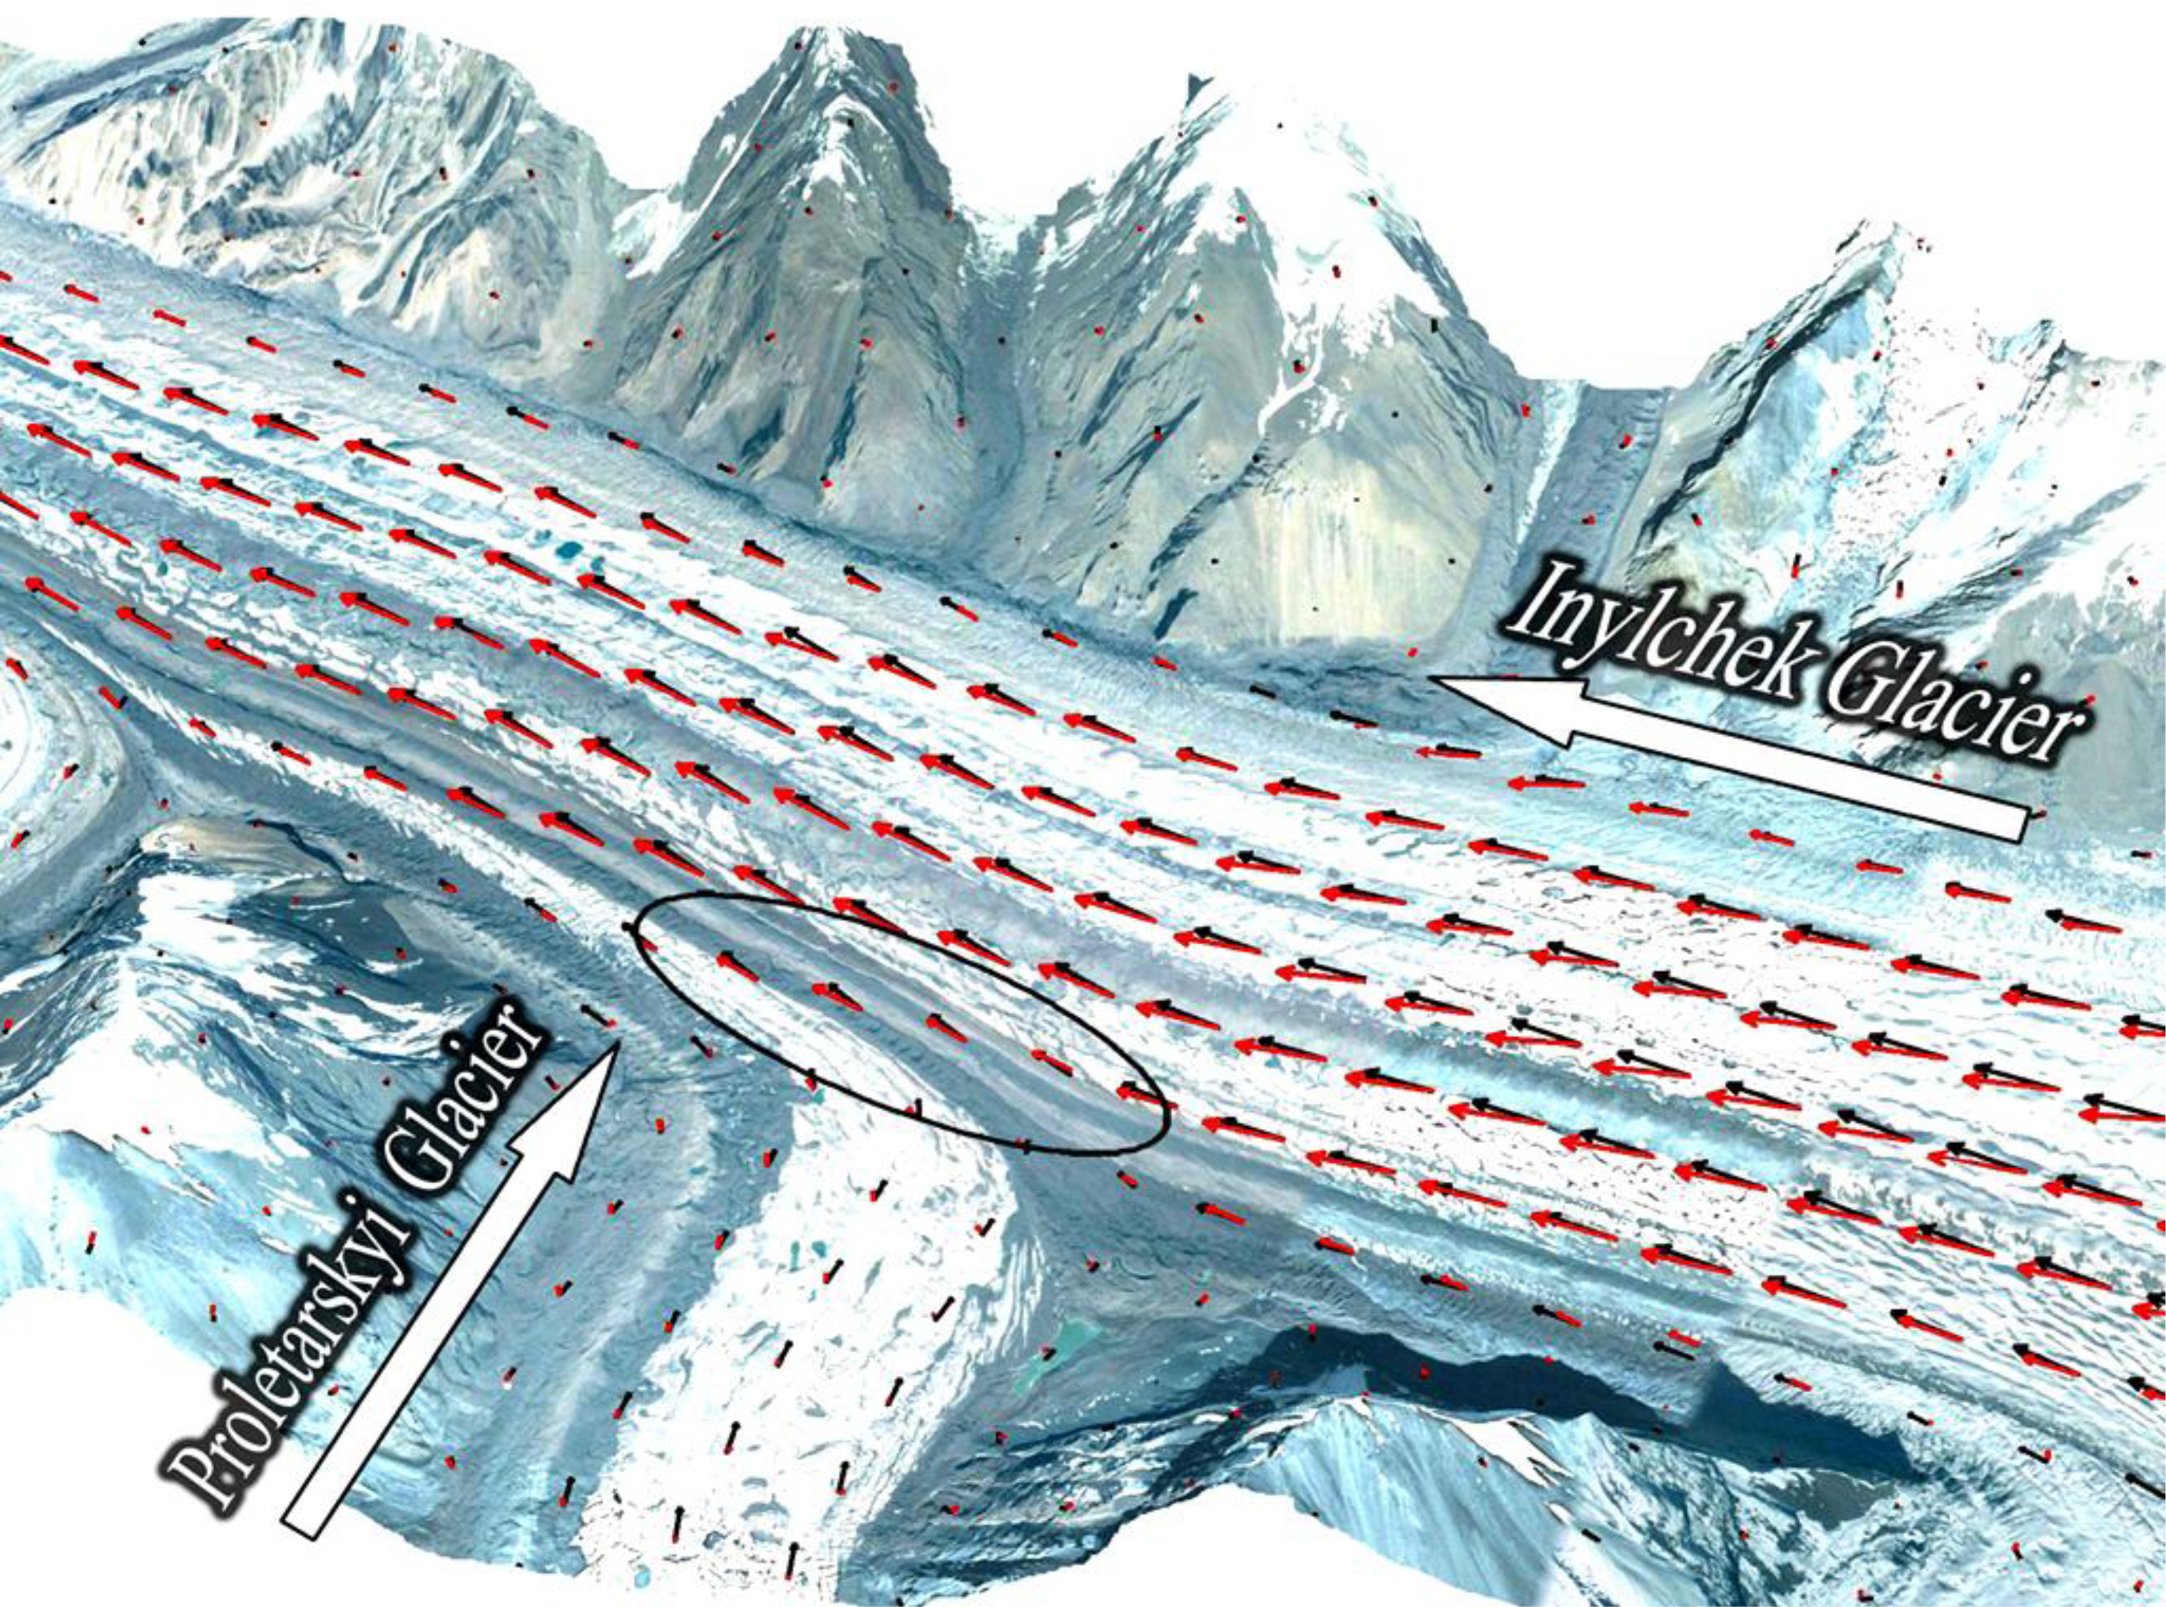
Apparently, an inverse correlation exists between the glacier flow towards the north in the Proletarskyi and Zvezdochka tributaries and the velocity changes in the southern Inylchek. In other words, the reduction in surface velocity at northward tributaries allows the southern Inylchek flow with no obstacle. This is the most probable reason for the observed acceleration during the specific time interval of 2009–2010. This is illustrated in Figure 8 for the displacement patterns of the 2009–2010 and 2010–2011 time periods at the confluence of southern Inylchek and Proletarskyi using Landsat data. It can be clearly seen that the southern Inylchek has moved with higher speed at this part (kilometre 15 of profile P1), due to less activity of Proletarskyi glacier during 2009–2010 time period (red arrows). In contrast to this, during 2010–2011, the ice flow in the main trunk of southern Inylchek is affected by flow of northward incoming branch, resulting in lower surface velocity and changes in direction of velocity vectors (black arrows in Figure 8).
The effect of the flow of glacier tributaries on the ice mass flow of the main glacier trunk can also be visually identified by the presence of massive medial moraines in the conjunction area of Proletarskyi and southern Inylchek (Figure 8). However, more field investigations and detailed glacial interpretations are still needed to confirm the effects of flow of tributaries on the main glacier flow characteristics.
A major extent of the southern Inylchek glacier flows toward the Lake Merzbacher [1]. Thus, we observe a reduction in the mean velocities before the glacier turns toward the lake. In contrast, close to the ice dam (Part III of profile P1) a considerable acceleration is observed, which is in accordance with the glacier drainage and glacier calving into the Lake Merzbacher.
As far as ASTER results are concerned, there is a trend of decreasing in surface velocity at the main branch of southern Inylchek during the covered time span of 2001 to 2007 (Figures 4 and 5). In general, there is a direct relation between glacier mass balance and its surface velocity field. Negative (positive) mass balance results in reduced (increased) ice flux under equilibrium condition, in turn decreasing (increasing) horizontal displacement [16,17]. Although, it is not possible to derive an estimate for the magnitude of mass balance using the percentage of velocity changes of the glacier. Furthermore, previous studies have shown that, on a global scale, the glaciers of the Tien Shan are shrinking, resulting in a negative mass balance [11,12]. During the last 60 years, glaciers of the Tien Shan have been reduced up to 14% and it is predicted that this reduction will increase up to 75% for the 21st century [2]. Regarding this situation, therefore, negative mass balance could be a major factor, if not the only one, causing the observed deceleration of the velocity field of the Inylchek glacier near its western end. However, the quantitative relationship between the percent of velocity reduction and the magnitude of negative mass balance is not investigated. It is recommended to continue ongoing monitoring in this region using existing and future optical and radar imagery to gain an improved understanding of the glacial parameters that control the dynamics of the glacier.

5. Conclusion

The study of mountain glaciers has benefited greatly from the use of satellite remote sensing. In particular, optical remote sensing has been proved to be a reliable tool for the investigation of the kinematics of glaciers. The present study was designed to investigate the temporal and spatial kinematics of the Inylchek glacier in Kyrgyzstan, over the period of 2001 to 2011. We presented a detailed map for the kinematics of the Inylchek glacier and its temporal changes in surface velocity. A set of Landsat images, acquired between 2000 and 2011, and ASTER images covering the time period between 2001 and 2007, were analyzed using a cross-correlation method in the frequency domain. Cross-correlation analysis of optically sensed images was found suitable, in particular, for fast moving glaciers, where the InSAR approaches often fail due to decorrelation of the phase signal. These optical satellite images provided us with an excellent opportunity to study the kinematics pattern of the entire glacier, especially inaccessible areas of accumulation zone, and interaction between the glacier and tributaries. From the analysis of velocity field, it was revealed that there was a fast moving region at the Zvezdochka glacier, flowing up to a rate of about 0.5 m/day. Although noticeable decrease in surface velocity of this tributary suggests that this ice stream does not seem to be the dominant feeding tributary for the Inylchek glacier. Time series analysis of optical data also revealed some annual variations in the mean surface velocity of the southern Inylchek during 2000–2011 time period. To explore the possible reasons for these fluctuations, velocity changes at confluent glaciers were investigated. Our findings suggest an opposite trend between periods of the northward glacial flow in tributary glaciers, Proletarskyi and Zvezdochka, and the rate of westward motion observed for the main stream of the southern Inylchek.

Acknowledgments

This work was supported by Initiative and Networking Fund of the Helmholtz Association in the frame of Helmholtz Alliance “Remote Sensing and Earth System Dynamics” and the German Federal Ministry of Research and Technology (BMBF) within the framework of PROGRESS (Potsdam Research Cluster for Georisk Analysis, Environmental Change and Sustainability). The authors would like to thank 3 anonymous reviewers for their valuable comments and suggestions which helped to enhance the quality of this paper.

Author Contributions

Mohamad Nobakht and Mahdi Motagh made the image processing and prepared the manuscript. Sigrid Roessner, Hans-Ulrich Wetzel and Hermann Kaufmann contributed to the discussion.

Conflicts of Interest

The authors declare no conflict of interest.

References

  1. Mayer, C.; Lambrecht, A.; Hagg, W.; Helm, A.; Scharrer, K. Post drainage ice dam response at Lake Merzbacher, Inylchek Glacier, Kyrgyzstan. Geograf. Ann.: Ser. A Phys. Geogr 2008, 90, 87–96. [Google Scholar]
  2. Kutuzov, S.; Shahgedanova, M. Glacier retreat and climatic variability in the eastern Terskey–Alatoo, inner Tien Shan between the middle of the 19th century and beginning of the 21st century. Glob. Planet. Chang 2009, 69, 59–70. [Google Scholar]
  3. Aizen, V.; Aizen, E.; Kuzmichonok, V. Glaciers and hydrological changes in the Tien Shan: Simulation and prediction. Environ. Res. Lett 2007, 2. [Google Scholar] [CrossRef]
  4. Shen, Y.; Wang, S.; Wang, G.; Shao, C.; Mao, H. Response of glacier flash flood to global warming in Tarim River Basin. Adv. Clim. Chang. Res 2006, 2, 32–35. [Google Scholar]
  5. Narama, C.; Duishonakunov, M.; Kääb, A.; Daiyrov, M.; Abdrakhmatov, K. The 24 July 2008 outburst flood at the western Zyndan glacier lake and recent regional changes in glacier lakes of the Teskey Ala-Too range, Tien Shan, Kyrgyzstan. Nat. Hazards Earth Syst. Sci 2010, 10, 647–659. [Google Scholar]
  6. Aizen, V.B.; Kuzmichenok, V.A.; Surazakov, A.B.; Aizen, E.M. Glacier changes in the central and northern Tien Shan during the last 140 years based on surface and remote-sensing data. Ann. Glaciol 2006, 43, 202–213. [Google Scholar]
  7. Wetzel, H.U.; Reigber, A.; Richter, A.; Michajljow, W.N. Gletschermonitoring und gletscherseebruche am Inyltschik (Zentraler Tienshan)—Interpretation mit optischen und radarsatelliten. DGPF Tagungsband 2005, 14, 341–350. [Google Scholar]
  8. Hagg, W.; Mayer, C.; Lambrecht, A.; Helm, A. Sub debris melt rates on southern Inylchek Glacier, central Tian Shan. Geograf. Ann.: Ser. A Phys. Geogr 2008, 90, 55–63. [Google Scholar]
  9. Häusler, H.; Scheibz, J.; Leber, D.; Kopecny, A.; Echtler, H.; Wetzel, H.U.; Moldobekov, B. Results from the 2009 geoscientific expedition to the Inylchek Glacier, Central Tien Shan (Kyrgyzstan). Austrian J. Earth Sci 2011, 104, 47–57. [Google Scholar]
  10. Jacob, T.; Wahr, J.; Pfeffer, W.T.; Swenson, S. Recent contributions of glaciers and ice caps to sea level rise. Nature 2012, 482, 514–518. [Google Scholar]
  11. Sorg, A.; Bolch, T.; Stoffel, M.; Solomina, O.; Beniston, M. Climate change impacts on glaciers and runoff in Tien Shan (Central Asia). Nat. Clim. Chang 2012, 2, 725–731. [Google Scholar]
  12. Gardner, A.S.; Moholdt, G.; Cogley, J.G.; Wouters, B.; Arendt, A.A.; Wahr, J.; Berthier, E.; Hock, R.; Pfeffer, W.T.; Kaser, G. A reconciled estimate of glacier contributions to sea level rise: 2003 to 2009. Science 2013, 340, 852–857. [Google Scholar]
  13. Narama, C.; Kääb, A.; Duishonakunov, M.; Abdrakhmatov, K. Spatial variability of recent glacier area changes in the Tien Shan Mountains, Central Asia, using Corona (∼1970), Landsat (∼2000), and ALOS (∼2007) satellite data. Glob. Planet. Chang 2010, 71, 42–54. [Google Scholar]
  14. Bolch, T. Climate change and glacier retreat in northern Tien Shan (Kazakhstan/Kyrgyzstan) using remote sensing data. Glob. Planet. Chang 2007, 56, 1–12. [Google Scholar]
  15. Pieczonka, T.; Bolch, T.; Wei, J.; Liu, S. Heterogeneous mass loss of glaciers in the Aksu-Tarim Catchment (Central Tien Shan) revealed by 1976 KH-9 Hexagon and 2009 SPOT-5 stereo imagery. Remote Sens. Environ 2013, 130, 233–244. [Google Scholar] [Green Version]
  16. Span, N.; Kuhn, M. Simulating annual glacier flow with a linear reservoir model. J. Geophys. Res 2003, 108. [Google Scholar] [CrossRef]
  17. Heid, T.; Kääb, A. Repeat optical satellite images reveal widespread and long term decrease in land-terminating glacier speeds. Cryosphere 2012, 6, 467–478. [Google Scholar]
  18. Bamber, J.; Hardy, R.; Joughin, I. An analysis of balance velocities over the Greenland ice sheet and comparison with synthetic aperture radar interferometry. J. Glaciol 2000, 46, 67–74. [Google Scholar]
  19. Kargel, J.S.; Abrams, M.J.; Bishop, M.P.; Bush, A.; Hamilton, G.; Jiskoot, H.; Kaab, A.; Kieffer, H.H.; Lee, E.M.; Paul, F. Multispectral imaging contributions to global land ice measurements from space. Remote Sens. Environ 2005, 99, 187–219. [Google Scholar]
  20. Bindschadler, R. Monitoring ice sheet behavior from space. Rev. Geophys 1998, 36, 79–104. [Google Scholar]
  21. Scherler, D.; Leprince, S.; Strecker, M.R. Glacier-surface velocities in alpine terrain from optical satellite imagery—Accuracy improvement and quality assessment. Remote Sens. Environ 2008, 112, 3806–3819. [Google Scholar]
  22. Narama, C.; Shimamura, Y.; Nakayama, D.; Abdrakhmatov, K. Recent changes of glacier coverage in the western Terskey-Alatoo range, Kyrgyz Republic, using Corona and Landsat. Ann. Glaciol 2006, 43, 223–229. [Google Scholar]
  23. Leprince, S.; Berthier, E.; Ayoub, F.; Delacourt, C.; Avouac, J.P. Monitoring earth surface dynamics with optical imagery. EOS Trans 2008, 89, 1–2. [Google Scholar]
  24. Leprince, S.; Barbot, S.; Ayoub, F.; Avouac, J.P. Automatic and precise orthorectification, coregistration, and subpixel correlation of satellite images, application to ground deformation measurements. IEEE Trans. Geosci. Remote Sens 2007, 45, 1529–1558. [Google Scholar]
  25. Rodriguez, E.; Morris, C.S.; Belz, J.E. A global assessment of the SRTM performance. Photogramm. Eng. Remote Sens 2006, 72, 249–260. [Google Scholar]
  26. Forkuor, G.; Maathuis, B. Comparison of SRTM and ASTER Derived Digital Elevation Models over Two Regions in Ghana—Implications for Hydrological and Environmental Modeling. In Studies on Environmental and Applied Geomorphology; InTech: Rijeka, Croatia, 2012; pp. 219–240. [Google Scholar]
  27. Nikolakopoulos, K.G.; Kamaratakis, E.K.; Chrysoulakis, N. SRTM vs. ASTER elevation products. Comparison for two regions in Crete, Greece. Int. J. Remote Sens 2006, 27, 4819–4838. [Google Scholar]
  28. Berry, P.; Garlick, J.; Smith, R. Near-global validation of the SRTM DEM using satellite radar altimetry. Remote Sens. Environ 2007, 106, 17–27. [Google Scholar]
  29. Passini, R.; Jacobsen, K. Accuracy Analysis of SRTM Height Models. Proceedings of 2007 American Society for Photogrammetry and Remote Sensing Annual Conference, Tampa, FL, USA, 7–11 May 2007; pp. 25–29.
  30. Van Puymbroeck, N.; Michel, R.; Binet, R.; Avouac, J.P.; Taboury, J. Measuring earthquakes from optical satellite images. Appl. Opt 2000, 39, 3486–3494. [Google Scholar]
  31. Foroosh, H.; Zerubia, J.B.; Berthod, M. Extension of phase correlation to subpixel registration. IEEE Trans. Image Process 2002, 11, 188–200. [Google Scholar]
  32. Erten, E. Glacier velocity estimation by means of a polarimetric similarity measure. IEEE Trans. Geosci. Remote Sens 2013, 51, 3319–3327. [Google Scholar]
  33. Berthier, E.; Raup, B.; Scambos, T. New velocity map and mass-balance estimate of Mertz Glacier, East Antarctica, derived from Landsat sequential imagery. J. Glaciol 2003, 49, 503–511. [Google Scholar]
  34. Gao, F.; Masek, J.; Wolfe, R.E. Automated registration and orthorectification package for Landsat and Landsat-like data processing. J. Appl. Remote Sens 2009, 3. [Google Scholar] [CrossRef]
  35. Herman, F.; Anderson, B.; Leprince, S. Mountain glacier velocity variation during a retreat/advance cycle quantified using sub-pixel analysis of ASTER images. J. Glaciol 2011, 57, 197–207. [Google Scholar]
  36. Erten, E.; Reigber, A.; Hellwich, O.; Prats, P. Glacier velocity monitoring by maximum likelihood texture tracking. IEEE Trans. Geosci. Remote Sens 2009, 47, 394–405. [Google Scholar]
Figure 1. Geographic position of the Inylchek glacier and Lake Merzbacher in a Landsat image, acquired on 21 August 2006, bands 4,3,2 > RGB. The red rectangle specifies the area covered by ASTER images used in this study. The inset shows the location of the Inylchek glacier in Kyrgyzstan; the red area covers Kyrgyzstan in Central Asia.
Remotesensing 06 00841f1
Figure 2. N/S component of the correlation of Landsat images over the central Inylchek glacier for the period between 21 August 2006 and 24 August 2007 overlaid on a Landsat RGB image. Displacements are positive towards the North. Decorrelation points are depicted in gray.
Remotesensing 06 00841f2
Figure 3. Mean surface velocities (solid lines) and standard deviation of measurements (shaded area), derived from repeat Landsat imagery by cross-correlation analysis along the profile P1 indicated in Figure 1.
Remotesensing 06 00841f3
Figure 4. Mean surface velocities in E/W direction along the profile P3 shown in Figure 1. Velocities are positive towards the east and periods of highest and lowest velocities are indicated by dash lines. The standard deviation of measurements (shaded bar) is presented alongside the time periods for more clarity.
Remotesensing 06 00841f4
Figure 5. Mean surface velocities in N/S direction along the profile P4 shown in Figure 1. Velocities are positive towards the north and periods of highest and lowest velocities are indicated by dash lines. The standard deviation of measurements (shaded bar) is presented alongside the time periods for more clarity.
Remotesensing 06 00841f5
Figure 6. Mean velocities averaged across profile P3 (red) and P4 (blue), utilizing ASTER (solid) and Landsat imagery (dashed). Error bar shows the standard deviation of the measured velocities across the profiles.
Remotesensing 06 00841f6
Figure 7. Mean surface velocities (solid lines) and their uncertainties (shaded area), derived from repeated Landsat imagery by cross-correlation analysis along the profiles P2 indicated in Figure 1.
Remotesensing 06 00841f7
Figure 8. Displacement field at the conjunction area between the southern Inylchek and the Proletarskyi glacier. Red arrows represent the displacement pattern of the glacier in the 2009–2010 period and black arrows are for the 2010–2011 period. Medial moraines are depicted by black oval. The underlying image was acquired by the GeoEye sensor on 7 August 2002.
Remotesensing 06 00841f8
Table 1. Images used in the study of the Inylchek glacier.
Master imageSlave imageSensorSeparation (day)
13 September 200016 September 2001Landsat 7368
27 February 200122 January 2002ASTER329
22 January 20025 October 2002ASTER256
23 February 200214 March 2003Landsat 7384
5 October 200229 September 2003ASTER359
29 September 200311 June 2004ASTER256
11 June 200429 May 2005ASTER352
29 May 20059 February 2006ASTER256
9 February 20065 February 2007ASTER361
21 August 200624 August 2007Landsat 5368
5 February 200729 December 2007ASTER327
26 June 200915 July 2010Landsat 5384
15 July 201019 August 2011Landsat 5400

